


Cuneiform Tablets Micro-Surveying in an Optimized Photogrammetric Configuration


Abstract
1. Introduction
2. Cuneiform Tablets Digital Documentation: Aims and Purposes
2.1. Overall Characterization
2.2. Acquisition and Publication: Limits of the Standard Methodologies
2.2.1. Hand Tracing: Ink on Paper and Vector-Based Techniques
2.2.2. Digital Photography
2.2.3. Flatbed Scanning
2.2.4. RTI/PTM and Portable Light Dome
2.2.5. 3D Modeling: Photogrammetry and Structured Light Scanning
3. Towards the Identification of an Optimized Acquisition System
3.1. USB Microscopes as a New Micro-Photogrammetric Tool
3.2. Initial Experiments
3.3. Benchmark and Evaluation Comparisons
4. USB Microscope Optical Calibration
4.1. Premise
4.2. Optical Model
4.3. Sensor Size
4.4. Result Validation
5. Massive Cuneiform Tablets Digitization
6. Conclusions
Author Contributions
Funding
Institutional Review Board Statement
Informed Consent Statement
Data Availability Statement
Acknowledgments
Conflicts of Interest
References
- Gallo, A.; Mazzupappa, M.; Bruno, F. 3D reconstruction of small sized objects from a sequence of multi-focused images. J. Cult. Herit. 2014, 15, 173–182. [Google Scholar] [CrossRef]
- Hansen, H.N.; Carneiro, K.; Haitjema, H.; De Chiffre, L. Dimensional Micro and Nano Metrology. CIRP Ann. 2006, 55, 721–743. [Google Scholar] [CrossRef]
- Tolksdorf, F.J.; Elburg, R.; Reuter, T. Can 3D scanning of countermarks on Roman coins help to reconstruct the movement of Varus and his legions. J. Archaeol. Sci. Rep. 2017, 11, 400–410. [Google Scholar] [CrossRef]
- Caine, M.; Magen, M. Low Cost Heritage Imaging Techniques Compared. In Proceedings of the Electronic Visualisation and the Arts, London, UK, 11–13 July 2017. [Google Scholar] [CrossRef]
- Bitelli, G.; Girelli, V.A.; Remondino, F.; Vittuari, L. The potential of 3D techniques for cultural heritage object documentation. In Proceedings of the Videometric IX, San Jose, CA, USA, 29 January 2007; Volume 6491. [Google Scholar] [CrossRef]
- Douglass, M.; Lin, S.; Chodoronek, M. The application of 3D photogrammetry for in-field documentation of archaeological features. Adv. Archaeol. Pract. 2015, 3, 136–152. [Google Scholar] [CrossRef]
- Porter, S.T.; Roussel, M.; Soressi, M. A simple photogrammetry rig for the reliable creation of 3D artifact models in the field. Adv. Archaeol. Pract. 2016, 4, 71–86. [Google Scholar] [CrossRef]
- Marziali, S.; Dionisio, G. Photogrammetry and Macro Photography. The Experience of the MUSINT II Project in the 3D Digitization of Small Archaeological Artifacts. Stud. Digit. Herit. 2017, 1, 298–309. [Google Scholar] [CrossRef]
- Lastilla, L.; Ravanelli, R.; Ferrara, S. 3D high-quality modeling of small and complex archaeological inscribed objects: Relevant issues and proposed methodology. Int. J. Adv. Manuf. Technol. 2019, XLII-2/W11, 699–706. [Google Scholar] [CrossRef]
- Antinozzi, S.; Ronchi, D.; Barba, S. Macro and micro photogrammetry for the virtualization of the Orphic Foil (V–IV B.C.) of National Museum of Vibo Valentia. In CONNETTERE un Disegno per Annodare e Tessere—UID, Congress of Unione Italiana per il Disegno; Arena, A., Arena, M., Brandolino, R.G., Colistra, D., Ginex, G., Mediati, D., Nucifora, S., Raffa, P., Eds.; Franco Angeli: Milan, Italy, 2020; pp. 1538–1555. [Google Scholar] [CrossRef]
- Antinozzi, S.; Ronchi, D.; Fiorillo, F.; Barba, S. 3Dino: Configuration for a micro-photogrammetric survey. Applying Dino-Lite microscope for the digitalization of a cuneiform tablet. In Towards a New, Configurable Architecture—Proceedings of the 39th eCAADe Conference; Stojaković, V., Tepavčević, B., Eds.; GRID, Faculty of Technical Sciences: Novi Sad, Serbia, 2021; Volume 2, pp. 211–222. [Google Scholar] [CrossRef]
- Antinozzi, S.; Fiorillo, F. Optimized Configurations for Micro-Photogrammetric Surveying Adaptable to Macro Optics and Digital Microscope. Int. Arch. Photogramm. Remote Sens. Spat. Inf. Sci. 2022, XLVI-2/W1, 25–32. [Google Scholar] [CrossRef]
- Verdiani, G.; Formaglini, P.; Giansanti, F.; Giraudeau, S. Close-Up, Macro and Micro Photogrammetry and Image Perspective: A Comparative Studio on Different Lenses at Work with Small and Medium Size Objects. Comput. Rev. J. 2018, 2, 235–248. [Google Scholar]
- Gajski, D.; Solter, A.; Gasparovic, M. Applications of macro photogrammetry in archaeology. Int. Arch. Photogramm. Remote Sens. Spat. Inf. Sci. 2016, XLI-B5, 263–266. [Google Scholar] [CrossRef]
- Solter, A.; Gajski, D. Project “Towards the Virtual Museum”—Exploring Tools and Methods for 3D Digitalization and Visualization. Opvscvla Archaeol. 2018, 39/40, 117–124. [Google Scholar] [CrossRef]
- Homburg, T.; Zwick, R.; Mara, H.; Bruhn, K.-C. Annotated 3D-Models of Cuneiform Tablets. J. Open Archaeol. Data 2022, 10, 1–8. [Google Scholar] [CrossRef]
- Bogacz, B.; Mara, H. Digital Assyriology—Advances in Visual Cuneiform Analysis. J. Comput. Cult. Herit. 2022, 15, 1–22. [Google Scholar] [CrossRef]
- Rey-López, M.; Vilas, A.; Díaz Redondo, R. A Model for Personalized Learning Through IDTV. In Proceedings of the Adaptive Hypermedia and Adaptive Web-Based Systems, Dublin, Ireland, 21–23 June 2006. [Google Scholar] [CrossRef]
- Mara, H. HeiCuBeDa Hilprecht—Heidelberg Cuneiform Benchmark Dataset for the Hilprecht Collection. heiDATA, V2. [CrossRef]
- Mara, H.; Bogacz, B. Breaking the Code on Broken Tablets: The Learning Challenge for Annotated Cuneiform Script in Normalized 2D and 3D Datasets. In Proceedings of the International Conference on Document Analysis and Recognition, Sydney, Australia, 20–25 September 2019. [Google Scholar] [CrossRef]
- Taylor, J.H. Tablets as Artefacts, Scribes as Artisans. In The Oxford Handbook of Cuneiform Culture; Radner, K., Robson, E., Eds.; Oxford University Press: Oxford, UK, 2012; pp. 4–31. [Google Scholar] [CrossRef]
- Charpin, D. Reading and Writing in Babylon; Harvard University Press: Cambridge, UK, 2010; p. 75. [Google Scholar]
- Streck, M.P. Großes Fach Altorientalistik. Der Umfang des keilschriftlichen Textkorpus. In Altorientalistik im 21. Jahrhundert: Selbstverständnis, Herausforderungen, Ziele; Mitteilungen der Deutschen Orient-Gesellschaft 142; Hilgert, M., Ed.; Druckerei Benedict Press: Schwarzach am Main, Germany, 2010; pp. 35–58. [Google Scholar]
- Walker, C.B.F. Cuneiform; British Museum: London, UK, 1987; p. 40. [Google Scholar]
- Reade, J.E. The manufacture, evaluation and conservation of clay tablets inscribed in cuneiform: Traditional problems and solutions. Iraq 2017, 79, 163–202. [Google Scholar] [CrossRef]
- Owen, D.I. The John Frederick Lewis Collection; Multigrafica: Rome, Italy, 1975; p. 14. [Google Scholar]
- Vandecasteele, C. Deposition of Ammonium chloride on Cuneiform Tablets. In Subartu II, Administrative Documents from Tell Beydar (Seasons 1993–1995); Ismail, F., Sallaberger, W., Talon, P., Van Lerberghe, K., Lebeau, M., Eds.; Brepols: Turhout, Belgium, 1997; pp. 193–194. [Google Scholar]
- Vandecasteele, C.; Van Gool, L.; Van Lerberghe, K.; Van Rompay, J.; Wambacq, P. Digitising Cuneiform Tablets. In Images and Artefacts of the Ancient World; Bowman, A.K., Brady, M., Eds.; British Academy: London, UK, 2005; pp. 31–34. [Google Scholar] [CrossRef]
- Wambacq, P.; Mariën, D. Enhancement of the Quality of Photographs of Tablets Using Digital Techniques. In Subartu II, Administrative Documents from Tell Beydar (Seasons 1993–1995); Ismail, F., Sallaberger, W., Talon, P., Van Lerberghe, K., Lebeau, M., Eds.; Brepols: Turhout, Belgium, 1997; pp. 195–198. [Google Scholar]
- CDLI:wiki. Available online: https://cdli.ox.ac.uk/wiki/doku.php?id=start (accessed on 8 August 2022).
- Langdon, S.H. The Sumerian expression ‘si-ni-tum’ capital, balance carried forward. Babyloniaca 1912, 6, 41–53. [Google Scholar]
- Grégoire, J.-P. Contribution à l’Histoire Sociale, Économique, Politique et Culturelle du Proche-Orient Ancien. Archives Administratives et Inscriptions Cunéiformes de l’Ashmolean Museum et de la Bodleian Collection d’Oxford (AAICAB). I; Les Sources: Paris, France, 1996. [Google Scholar]
- Malzbender, T.; Gelb, D.; Wolters, H.; Zuckerman, B. Enhancement of Shape Perception by Surface Reflectance Transformation. Hewlett-Packard Lab. Tech. Rep. 2000, 38, 1–3. [Google Scholar]
- Malzbender, T.; Gelb, D.; Wolters, H. Polynomial texture maps. In Proceedings of the 28th Annual Conference on Computer Graphics and Interactive Techniques—SIGGRAPH 2001, Los Angeles, CA, USA, 12–17 August 2001. [Google Scholar] [CrossRef]
- Mudge, M.; Malzbender, T.; Schroer, C.; Lum, M. New Reflection Transformation Imaging Methods for Rock Art and Multiple-Viewpoint Display. In Proceedings of the 7th International Symposium on Virtual Reality, Archaeology and Cultural Heritage—VAST2006, Nicosia, Cyprus, 30 October–4 November 2006. [Google Scholar] [CrossRef]
- Luxman, R.; Castro, Y.E.; Chatoux, H.; Nurit, M.; Siatou, A.; Le Goïc, G.; Brambilla, L.; Degrigny, C.; Marzani, F.; Mansouri, A. LightBot: A Multi-Light Position Robotic Acquisition System for Adaptive Capturing of Cultural Heritage Surfaces. J. Imaging 2022, 8, 134. [Google Scholar] [CrossRef]
- Hameeuw, H.; Willems, G. New visualization techniques for cuneiform texts and sealings. Akkadica 2011, 132, 163–178. [Google Scholar]
- George, A.R. The Babylonian Gilgamesh Epic: Introduction, Critical Edition and Cuneiform Texts; Oxford University Press: Oxford, UK, 2003; pp. 272–273. [Google Scholar]
- Atsushi, K.; Sueyasu, H.; Funayama, Y.; Maekawa, T. System for reconstruction of three-dimensional micro objects from multiple photographic images. Comput. Aided Des. 2011, 43, 1045–1055. [Google Scholar] [CrossRef]
- Esmaeili, F.; Ebadi, H. Handy Microscopic Close-Range Videogrammetry. Int. Arch. Photogramm. Remote Sens. Spat. Inf. Sci. 2017, XLII-4-W4, 65–67. [Google Scholar] [CrossRef]
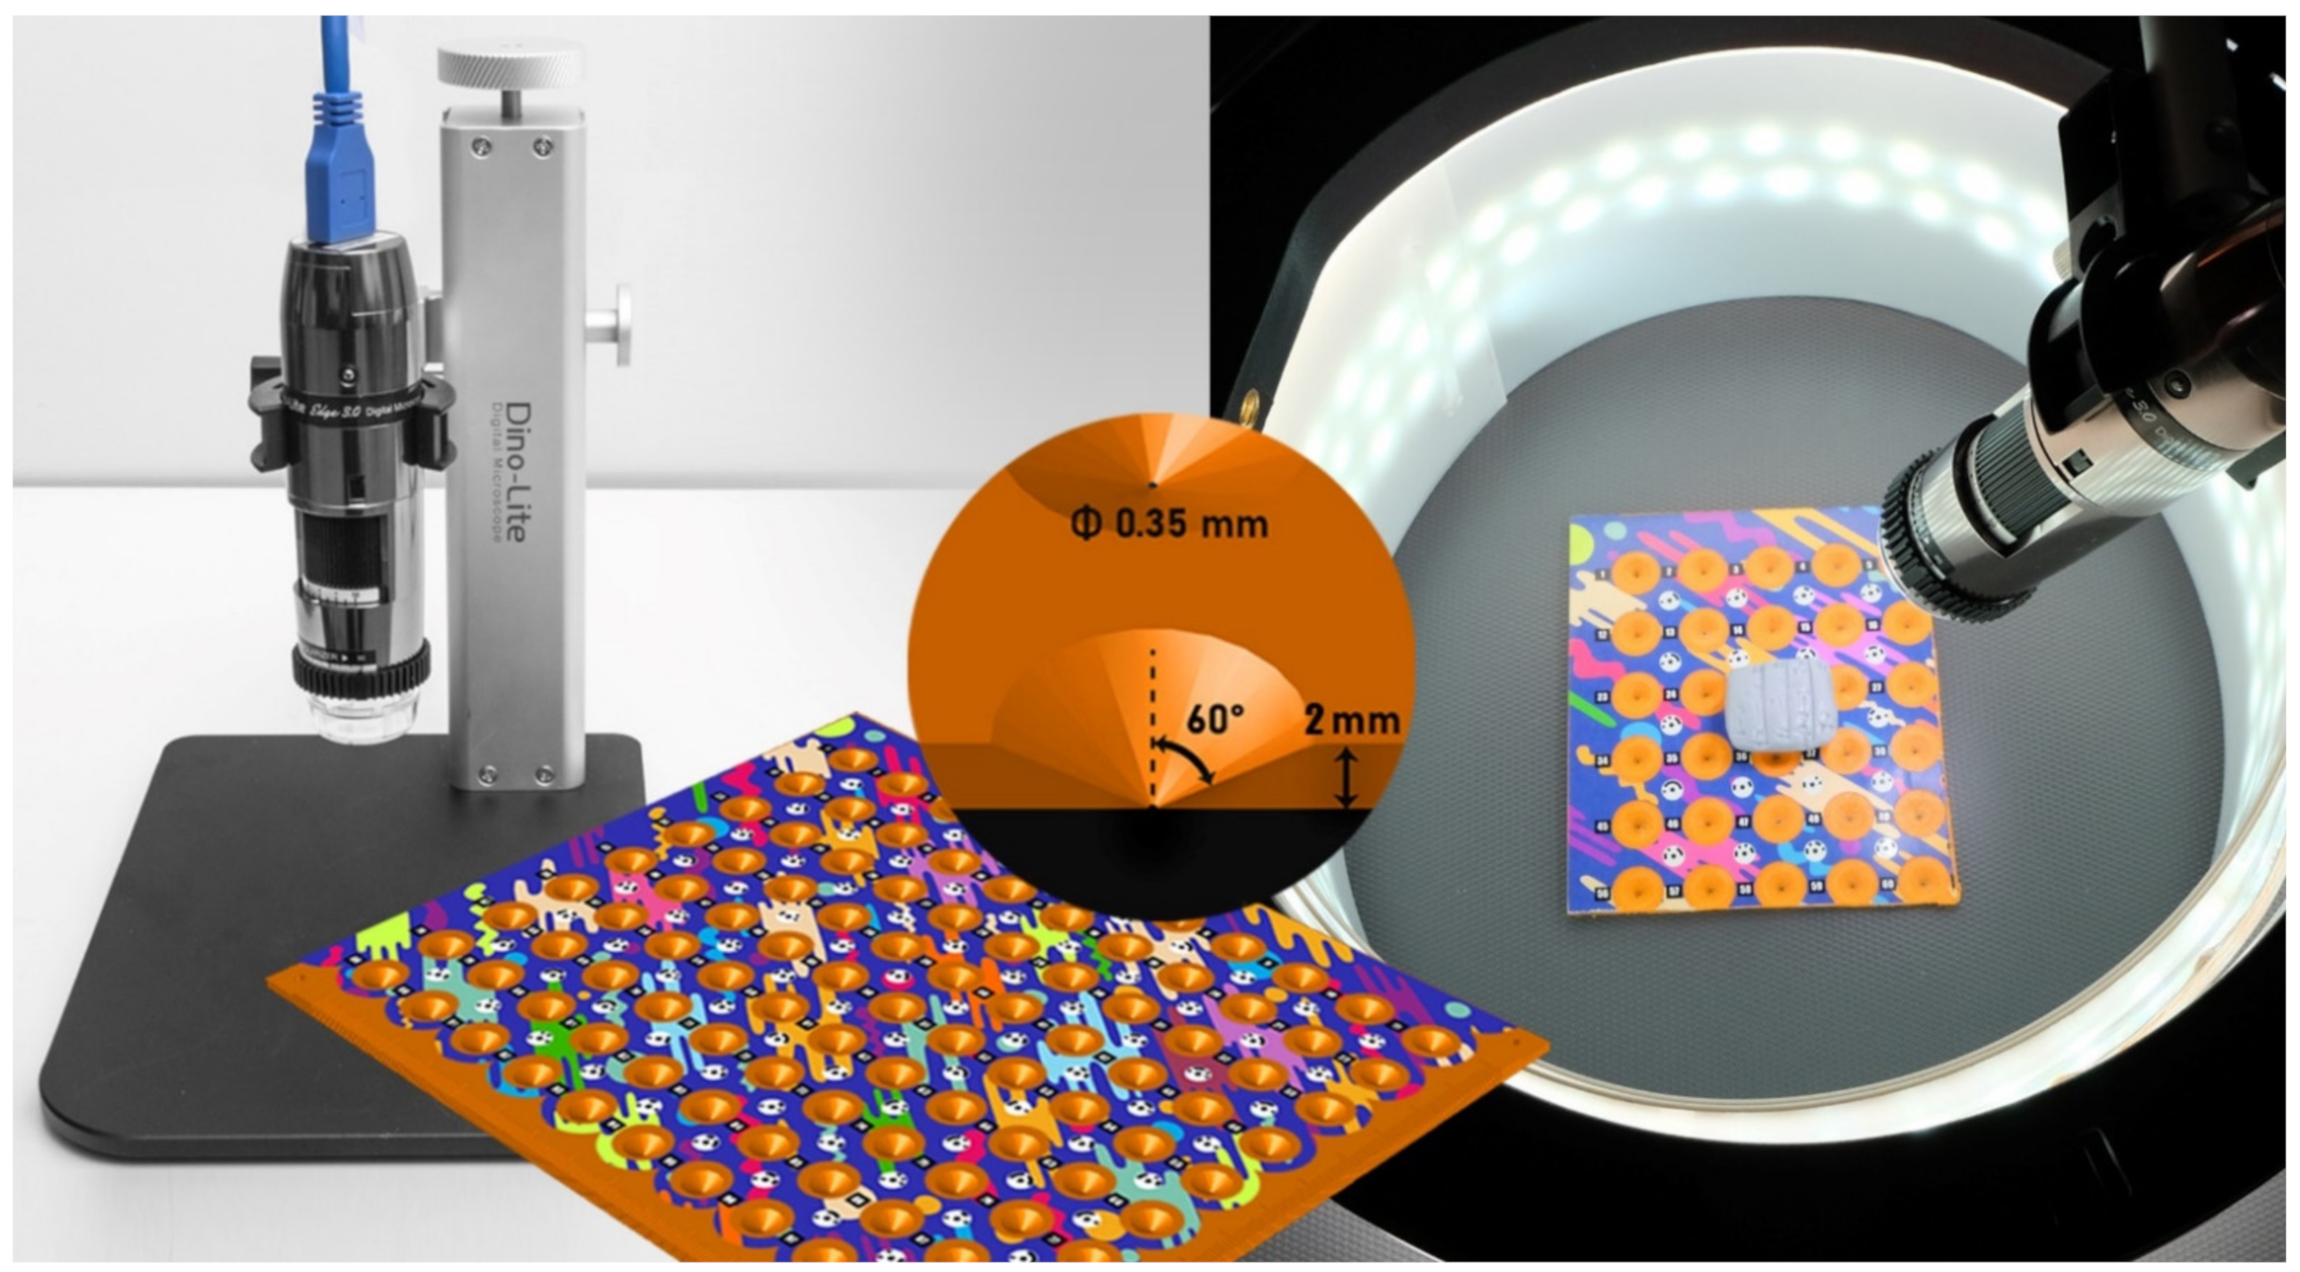
- Dino-Lite RK-06A Stand Technical Data Sheet. Available online: https://www.distrelec.it/Web/Downloads/s3/6b/RK-06A_eng_tds.pdf (accessed on 12 June 2022).
- Sapirstein, P. A high-precision photogrammetric recording system for small artifacts. J. Cult. Herit. 2018, 31, 33–45. [Google Scholar] [CrossRef]
- Luhmann, T.; Robson, S.; Kyle, S.; Harley, I. Close Range Photogrammetry. Principles, Techniques and Applications; Whittles Publishing: Dunbeath, UK, 2006; p. 443. [Google Scholar]
- Digital Microscope. Available online: https://www.academia.edu/42195781/Digital_Microscope (accessed on 12 June 2022).
- Peipe, J.; Tecklenburg, W. Photogrammetric Camera Calibration Software—A Comparison. Int. Arch. Photogramm. Remote Sens. Spat. Inf. Sci. 2006, XXXVI-5, 1255–1258. [Google Scholar]
- The Dino-Lite Premier AM7013MZT. Available online: https://www.dino-lite.com/products_detail.php?index_m1_id=9&index_m2_id=0&index_id=48 (accessed on 12 June 2022).
- Lens Calibration (Using Chessboard Pattern) in Metashape. Available online: https://agisoft.freshdesk.com/support/solutions/articles/31000160059-lens-calibration-using-chessboard-pattern-in-metashape (accessed on 13 June 2022).
- A CMOS Sensor Size Comparison and Format Type. Available online: https://commonlands.com/blogs/technical/cmos-sensor-size (accessed on 15 July 2022).
- Agisoft Metashape User Manual. Available online: https://www.agisoft.com/pdf/metashape-pro_1_8_en.pdf (accessed on 15 July 2022).
- Lavecchia, F.; Guerra, M.G.; Galantucci, L.M. Performance verification of a photogrammetric scanning system for micro-parts using a three-dimensional artifact: Adjustment and calibration. Int. J. Adv. Manuf. Technol. 2018, 96, 4267–4279. [Google Scholar] [CrossRef]
- Clini, P.; Frapiccini, N.; Mengoni, M.; Nespeca, R.; Ruggeri, L. SFM Technique and Focus Stacking for Digital Documentation of Archaeological Artifacts. Int. Arch. Photogramm. Remote Sens. Spat. Inf. Sci. 2016, XLI-B5, 229–236. [Google Scholar] [CrossRef]
- Westoby, M.J.; Brasington, J.; Glasser, N.F.; Hambrey, M.J.; Reynolds, J.M. ‘Structure-from-Motion’ photogrammetry: A low-cost, effective tool for geoscience applications. Geomorphology 2012, 179, 300–314. [Google Scholar] [CrossRef]
- Kontogianni, G.; Chliverou, R.; Koutsoudis, A.; Pavlidis, G.; Georgopoulos, A. Enhancing Close-Up image based 3D Digitisation with Focus Stacking. Int. Arch. Photogramm. Remote Sens. Spat. Inf. Sci. 2017, XLII-2-W5, 421–425. [Google Scholar] [CrossRef]
- Plisson, H.; Zotkina, L.V. From 2D to 3D at macro- and microscopic scale in rock art studies. Digit. Appl. Archaeol. Cult. Herit. 2015, 2, 102–119. [Google Scholar] [CrossRef]
| 1 | The most common and most expensive micro-survey solution is the structured light scanner, which can cost upwards of EUR 30.000 at the highest standards (without taking into account the costs of licenses for data management software). In general, it allows the reaching of accuracies of 0.01 mm and resolutions down to 0.03 mm [https://www.artec3d.com/it/portable-3d-scanners/artec-micro; https://www.einscan.com/handheld-3d-scanner/einscan-pro-hd/; https://www.creaform3d.com/en/portable-3d-scanner-handyscan-3d; https://www.hexagonmi.com/products/structured-light-scanners; https://lmi3d.com/family/line-profile-sensors/]. However, today, various low-cost 3D scanners (from EUR 500) are also available; these are naturally designed for non-professional applications, with correspondingly much poorer accuracy and resolution and for mostly amateur use [https://www.xyzprinting.com/en/product/3d-scanner-2-0; https://it.shop.revopoint3d.com/; https://www.creality3dofficial.eu/collections/scanner-&-engraver-eu; https://scandimension.com/products/sol-3d-scanner; https://matterandform.net/store]. |
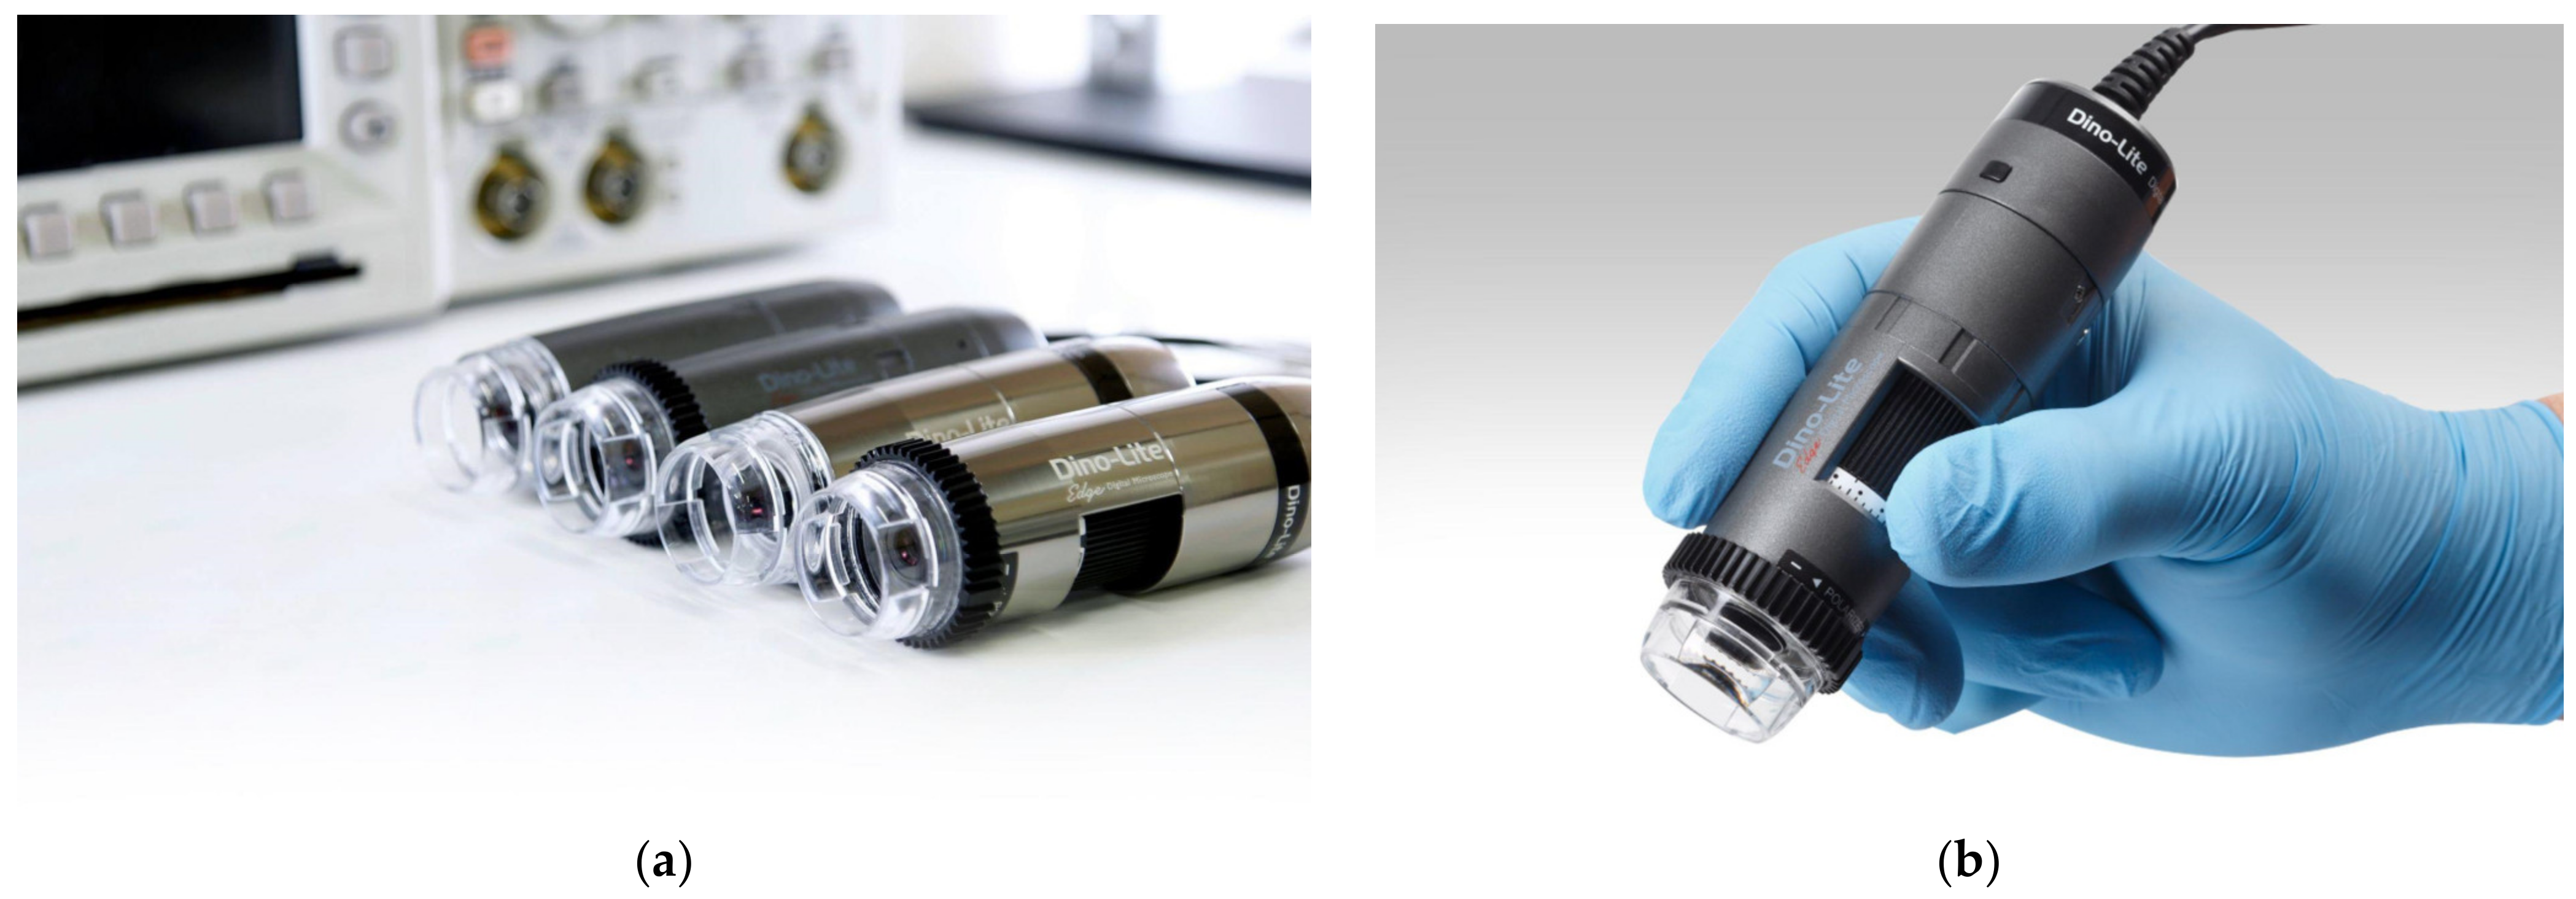
| 2 | As a rough estimate, the price of a Dino-Lite microscope begins at a few hundred euros and varies based on the technical specs (resolution, magnification, LEDs, polarize, etc.). A mid-range one costs approximately EUR 500. In contrast, the price of a set for micro-photogrammetry varies widely based on the technical data (sensor size, resolution, lens quality, accessories for macro photography, etc.). However, the price of a high-level reflex camera+macro lens typically exceeds EUR 3000 (the cost estimation is refereed in Europe). |
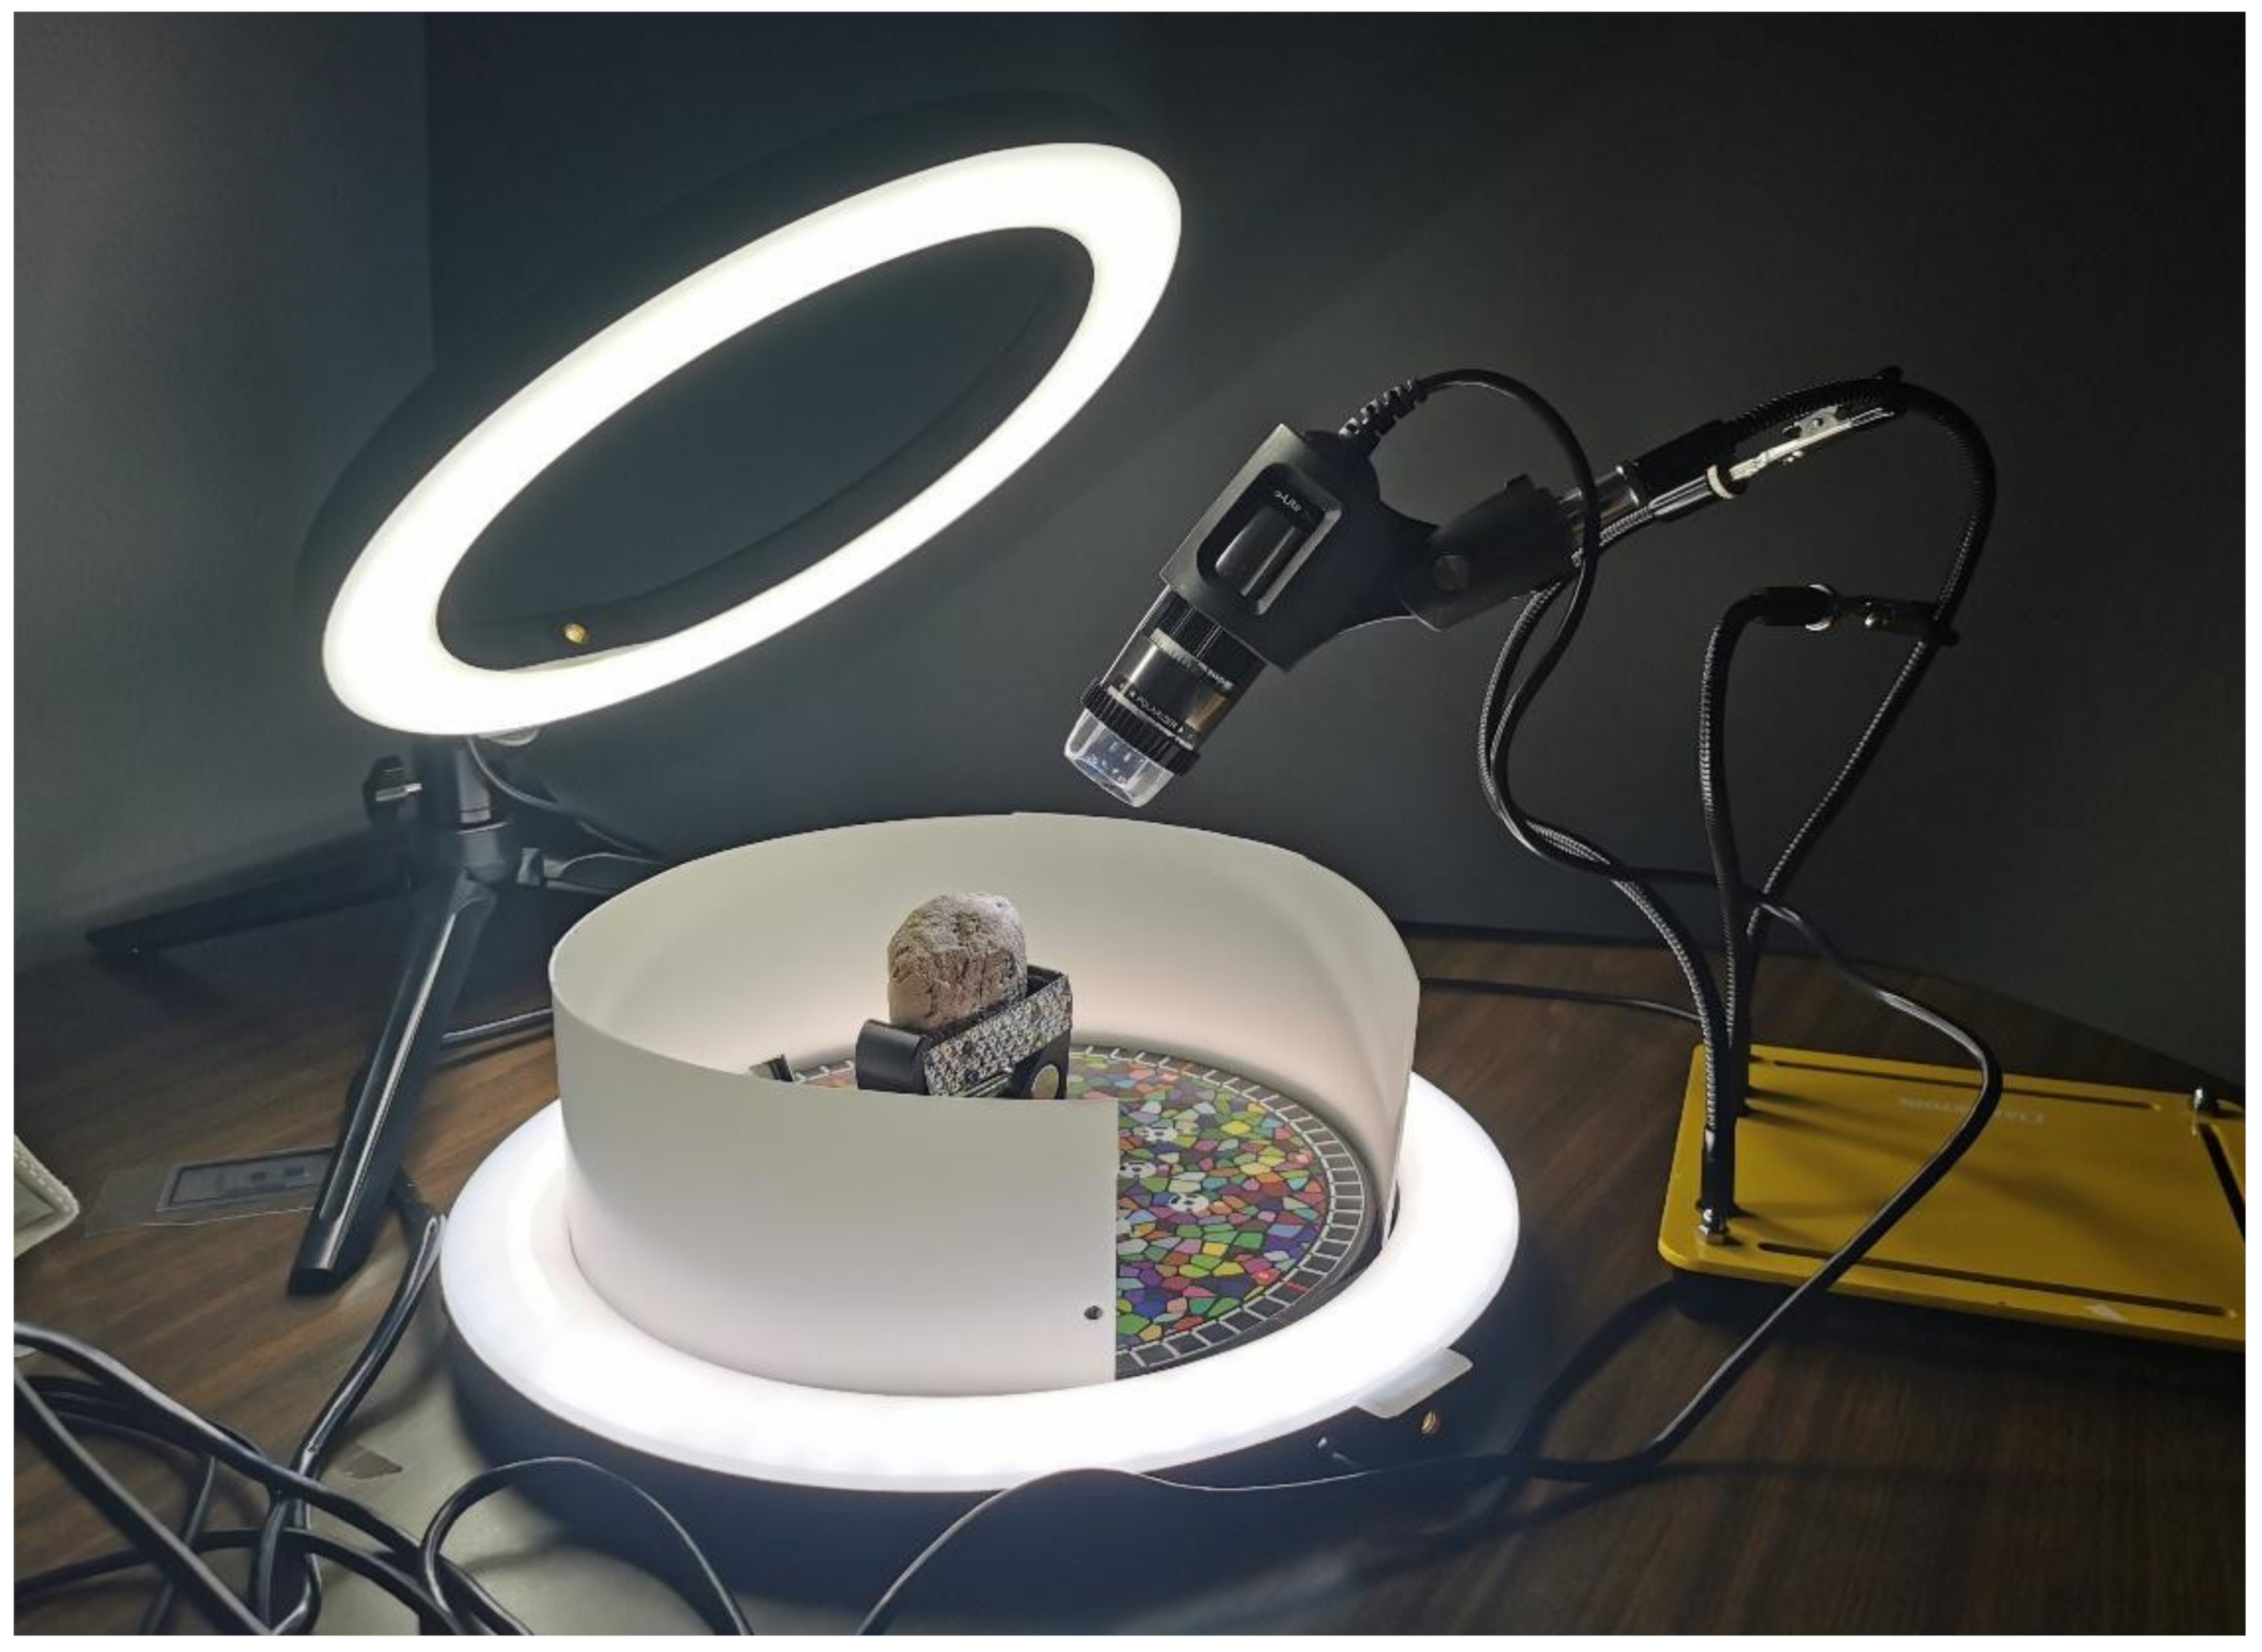
| 3 | The digital survey took place in Geneva (Switzerland) from 21 January 2018 to 24 January 2018 with the collaboration of Mirko Surdi (Ghent University), Francesco Fassi and Fausta Fiorillo (3D Survey Group, Politecnico di Milano), and Catherine Mittermayer (University of Geneva). The survey documented with high-definition 3D models (photogrammetry and structured-light scanner) a small lot of cuneiform tables, foundation cones, and votive plaques of Mesopotamian origin from the Durac-Donner private collection. |
| 4 | It is important to note that with regard to Dino-Lite USB microscopes, the reported magnification incorporates digital magnification forms. Thus, as suggested by the manufacturer, in this case it is often more useful to compare field of view rather than magnification, i.e., to compare the physical dimensions of the original item being magnified to the resulting size of the item on the display. |
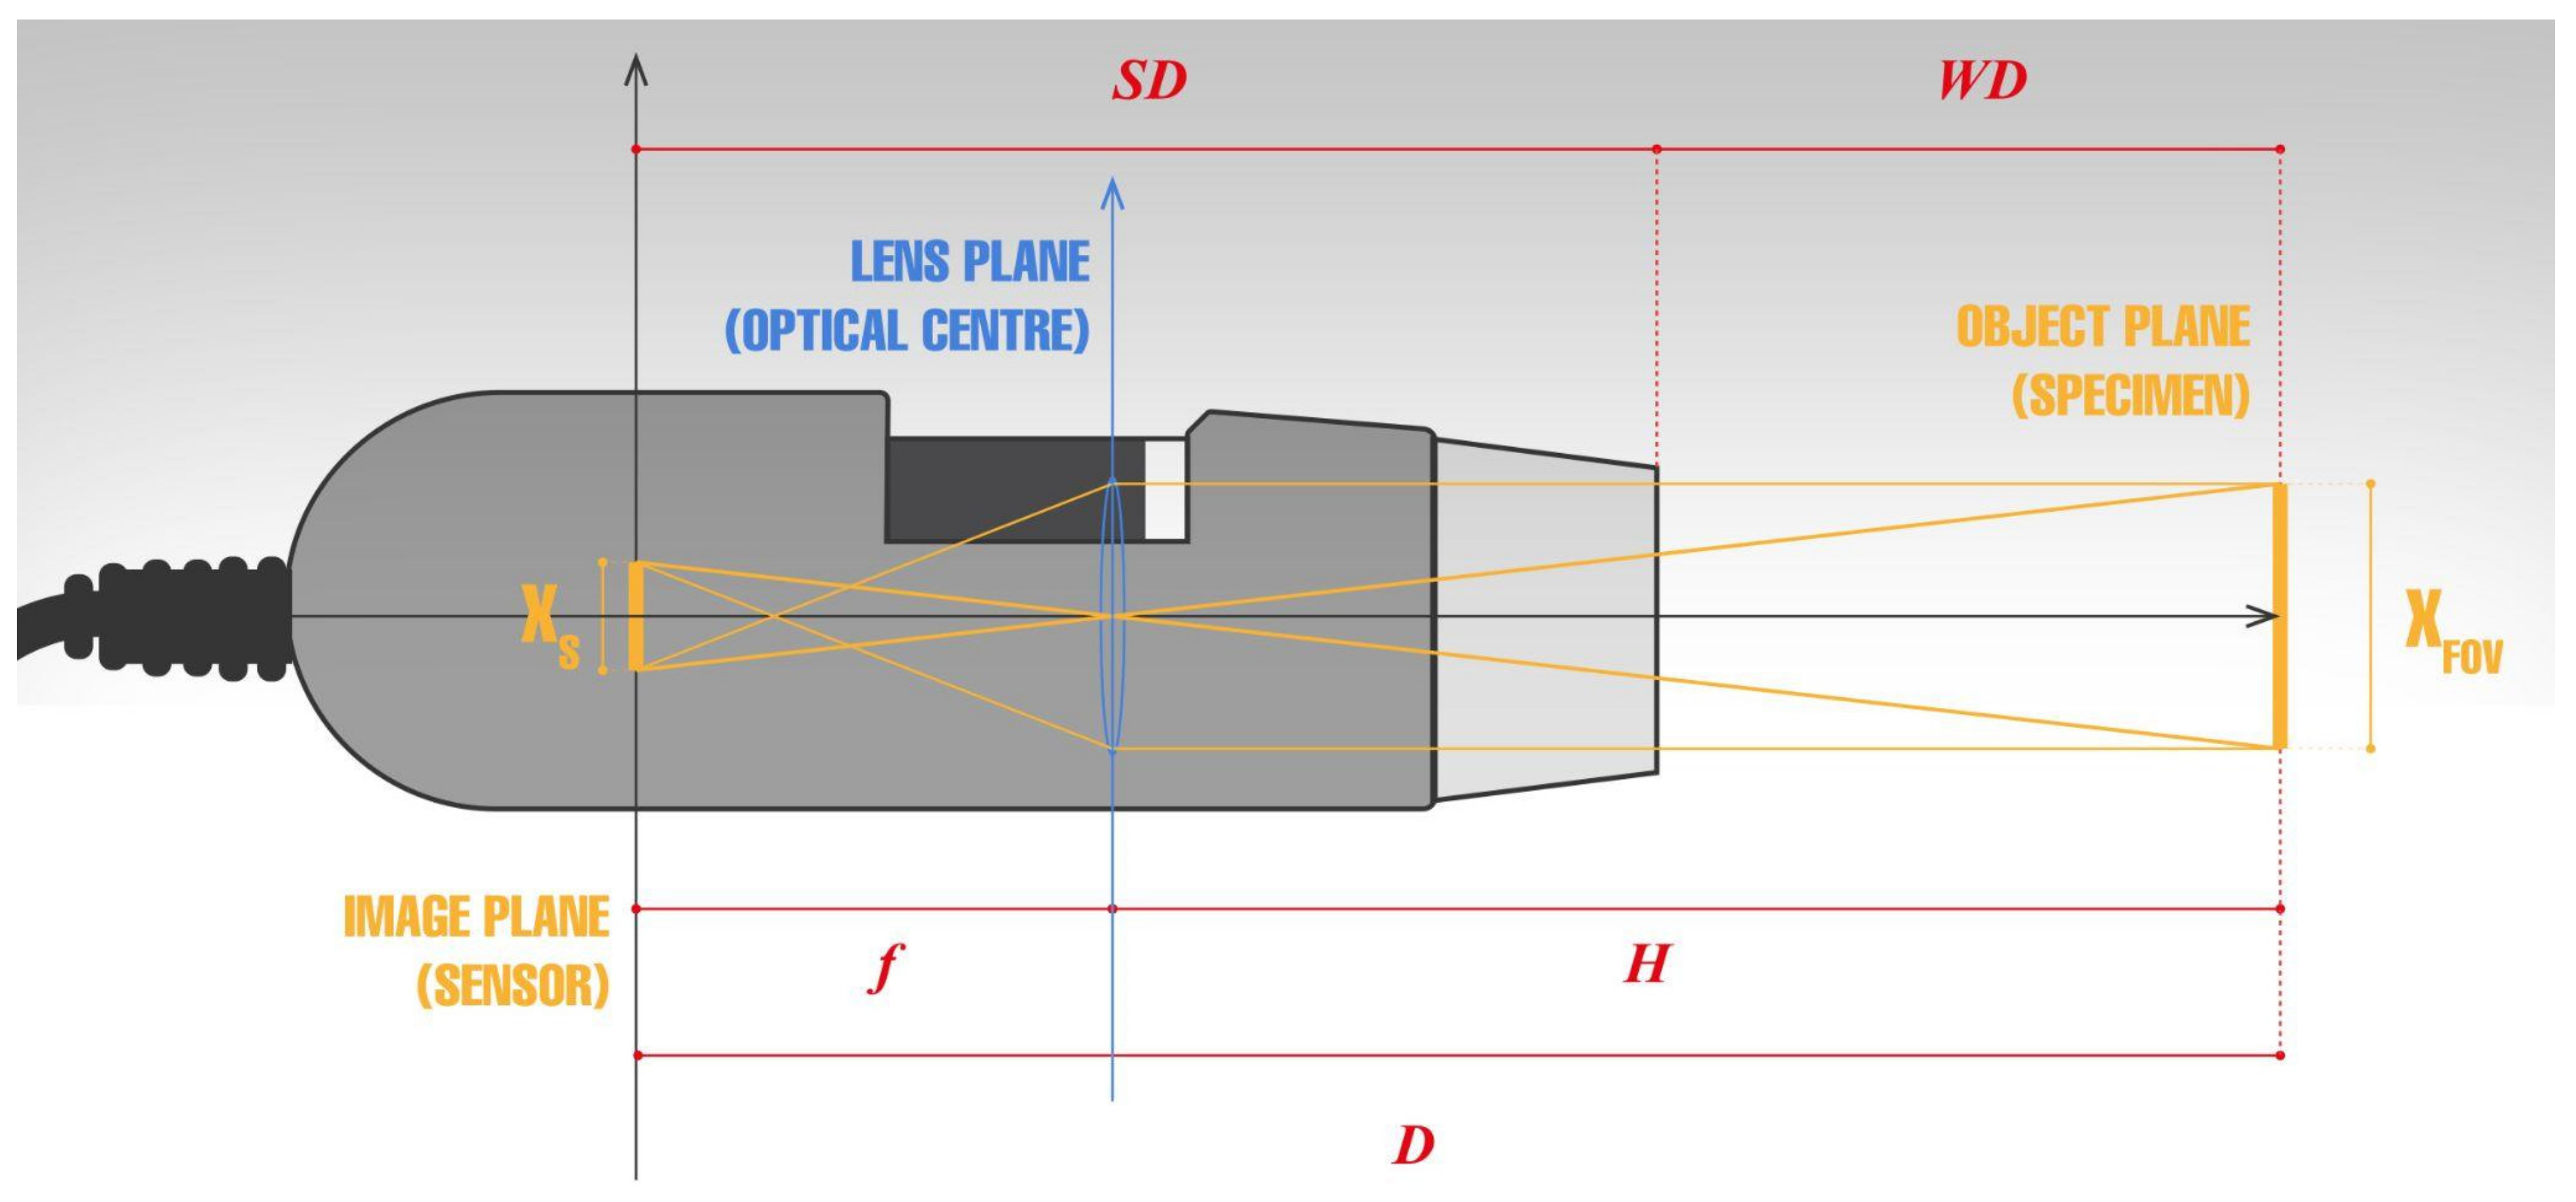
| 5 | The reference zero for the WD value is the outer end of the plastic nozzle; so, negative WD values are motivated by the need to make the specimen compenetrate the nozzle (assuming the specimen size allows this). |
| 6 | Also known as photogrammetric principal distance. |
| 7 | For this optical system, adjusting the magnification is equivalent to moving the lens plane backwards or forwards between the object and the sensor. In this mechanism, therefore, it is not possible to define for all magnifications a single value of f (main distance), or of H (flight height), or of their sum D = f + H, since the distance to the object will vary, as will the position of the center of the optical unit. |
| 8 | Root mean square error (RMSE) is the standard deviation of the residuals (prediction errors). In other words, it is a measure of accuracy that allows for the measurement of the difference between the predicted and observed values. From a mathematical point of view, it is the square root of the average squared errors. Larger errors have a disproportionately large effect on RMSD; consequently, outliers affect RMSD. It is always non-negative, and a value of 0 (almost never achieved in practice) would indicate a perfect fit to the data. |


| 2D | 2D+ | 3D | ||||||
|---|---|---|---|---|---|---|---|---|
| Hand Tracing | Raster | PTM | Photogrammetry | SLS | ||||
| Ink on Paper | VectorBased | Flatbed Scanner | Photography | Portable Light Dome | Reflex & Macro Lens | USB Microscope | Scan in a Box | |
| Objectivity | no | no | yes | yes | yes | yes | yes | yes |
| Exactness a | low-med | low-med | high | high | high | high | high | high |
| Acquisition time b (1 tablet, 6 sides) | ±24 h | ±24 h | ±10 min | ≤10 min | ±30 min | ±1 h | ±3 h | ±30 min |
| Time of data elaboration | ±1 min | immediate | ±5 min | ± 5 min | ≤20 min | ±3 h | ±3 h | ±5 min |
| Required skills | med-high | med-high | low-med | med-high | med-high | high | high | med-high |
| Level of Detail | low | low | med-high | med-high | high | high | high | high |
| Accuracy | low-med | low-med | high | high | high | high | high | very high |
| Text readability | high | high | low-med | medium | high | high | high | high |
| Lightening c | no | no | no | no | yes | yes | yes | yes |
| Texture data | no | no | no | no | yes | yes | yes | yes |
| Accessibility of technology d | high | medium | medium | high | med-high | medium | low-med | low |
| Dissemination | high | high | high | high | medium | low | low | low |
| Data size manageability | high | high | high | medium | med-high | low | low | low |
| Equipment cost | very low | med-high | medium | med-high | med-high | high | medium | high |
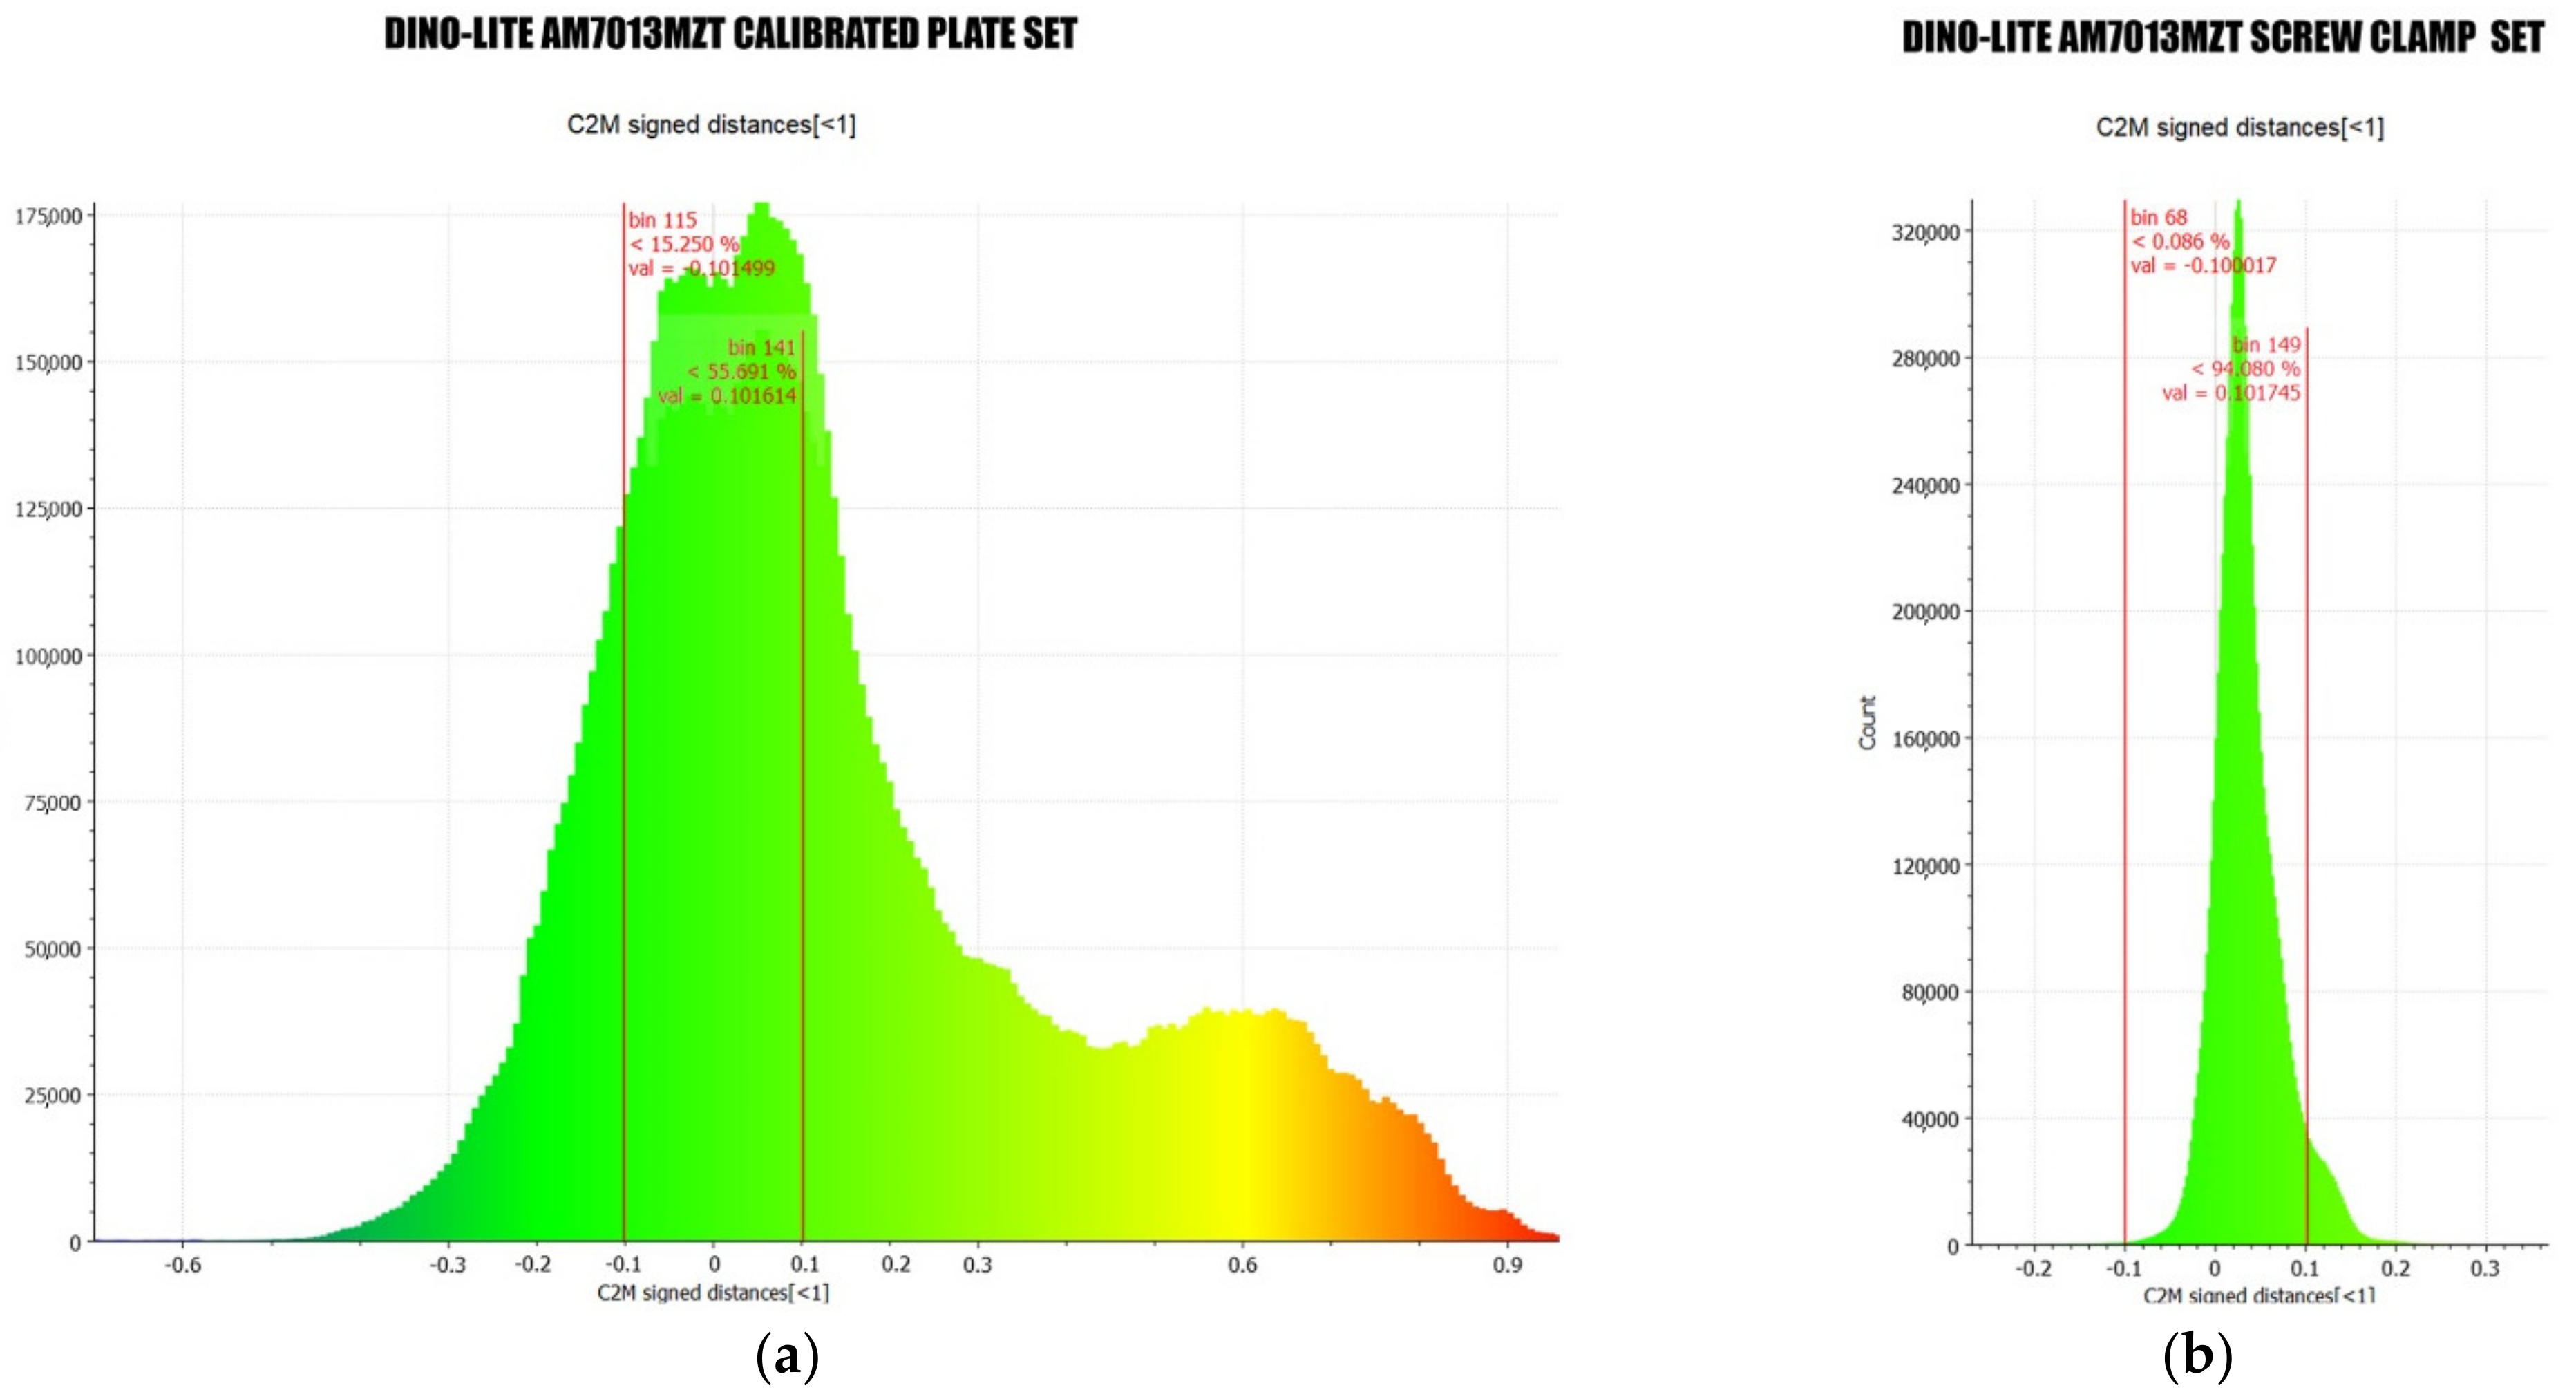
| Acquisition Network Geometry | Calibrated Plate Set | Screw Clamp Set |
|---|---|---|
| Aligned Cameras | 506/518 | 718/718 |
| Sparse Cloud | 4.3 × 10⁵ points | 4.1 × 10⁵ points |
| Sparse Cloud Filtered | 3.8 × 10⁵ points | 2.1 × 10⁵ points |
| Dense Cloud | 10.4 × 10⁵ points | 8.3 × 10⁵ points |
| GSD | 6.3 μm/px | 7.14 μm/px |
| RMS Error | 0.87 mm | 0.027 mm |
| Processing Time | 4 h | 2 h |
| M | WD | XFOV | YFOV |
|---|---|---|---|
| 20 | 48.7 | 19.8 | 14.9 |
| 30 | 21.7 | 13.2 | 9.9 |
| 40 | 9.0 | 9.9 | 7.4 |
| 50 | 1.9 | 7.9 | 5.9 |
| 60 | −2.3 | 6.6 | 5.0 |
| 220 | −0.1 | 1.8 | 1.4 |
| 230 | 1.0 | 1.7 | 1.3 |
| 240 | 2.1 | 1.7 | 1.2 |
| Declared Parameters | Calibration Output Parameters | ||||||
|---|---|---|---|---|---|---|---|
| WD | XS | YS | XFOV | YFOV | GSD | f | H |
| 48.7 mm | 2592 px | 1944 px | 19.8 mm | 14.9 mm | 0.0076 mm/px | 13413 px | 102.46 mm |
| Sensor Type | XS | YS | Pixel Pitch | F | |||
|---|---|---|---|---|---|---|---|
| 1/9” | 2592 px | 1.60 mm | 1944 px | 1.20 mm | 0.0006 mm/px | 13,413 px | 8.28 mm |
| 1/6” | 2592 px | 2.40 mm | 1944 px | 1.80 mm | 0.0009 mm/px | 13,413 px | 12.42 mm |
| 1/4” | 2592 px | 3.60 mm | 1944 px | 2.70 mm | 0.0014 mm/px | 13,413 px | 18.63 mm |
| 1/3” | 2592 px | 2.80 mm | 1944 px | 3.60 mm | 0.0019 mm/px | 13,413 px | 24.84 mm |
| 1/2.5” | 2592 px | 5.76 mm | 1944 px | 4.32 mm | 0.0022 mm/px | 13,413 px | 29.81 mm |
| Sensor Type | WD | f | H | D | SD |
|---|---|---|---|---|---|
| 1/4” | 48.70 mm | 18.6 mm | 102.5 mm | 121.1 mm | 72.4 mm |
| Values | f | H | GSD | |
|---|---|---|---|---|
| Calibrated | 13,413 px | 18.6 mm | 102.5 mm | 0.00764 mm/px |
| Calculated | 13,481 px | 18.9 mm | 101.8 mm | 0.00764 mm px |
| Tablet LW21.CUN. | 160 | 159 | 133 | 126 |
|---|---|---|---|---|
| Captures number | 959 | 930 | 949 | 1343 |
| GSD | 0.00752 mm/px | 0.00781 mm/px | 0.00766 mm/px | 0.00766 mm/px |
| Recto |  |  |  |  |
| Verso |  |  |  |  |
Publisher’s Note: MDPI stays neutral with regard to jurisdictional claims in published maps and institutional affiliations. |
© 2022 by the authors. Licensee MDPI, Basel, Switzerland. This article is an open access article distributed under the terms and conditions of the Creative Commons Attribution (CC BY) license (https://creativecommons.org/licenses/by/4.0/).
Share and Cite
Antinozzi, S.; Fiorillo, F.; Surdi, M. Cuneiform Tablets Micro-Surveying in an Optimized Photogrammetric Configuration. Heritage 2022, 5, 3133-3164. https://doi.org/10.3390/heritage5040162
Antinozzi S, Fiorillo F, Surdi M. Cuneiform Tablets Micro-Surveying in an Optimized Photogrammetric Configuration. Heritage. 2022; 5(4):3133-3164. https://doi.org/10.3390/heritage5040162
Chicago/Turabian StyleAntinozzi, Sara, Fausta Fiorillo, and Mirko Surdi. 2022. "Cuneiform Tablets Micro-Surveying in an Optimized Photogrammetric Configuration" Heritage 5, no. 4: 3133-3164. https://doi.org/10.3390/heritage5040162
APA StyleAntinozzi, S., Fiorillo, F., & Surdi, M. (2022). Cuneiform Tablets Micro-Surveying in an Optimized Photogrammetric Configuration. Heritage, 5(4), 3133-3164. https://doi.org/10.3390/heritage5040162