Article

Deep Learning in Historical Architecture Remote Sensing: Automated Historical Courtyard House Recognition in Yazd, Iran

1
Department of Architecture, School of Engineering and Design, Technical University of Munich, 80333 Munich, Germany
2
Department of landscape Architecture, Tarbiat Modares University, Tehran 119-14115, Iran
3
School of Architecture and environmental design, Iran University of Science and Technology, Tehran 13114-16846, Iran
*
Author to whom correspondence should be addressed.
Heritage 2022, 5(4), 3066-3080; https://doi.org/10.3390/heritage5040159
Submission received: 8 August 2022 / Revised: 28 September 2022 / Accepted: 6 October 2022 / Published: 12 October 2022
(This article belongs to the Section Architectural Heritage)

Abstract

:
This research paper reports the process and results of a project to automatically classify historical and non-historical buildings using airborne and satellite imagery. The case study area is the center of Yazd, the most important historical site in Iran. New computational scientific methods and accessibility to satellite images have created more opportunities to work on automated historical architecture feature recognition. Building on this, a convolutional neural network (CNN) is the main method for the classification task of the project. The most distinctive features of the historical houses in Iran are central courtyards. Based on this characteristic, the objective of the research is recognizing and labeling the houses as historical buildings by a CNN model. As a result, the trained model is tested by a validation dataset and has an accuracy rate of around 98%. In Sum, the reported project is one of the first works on deep learning methods in historical Iranian architecture study and one of the first efforts to use automated remote sensing techniques for recognizing historical courtyard houses in aerial images.

1. Introduction

1.1. Deep Learning, Remote Sensing, and Their Application in Historical Architecture Recognition

A few years ago, computer vision progressed to develop programs for the recognition and classification of existing elements in several functions [1]. Automated remote sensing and recognition of historical buildings based on airborne and satellite images is a new method in historical city studies. Automating some of the imaging tasks for the recognition of historic architectural features is a proper solution to achieve more acceptable results in comparison to the convolutional methods [2,3,4]. There are numerous research works on deep learning applications for image classification, both for general [5,6,7] as well as specific aerial images [8,9,10,11,12,13], gait recognition [14], medical images [15], microorganism classifying [16], vehicle recognition [17], recognition of fruits [18], and urban environment recognition [19]. Furthermore, there are some projects focusing on architectural heritage classification using techniques like instance retrieval [20], block-lets hierarchical sparse coding [21], detection of patterns [22], building image classification [23,24,25,26,27] computer vision algorithms [28], Gabor filters, Support Vector Machine (SVM) [29], local features learning and clustering [30], deep learning and architectural heritage [23,31,32], and multinomial latent logistic regression [33].
Automatic feature extraction is intended to become another method for researchers to quickly build a dataset of features in broad historical and archaeological areas. Historical architecture researchers and archaeologists can produce more efficient results with deep learning pattern recognition techniques. Although Deep convolutional neural networks (CNNs) were developed in 2012, it is appropriate for using trained CNNs for many subjects [8,34,35,36,37,38,39].
This study demonstrates the applicability of CNNs for historic architectural prospection by using them to recognize historical buildings in airborne and satellite images of historical cities. A case study of Yazd, Iran, has been chosen for this aim. Currently, experts use traditional methods and field visits to identify historic homes which takes a lot of time and has many obstacles. This research seeks to provide a simpler and faster method with the help of computers by an interdisciplinary approach.
The most important feature used in this process is the central courtyard, since all historical buildings of Yazd have a central courtyard, and new buildings have a yard on one side. This process appreciably reduces mapping time and field visits. It also increases the accuracy of the work. Therefore, in this article, we have created a method for the first time that can be used in historical context studies.
The article begins with a review of the literature on the historical architecture of Iran. The next step introduces the case study. Then the goals of the research are described in detail. In the next step, the research method is explained. This stage is the contribution and enlightenment of knowledge. At this point, a new technique is being developed that combines programming expertise with architecture and urban planning to distinguish historic from non-historical structures, and the morphology of historical context. In the final step, the results of testing the research method are introduced and analyzed.

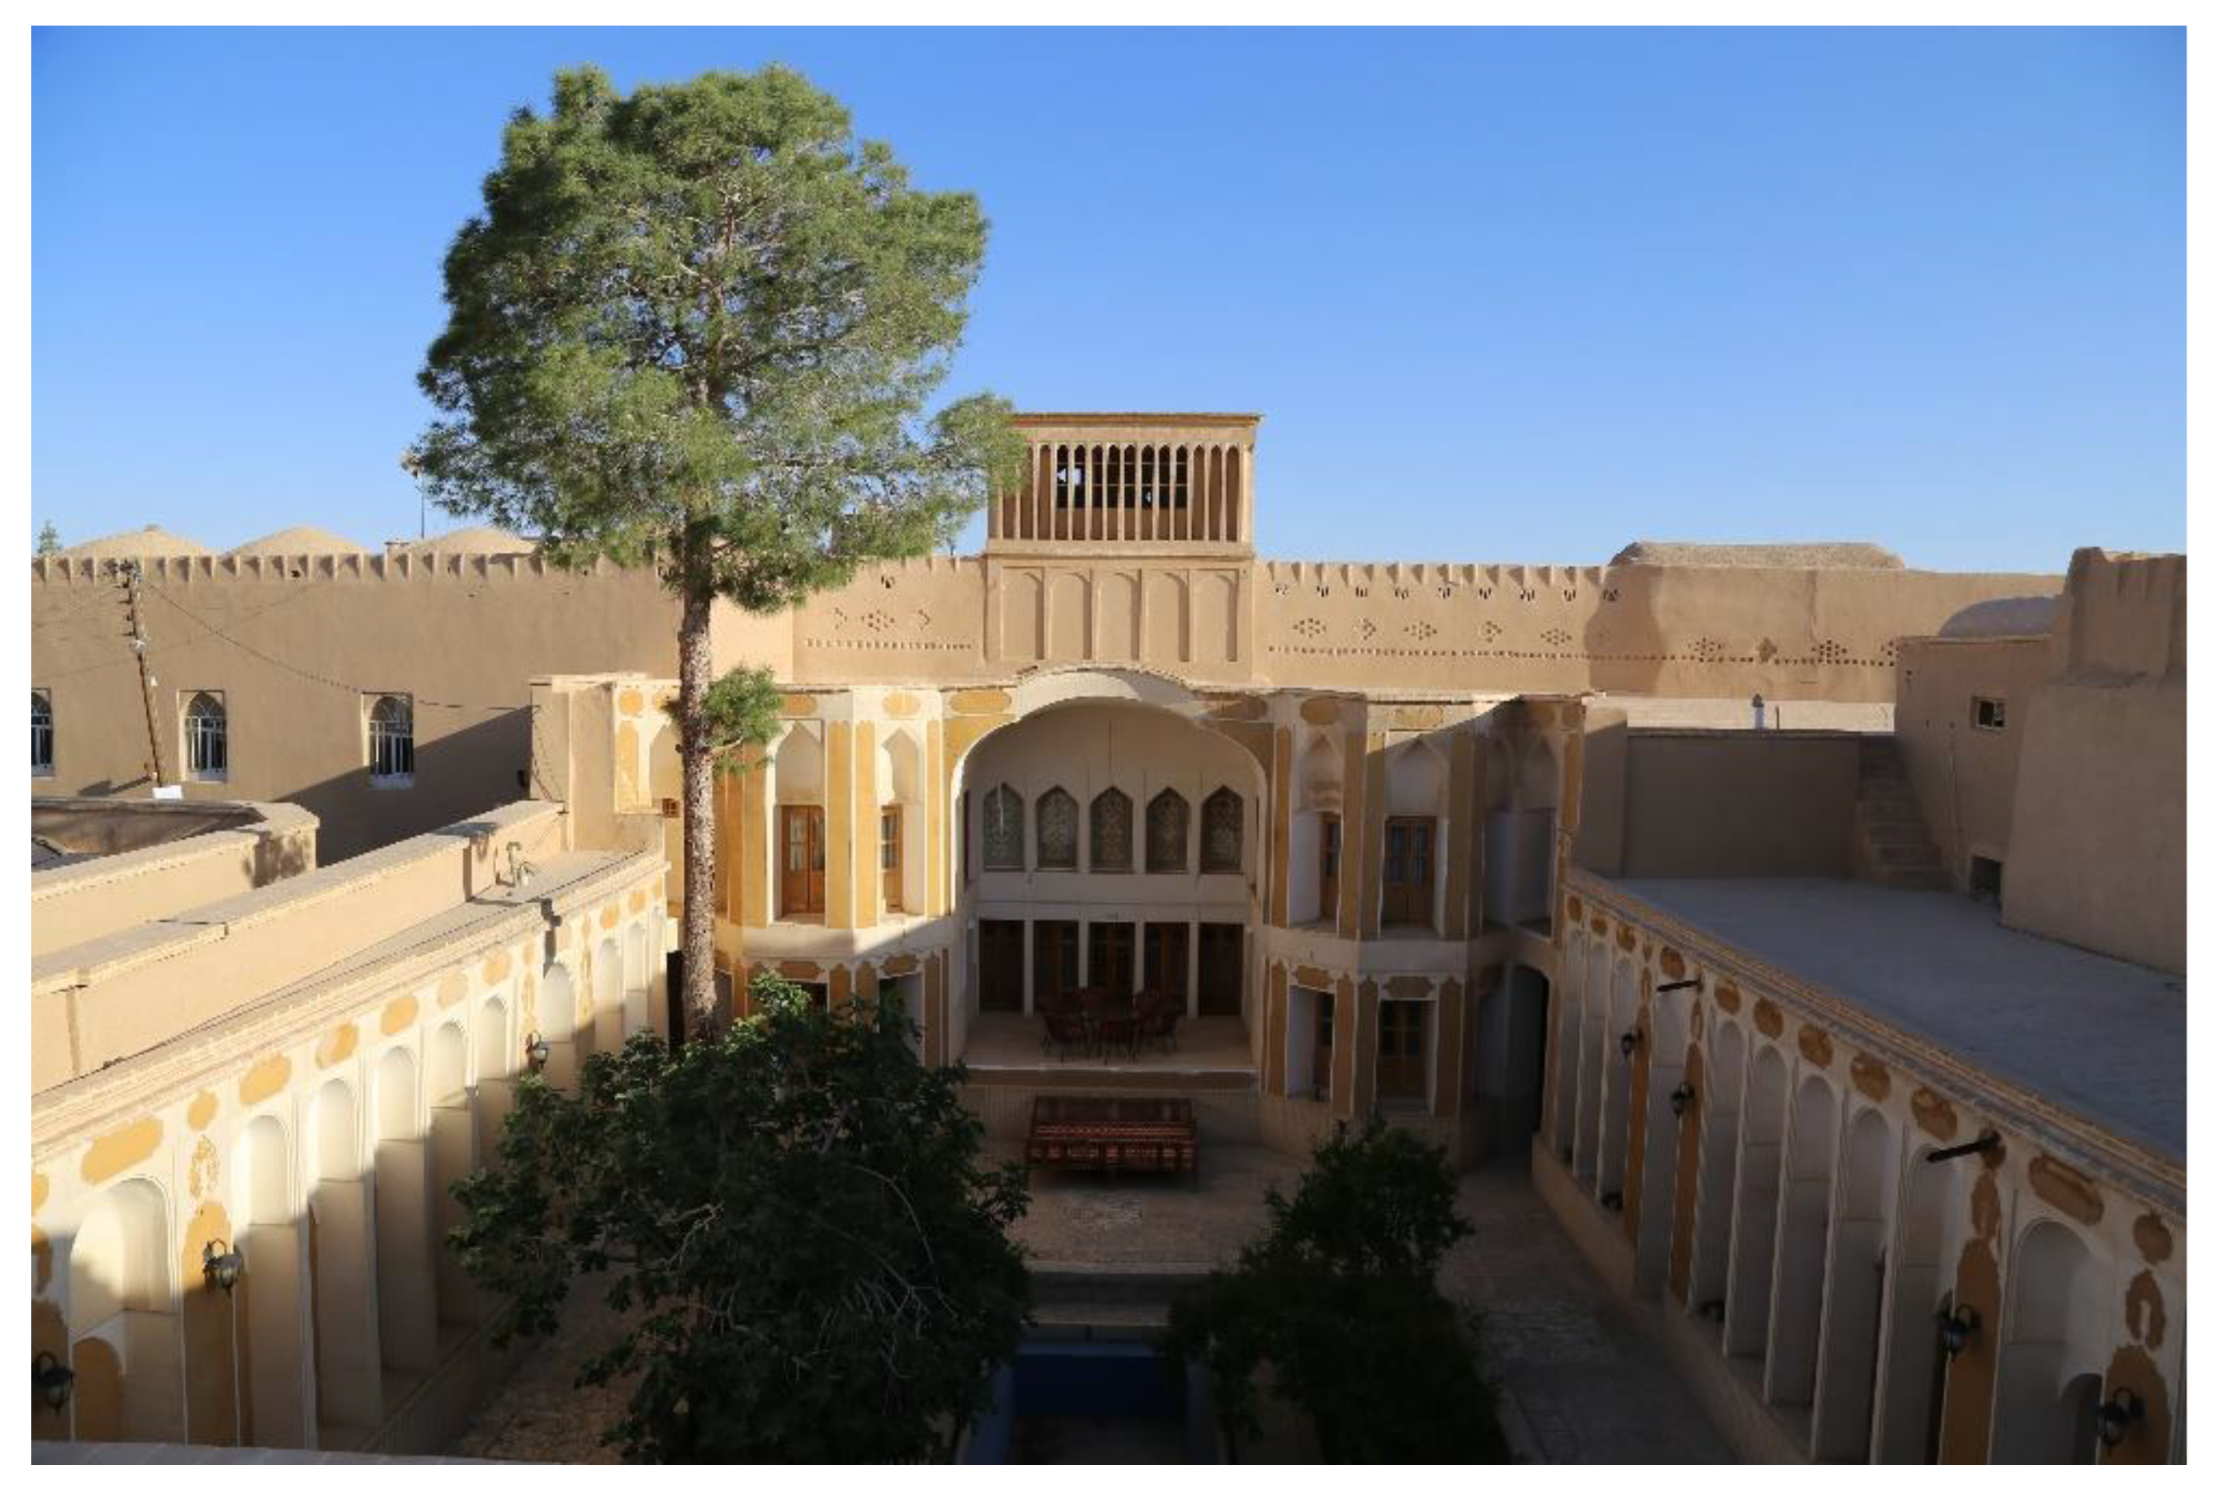
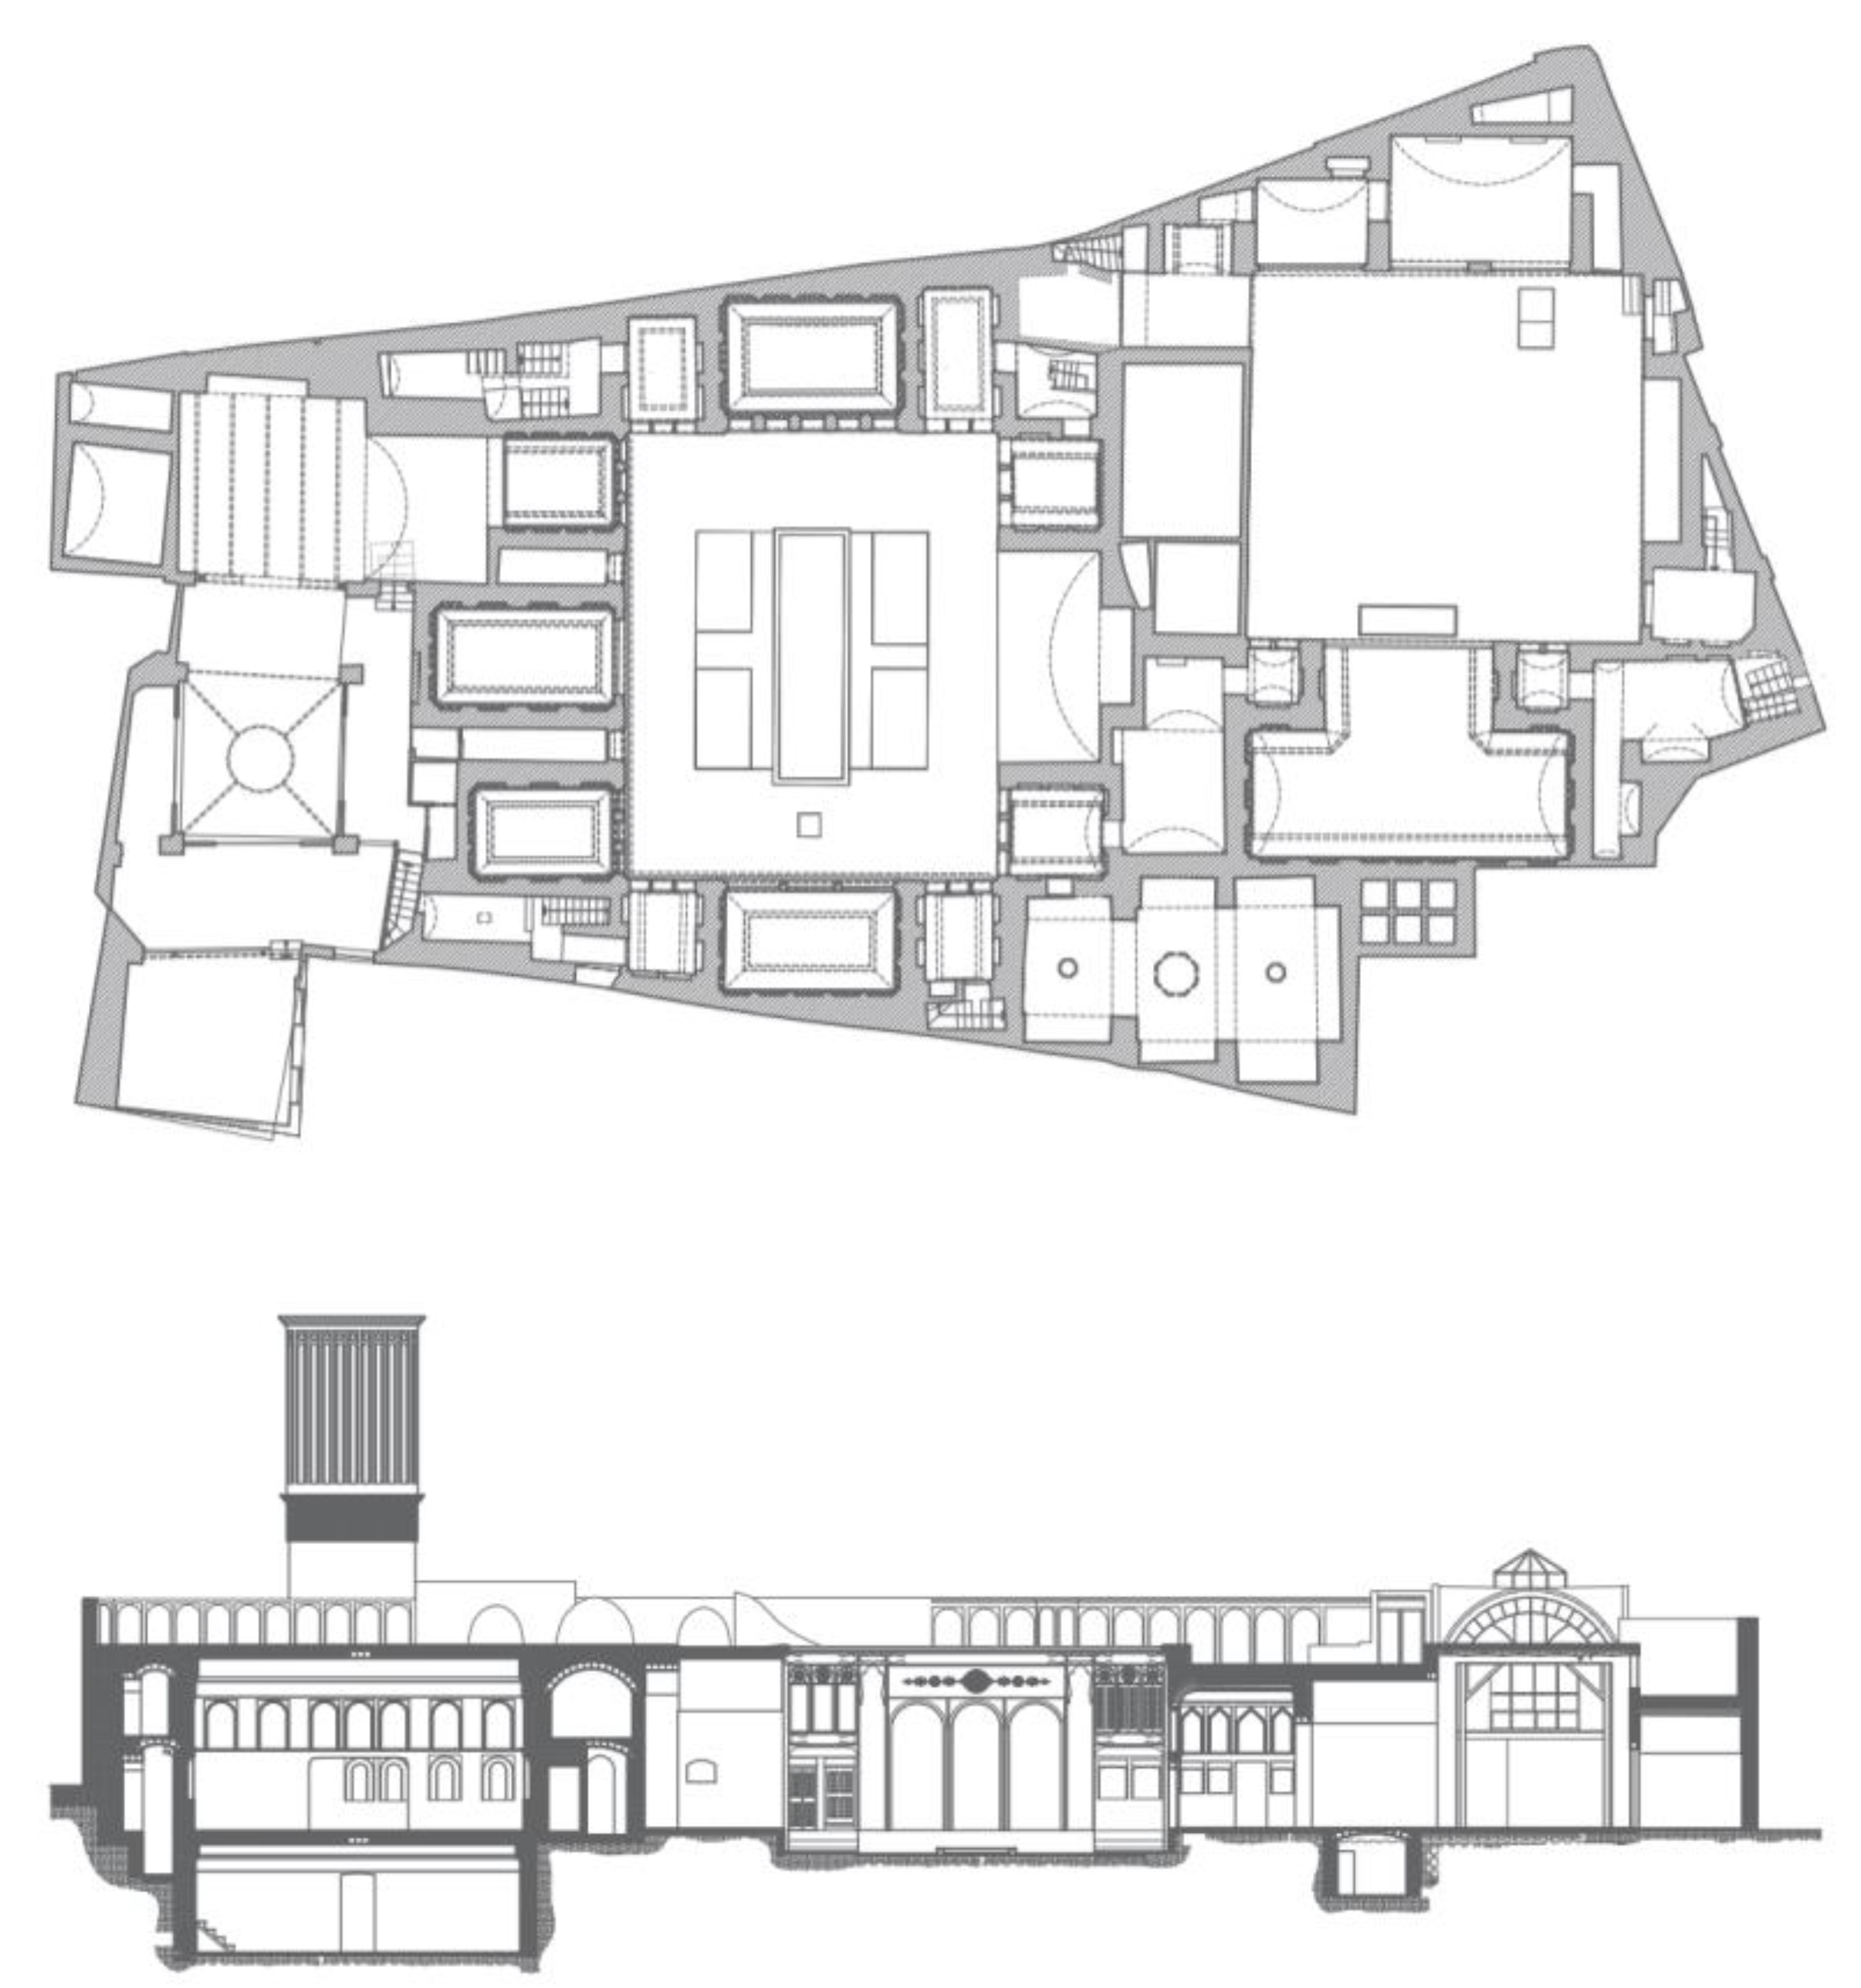
1.2. The Historical Architecture of Iran
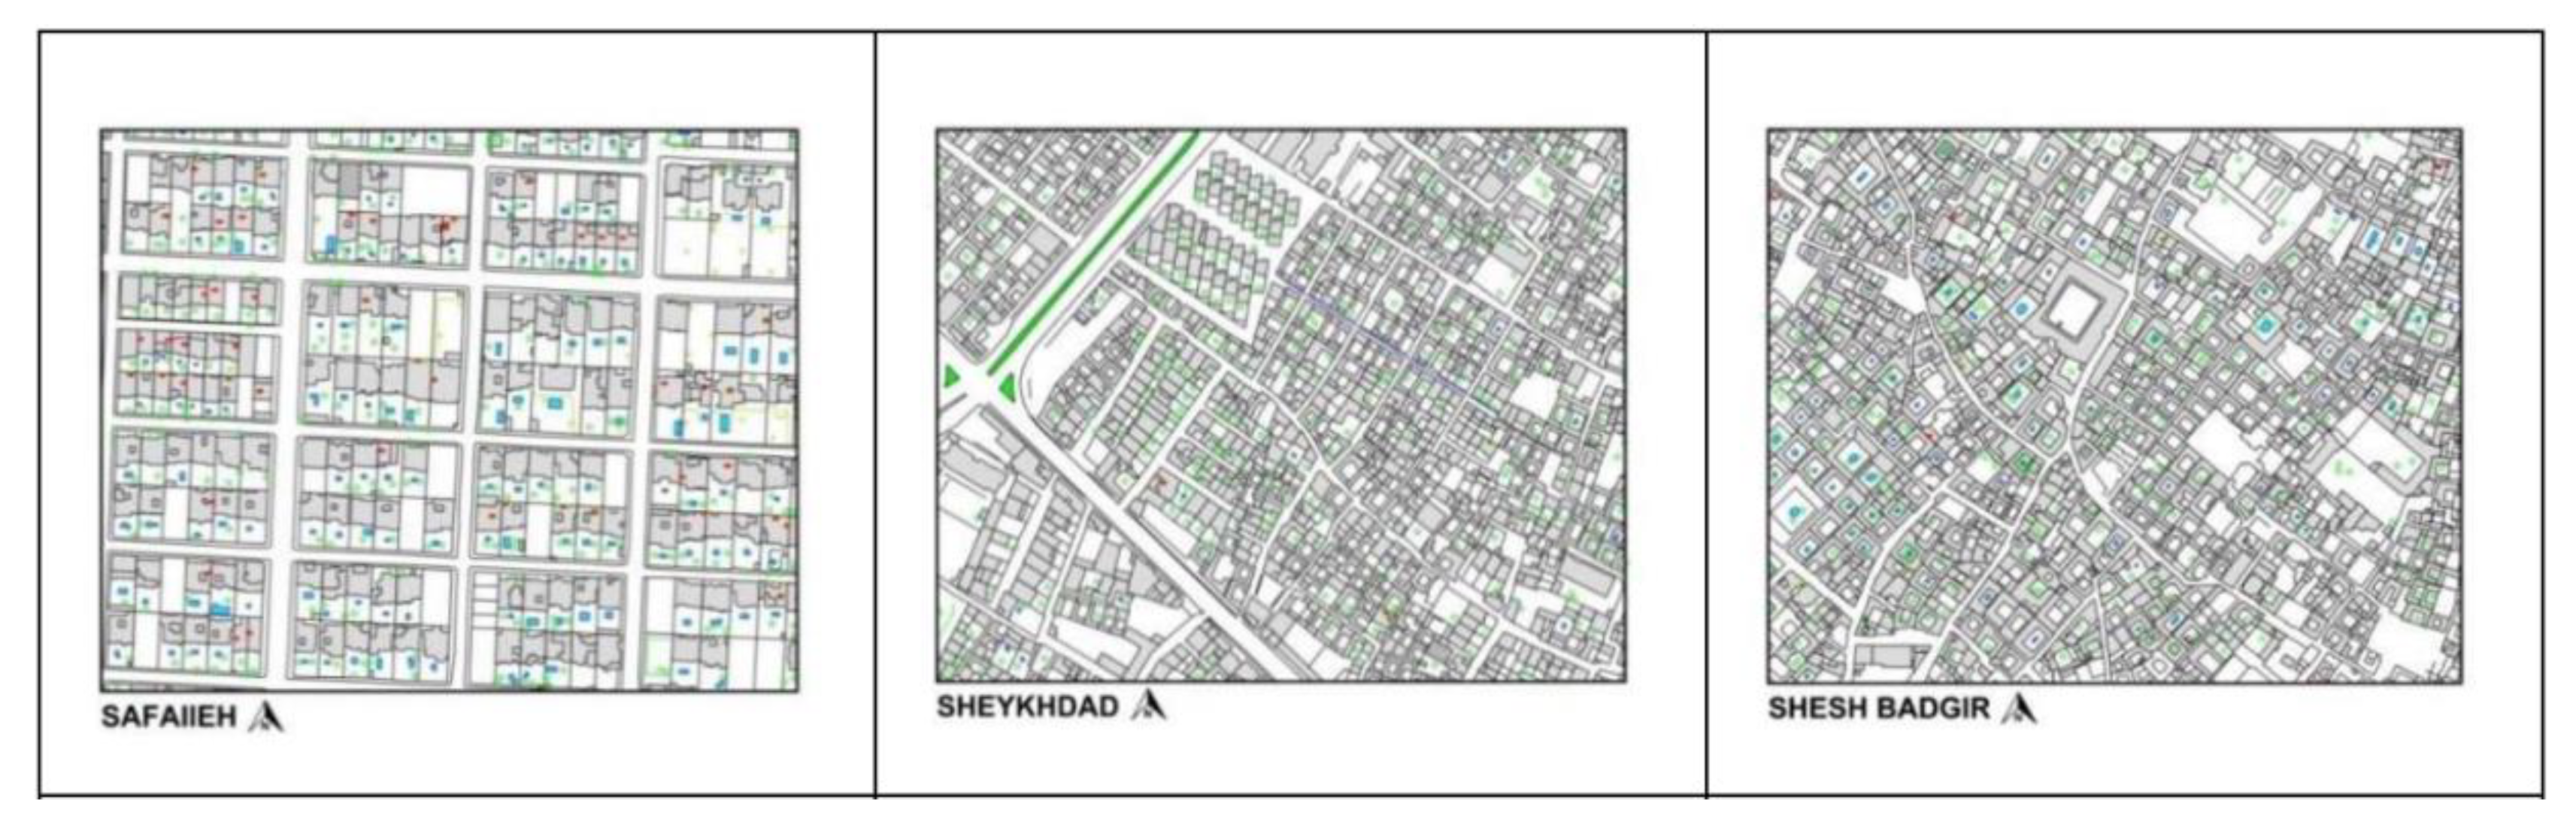
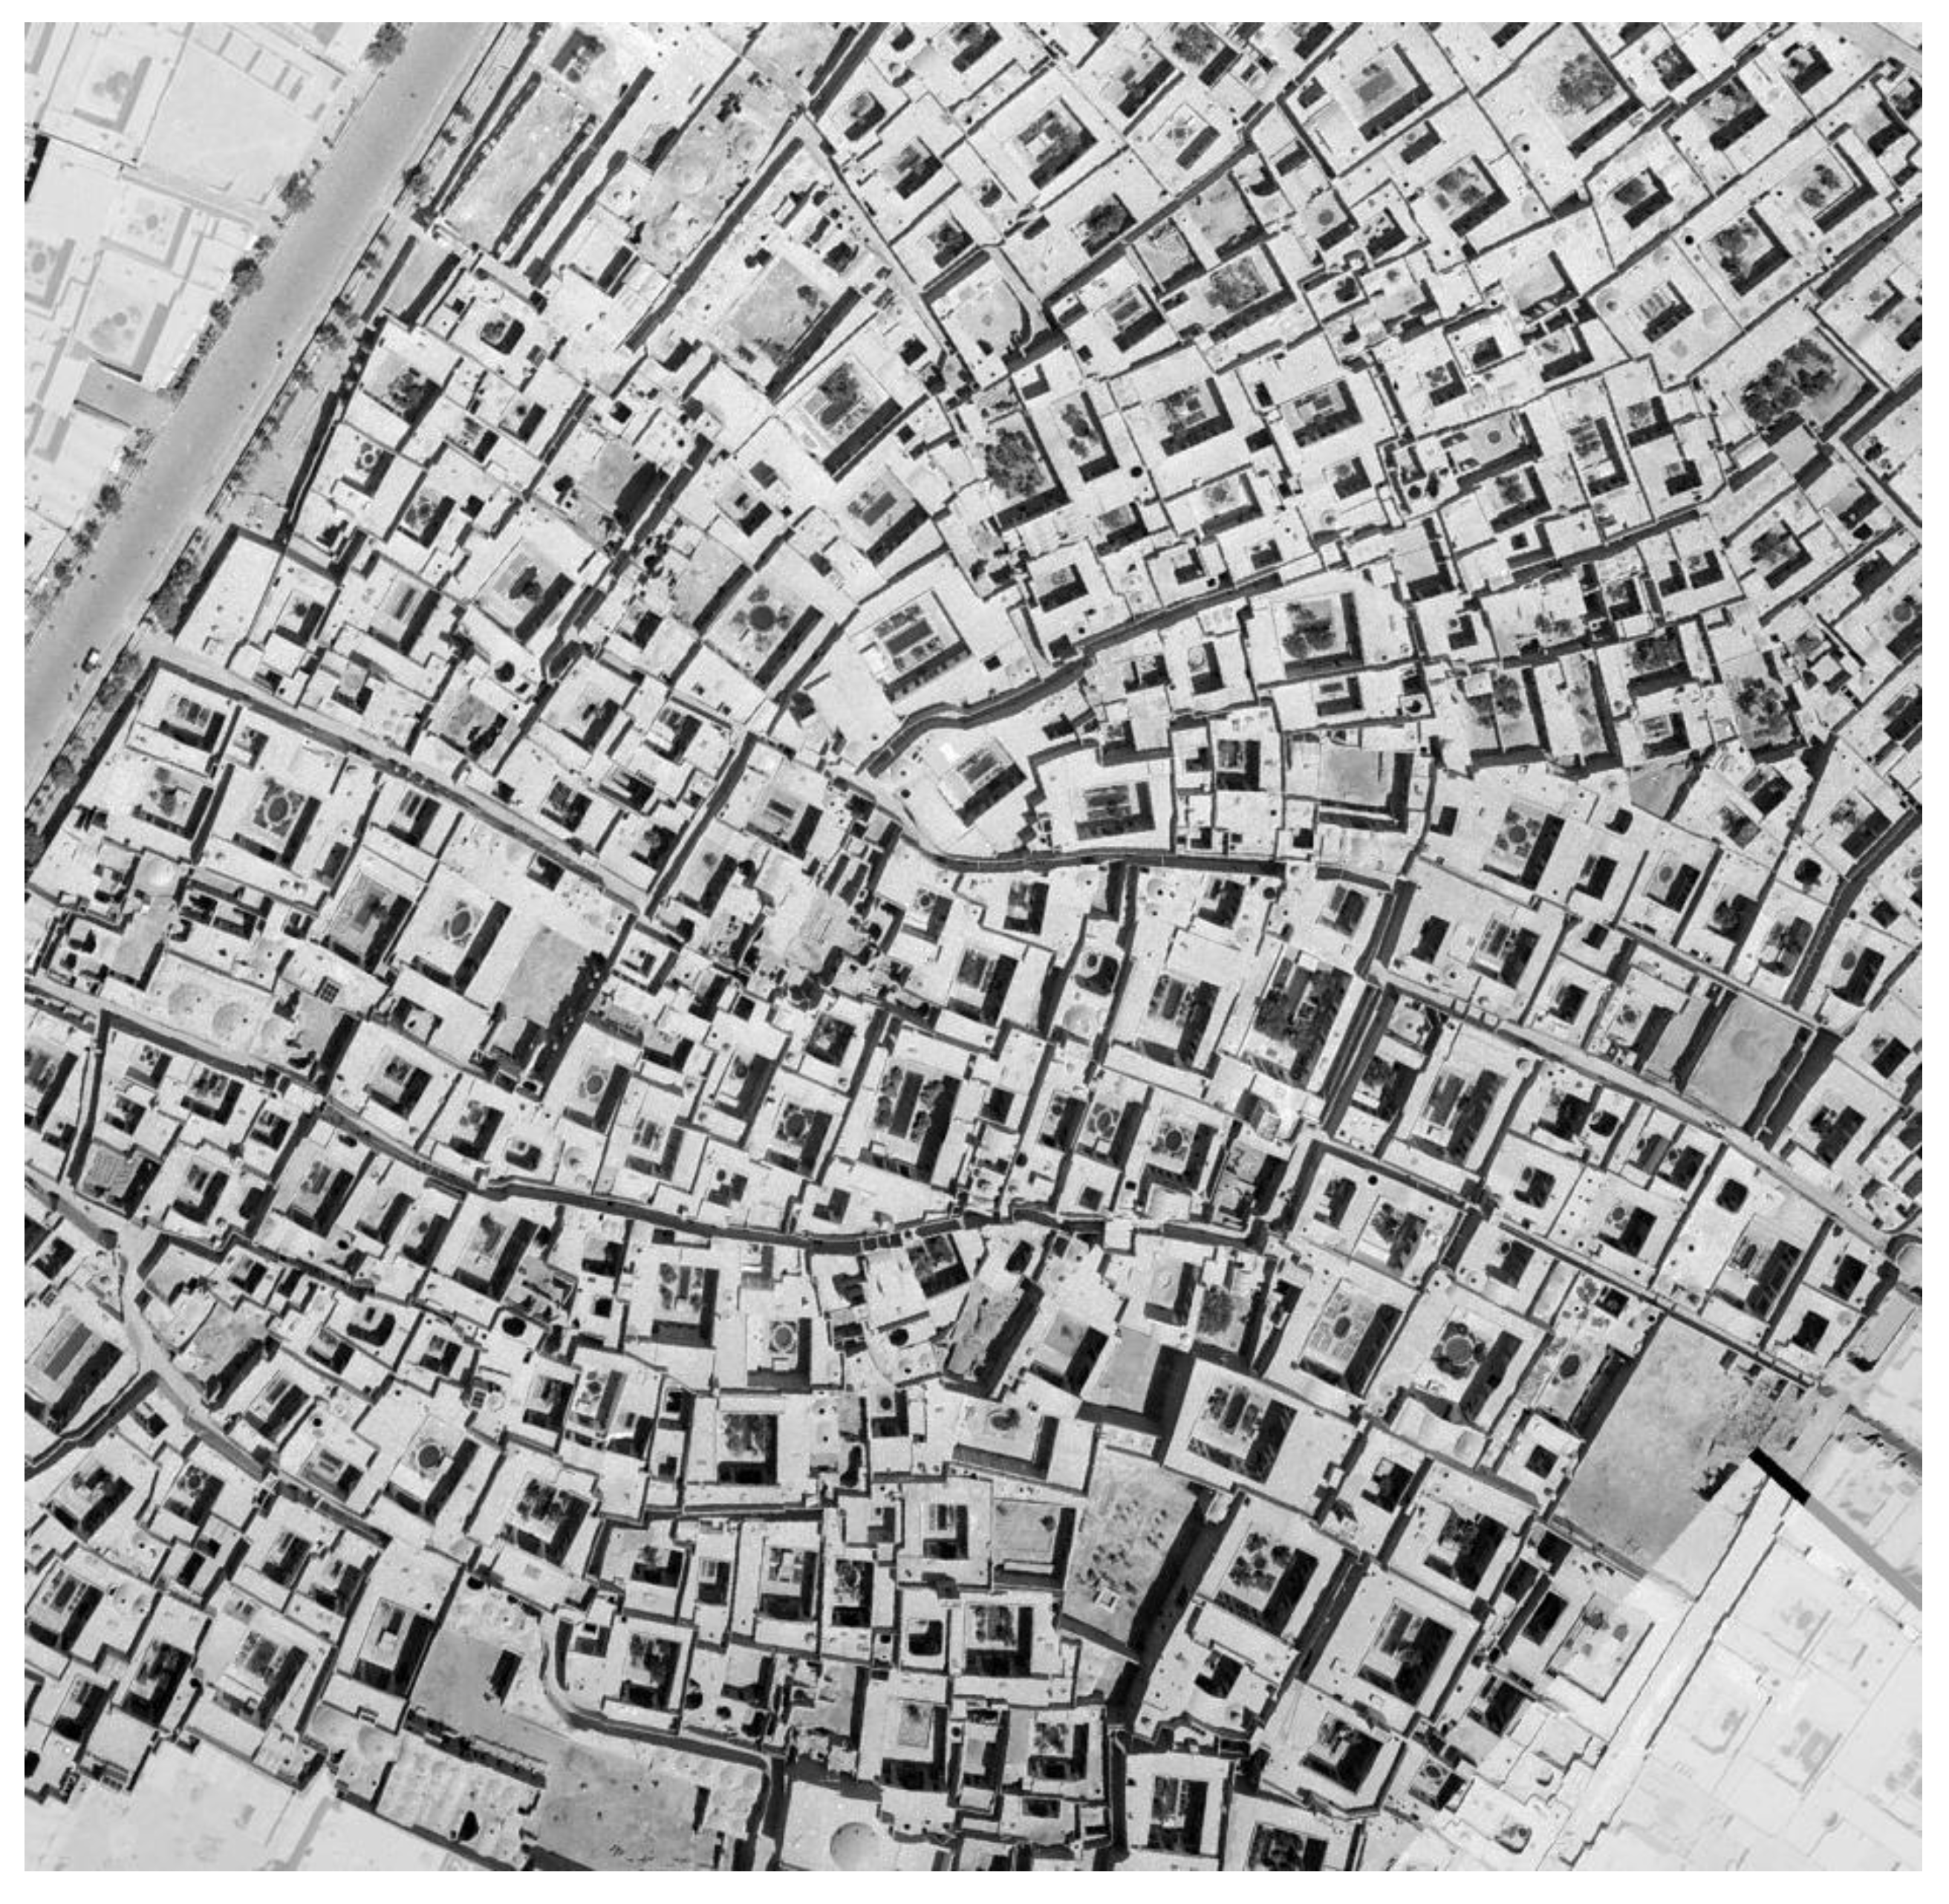
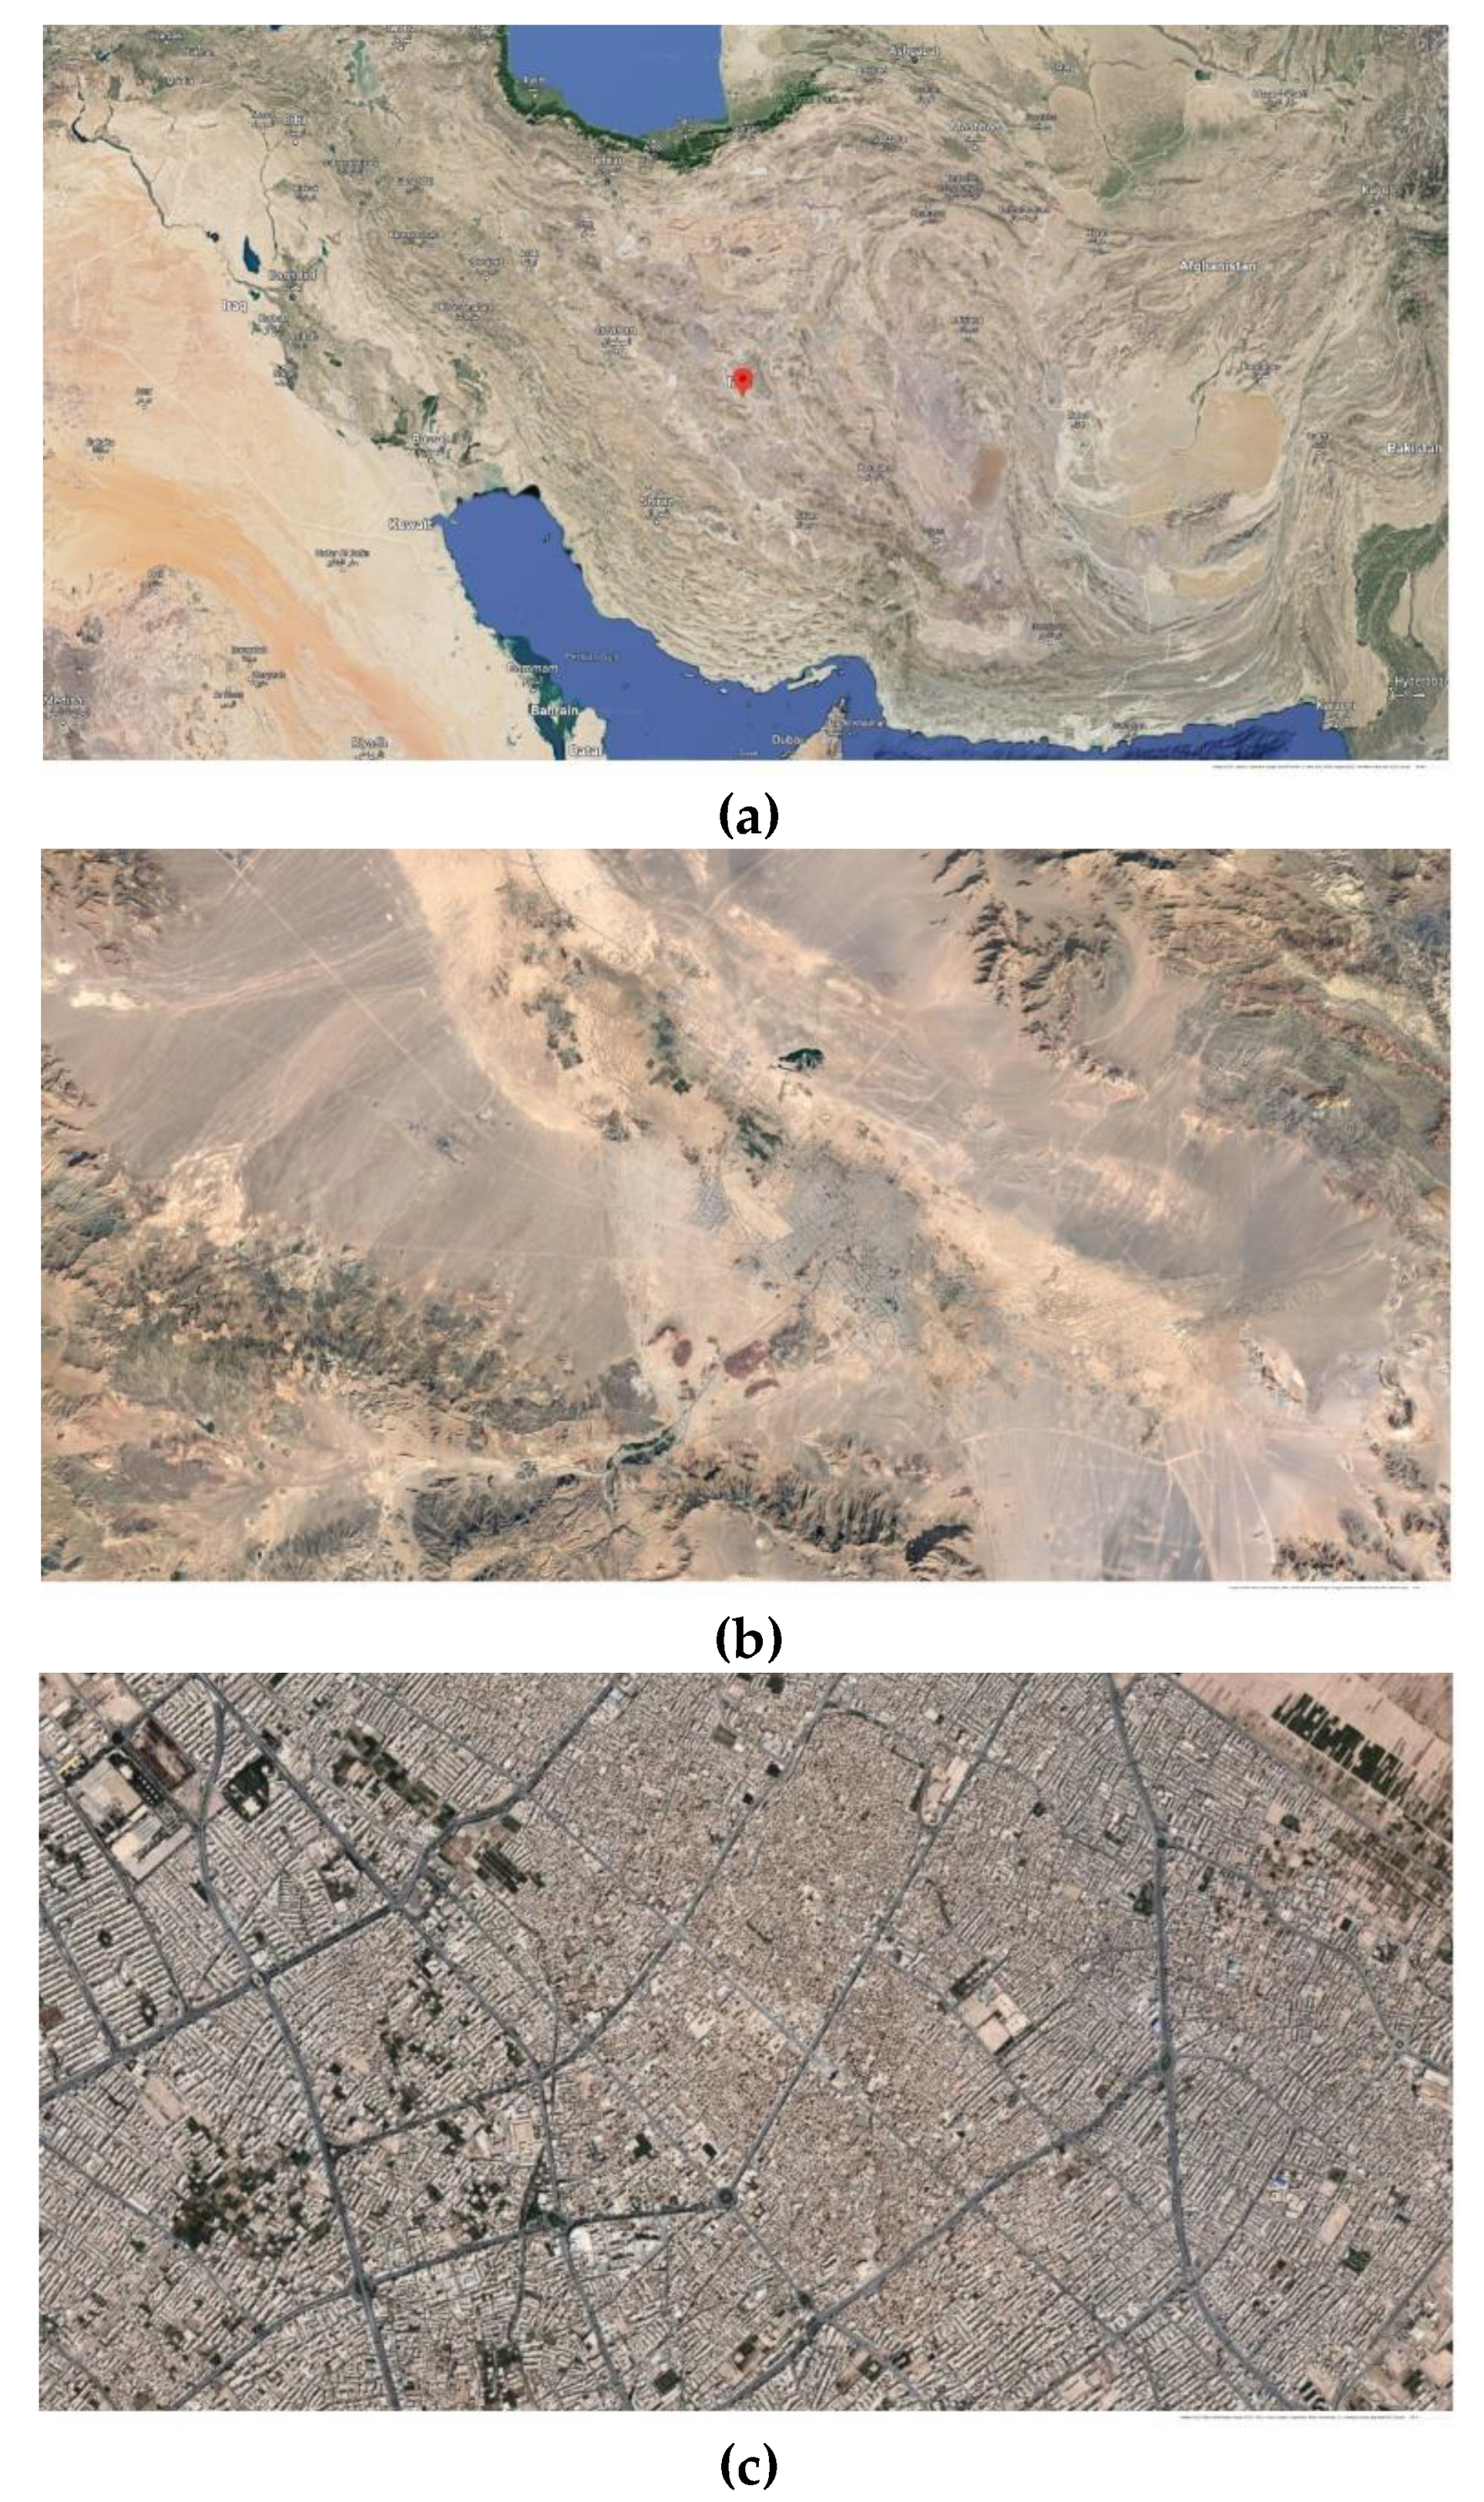
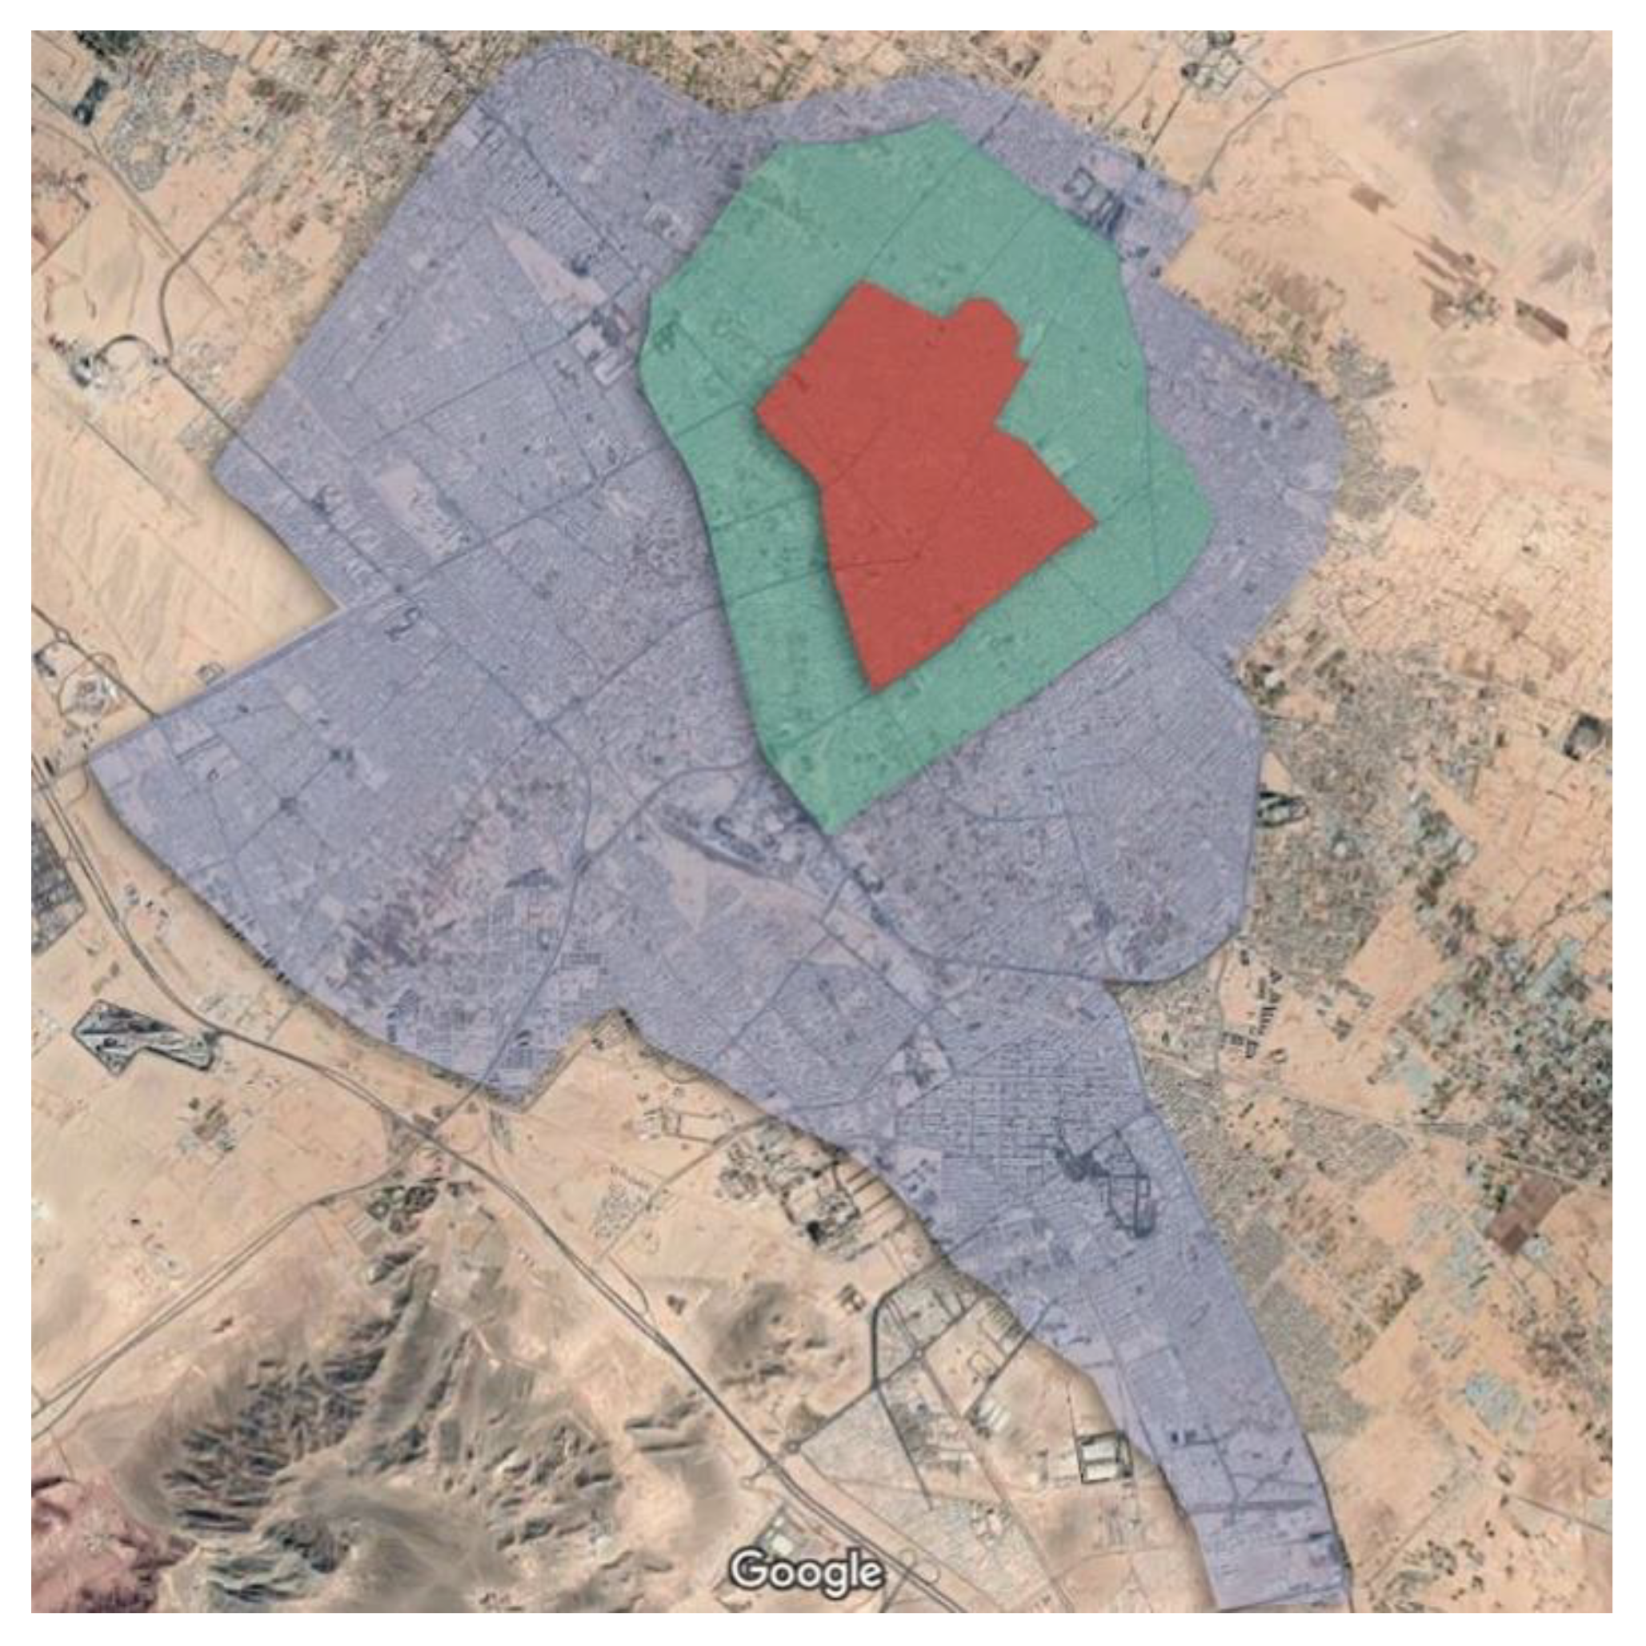
Every city in Iran has historic areas with thousands of typical residential buildings and many historic structures. Houses with courtyards are constructed and developed for a long time in hot-arid conditions. This approach has been used by most ancient cultures in central Iran and many other dry areas of the Middle East. The central courtyard is the most crucial element defining the spatial hierarchy of the houses of the Central Plateau of Iran. Without a courtyard, the spatial organization of the house will be disrupted [40,41,42].
In the period before industrialization and using mechanical and electrical facilities in the architectural space, living in harsh climates required creative architectural solutions to provide climatic comfort conditions. These arrangements appear in the form of construction patterns. The pattern of the central courtyard was one of the most basic passive architectural measures to provide climatic comfort in the hot and dry climate of the desert. The courtyard houses are important in the historical monuments of Iranian architecture and their role in providing climatic comfort conditions is a broad topic that has been conducted in numerous research. Therefore, it is beyond the scope of this article to investigate them, and we refer sources in this matter for more consideration [40,42,43,44,45,46,47,48].
A house without a central courtyard would be uninhabitable in this climate. A wide pond, a garden, and plants, and the placement of semi-open spaces around the open space of the courtyard are the essential components of the central courtyard. Accordingly, in this climate, the presence of a central courtyard in a building can be considered proof of its historicity. On the other hand, due to the fundamental change in the lifestyle in the contemporary period with the presence of machines and electrical and mechanical equipment, the pattern of building construction underwent a fundamental transformation. The construction of the building in this period was not compatible with the way of life of the people with the previous patterns such as the central courtyard, vast and windy underground spaces, and for this reason, houses with a central courtyard were not built in the new period [49]. Figure 1 illustrates a historical, non-historical, and transitional district in a historical city in Iran.
Therefore, in this period, the lack of a central courtyard is one of the signs of the newness of the building in the residential historical houses in a hot and dry area in Iran. In short, it can be said that one of the most important differences between the old building and the new building in residential historical cities is the presence or absence of a central courtyard. In confirmation of this content, refer to Figure 2, before interventions and changes in the structure of the city and houses in the contemporary period, all houses had a central courtyard [49]. This point is relevant to the residential historical buildings (Figure 3 and Figure 4) and the construction patterns are different in other buildings (e.g., the historical market, and baths).

1.3. Case Study

This research considers the city of Yazd as a case study. It is in the middle of the Iranian plateau, along with the Spice and Silk Routes, 270 km southeast of Isfahan. Yazd contains the largest continuous historical urban fabric of Iran [50] (Figure 5). Providing climatic comfort conditions in the warm seasons of the year has a decisive role in shaping the structure of the city and buildings. The most important strategies used to regulate climatic conditions are the city texture’s compactness and high density, giving shade with semi-open areas and porches, employing the center courtyard, using subterranean spaces, Badgirs (wind towers to channel the wind), and evaporative cooling [40,51]. The earthen architecture of Yazd has survived the modernization that has destroyed many typical earthen constructions [52]. It is evidence of the coexistence of natural resources with the environment. The historical zone of Yazd city has been a UNESCO World Heritage site since 2017.

1.4. Research Goals

Historical building recognition in airborne and satellite images is a subject that experimental researchers have worked on for several years. They focused on a small area and a limited number of buildings. Automated historical building recognition methods can help researchers in this task. In this paper, a CNN method for recognizing historical buildings in Yazd is tested. First, this paper seeks to demonstrate the hypothesis that deep learning can be used for the automated recognition of historic architectural features. The central courtyard of Iranian dwellings is one of those features. The second goal is to determine the pattern of recognizing historic buildings versus non-historic buildings in the city of Yazd. Furthermore, the automatic classification of publicly accessible airborne and satellite images such as google earth is used in this research.
Moreover, given the gain in knowledge, this article tries to add new insights into how to distinguish traditional buildings from non-traditional buildings by programming methods. The result of this research can serve as a guide for determining and identifying the historical structures in other cities by providing empirical evidence of historical houses in Yazd as a case study. This issue is important because the exact area and number of valuable historical building structures in many historical cities of Iran have not been identified yet. Accordingly, the main question of this research is: How can we use new technology to quickly and without field operations gather comprehensive and quantitative knowledge of the historical building of Iranian cities that are characterized by houses with central courtyards? Therefore, documentation of historical courtyard houses for more accurate conservation is the main purpose of identifying historic houses in a context of architectural heritage.

2. Materials and Methods

2.1. Airborne and Satellite Data

Compared to other sources of aerial and satellite imagery, Google Earth is the most accessible source. By using Google Earth images as material, this paper develops a method that researchers or students can use to recognize historic buildings in many cities. It is an accessible source for researchers in countries like Iran. By gathering data from other cities in Iran or the Middle East and using the transfer learning method, this deep learning model can develop and predict historic buildings in other areas such as historical cities in Iraq. Spatial resolution of Google Earth Imagery varies in different location on earth. It is around 15 m of resolution to 15 cm. Figure 6 demonstrates the historical and non-historical zones of the Yazd, from which we have gathered our dataset.

2.2. Deep Learning Workflow

Machine learning (ML) is the method of this study. The standard framework of ML includes data collection, pre-processing, model creation, and model validation. An annotated data set is generated based on ground-level truth data and expert judgment in data collection and pre-processing. Data pre-processing involves exploratory data analysis (EDA) to discover lost or inaccurate annotation instances. Data augmentation can be used to increase training data, and to prevent over-fitting. Data augmentation produces more training data from current training samples by random modifications such as rotating and flipping the images. The assessment process needs to be determined before model creation. During and after training, the performance of the model is measured and recorded in validation steps with some values such as accuracy percentage and loss function [4].

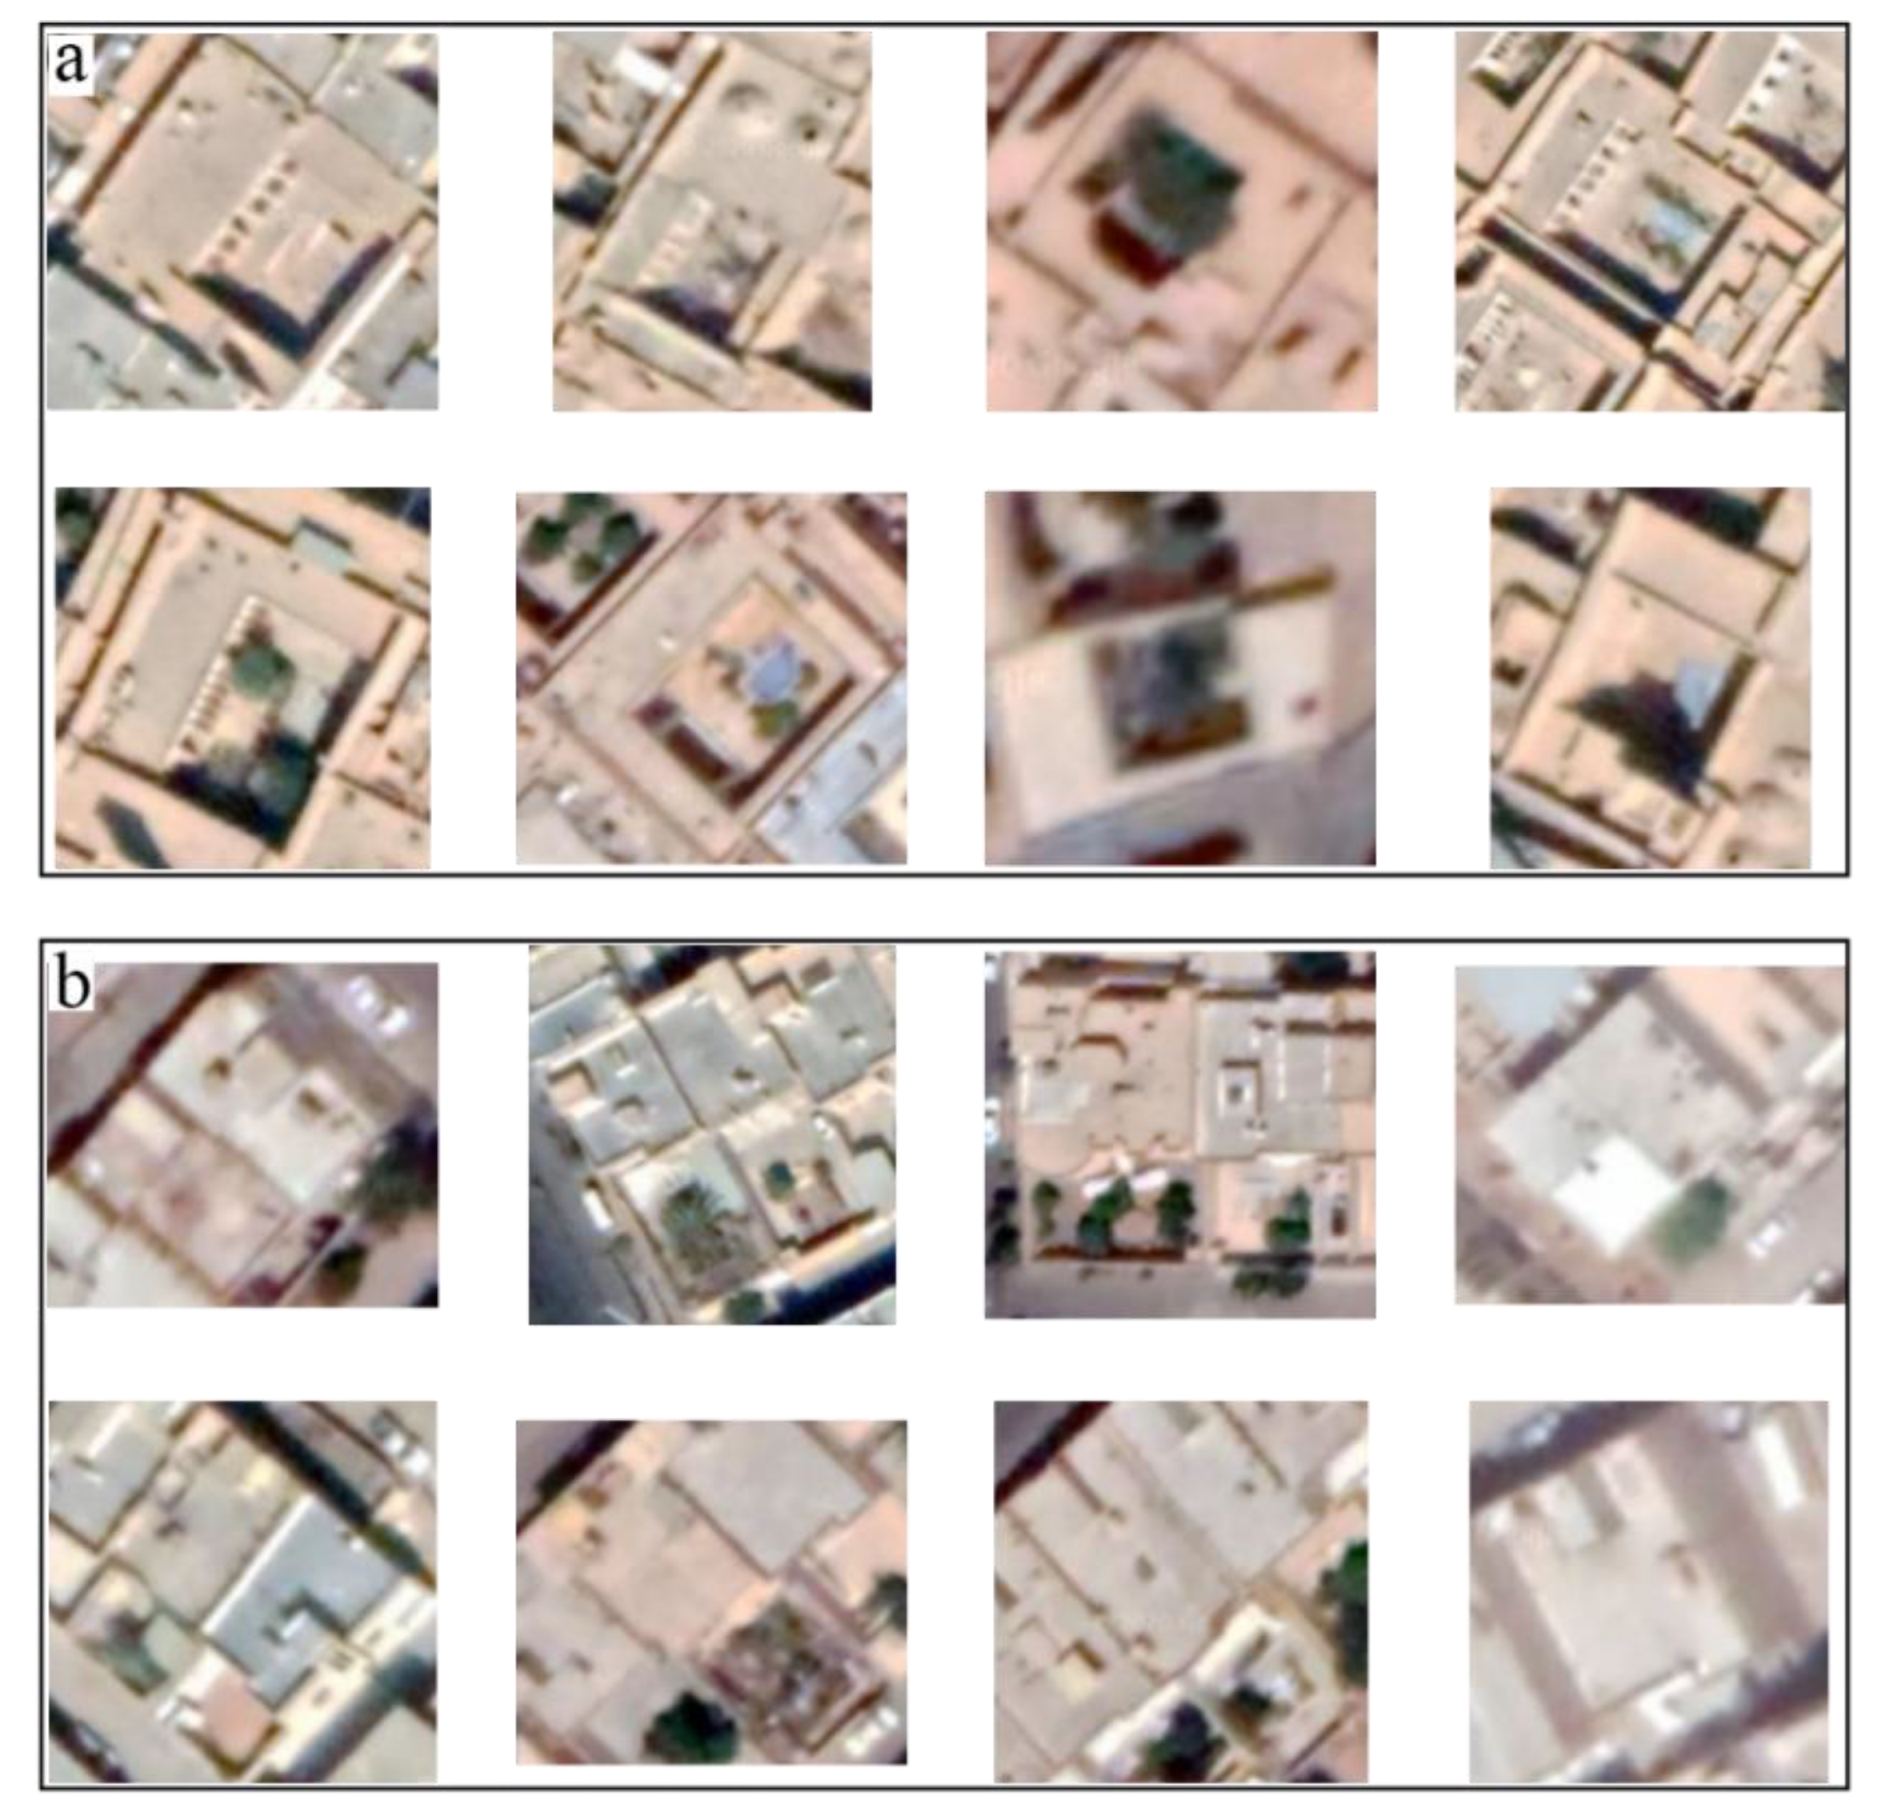
2.3. Data Gathering and Annotation

The authors gathered 1280 photos from two different zones (red and blue in Figure 6) of Yazd city and analyzed them accurately. The images of random houses are cropped manually from Google earth image and are labeled in two different categories. Figure 6 shows some samples of the cropped images. Half of the datasets are historical buildings (from red area), and the rest are non-historical buildings (from blue area). Therefore, the dataset was random data gathered throughout the city, which included all areas. The authors, who are historical architecture experts in Iran, cropped the images and labeled the houses as historical and non-historical for the training step. Therefore, data gathering was a time-demanding step of the project.
During the pre-processing, 20% of the dataset is separated randomly for validation data, and 80% is used for training the model. Thus, 1024 photos with two different labels (historic and non-historic) are distinguished for the training process. Data augmentation is a solution to the problem of the lack of data for training datasets in deep learning. This enhances the size and quality of the dataset [53]. Accordingly, we increased our dataset by data augmentation process. Image rotation by 40% and horizontal and vertical flipping were our settings for the data augmentation process. Shifting has not been used in data augmentation, because the rectangular form of the central courtyard is the main pattern for recognizing historical buildings. Figure 7 shows some examples of our data in two different labels and around 300×300 pixels. The most crucial feature in recognizing historical buildings is the central courtyard, as visible in the examples. However, in most historical houses in Yazd, there is some slight arch or a small basin.

2.4. Convolutional Neural Networks

In this article, a binary classification model based on CNNs is proposed to recognize features of historic buildings in Google Earth images. Convolutional neural networks are biologically inspired networks used in computer vision for image recognition and object detection. In the framework of the convolutional neural network architecture, each layer of the network is 3-dimensional, with a spatial dimension and depth corresponding to the number of features. The notion of depth of a single layer in a convolutional neural network is distinguished from depth in terms of the number of layers. In the input layer, these features correspond to the RGB color channels.
Moreover, in the hidden channels, these patterns reflect hidden feature maps that encode different shapes in the image. The input layer will have a depth of one if the input is grayscale, but later layers will still be 3-dimensional [54]. Deep convolutional neural networks have been used as an effective model in computer vision. For example, they are commonly used for image processing, object recognition, object location, and even text classification. Recently, this network’s efficiency surpassed that of humans in the issue of image classification [55]. Figure 8 shows one of the earliest convolutional neural networks.
Deep convolutional neural networks, abbreviated as CNNs or ConvNets, are a particular category of neural networks specializing in the processing of grid-like topology data, such as images. In CNN, a convolutional layer is responsible for adding one or more filters to the data. Some layers separate convolutional neural networks from all other neural networks. Each convolutional layer includes one or more filters, known as convolutional kernels. Pooling layers help minimize the dimensionality of the input features, thereby reducing the maximum number of parameters and the complexity of the model. One of the most commonly used methods for pooling is max pooling. As the title implies, this strategy only takes the most out of the pool [56]. Figure 9 demonstrates two kinds of layers that are used in our model. Conv2d and Max-pooling2d are the CNNs layers repeated five times in our model to change the images 300 × 300 to pictures 7×7 and find the patterns in the photos.
The neural network structure is made up of simultaneous convolutional layers l € [1, L]. For each convolutional layer l, the input data map (image) is convoluted by a series of kernels W l = W 1 , ,   W k and b l = b 1 , ,   b k to produce a new feature map. The non-linear activation function f is then added to this feature map to produce the output Y l , which is, the following layer input. The nth function of the output map of the l th layer could be described in Equation (1) [4]:
Y l n = f     k = 1 k W l n . k ×   Y l 1 k +   b l n

2.5. TensorFlow

TensorFlow is commonly used as a library for machine learning applications. It has been developed by Google as a part of the Google Brain initiative and then was made accessible as an open-source product [56]. It has various machine learning and deep learning applications catching users’ interest. Due to the open-source accessibility, ever more users in artificial intelligence (AI) and machine learning fields have been able to implement TensorFlow and create products and features on top of it. It does not only enable consumers to incorporate default machine learning and deep learning algorithms but also encourages users to apply tailored and differentiated models of algorithms for business applications and numerous scientific activities. This quickly became one of the most important libraries in the machine learning and AI fields, mainly because developers were creating many applications using TensorFlow in their programs. Primarily this probably happened because Google includes TensorFlow in many of its apps, including Google Maps, Gmail, and even other applications [56]. We used the TensorFlow library for modeling our CNNs in Python and running the program on the Google Colab online platform. Google Colab uses a GPU accelerator to run the program faster, especially in running a computer vision code. The total codes of the program, from pre-processing to the examination of the model, are accessible in the first author’s Github account in Supplementary Materials.

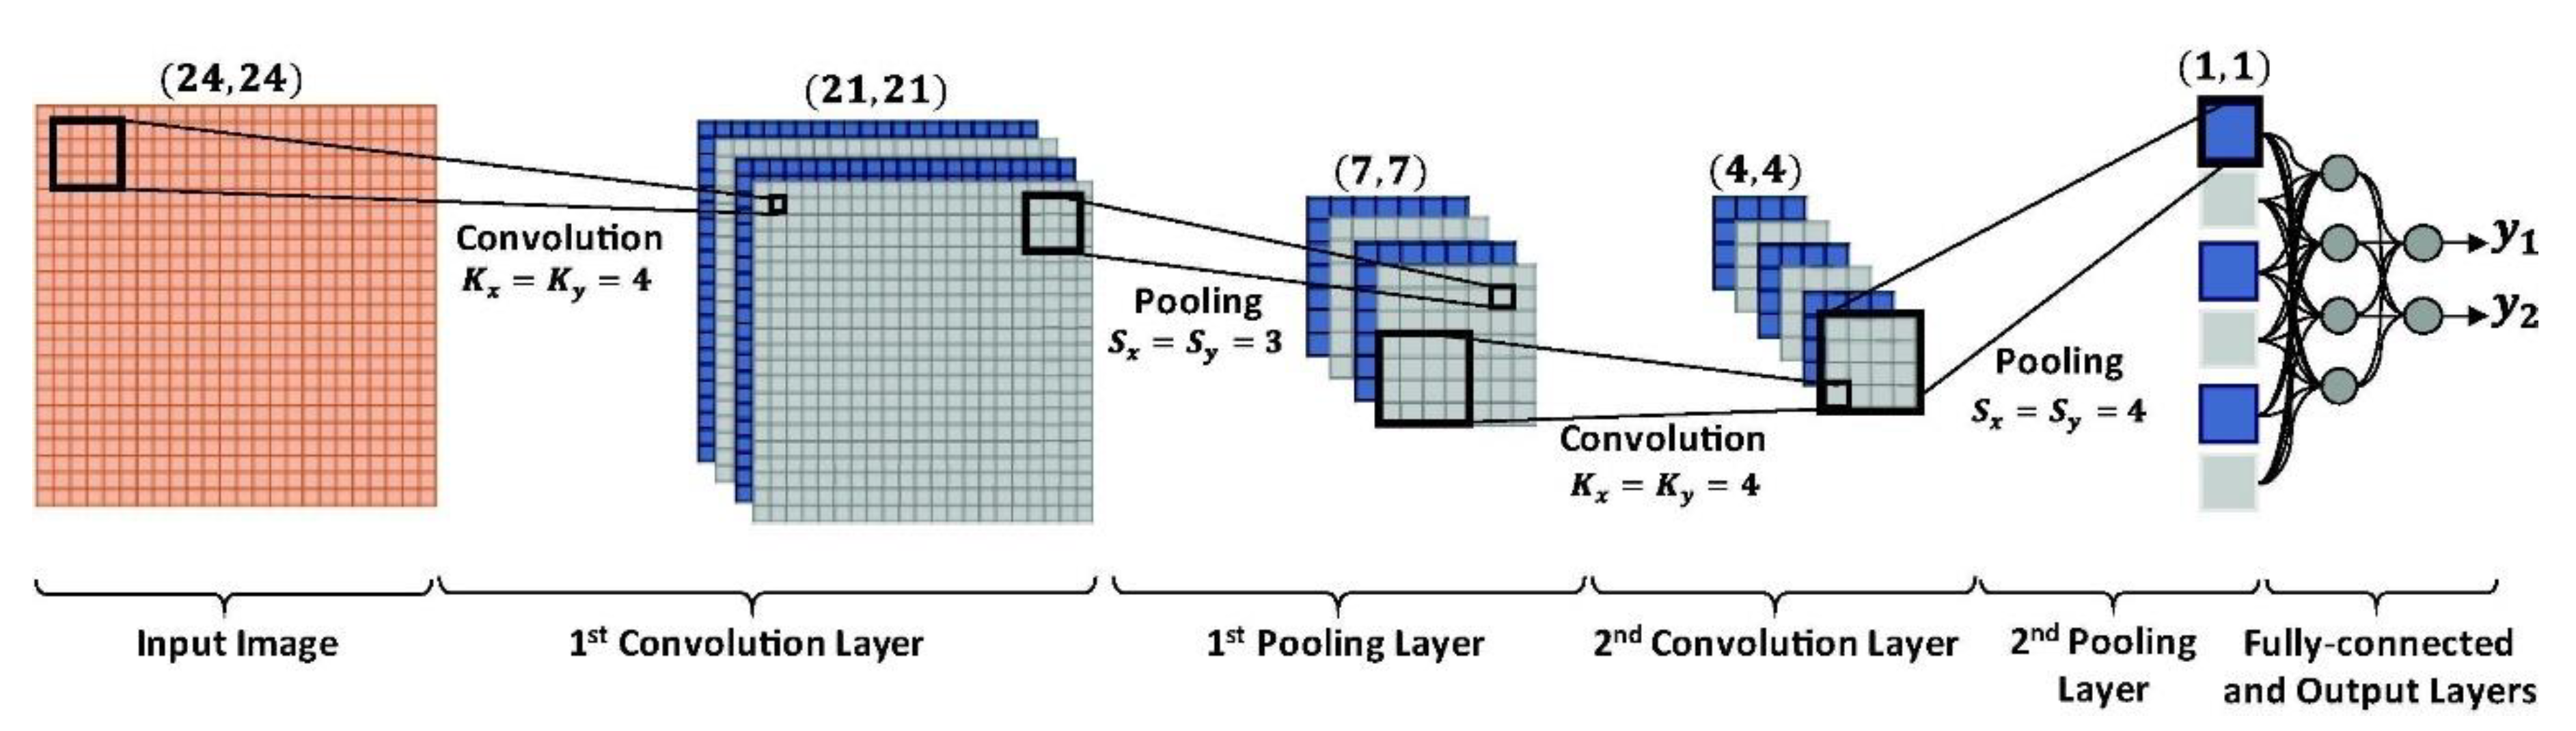
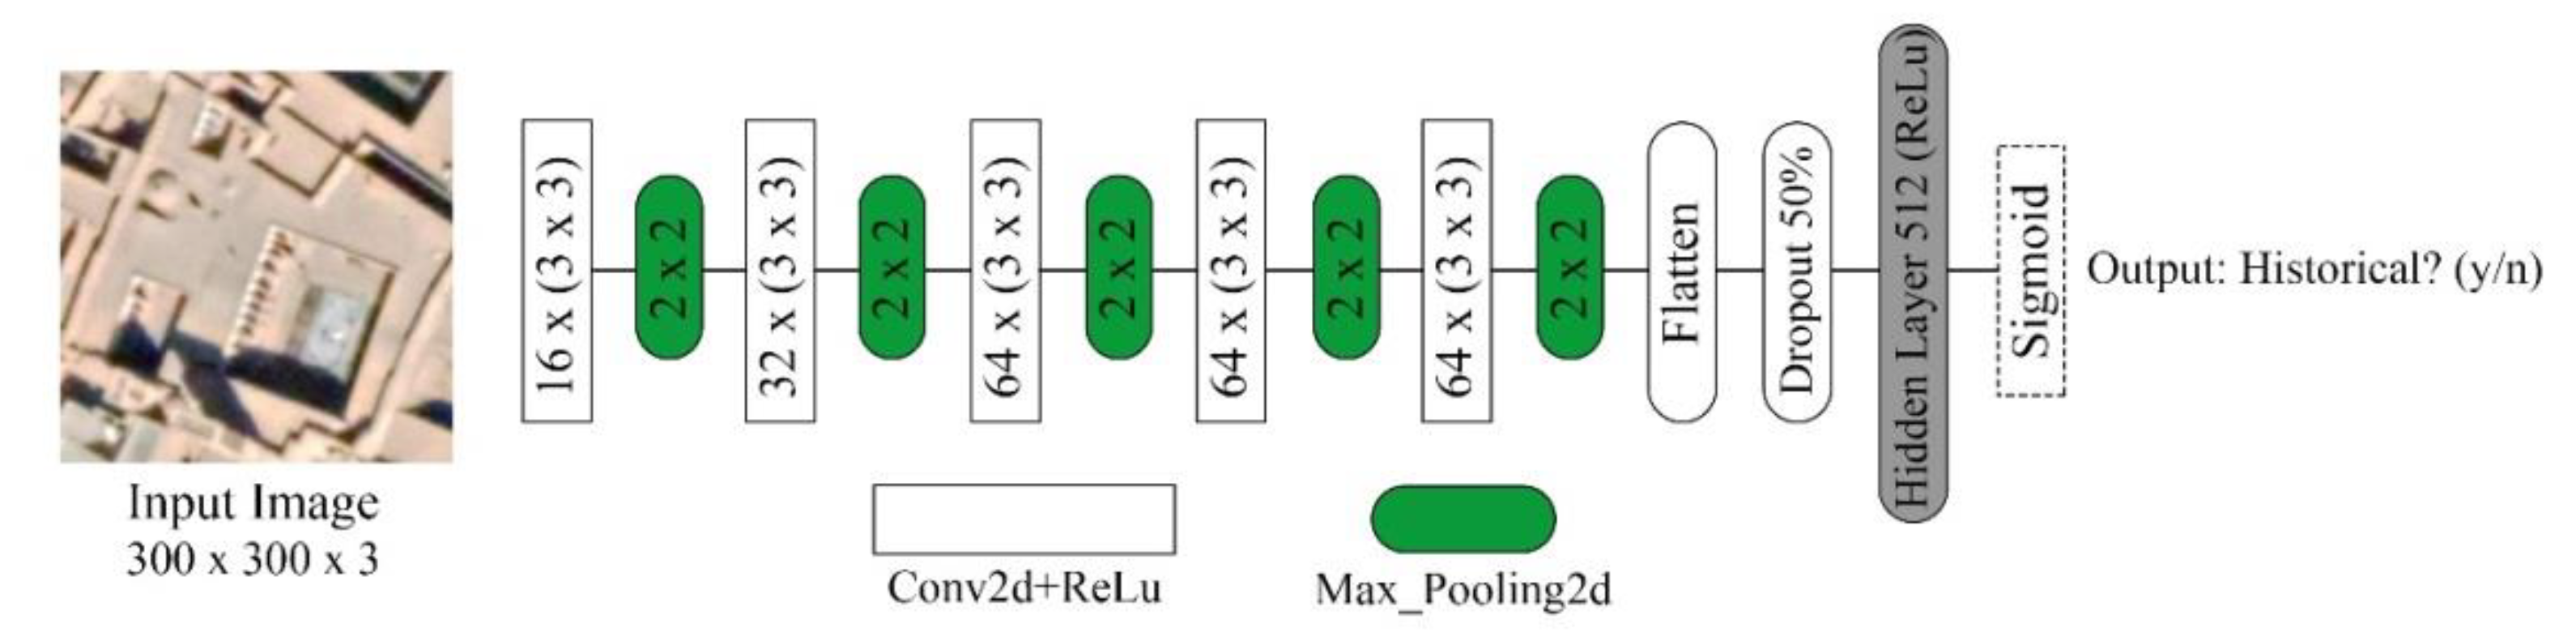
2.6. Network Architecture
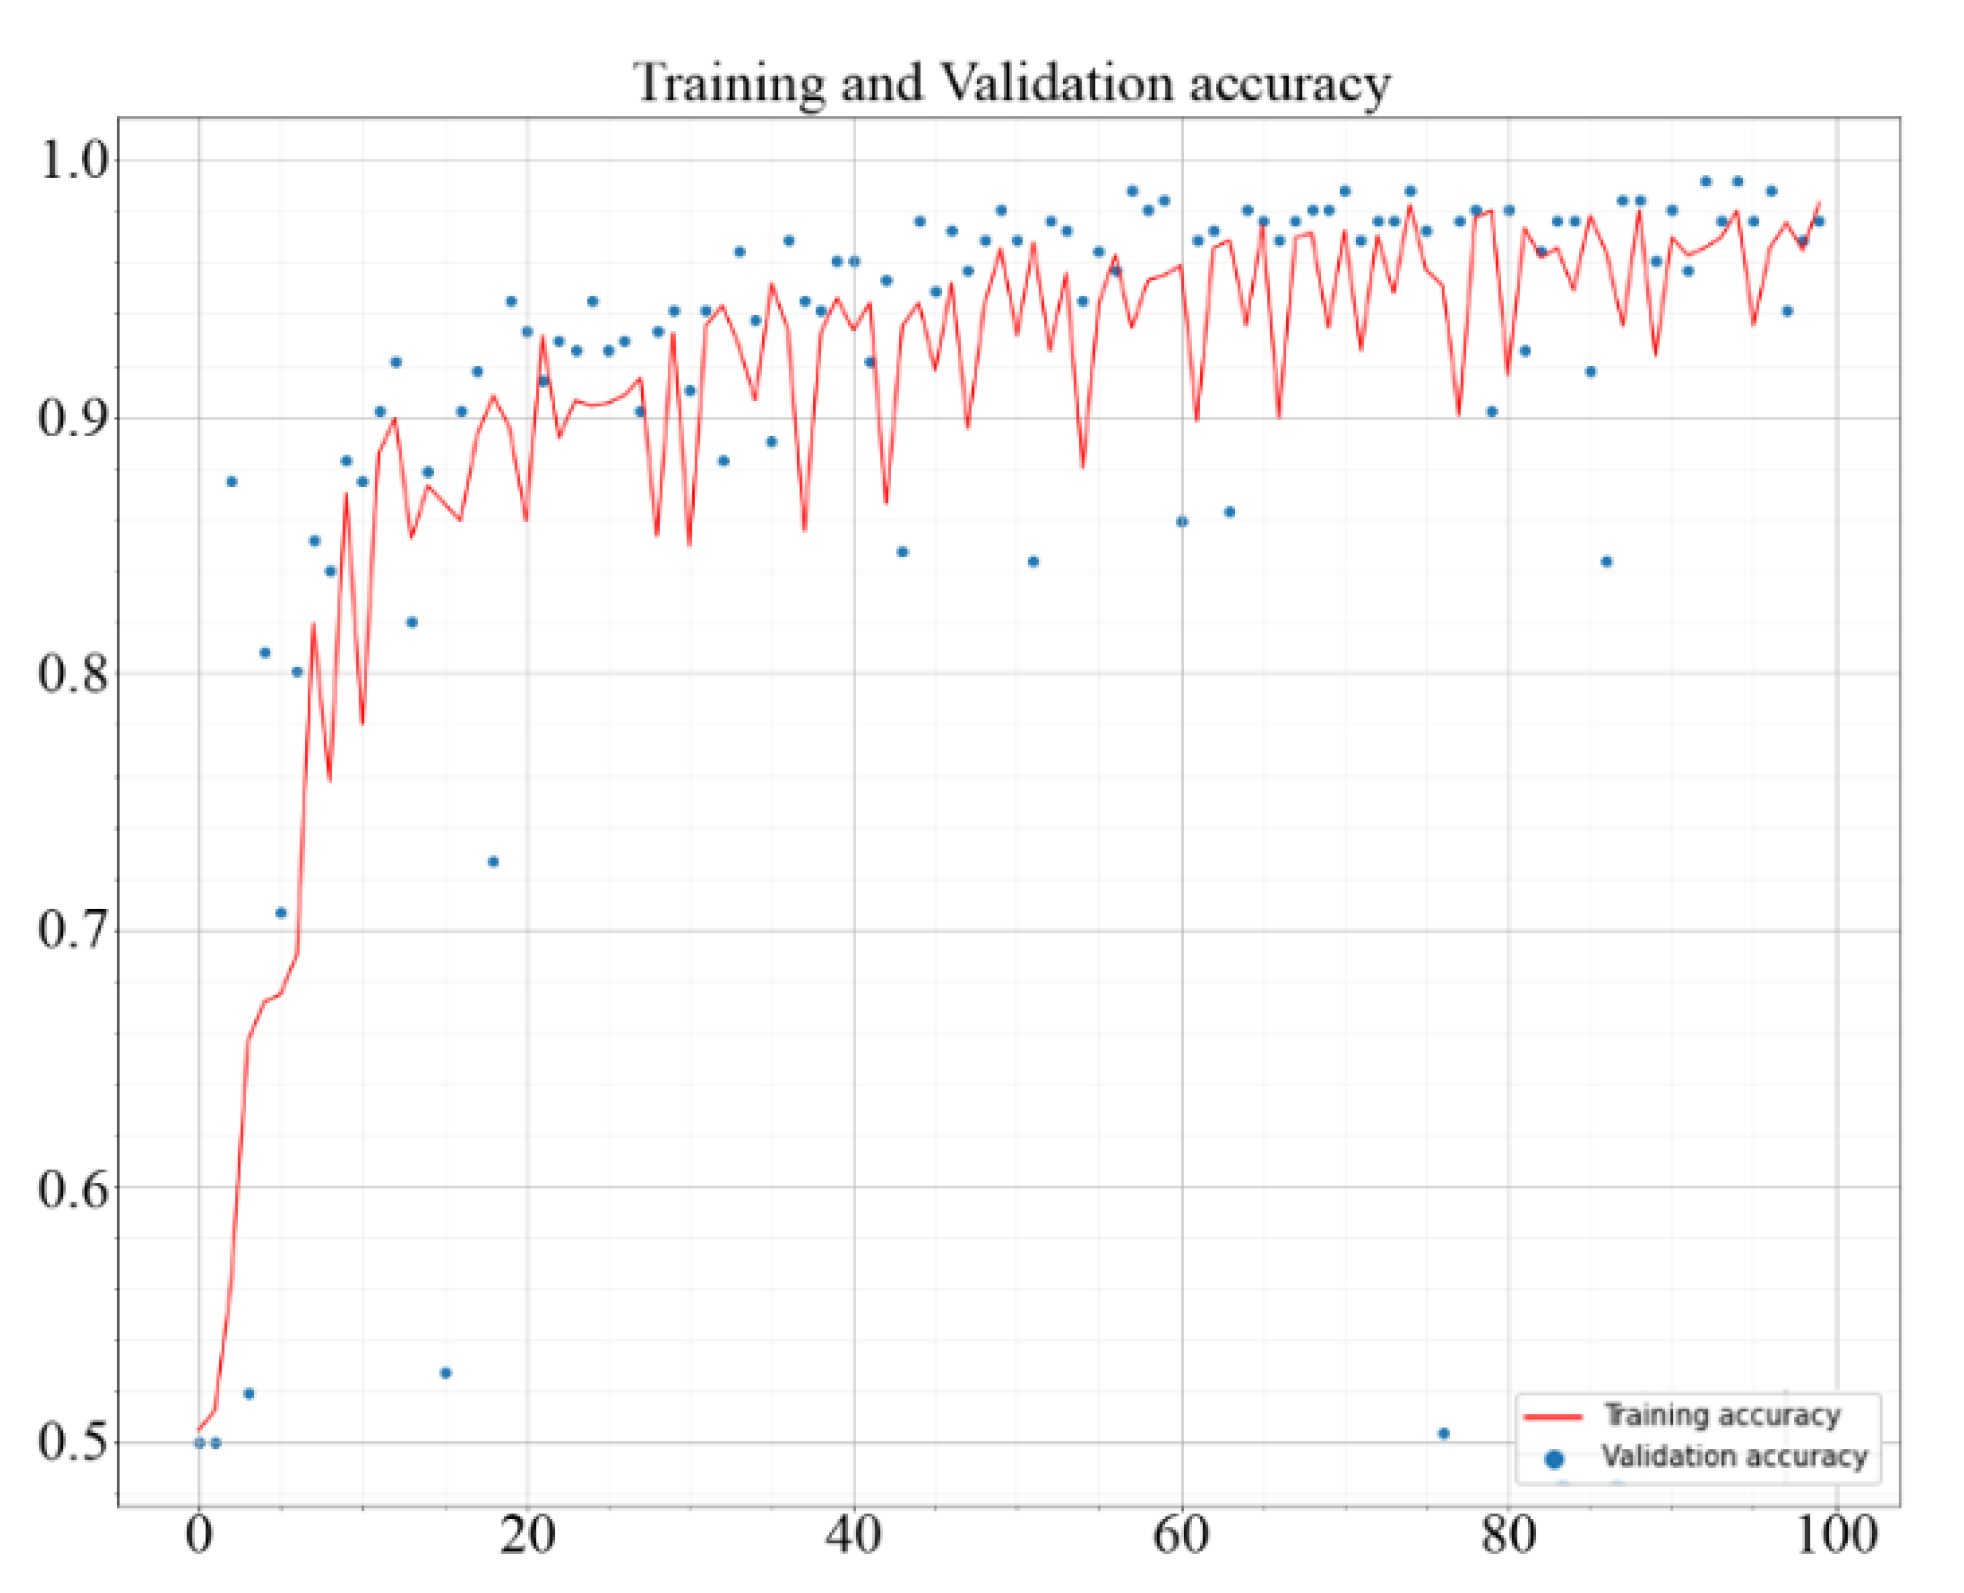
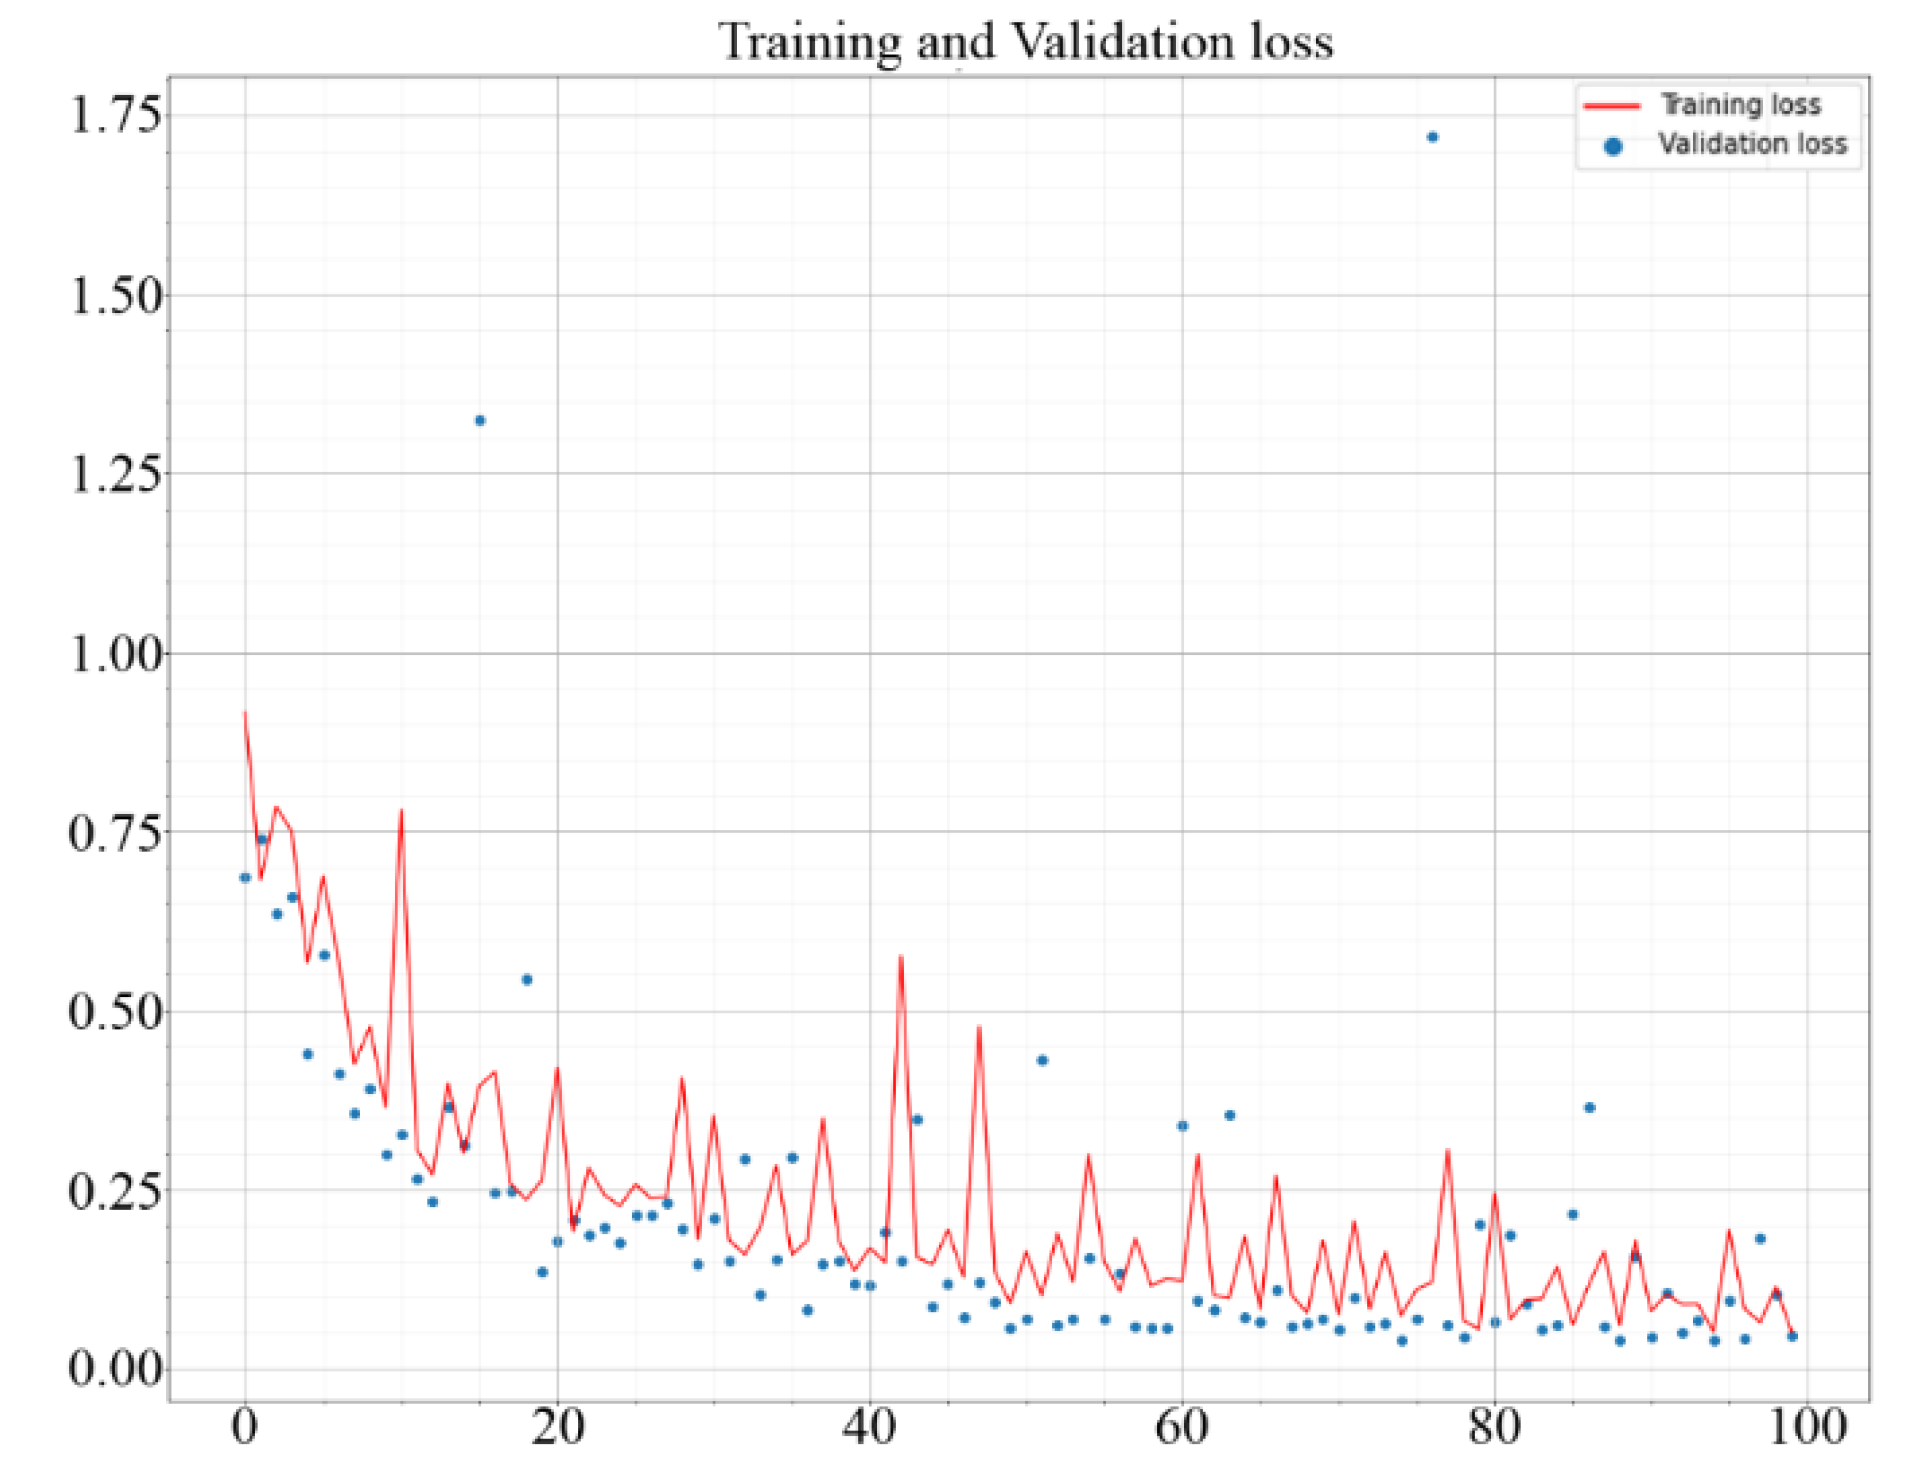
Figure 10 provides a graphic outline of the classification CNN for historical and non-historical buildings in aerial images, containing fourteen layers, five max layers, and five convolution layers. This is a self-built structure by author, whose major parameters such as size of convolutional cores, padding size, and layer types are common settings in image classification. A few other parameters, such as the number of convolutional layers, are based on the input image features. The aim of this paper is not finding an optimized CNN network. Current architecture fulfills accuracy requirements for identifying the historical houses. So, no other architecture is tested for comparison regarding efficiency and accuracy.
In this CNN network, convolutional layers have been implemented without padding, whereas max-pooling layers have halved the scale of the input. The variable size and number of the kernels were described for every respective box. In the network architecture, each convolution layer has a kernel size of (3 × 3). As the input of network architecture has been a colored image, the number of channels for the first layer is three. After every convolutional layer, the rectified linear unit (ReLu) f (x) = max (0, x) has been used as a nonlinear activation function. However, in the last layer, the Sigmoid Function S(x) = e x   e x + 1 has been used to map the output to a probability class between 0 and 1, in which 1 means a historic label and 0 indicates a non-historical label. There have been five max-pooling layers of size 3 × 3 in the network architecture. The network has a total of 1,704,097 trainable parameters. The network input is a Google Earth image map 300 × 300 × 3. Thus, the output is a single-number binary layer.

2.7. Training

During the training of the proposed network, the goal was to reduce the loss function of the samples showing the efficiency of the classification of the training images. We have used the Binary_Crossentropy method to calculate the loss function of all training datasets. The loss function H for N training examples can be described as in Equation (2):
H p q = 1 N   i = 1 N y i × log ( p ( y i ) ) + 1 y i × log 1 p y i
In which y is the label of each training image (0 or 1) and p(y) is the algorithm’s response to a particular image. The mean value of all loss functions of images is also known as cross-function. The Binary_Crossentropy loss function model is a solution for binary classification tasks such as our historical or non-historical classification model. To optimize the W and b values in Equation (1), we have used the RMSprop gradient descent algorithm for each epoch. RMSprop has been introduced in the Keras system (https:/github.com/keras-team/keras), and we set the initial learning rate at 0.001. To avoid over-fitting, we used a 0.5 probability drop-out layer on the CNN model in front of the hidden layer in addition to augmentation. We have training data, which was a 300 × 300 × 3 pixels’ 3D patch. Color image data is encoded as integers in a set of 0–255 by each red, green, and blue. We divided each pixel value by 255 to scale the data to a range of [0, 1] because the neural networks function best with a limited relatively homogeneous value range. We used 100 as the overall number of epochs for learning and performance measurements to control the over-fitting and efficiency of the model during training. In each epoch, the machine is trained by the samples of the datasets. Furthermore, the loss function is calculated at the end of all training. The machine tries to reduce the loss in the next epoch. The loss function will be less relatively in each epoch when the training procedure is going well.

3. Results and Discussion

The outcome of the classification model is recognizing the historical and non-historical houses in aerial images like in Figure 7. After evaluating the deep learning model by test dataset, Figure 11 illustrates the accuracy of the trained model in percentage for 100 epochs. After each epoch, the model is tested with validation data, and accuracy is calculated with it. Usually, the accuracy of the validation dataset is less than the accuracy of training data. Moreover, the difference between training and validation accuracy is around 1% in the last epoch in this model. The increasing rate of the training and validation accuracy shows that the model is trained well and there is no over-fitted in the training data. The model’s accuracy in the last epoch is around 98%, which shows an excellent trained model. As illustrated in Figure 12, the training and validation loss function is decreasing during the training of the model, and it reached around 0.05 in the last epoch. The Loss function here is the mean of loss function of all training images, and it is essential for evaluating the model and monitoring the training process to avoid over-fitting.
The Confusion Matrix is a method for evaluating the result of the model on the validation dataset. It is a 2 × 2 matrix, which shows four numbers. The four numbers in the matrix represent True Positive, False Positive, True Negative, and False Negative. Positive means the image is signified as a historical building and Negative is predicted as a non-historical. In addition, True means images are indicated correctly, and False represents erroneous predictions. So, our model is trained and works better if we have more amounts for True Positive and True Negative and less for False Positive and False Negative. Table 1 shows the Confusion Matrix of 256 validation images, which were not seen by the machine before. The amount of True Positive is 127, and True Negative is 123. It shows that 250 of 256 images are predicted correctly.
To sum up, we gathered our dataset from satellite and airborne Google earth images in Yazd city. The dataset was 1280 samples of historical and non-historical houses. Next, we split 20% of them as a validation dataset and the rest as a training dataset. The convolutional neural network, a binary CNN for recognizing historical and non-historical features, was trained by our datasets in 100 epochs. Finally, we could train the model with around 98% accuracy and 0.05 losses by training and the validation dataset without over-fitting. The first limitation of the project was historical buildings with different functions such as bazars and baths. These buildings do have not a central courtyard because of their different functions. Therefore, the developed method in this study may recognize them as non-historical buildings. Second, gathering data was an essential and time-demanding part of this project. Finally, the limitations of applying the results and method of this in other cities with a central courtyard construction pattern are as follows: Covering the yards with tents in the hot seasons with traditional techniques, The presence of plants in the yard, new buildings with a central courtyard in imitation of old buildings.

4. Conclusions

Recognizing the historical houses in low-quality aerial images is a time-consuming and problematic issue for any researchers who are working on historical cities. Therefore, the contribution of this study to the planning community and urban designers, restorers, and architects has provided new experimental studies on the use of interdisciplinary sciences in developing a method to distinguish historical from non-historical houses.
This research has shown that deep learning can be correctly trained by a relatively small image dataset for automated recognition of historical and non-historical buildings. Therefore, recognizing historical architectural features in the Middle East’s hot and dry cities is possible because of some unique signatures of the houses in these areas, such as the central courtyards. After a time-consuming gathering of 1280 samples, data augmentation was necessary to avoid over-fitting and better performance. Data augmentation and transfer learning could be the best methods for solving the problem of small datasets in historical architecture and heritage study tasks. This approach can be generalized in two aspects. First, ability in identifying the historical periods of houses. Second, adoption to different building’s styles and geolocations. Therefore, it would be better to use models trained in historical architecture tasks for future projects. We also suggest that future studies improve this method in such a way that quantitative data can be extracted by analyzing aerial photographs. The above research makes it possible to compare the characteristics of architectural styles in different historical periods of a city. It also provides a comprehensive cognition based on accurate statistics and numbers of the main features shaping the city structure.

Supplementary Materials

The following supporting information can be downloaded at: https://www.mdpi.com/article/10.3390/heritage5040159/s1. The classification training codes.

Author Contributions

Conceptualization, H.Y.; data curation, H.Y.; formal analysis, H.Y.; methodology, H.Y.; project administration, H.Y. and S.M.; resources, H.Y.; software, H.Y.; supervision, S.M.; validation, H.Y.; visualization, H.Y.; writing—original draft, H.Y.; writing—review and editing, H.Y., S.S.B., F.L. and S.M. All authors have read and agreed to the published version of the manuscript.

Funding

This research received no external funding.

Data Availability Statement

The deep learning model codes in this paper are accessible via https://github.com/hadi-yazdi/historical_houses_recognition. The image classification training codes consist of the final trained models and the validation.

Acknowledgments

The authors also express their gratitude to Hassan Bassereh, for his support and assistance with this research.

Conflicts of Interest

The authors declare no conflict of interest.

References

  1. Krizhevsky, A.; Sutskever, I.; Hinton, G.E. ImageNet Classification with Deep Convolutional Neural Networks. Commun. ACM 2017, 60, 84–90. [Google Scholar] [CrossRef] [Green Version]
  2. Bennett, R.; Cowley, D.; Laet, V.D. The Data Explosion: Tackling the Taboo of Automatic Feature Recognition in Airborne Survey Data. Antiquity 2014, 88, 896–905. [Google Scholar] [CrossRef]
  3. Leisz, S.J. An Overview of the Application of Remote Sensing to Archaeology During the Twentieth Century. In Mapping Archaeological Landscapes from Space; Comer, D.C., Harrower, M.J., Eds.; SpringerBriefs in Archaeology; Springer: New York, NY, USA, 2013; pp. 11–19. ISBN 978-1-4614-6074-9. [Google Scholar]
  4. Soroush, M.; Mehrtash, A.; Khazraee, E.; Ur, J.A. Deep Learning in Archaeological Remote Sensing: Automated Qanat Detection in the Kurdistan Region of Iraq. Remote Sens. 2020, 12, 500. [Google Scholar] [CrossRef] [Green Version]
  5. Krizhevsky, A.; Sutskever, I.; Hinton, G.E. ImageNet Classification with Deep Convolutional Neural Networks. In Advances in Neural Information Processing Systems 25; Pereira, F., Burges, C.J.C., Bottou, L., Weinberger, K.Q., Eds.; Curran Associates, Inc.: Red Hook, NY, USA, 2012; pp. 1097–1105. [Google Scholar]
  6. Girshick, R.; Donahue, J.; Darrell, T.; Malik, J. Region-Based Convolutional Networks for Accurate Object Detection and Segmentation. IEEE Trans. Pattern Anal. Mach. Intell. 2016, 38, 142–158. [Google Scholar] [CrossRef]
  7. Szegedy, C.; Toshev, A.; Erhan, D. Deep Neural Networks for Object Detection. In Proceedings of the 26th International Conference on Neural Information Processing Systems—Volume 2, Lake Tahoe, NV, USA, 5–10 December 2013; Curran Associates Inc.: Red Hook, NY, USA, 2013; pp. 2553–2561. [Google Scholar]
  8. Yazdi, H.; Vukorep, I.; Banach, M.; Moazen, S.; Nadolny, A.; Starke, R.; Bazazzadeh, H. Central Courtyard Feature Extraction in Remote Sensing Aerial Images Using Deep Learning: A Case-Study of Iran. Remote Sens. 2021, 13, 4843. [Google Scholar] [CrossRef]
  9. Mnih, V.; Hinton, G. Learning to Label Aerial Images from Noisy Data. In Proceedings of the 29th International Coference on International Conference on Machine Learning, Scotland, UK, 26 June–1 July 2012; Omnipress: Madison, WI, USA, 2012; pp. 203–210. [Google Scholar]
  10. Gao, F.; Huang, T.; Wang, J.; Sun, J.; Hussain, A.; Yang, E. Dual-Branch Deep Convolution Neural Network for Polarimetric SAR Image Classification. Appl. Sci. 2017, 7, 447. [Google Scholar] [CrossRef] [Green Version]
  11. Maltezos, E.; Protopapadakis, E.; Doulamis, N.; Doulamis, A.; Ioannidis, C. Understanding Historical Cityscapes from Aerial Imagery Through Machine Learning. In Proceedings of the Digital Heritage. Progress in Cultural Heritage: Documentation, Preservation, and Protection, Nicosia, Cyprus, 29 October–3 November 2018; Ioannides, M., Fink, E., Brumana, R., Patias, P., Doulamis, A., Martins, J., Wallace, M., Eds.; Springer International Publishing: Cham, Switzerland, 2018; pp. 200–211. [Google Scholar]
  12. Zech, M.; Ranalli, J. Predicting PV Areas in Aerial Images with Deep Learning. In Proceedings of the 2020 47th IEEE Photovoltaic Specialists Conference (PVSC), Calgary, ON, Canada, 15 June–1 August 2020; pp. 0767–0774. [Google Scholar]
  13. Wang, Z.; Wang, Z.; Majumdar, A.; Rajagopal, R. Identify Solar Panels in Low Resolution Satellite Imagery with Siamese Architecture and Cross-Correlation. In NeurIPS 2019 Workshop on Tackling Climate Change with Machine Learning; 2019; Available online: https://www.climatechange.ai/papers/neurips2019/28 (accessed on 3 November 2020).
  14. Li, C.; Min, X.; Sun, S.; Lin, W.; Tang, Z. DeepGait: A Learning Deep Convolutional Representation for View-Invariant Gait Recognition Using Joint Bayesian. Appl. Sci. 2017, 7, 210. [Google Scholar] [CrossRef] [Green Version]
  15. Tajbakhsh, N.; Shin, J.Y.; Gurudu, S.R.; Hurst, R.T.; Kendall, C.B.; Gotway, M.B.; Liang, J. Convolutional Neural Networks for Medical Image Analysis: Full Training or Fine Tuning? IEEE Trans. Med. Imaging 2016, 35, 1299–1312. [Google Scholar] [CrossRef] [Green Version]
  16. Pedraza, A.; Bueno, G.; Deniz, O.; Cristóbal, G.; Blanco, S.; Borrego-Ramos, M. Automated Diatom Classification (Part B): A Deep Learning Approach. Appl. Sci. 2017, 7, 460. [Google Scholar] [CrossRef] [Green Version]
  17. Gao, Y.; Lee, H.J. Local Tiled Deep Networks for Recognition of Vehicle Make and Model. Sensors 2016, 16, 226. [Google Scholar] [CrossRef]
  18. Sa, I.; Ge, Z.; Dayoub, F.; Upcroft, B.; Perez, T.; McCool, C. DeepFruits: A Fruit Detection System Using Deep Neural Networks. Sensors 2016, 16, 1222. [Google Scholar] [CrossRef] [PubMed] [Green Version]
  19. Liu, L.; Wang, H.; Wu, C. A Machine Learning Method for the Large-Scale Evaluation of Urban Visual Environment. arXiv 2016, arXiv:1608.03396 [cs]. [Google Scholar]
  20. Goel, A.; Juneja, M.; Jawahar, C.V. Are Buildings Only Instances? Exploration in Architectural Style Categories. In Proceedings of the Eighth Indian Conference on Computer Vision, Graphics and Image Processing, Mumbai, India, 16–19 December 2012; Association for Computing Machinery: New York, NY, USA, 2012; pp. 1–8. [Google Scholar]
  21. Zhang, L.; Song, M.; Liu, X.; Sun, L.; Chen, C.; Bu, J. Recognizing Architecture Styles by Hierarchical Sparse Coding of Blocklets. Inf. Sci. 2014, 254, 141–154. [Google Scholar] [CrossRef]
  22. Chu, W.-T.; Tsai, M.-H. Visual Pattern Discovery for Architecture Image Classification and Product Image Search. In Proceedings of the 2nd ACM International Conference on Multimedia Retrieval, Hong Kong, China, 5–8 June 2012; Association for Computing Machinery: New York, NY, USA, 2012; pp. 1–8. [Google Scholar]
  23. Yazdi, H.; Vukorep, I.; Bazazzadeh, H. The Methods of Deep Learning and Big Data Analysis in Promoting Sustainable Architecture. IOP Conf. Ser.: Earth Environ. Sci. 2022, 1078, 012136. [Google Scholar] [CrossRef]
  24. Fu, G.; Liu, C.; Zhou, R.; Sun, T.; Zhang, Q. Classification for High Resolution Remote Sensing Imagery Using a Fully Convolutional Network. Remote Sens. 2017, 9, 498. [Google Scholar] [CrossRef] [Green Version]
  25. Xu, Y.; Wu, L.; Xie, Z.; Chen, Z. Building Extraction in Very High Resolution Remote Sensing Imagery Using Deep Learning and Guided Filters. Remote Sens. 2018, 10, 144. [Google Scholar] [CrossRef] [Green Version]
  26. Abed, M.H.; Al-Asfoor, M.; Hussain, Z.M. Architectural heritage images classification using deep learning with CNN [Paper presentation]. In Proceedings of the 2nd International Workshop on Visual Pattern Extraction and Recognition for Cultural Heritage Understanding, Bari, Italy, 29 January 2020. [Google Scholar]
  27. Demir, G.; Çekmiş, A.; Yeşilkaynak, V.B.; Unal, G. Detecting Visual Design Principles in Art and Architecture through Deep Convolutional Neural Networks. Autom. Constr. 2021, 130, 103826. [Google Scholar] [CrossRef]
  28. Oses, N.; Dornaika, F.; Moujahid, A. Image-Based Delineation and Classification of Built Heritage Masonry. Remote Sens. 2014, 6, 1863–1889. [Google Scholar] [CrossRef] [Green Version]
  29. Mathias, M.; Martinovic, A.; Weissenberg, J.; Haegler, S.; Van Gool, L. Automatic Architectural Style Recognition. ISPRS—Int. Arch. Photogramm. Remote Sens. Spat. Inf. Sci. 2012, XXXVIII-5/W16, 171–176. [Google Scholar] [CrossRef] [Green Version]
  30. Shalunts, G.; Haxhimusa, Y.; Sablatnig, R. Architectural Style Classification of Building Facade Windows. In Proceedings of the Advances in Visual Computing, Las Vegas, NV, USA, 16–28 September 2011; Bebis, G., Boyle, R., Parvin, B., Koracin, D., Wang, S., Kyungnam, K., Benes, B., Moreland, K., Borst, C., DiVerdi, S., et al., Eds.; Springer: Berlin/Heidelberg, Germany, 2011; pp. 280–289. [Google Scholar]
  31. Llamas, J.; Lerones, P.M.; Zalama, E.; Gómez-García-Bermejo, J. Applying Deep Learning Techniques to Cultural Heritage Images Within the INCEPTION Project. In Digital Heritage. Progress in Cultural Heritage: Documentation, Preservation, and Protection; Ioannides, M., Fink, E., Moropoulou, A., Hagedorn-Saupe, M., Fresa, A., Liestøl, G., Rajcic, V., Grussenmeyer, P., Eds.; Springer International Publishing: Cham, Switzerland, 2016; pp. 25–32. [Google Scholar]
  32. Llamas, J.M.; Lerones, P.; Medina, R.; Zalama, E.; Gómez-García-Bermejo, J. Classification of Architectural Heritage Images Using Deep Learning Techniques. Appl. Sci. 2017, 7, 992. [Google Scholar] [CrossRef] [Green Version]
  33. Xu, Z.; Tao, D.; Zhang, Y.; Wu, J.; Tsoi, A.C. Architectural Style Classification Using Multinomial Latent Logistic Regression. In Computer Vision—ECCV 2014; Fleet, D., Pajdla, T., Schiele, B., Tuytelaars, T., Eds.; Springer International Publishing: Cham, Switzerland, 2014; pp. 600–615. [Google Scholar]
  34. Lambers, K.; Verschoof-van der Vaart, W.B.; Bourgeois, Q.P.J. Integrating Remote Sensing, Machine Learning, and Citizen Science in Dutch Archaeological Prospection. Remote Sens. 2019, 11, 794. [Google Scholar] [CrossRef]
  35. Vaart, W.B.V.der; Lambers, K. Learning to Look at LiDAR: The Use of R-CNN in the Automated Detection of Archaeological Objects in LiDAR Data from the Netherlands. J. Comput. Appl. Archaeol. 2019, 2, 31–40. [Google Scholar] [CrossRef] [Green Version]
  36. Kiranyaz, S.; Avci, O.; Abdeljaber, O.; Ince, T.; Gabbouj, M.; Inman, D.J. 1D convolutional neural networks and applications: A survey. Mech. Syst. Signal Process. 2021, 151, 107398. [Google Scholar] [CrossRef]
  37. Lambers, K.; Zingman, I. Towards Detection of Archaeological Objects in High-Resolution Remotely Sensed Images: The Silvretta Case Study. In Archaeology in the Digital Era, II, Proceedings of the 40th Conference on Computer Applications and Quantitative Methods in Archaeology, Southampton, 26–30 March 2012; Amsterdam University Press: Amsterdam, The Netherlands, 2012. [Google Scholar]
  38. Cowley, D.; Palmer, R. Interpreting Aerial Images—Developing Best Practice. In Space Time and Place, Proceedings of the III International Conference on Remote Sensing in Archaeology, Tirucirapalli, India, 17–21 August 2009; Campana, S., Forte, M., Liuzza, C., Eds.; Archaeopress: Oxford, UK, 2020. [Google Scholar]
  39. Trier, Ø.D.; Pilø, L.H. Semi-Automatic Detection of Charcoal Kilns from Airborne Laser Scanning Data. In CAA 2016: Oceans of Data, Proceedings of the 44th Conference on Computer Applications and Quantitative Methods in Archaeology; Archaeopress: Oxford, UK, 2016. [Google Scholar]
  40. Keshtkaran, P. Harmonization Between Climate and Architecture in Vernacular Heritage: A Case Study in Yazd, Iran. Procedia Eng. 2011, 21, 428–438. [Google Scholar] [CrossRef] [Green Version]
  41. Mahdavinejad, M.; Yazdi, H. Daylightophil Approach towards High-Performance Architecture for Hybrid-Optimization of Visual Comfort and Daylight Factor in BSk. Int. J. Archit. Environ. Eng. 2017, 11, 1324–1327. [Google Scholar]
  42. Amiriparyan, P.; Kiani, Z. Analyzing the Homogenous Nature of Central Courtyard Structure in Formation of Iranian Traditional Houses. Procedia—Soc. Behav. Sci. 2016, 216, 905–915. [Google Scholar] [CrossRef] [Green Version]
  43. Zolfagharkhani, M.; Ostwald, M.J. The Spatial Structure of Yazd Courtyard Houses: A Space Syntax Analysis of the Topological Characteristics of the Courtyard. Buildings 2021, 11, 262. [Google Scholar] [CrossRef]
  44. Zarei, E.M.; Ashkezari, S.F.M.; Yari, M. The Investigation of the Function of the Central Courtyard in Moderating the Harsh Environmental Conditions of a Hot and Dry Climate (Case Study: City of Yazd, Iran). Spatium 2018, 1–9. [Google Scholar] [CrossRef]
  45. Soflaei, F.; Shokouhian, M.; Soflaei, A. Traditional Courtyard Houses as a Model for Sustainable Design: A Case Study on BWhs Mesoclimate of Iran. Front. Archit. Res. 2017, 6, 329–345. [Google Scholar] [CrossRef]
  46. Soflaei, F.; Shokouhian, M.; Mofidi Shemirani, S.M. Traditional Iranian Courtyards as Microclimate Modifiers by Considering Orientation, Dimensions, and Proportions. Front. Archit. Res. 2016, 5, 225–238. [Google Scholar] [CrossRef] [Green Version]
  47. Soflaei, F.; Shokouhian, M.; Mofidi Shemirani, S.M. Investigation of Iranian Traditional Courtyard as Passive Cooling Strategy (a Field Study on BS Climate). Int. J. Sustain. Built Environ. 2016, 5, 99–113. [Google Scholar] [CrossRef] [Green Version]
  48. Eiraji, J.; Namdar, S.A. Sustainable Systems in Iranian Traditional Architecture. Procedia Eng. 2011, 21, 553–559. [Google Scholar] [CrossRef]
  49. Noohi Tehrani, A. Morphology of Yazd Urban Textures and Their Comparison. J. Appl. Environ. Biol. Sci. 2016, 6, 71–82. [Google Scholar]
  50. Abouei, D.R. Conservation of Badgirs and Qanats in Yazd, Central Iran. In Proceedings of the 23th Conference en Passive and Low Energy Architecture, Geneve, Switzerland, 6–8 September 2006. [Google Scholar]
  51. Tavassoli, M. Urban Structure and Architecture in the Hot Arid Zone of Iran; University of Tehran Press: Tehran, Iran, 1982. [Google Scholar]
  52. UNESCO World Heritage, C.W. Historic City of Yazd. Available online: https://whc.unesco.org/en/list/1544/ (accessed on 3 November 2020).
  53. Shorten, C.; Khoshgoftaar, T.M. A Survey on Image Data Augmentation for Deep Learning. J. Big Data 2019, 6, 60. [Google Scholar] [CrossRef]
  54. Neapolitan, R.E.; Jiang, X.; Jiang, X. Artificial Intelligence: With an Introduction to Machine Learning, Second Edition; Chapman and Hall/CRC: London, UK, 2018; ISBN 978-1-315-14486-3. [Google Scholar]
  55. He, K.; Zhang, X.; Ren, S.; Sun, J. Deep Residual Learning for Image Recognition. In Proceedings of the 2016 IEEE Conference on Computer Vision and Pattern Recognition (CVPR), Las Vegas, NV, USA, 27–30 June 2016; pp. 770–778. [Google Scholar]
  56. Singh, P.; Manure, A. Introduction to TensorFlow 2.0. In Learn TensorFlow 2.0: Implement Machine Learning and Deep Learning Models with Python; Singh, P., Manure, A., Eds.; Apress: Berkeley, CA, USA, 2020; pp. 1–24. ISBN 978-1-4842-5558-2. [Google Scholar]
Figure 1. The illustrations of three different zones in a historical city in Iran such as Yazd. Non-historical houses in SAFAIIEH, historical houses in SHESH BADGIR, and a mix of historical and non-historical houses in SHEYKHDAD district [49].
Heritage 05 00159 g001
Figure 2. Yazd, PIR BAZAR neighborhood, a typical historical city quarter in the dry and hot region of Iran which is constructed with adobe bricks (Iran National Cartographic Center).
Heritage 05 00159 g002
Figure 3. The central courtyard of a historical house in Iran (Sajad Moazen).
Heritage 05 00159 g003
Figure 4. The plan and section of a historical house with a central courtyard (Cultural Heritage, Handicrafts and Tourism Organization of Yazd province).
Heritage 05 00159 g004
Figure 5. In this image, the city of Yazd is introduced in three stages: (a), location of the city in the central plateau of Iran; (b), location of the city in relation to the surrounding natural features, including the southwestern (Taft) and northeastern (Kharanag) mountain ranges, which are the sources of the city’s water supply through underground channels (Qanat); (c), the historical context of the city, and the new context around it, in which the following major differences are evident: density, width, and orientation of passages, dominant materials used.
Heritage 05 00159 g005
Figure 6. Google Earth image from Yazd city. According to the UNESCO world heritage map, the city is separated into two different zones. The red zone shows the historical part of the city, and the blue area demonstrates the non-historical region. There is a surrounding area around the border of the historical part (green) mixed with historical and non-historical buildings. (Google Earth).
Heritage 05 00159 g006
Figure 7. Some samples of the labeled dataset; (a) historical labeled photos in different qualities and forms. (b) Non-historical labeled photos from different areas and different qualities.
Heritage 05 00159 g007
Figure 8. One of the earliest convolutional neural networks [36].
Heritage 05 00159 g008
Figure 9. Nine layers, which are used in our CNN model, are shown here. Conv2d layers use several filters to find patterns in the photos. Additionally, Max-pooling2d layers halve the size of the photos by converting every 4 pixels to 1 new pixel and choosing the max value of those 4 pixels for the new pixel. Input photos were 300 × 300 pixels, but they have changed to 7×7 pixels in the last layer of the CNN.
Heritage 05 00159 g009
Figure 10. Schematic overview of the full CNN for classifying historical and non-historical buildings based on airborne and satellite images.
Heritage 05 00159 g010
Figure 11. Training accuracy and validation accuracy for 100 epochs. The increasing rate of accuracy to around 98% shows that the model is trained well and is not over-fitted on the training data.
Heritage 05 00159 g011
Figure 12. Training loss and validation loss for 100 epochs are demonstrated in the line plot. The decreasing rate of the loss function to around 0.05 shows that the model is trained well and is not over-fitted on the training data.
Heritage 05 00159 g012
Table 1. Confusion Matrix obtained from validation dataset with 256 images.
Predicted Historical BuildingsPredicted Non-Historical Buildings
True historical building127 (True Positive)1 (False Negative)
True non-historical building5 (False Positive)123 (True Negative)
Publisher’s Note: MDPI stays neutral with regard to jurisdictional claims in published maps and institutional affiliations.

