Article

Thermography Investigation and Seismic Vulnerability Assessment of a Historical Vaulted Masonry Building

1
ITC—Construction Technologies Institute, CNR—Italian National Research, 70124 Bari, Italy
2
Department of Innovation Engineering, University of Salento, Via per Monteroni, 73100 Lecce, Italy
*
Author to whom correspondence should be addressed.
Heritage 2022, 5(3), 2041-2061; https://doi.org/10.3390/heritage5030107
Submission received: 8 July 2022 / Revised: 29 July 2022 / Accepted: 31 July 2022 / Published: 2 August 2022

Abstract

:
Typically, historical masonry constructions were only designed due to gravity loads. The structural detailing, aimed at improving the seismic performance, was introduced thanks to the advancement in performance-based seismic design approaches in recent decades. In this context, the vaults play a key role. Depending on the construction technology, material, shape and constraints, the vault can modify the load patterns both in static and/or dynamic conditions. Furthermore, in heritage buildings, the possible presence of frescos or decorations increase the difficulties in assessing the technological nature of the vault. Non-destructive in situ investigation techniques, such as thermography, can be a powerful tool to improve the level of knowledge with respect to structural detailing and increase the prediction capability of the numerical model. The present paper discusses the results of a large thermography campaign performed in a cultural masonry building located in the south of Italy. The extensive investigation was aimed at identifying the typologies of vaults covered by worth frescos. This peculiarity was considered in the structural analysis in order to investigate the influence of the vault typology, in terms of plan stiffness versus the global seismic vulnerability. The outcomes demonstrated that thermography was decisive in improving the level of knowledge and obtaining a more reliable prediction of the seismic response.

1. Introduction

The preservation of the existing built heritage, to be intended as a complex of interventions in which the strengthening and the conservation of the structure is integrated with the improvement of the global performance, is still a topic of open discussion between technicians and researchers for its peculiar aptitude to involve different aspects such as economic, technical, cultural and sustainability [1]. The critical nature of the issue is evidenced by the difficulties in the choice of the more appropriate retrofit interventions when dealing with valuable constructions. In this context, the knowledge of the original construction technique, and a deep understanding of the specific features of the building, is of paramount importance [2]. Thus, a complex system that takes the form of the research and application of integrated solutions based on the use of reliable and durable materials that are also respectful of the existing building object is met. The interventions must be accompanied by an actual improvement of the structural performance of the building. It is, therefore, necessary to have a methodology and/or an approach to the project based on the analysis of needs and performances, which allows one to analyze the level of decay, obsolescence or inadequacy of the existing building by driving the technical intervention, i.e., an exhaustive diagnosis [3,4,5,6]. From the cultural point of view, the challenge is recognized in combining reliable technical choices with the need to protect the historical/architectural aspects of the building with the aim of handing down the heritage safety by preserving its identity and intrinsic historical value [7].
The structural analysis of existing buildings, especially when ancient ones are considered, is a challenging task, due to the unique peculiarities that can be found in almost every case study. In fact, the computational strategies in masonry buildings analysis were widely discussed in the scientific literature over the last 20 years [8,9,10]. A recurring issue is the lack of box behavior, which is the reason why traditional analysis and assessment methods are often not applicable [11]. The lack of regularity is a critical issue that limits the applicability of non-linear analysis [12].
In this scenario, the study reported in this paper concerns the structural analysis of a historical masonry building located in the south of Italy, known as “Ducale” or “Baronale” Palace in Binetto. The in situ investigation was crucial for revealing the different types of vaults, which were involved in the structural analysis by considering different in-plane stiffness. Moreover, the results were compared with the ones obtained considering a unique infinite-stiffness floor and a zero-stiffness floor for the whole structure.

2. Description of the Building

The building object of this study is made of masonry and consists of three floors aboveground and one underground which, being embedded in the rocks, provide the foundations themselves. Concerning the construction type, the building belongs to the well-known Class I [13], which includes the masonry buildings with horizontals consisting of upper vaults, having high thickness bearing walls and moderate height (see Figure 1). The masonry texture presents different organizations of natural stones (more or less roughly hewn or squared) and thin (i.e., <10 mm) lime-based mortar joints. The structural deficiencies are influenced by three main factors:
  • Modest or null clamping between the perimeter walls and, as well as, between the transversal walls;
  • Modest or null transversal connection between three masonry leafs which are separated by internal cores with negligible mechanical properties;
  • Non-uniform floor stiffness in reference to the top floor, where masonry cross vaults alternate with ceramic tube vaults—so-called ribbed vault (therefore without floor rigidity)—wooden floor, steel floor and a large skylight.
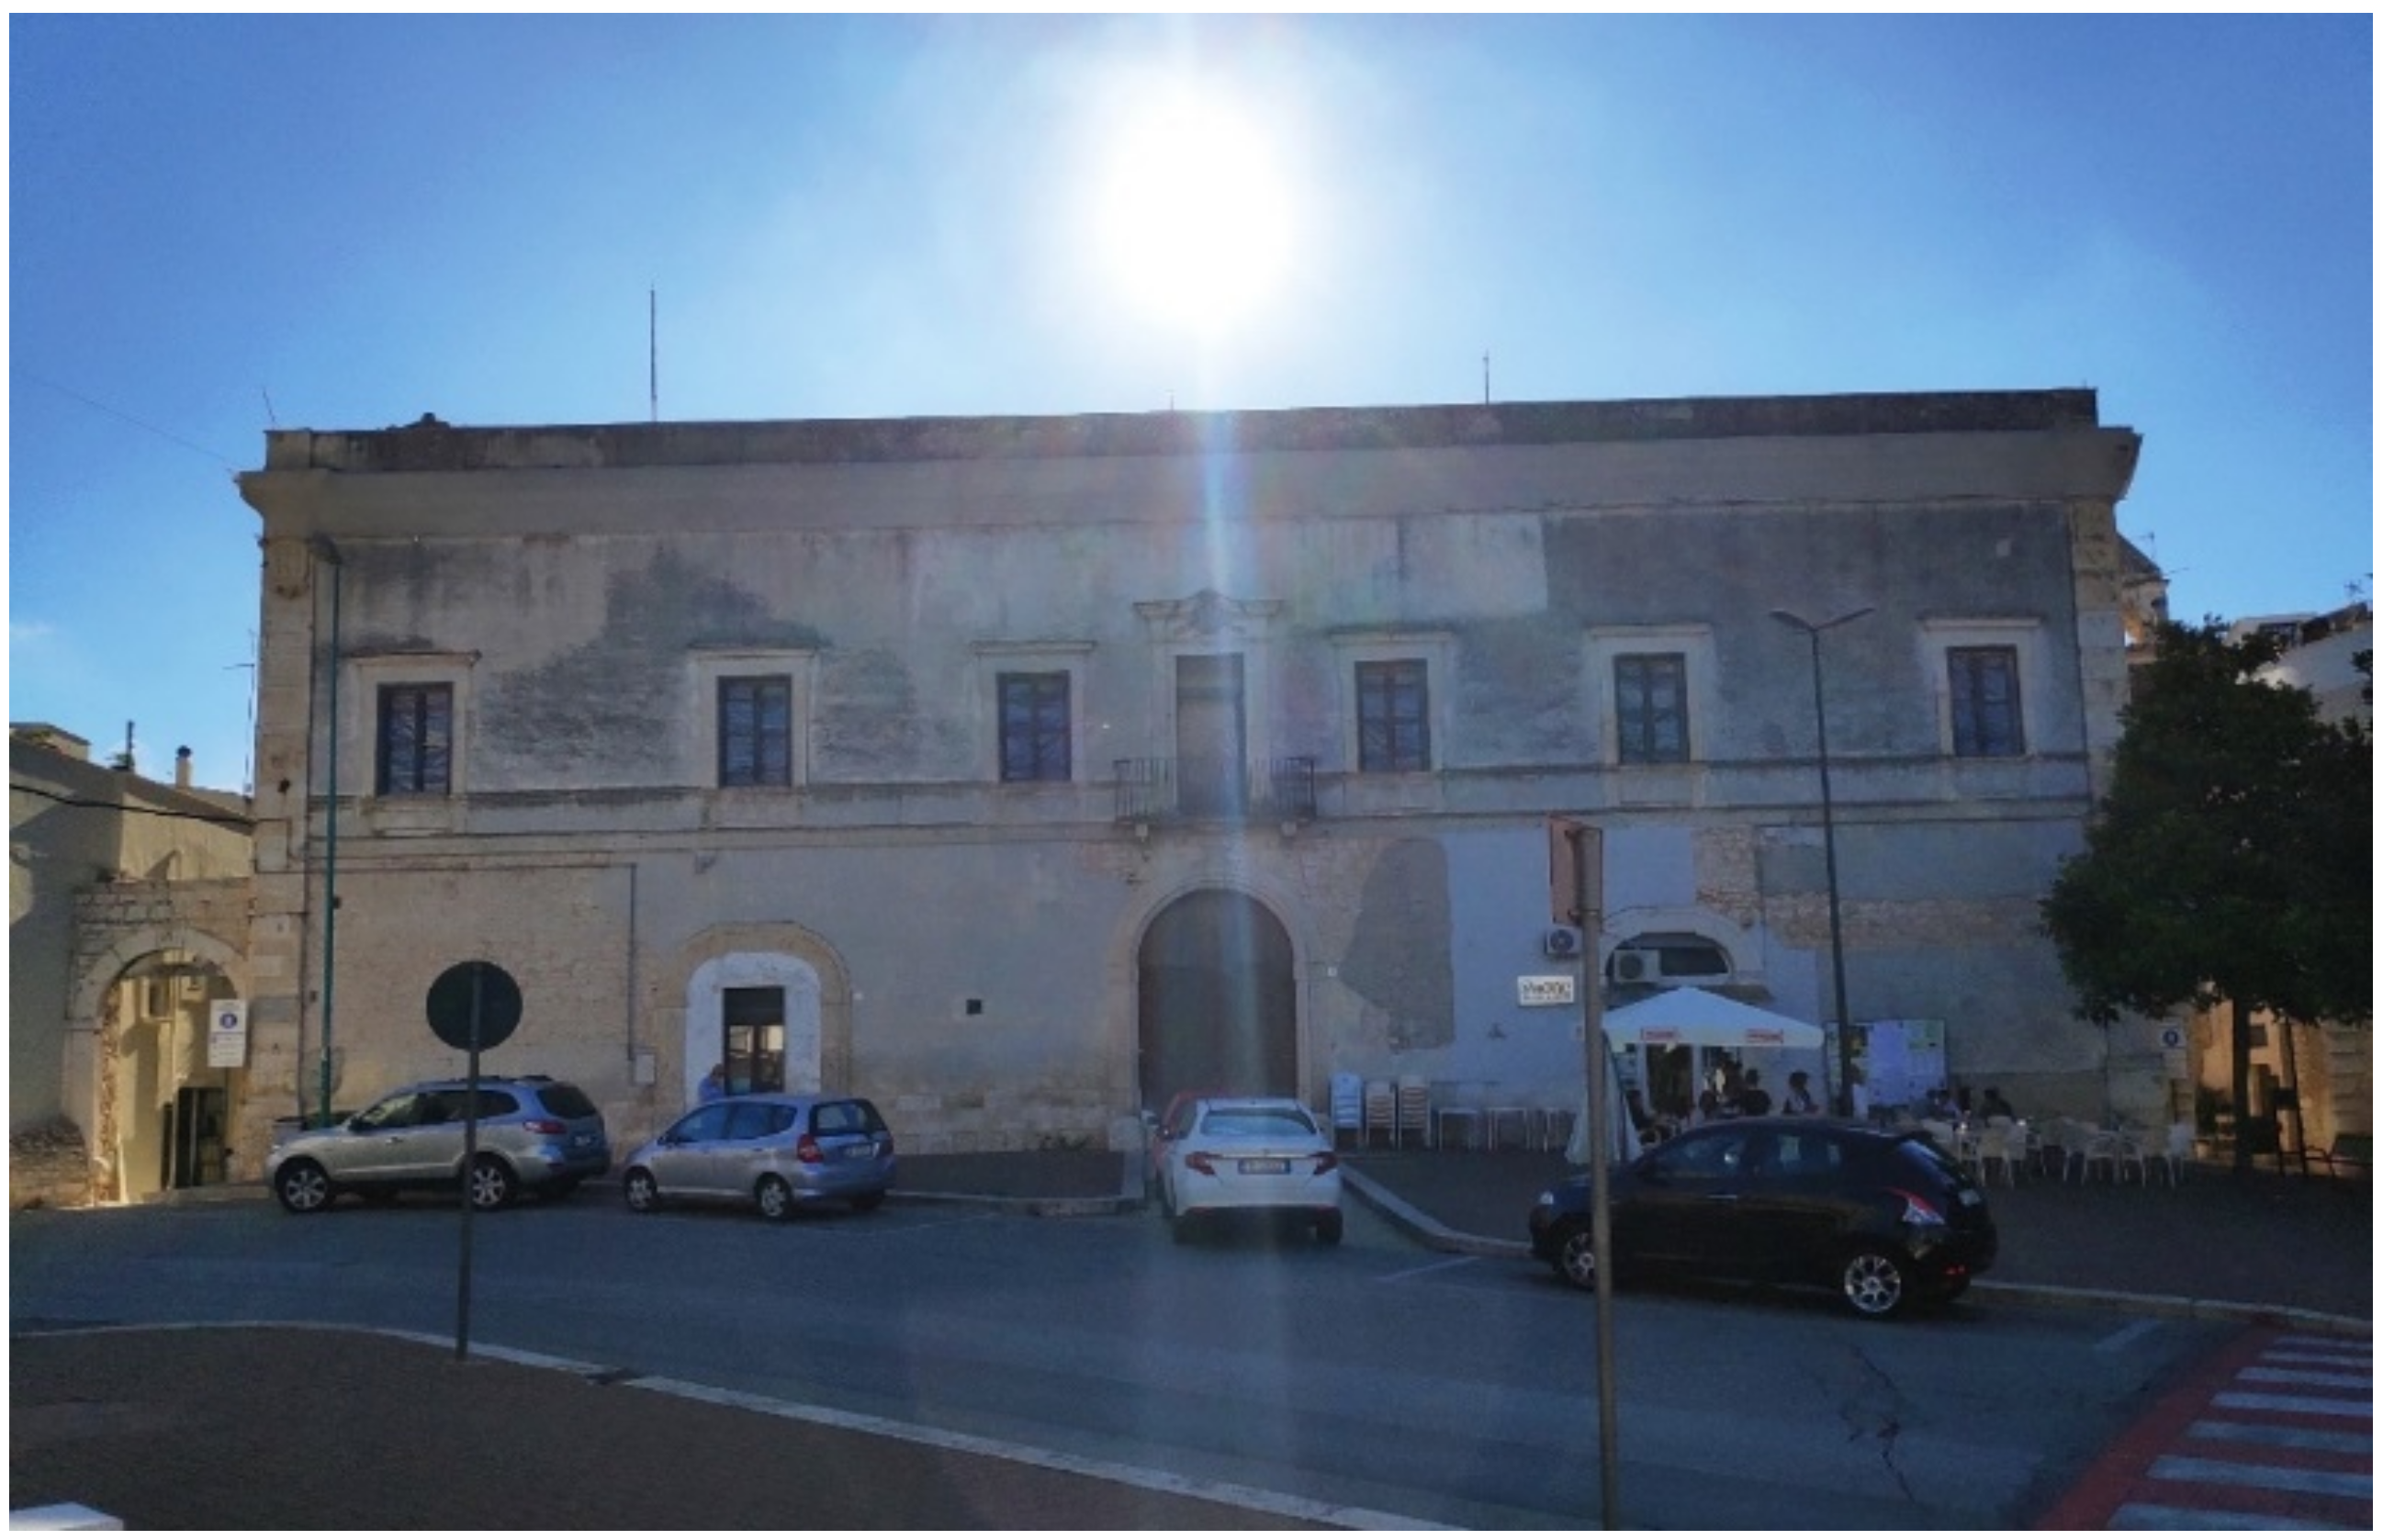
Figure 1. Main facade of the building.
Heritage 05 00107 g001
These aspects have led to the manifestation of crack patterns along with the whole building (e.g., in Figure 2), which is attributable to creep effects whereby the thrusts deriving from the load acting on curved structural elements no longer find equilibrium in the counterthrusts [14]. Consequently, the lowering of the vaults and the out-of-plane rotation of the supporting walls occurred. In fact, the cracks are all comparable with the contact planes between the various structural elements [15,16]. Despite the presence of crack patterns addressable to local mechanisms, the kinematic analysis is out-of-scope in the present work. Therefore, all the numerical models presented in the next few paragraphs were realized under the assumption that local mechanism activation can be neglected with respect to global failures.
The supporting structures of the horizontal elements are arched to support the vertical loads, almost in the absence of tension, and to transmit them, together with the thrust, to the vertical structural supports. When not sufficiently contrasted, the horizontal thrust tended to make these supports open with a reduction in the arrows of the arches, in a non-linear cause–effect law that can lead to a sudden collapse [17]. The building is particularly vulnerable to seismic actions: wave shocks can, in fact, produce considerable increases in the stress domain both in the arch and in the supporting uprights, already severely challenged by the thrusting actions. This may produce in the specific case an increase in the thrust and easily causes the crisis of the vertical supports. In the past, steel ties were often introduced for the thrust limiting, as discussed in [18,19]. Alternatively, the dead load was reduced by lightning the filler of the vault. As a consequence, the thrust was reduced as well. In case of absence of reinforcement, there is an uneven presence of vertical loads, strong thrust effects and the lack of chaining is evidenced. The results of the earthquake on buildings of this type are sadly known from the recent events (e.g., [20]), or rather the collapses were mainly affected at the perimeter walls, especially if not load-bearing.

Historic Context

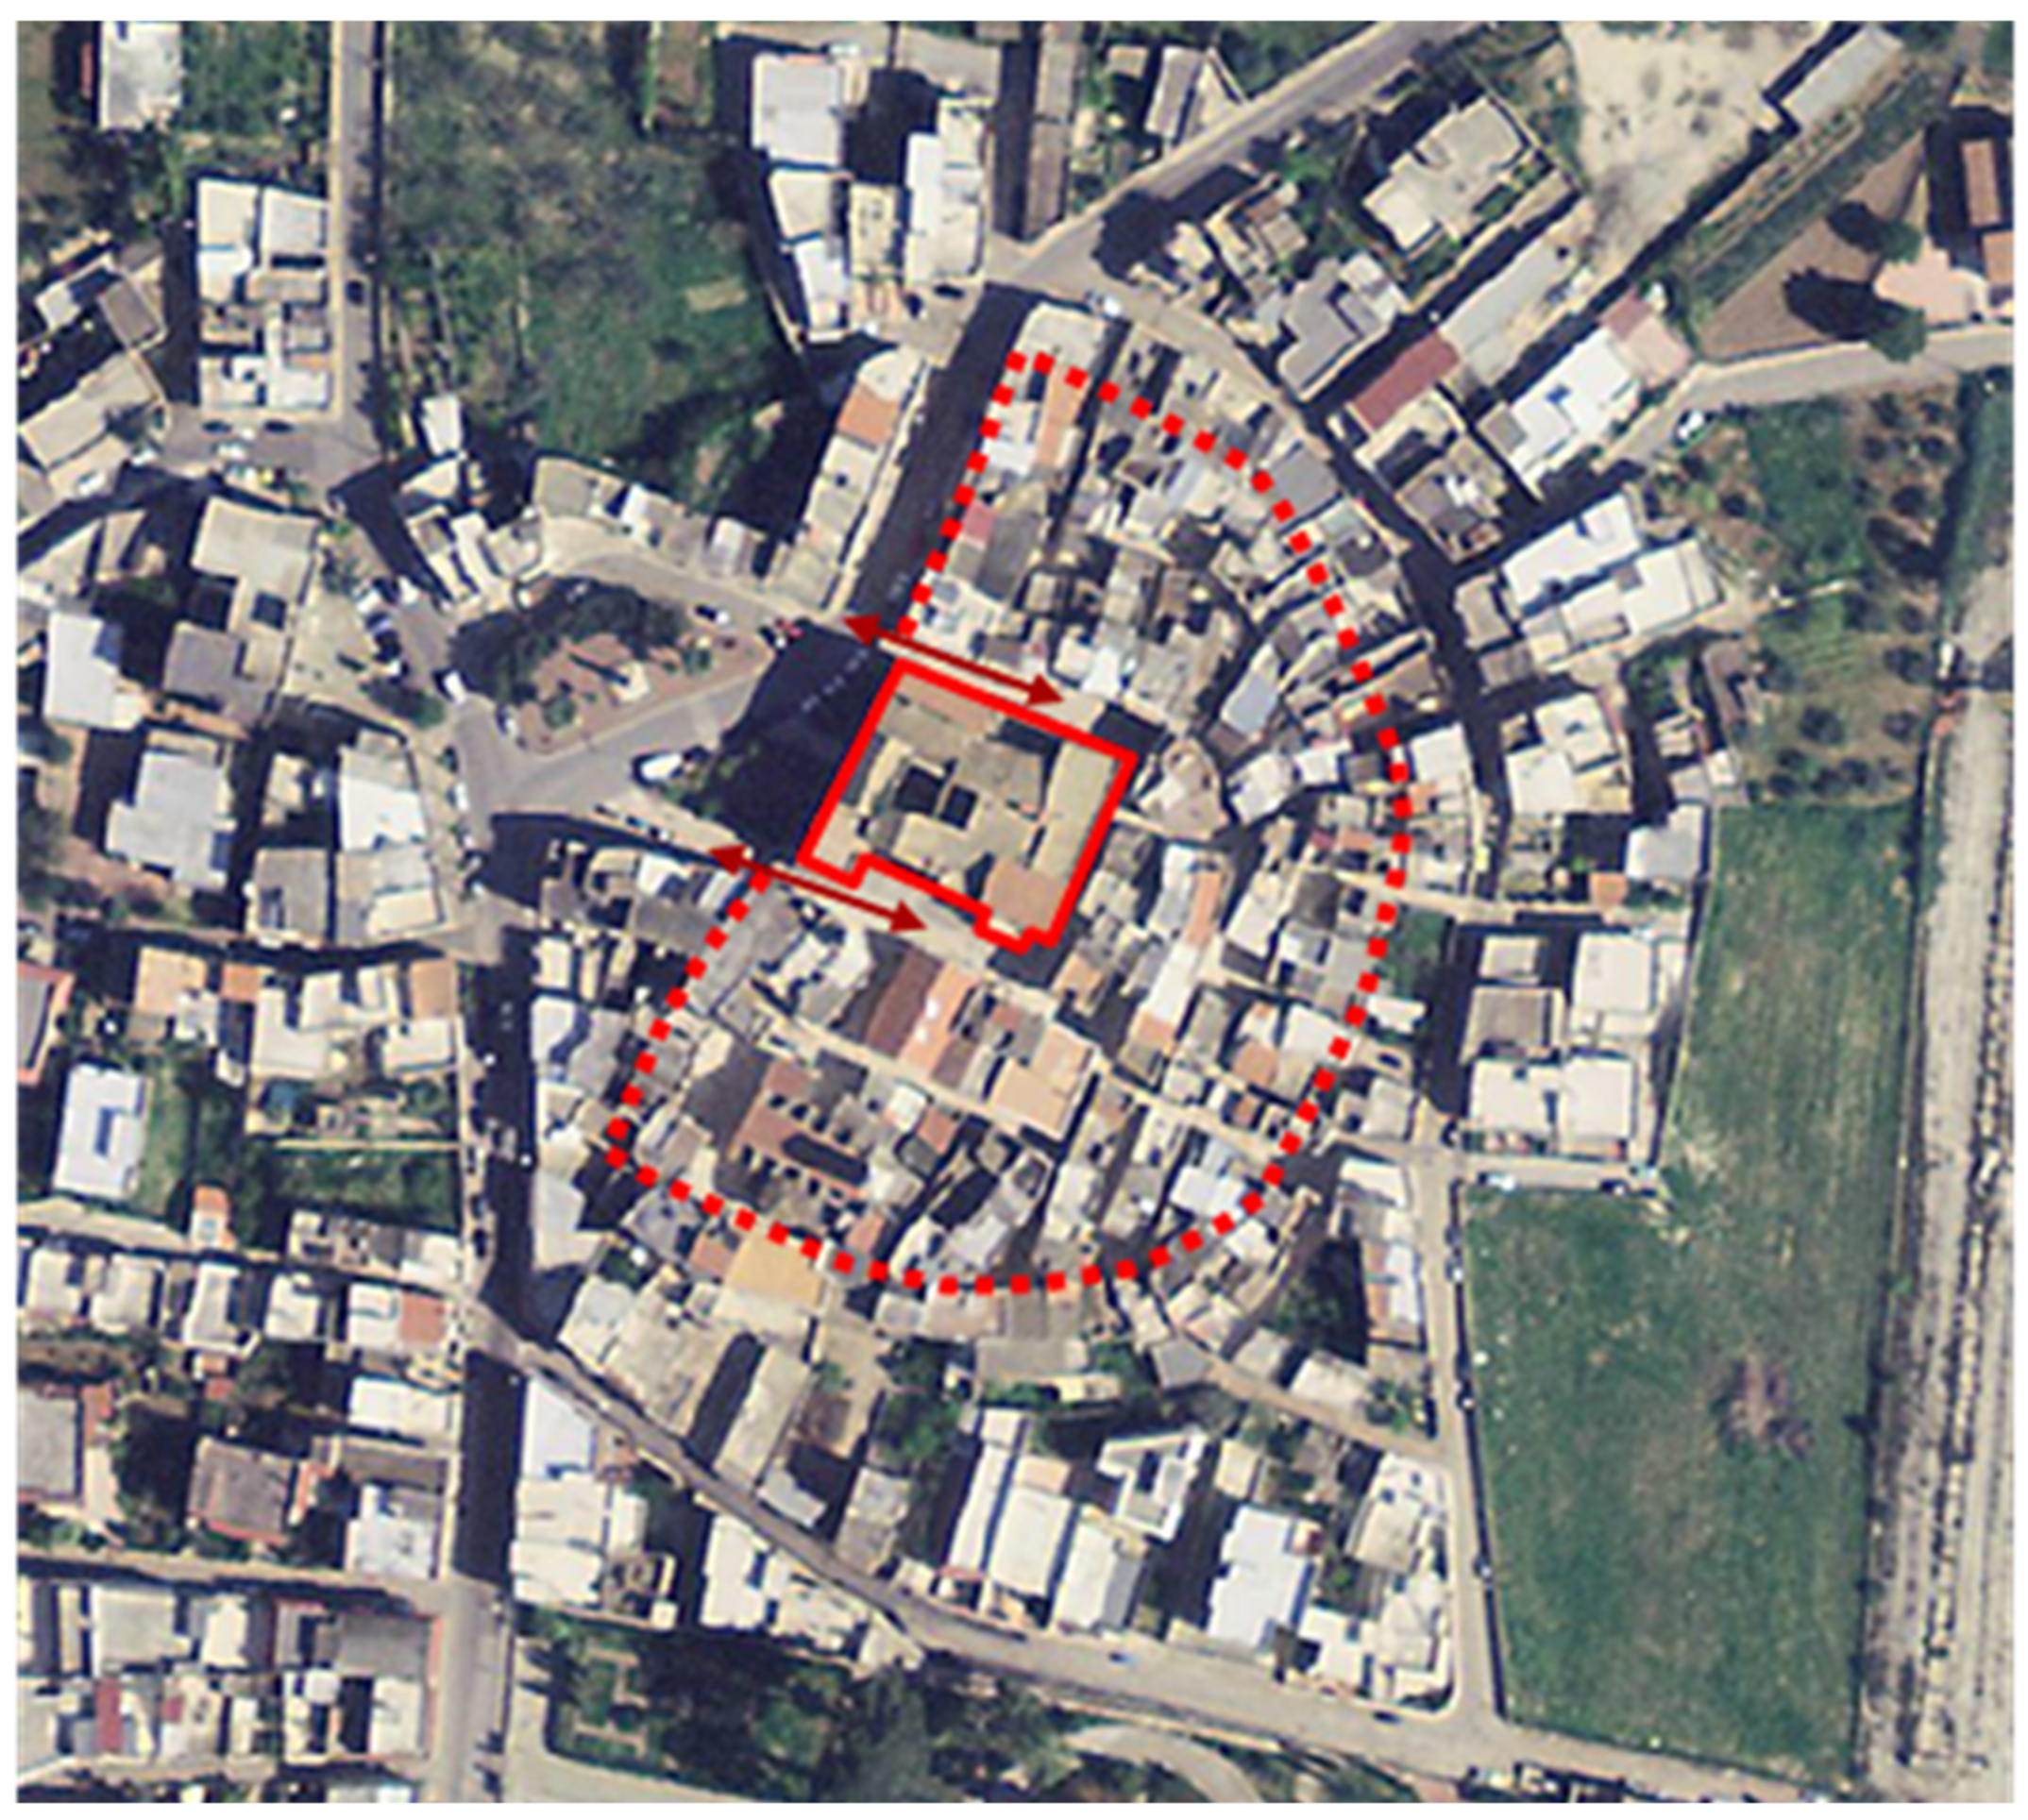
The palace constitutes, with its bulk, an important portion of the ancient historical center, once probably surrounded by walls, and today attested on the central square of the municipality with a continuous fifth building that still follows that layout in the morphological and urban conformation. In fact, the baroque façade of the noble palace is in line with the adjacent building (Figure 3) and is linked to this by two arches which, detached from its cantonals, are inserted into the built row.
To determine the dating of the palace, it is necessary to go back to the notarial documents and, in particular, this appears to be mentioned in a “cartula” of 1082 in the signature of one of the witnesses “Umfredo dominator castelli Binecti”. As reported, it appears with the diction of Castel. If the size and the location of the building were not in themselves sufficient evidence to identify it as a “castle”, certainly the presence in the basement of scarp walls, base rooms of fortified towers, square walls, arrows and machicolations, it would put aside any residual doubts. Judging by the bulk of the castle, comparable with the others in the near towns, the Castle of Binetto must have had a rather important defensive function with respect to coastal defense. It is noticeable, inside the circular tower on the ground floor, a robust cantonal with chisel edges and strong ashlar, which has been interpreted as the edge of the first wall of the defensive system.
The ownership of the building is initially attributable to a family of noble lineage originally from Melpignano and Vernole. Then, the structure passes from hand to hand, as often happens, many times over the centuries (between 1085 and 1948), and all the changes, especially those that occurred between the 18th and 20th centuries, cause irreversible trauma to the original structure. The current historic building stands on what was once a castle dating back to the year 1000. It is due to the will of Umfredo of Altavilla and the importance of the fiefdom that at the time boasted of being Binetto.

3. Diagnostic Campaign

Due to the presence of the abovementioned issues (i.e., different types of masonry textures, modest or no clamping between structural elements, different types of vaults, etc.), an extended in situ experimental campaign was organized in order to achieve a sufficient knowledge level, as suggested in [20]. In the following subsections, the main activities executed during the diagnostic campaign are reported.

3.1. InfraRed Thermography (IRT)

InfraRed thermography (IRT) is a non-destructive in situ investigation technique for visualizing the infrared radiation emitted by surfaces. Thermal images, captured by infrared thermal cameras, are able to reveal surface defects (e.g., moisture problems, air leakages, energy leakage, etc.). IRT can commonly detect the radiation of surfaces in the infrared spectrum between 0.9 and 14 μm [21]. The equipment for the herein performed tests is composed of a FLIR T620 f = 25° thermal imaging camera with an infrared resolution of 307,200 (640 × 480) pixels, temperature ranges from −40 °C to +650 °C, including digital camera and a FLIR MR77 thermo-hygrometer.
The IRT survey at the “Ducale” Palace in Binetto was carried out on the walls, connections between structural elements and vaults. A particular focus was reserved for the vaulted rooms, analyzing the geometric and construction characteristics of the vaults themselves, to ascertain the different design and construction technology used in the different time stages. At the moment of the survey, the environmental temperature was equal to 16 °C for the indoor and 11 °C for the outdoor, while the relative humidity was equal to 58% and 60%, respectively.
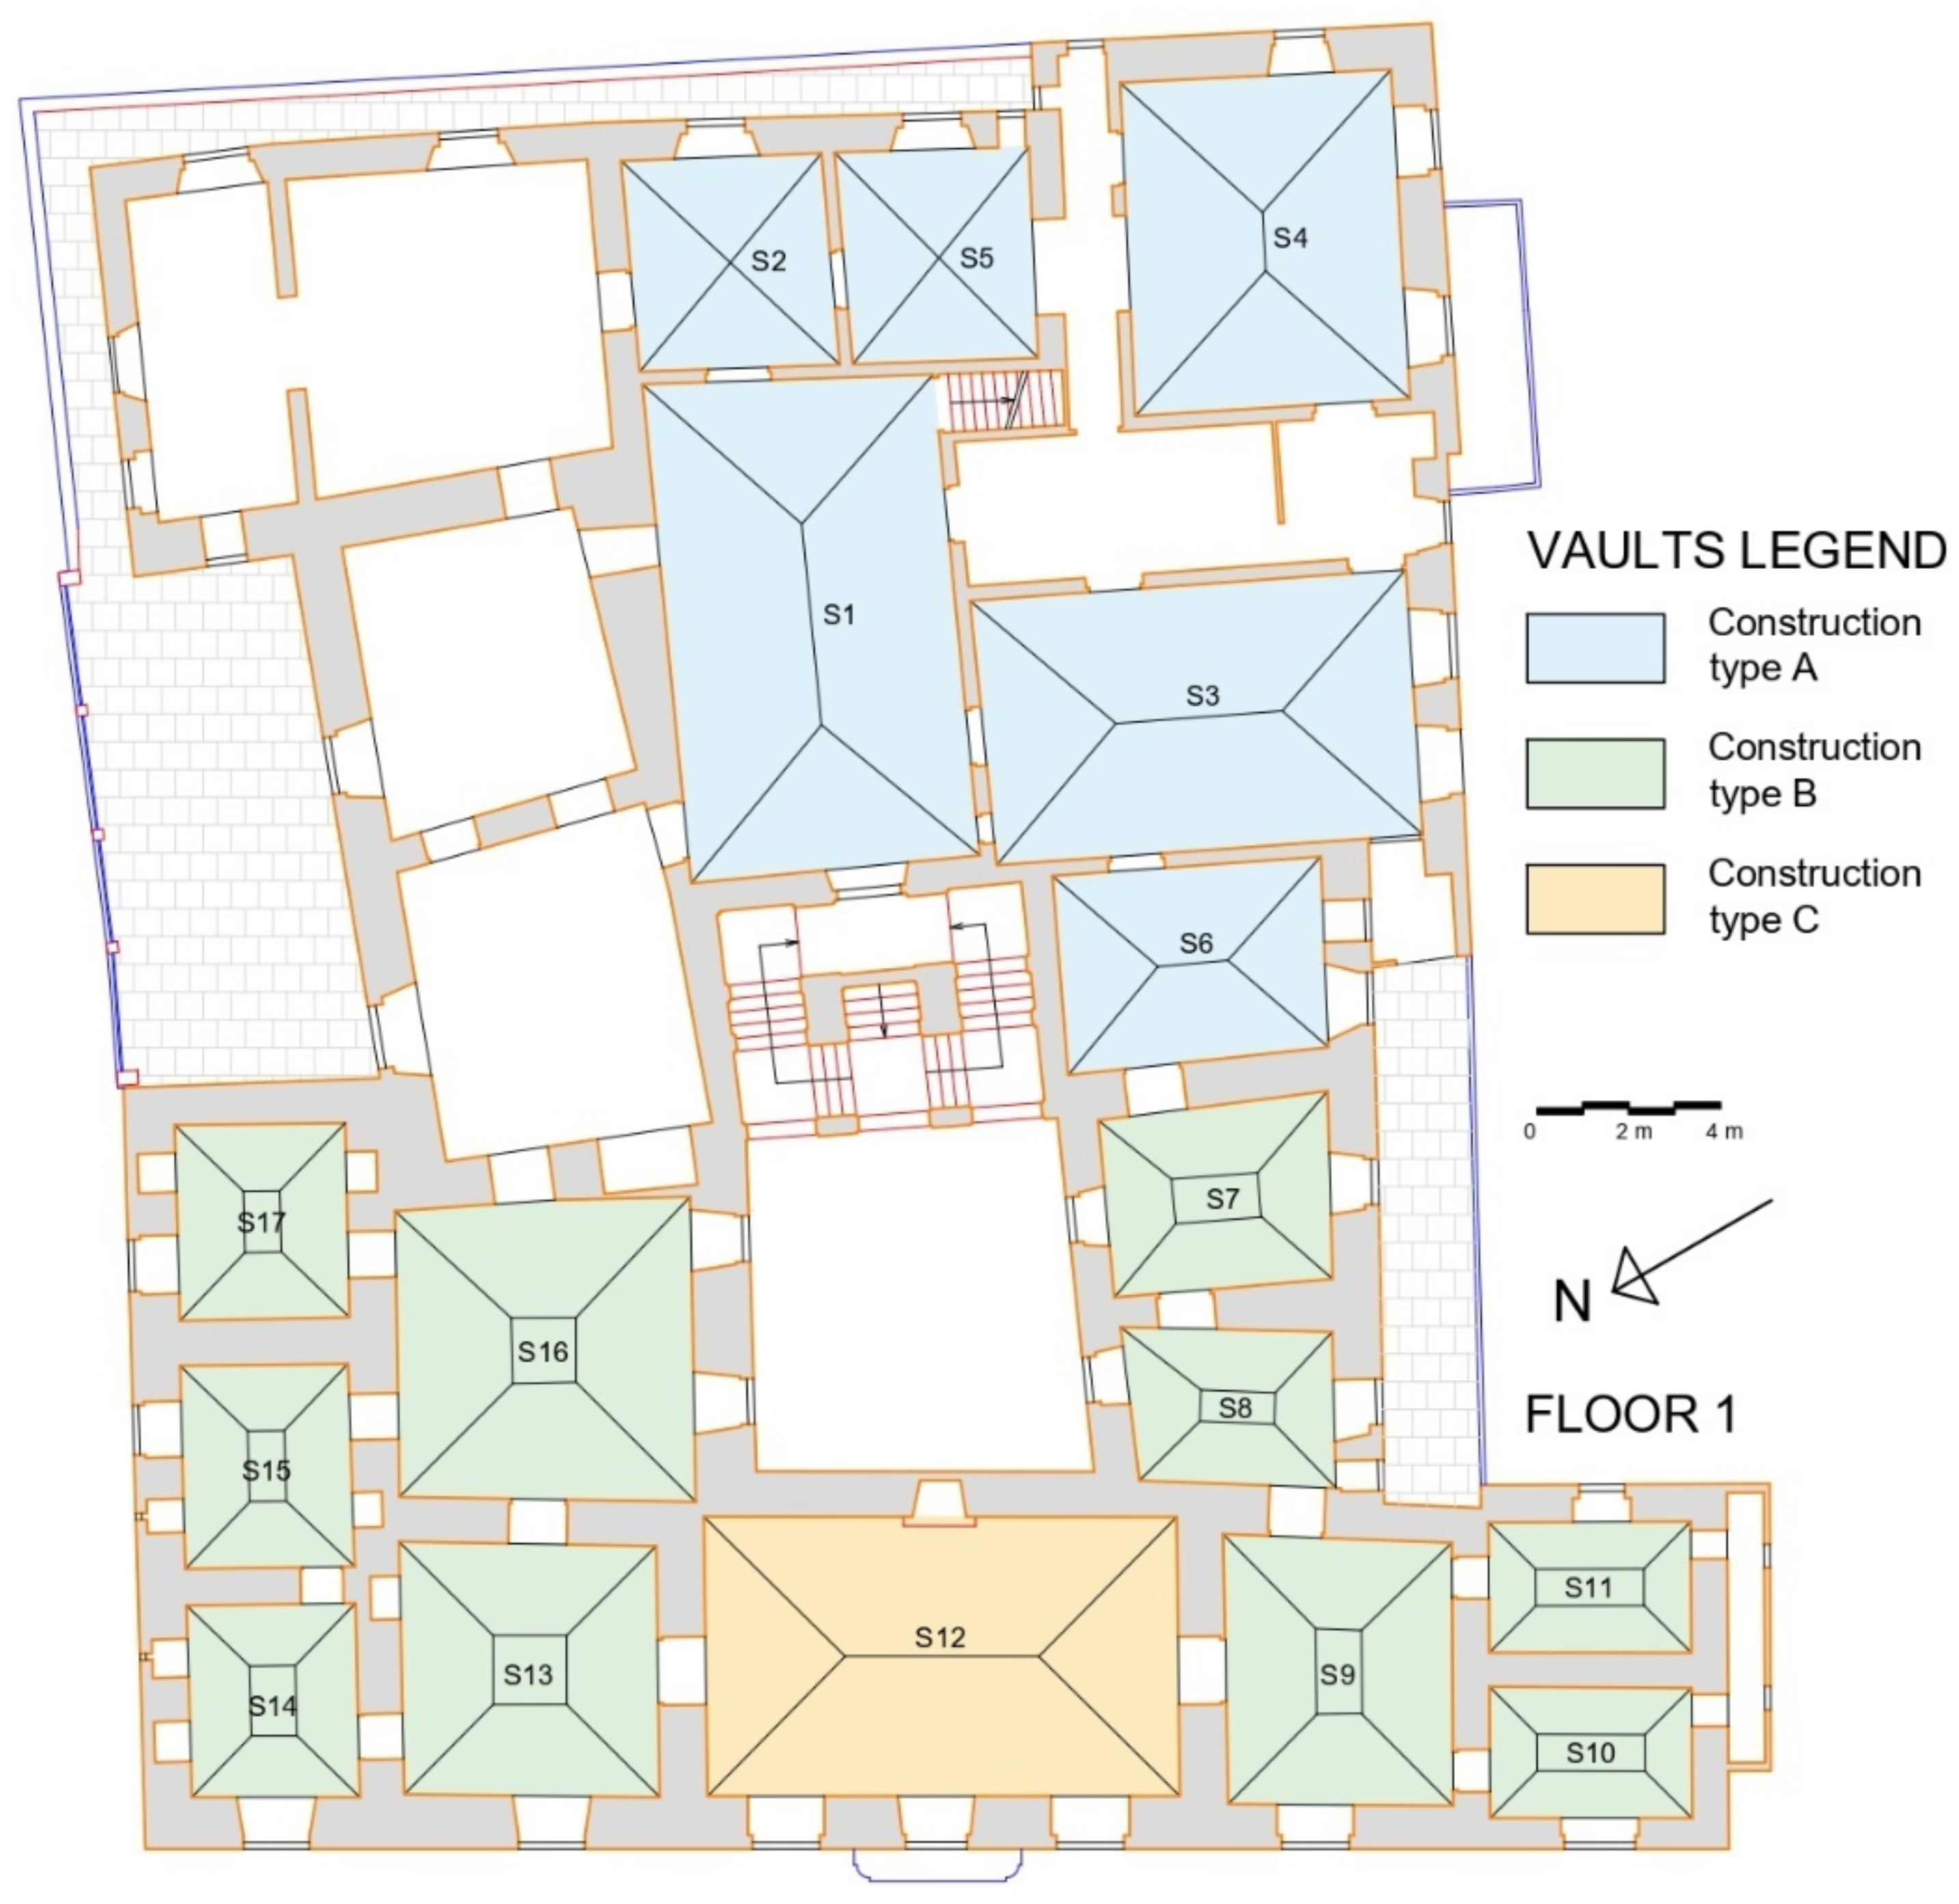
Supplementary information was obtained from visible and infrared shots in the different rooms. The types of vaults and masonry walls identified are described below by analyzing the thermograms in the different rooms, see Figure 4. Concerning the vault types, they can be grouped per geometric and construction types, as shown again in Figure 4 and the following listed below.
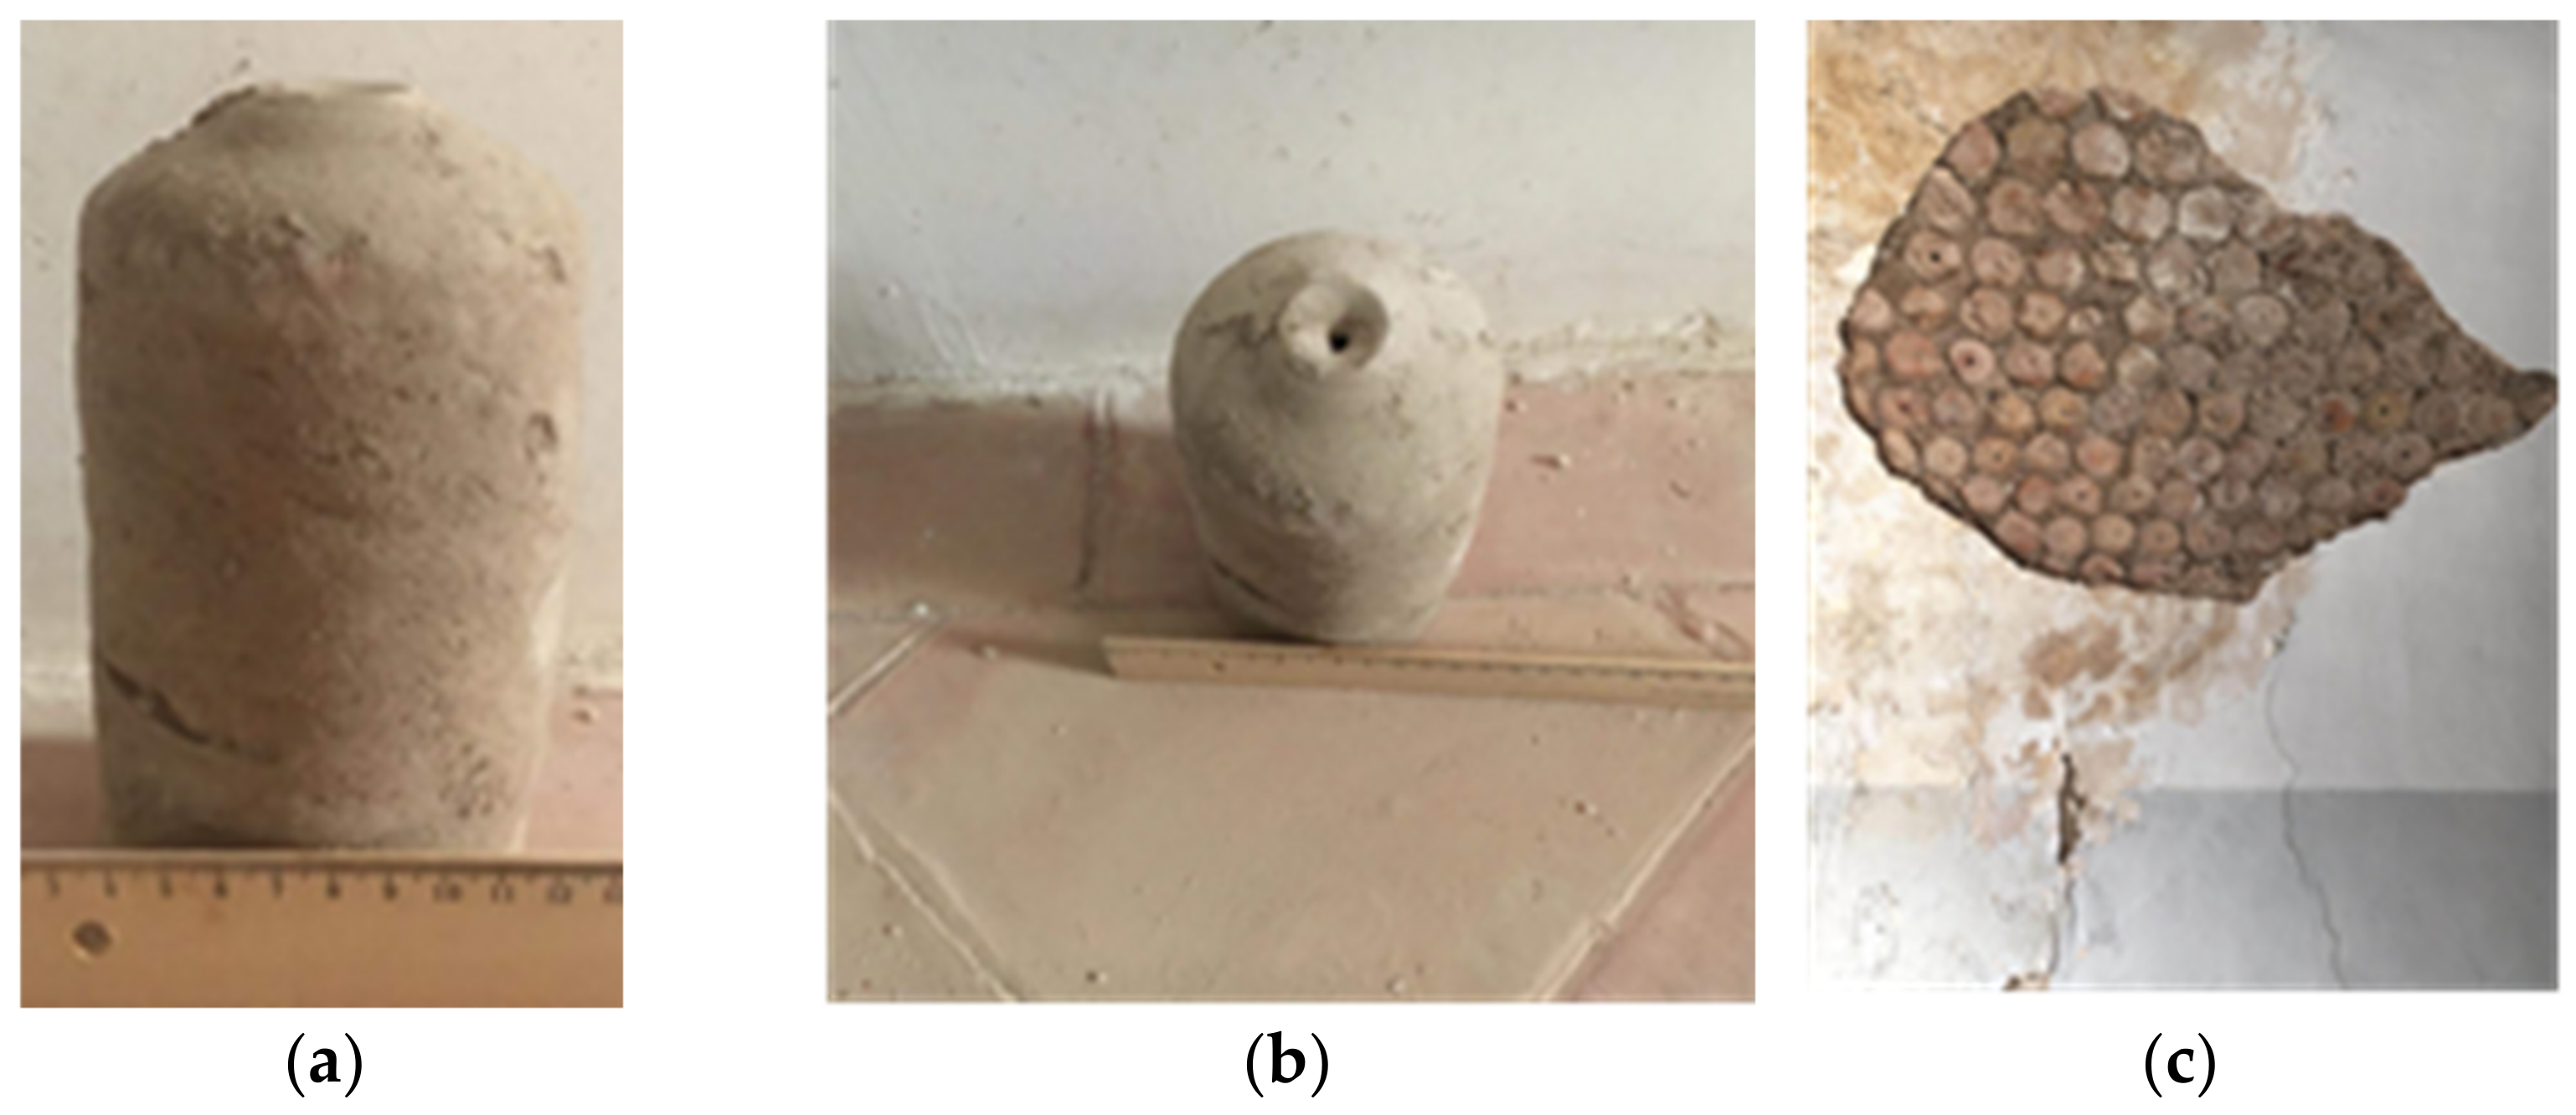
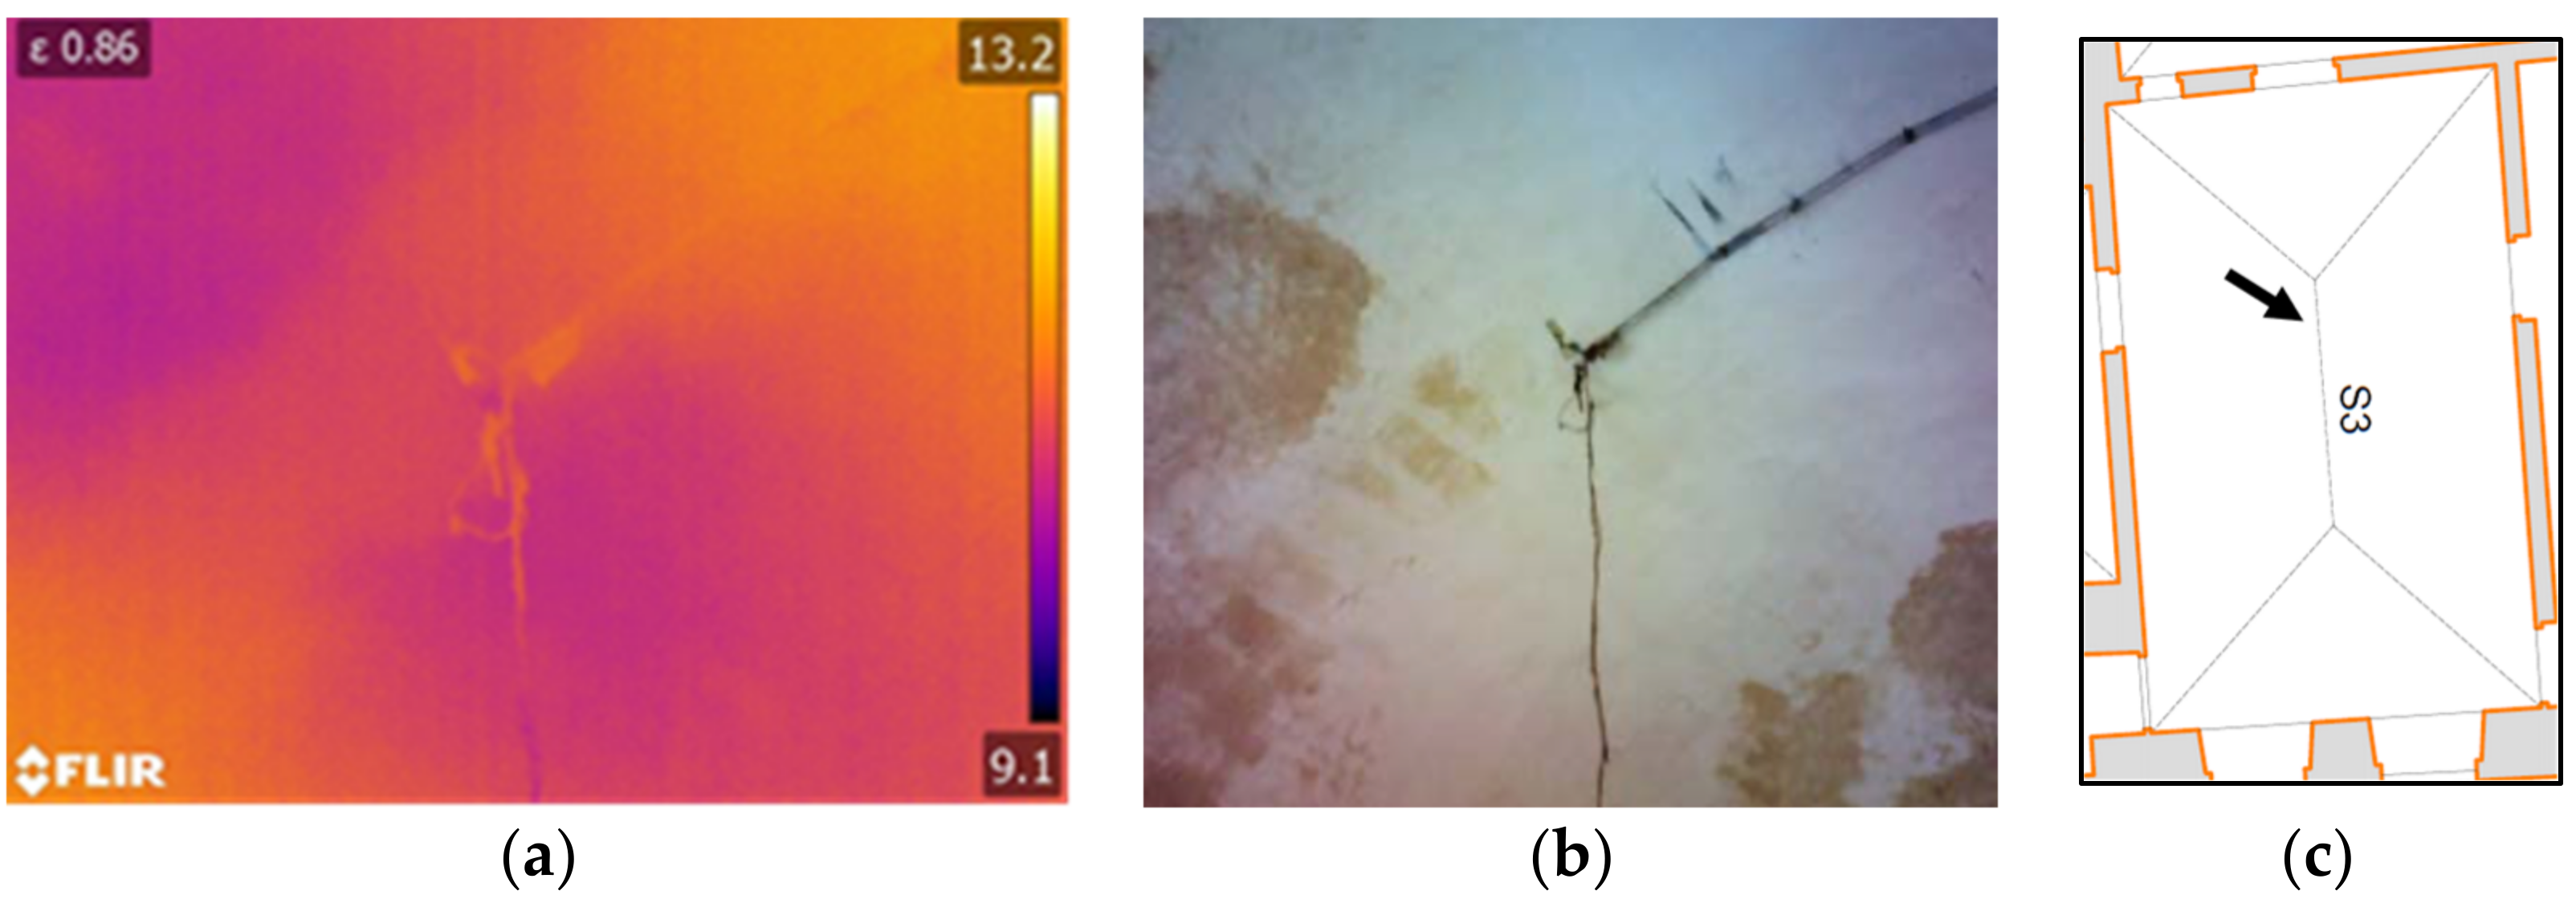
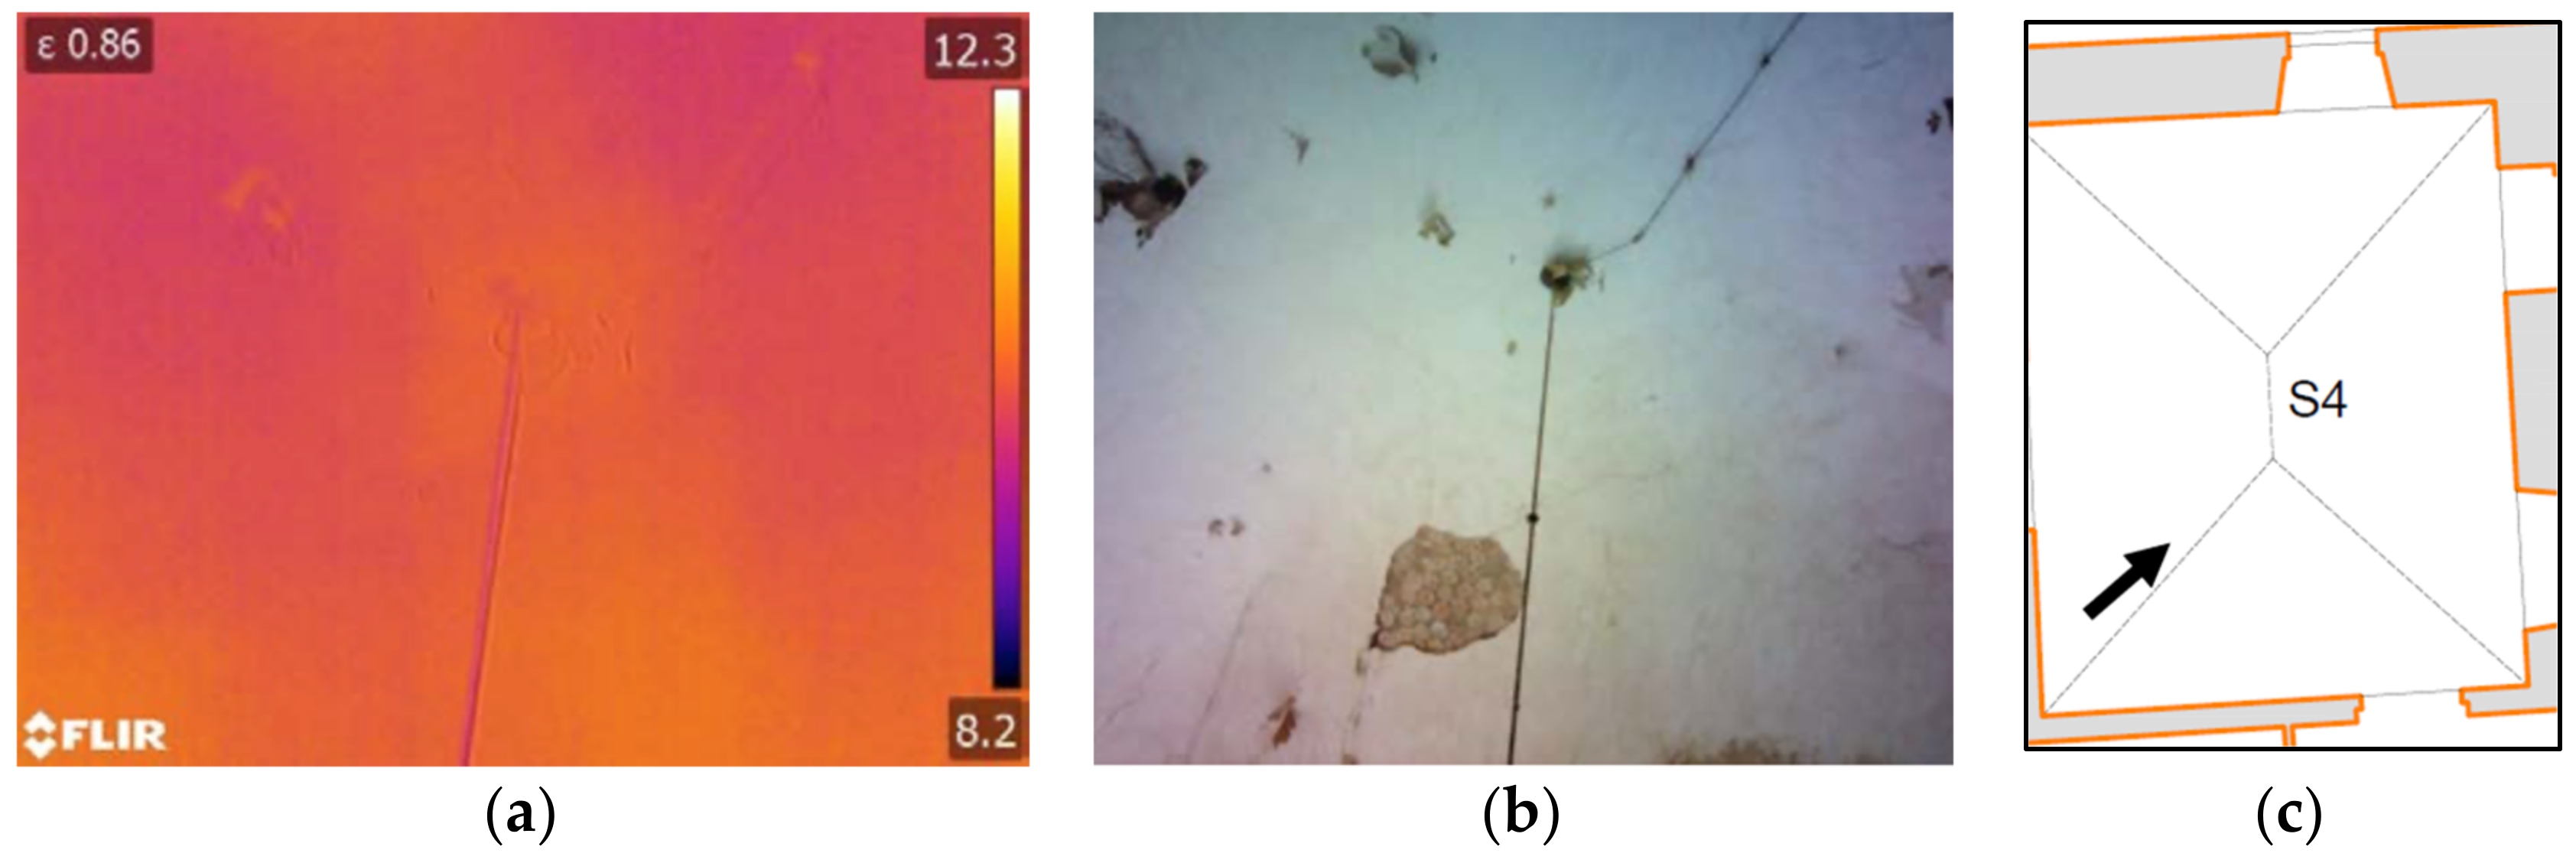
Construction type A: Pavilion vaults with cloister vault heads and cloister vault. These vaults were constructed with both limestone and terracotta tubules, locally referred to as “tufa” and “bubbole”, respectively. The terracotta tubes and their application are illustrated in Figure 5. A band with squared ashlars in limestone, likely calcarenite stone, was identified starting from the vault base along its entire perimeter (thermograms room S1 in Figure 6, room S2 in Figure 7 and Figure 8). In particular, for rooms S1, S3 and S4, the infrared investigation clearly showed the development of the aforementioned band for four staggered rows. The presence of a central arch consisting of a limestone row can be observed by the infrared analysis in the pavilion vault part of the largest rectangular rooms (room S3: Figure 9; room S4: Figure 10). Furthermore, in rooms S1, S3 and S4, the presence of stone reinforcements is noted throughout the development of the edges of the vault (room S1: Figure 6), where the pressures are concentrated.
Above the calcarenite stone rows, the vault is made of elements in terracotta, i.e., the aforementioned “bubbole”. As already illustrated (Figure 5), they are characterized by a cylindrical shape (height of about 16 cm), internally hollow, closed at one end by a disc with a central hole (with a diameter of about 1 cm) and, at the other, by convex part with a small concave part in the center with another central hole. These “bubbole” are arranged with the disc towards the intrados of the vault and with the axis along the radials in order to lighten the vault according to a precise static logic. The presence of the “bubbole”, in addition to being visible in a few areas where there has been a detachment or deterioration of the plaster, is highlighted in numerous thermograms (Figure 7, Figure 8, Figure 9 and Figure 10).
Construction type B: Keel vaults.
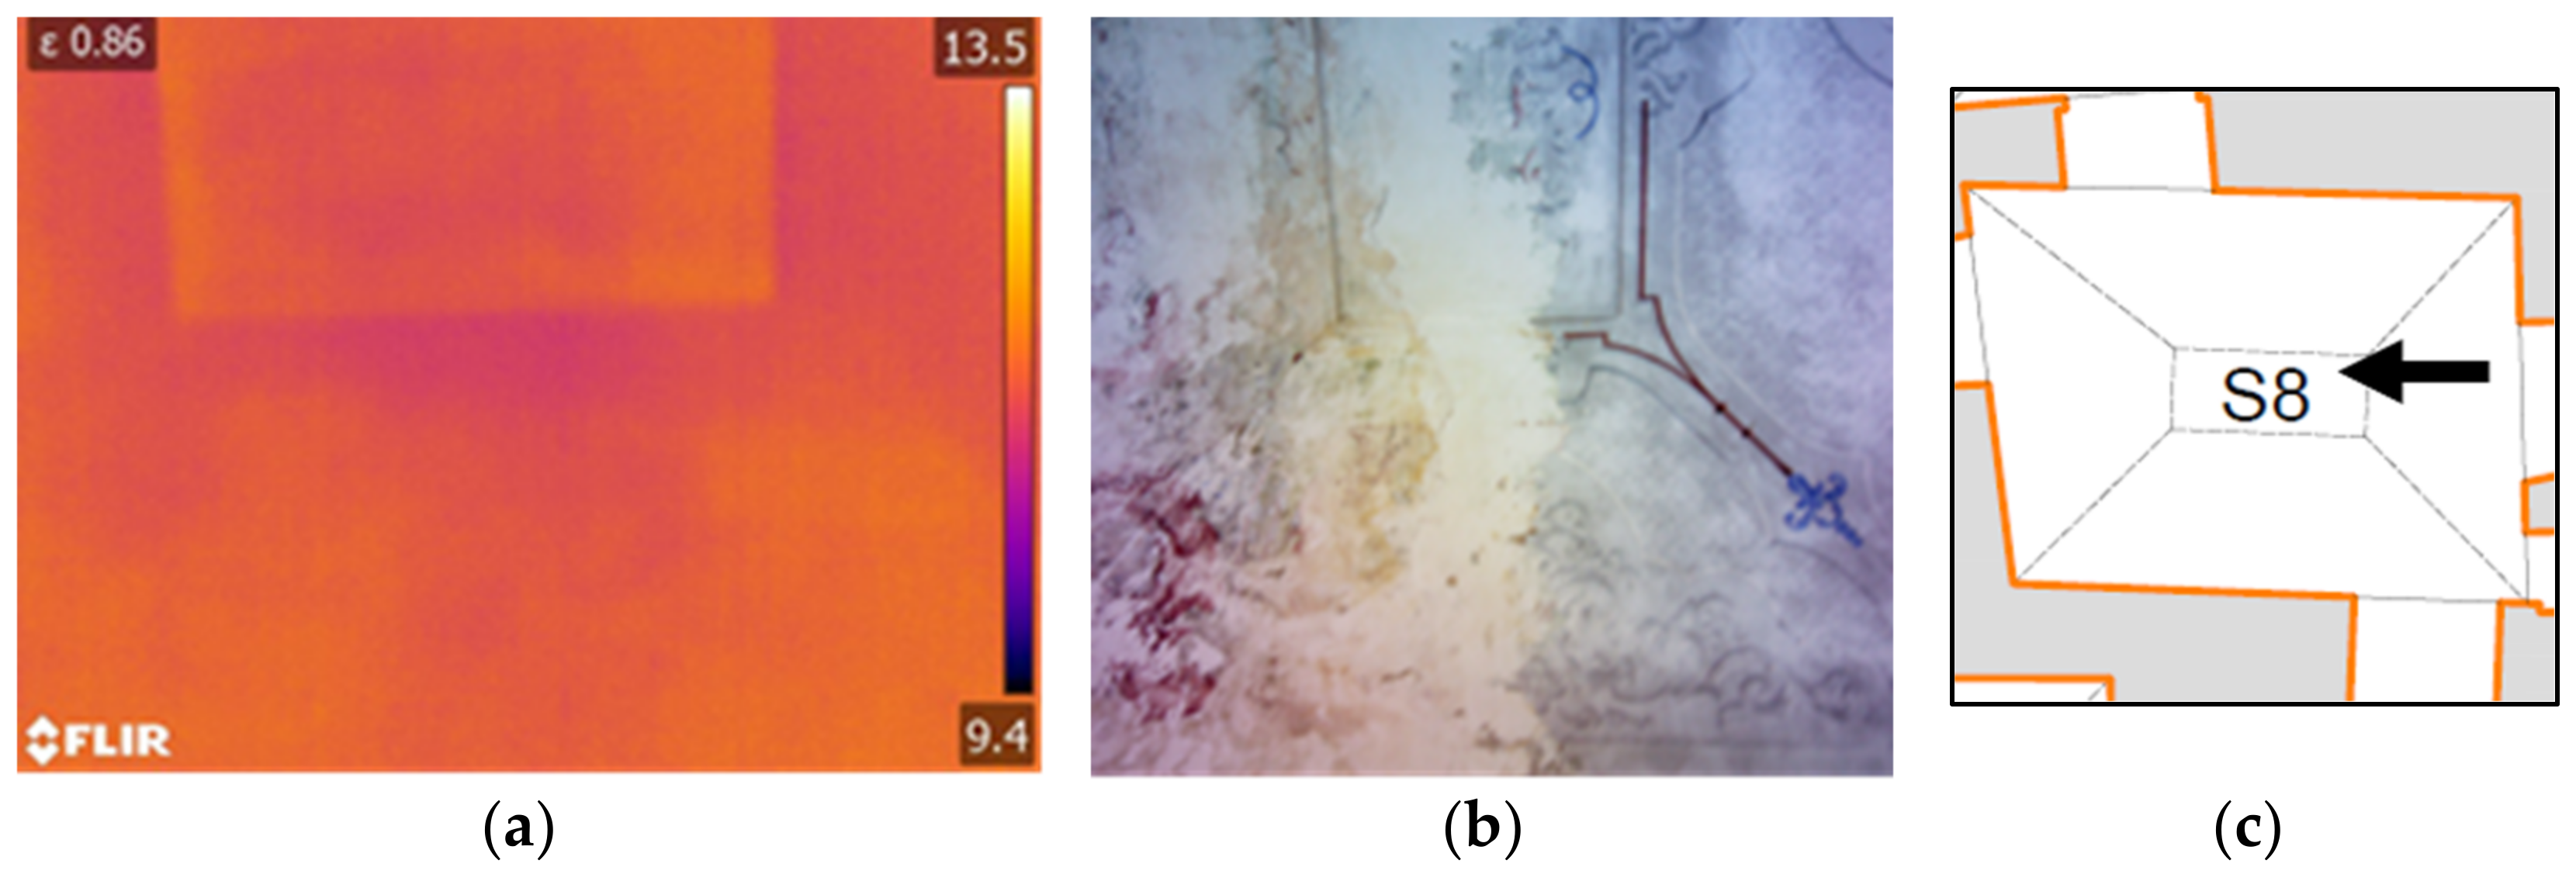
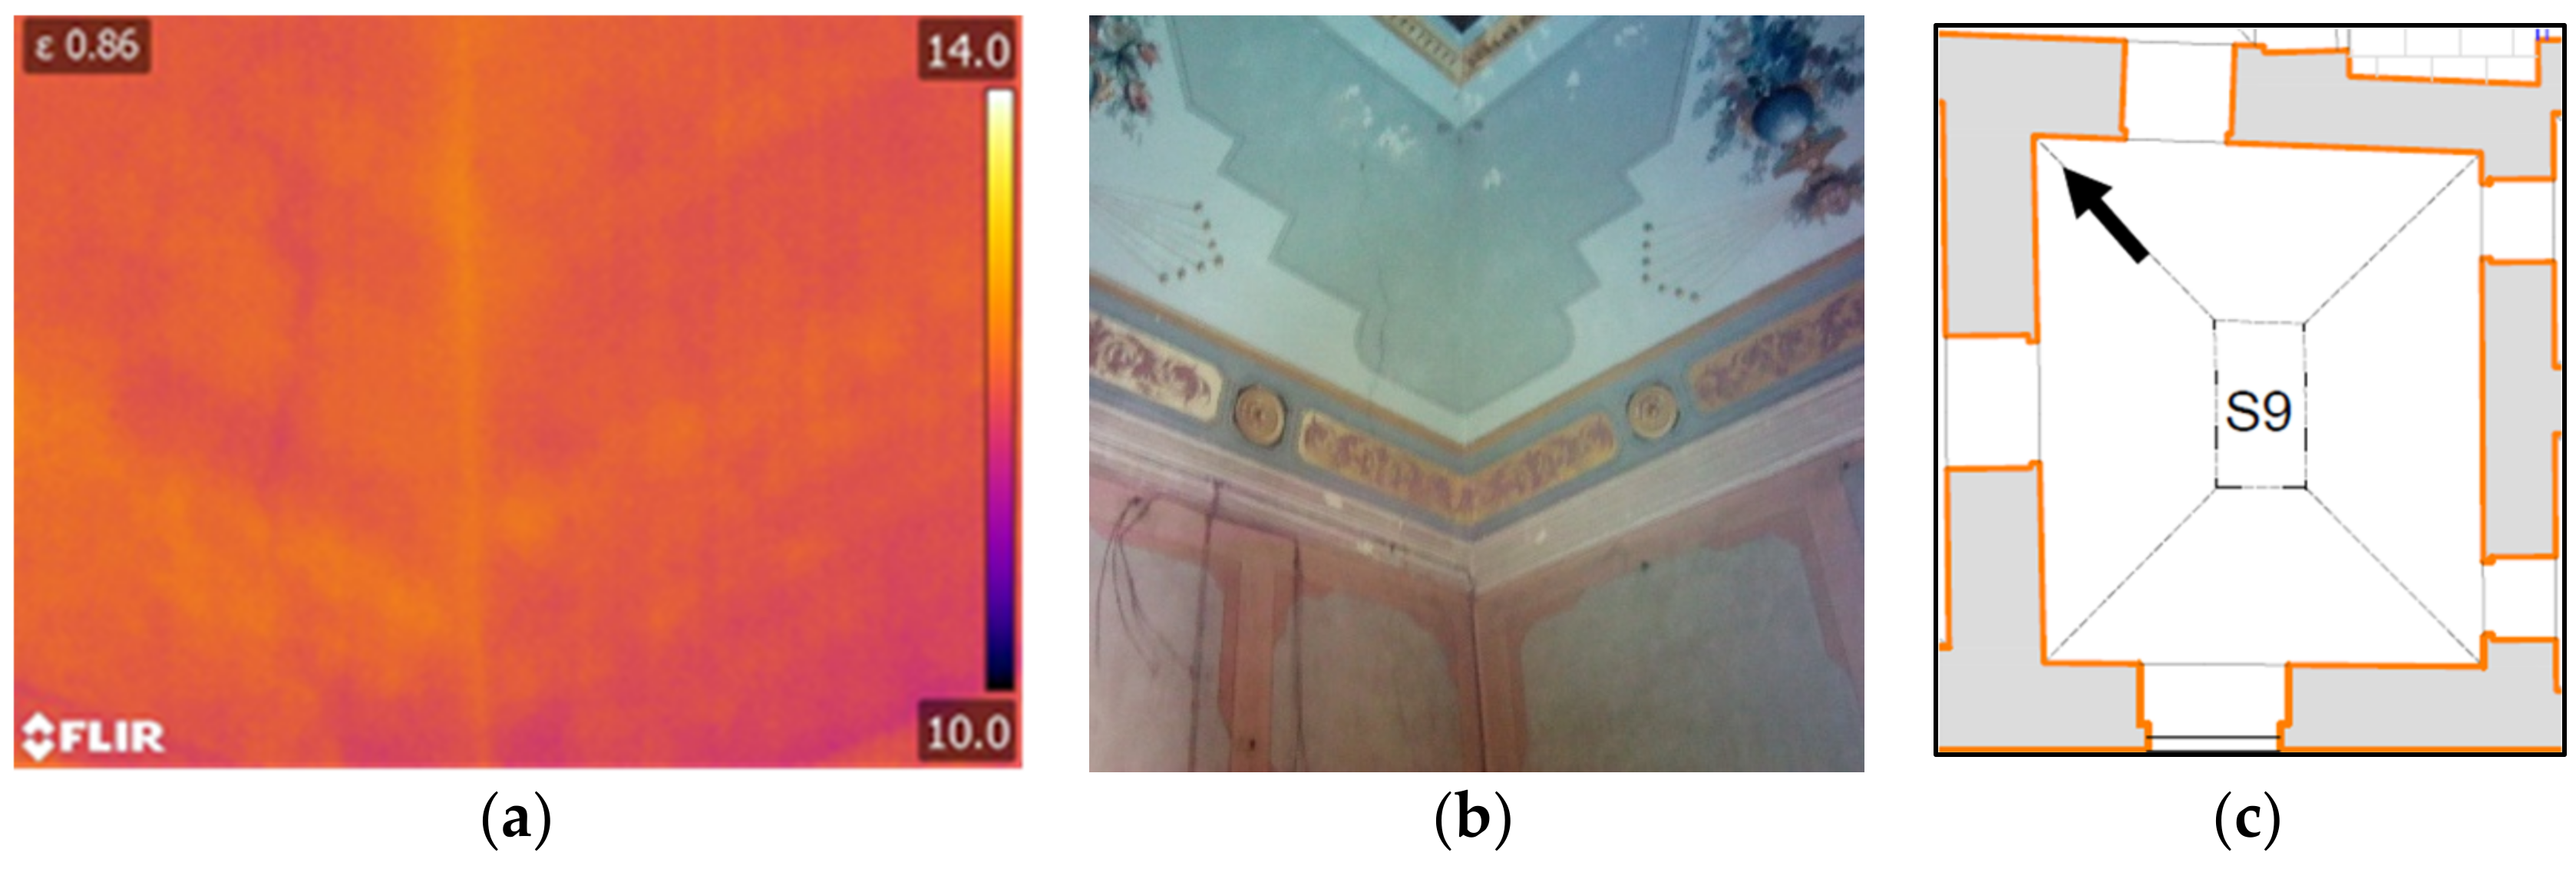
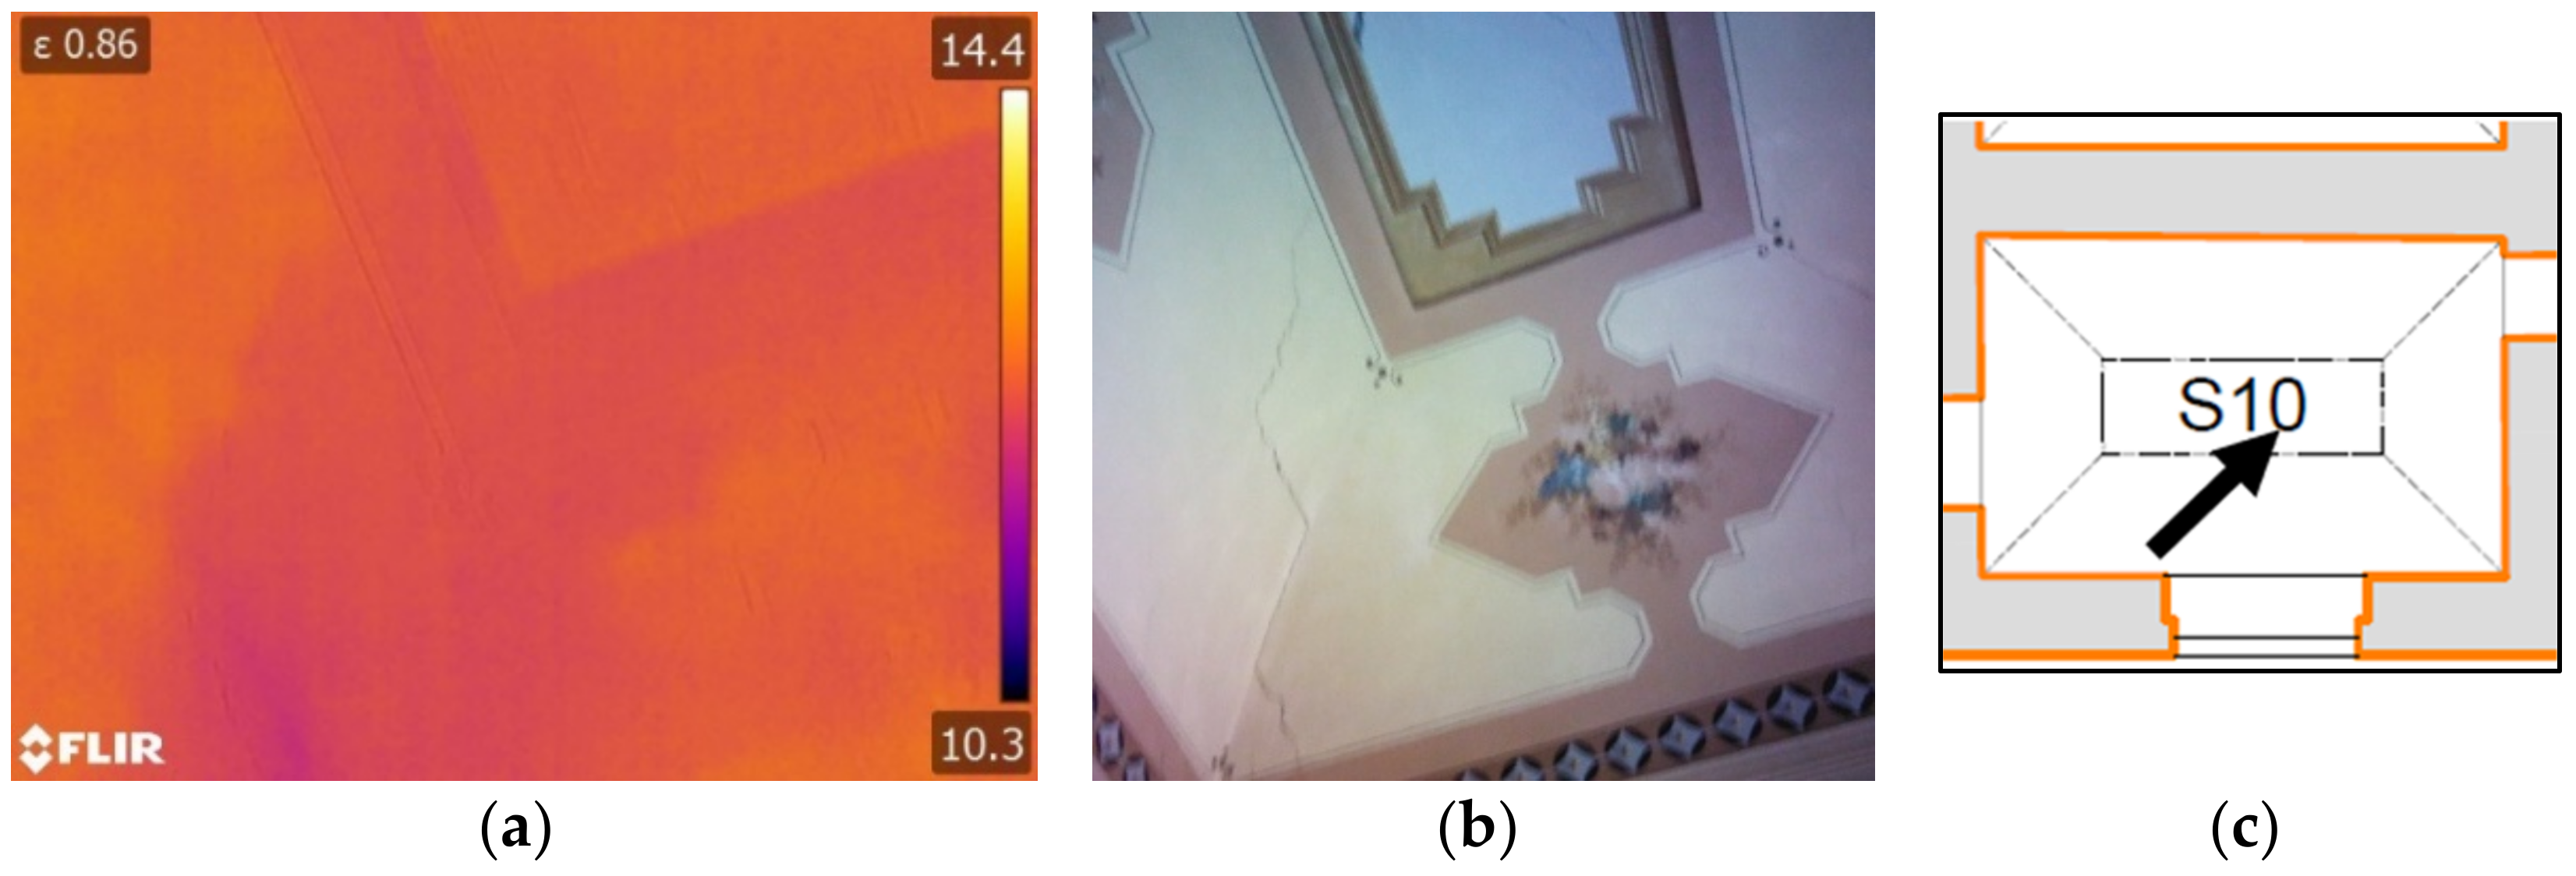
The keel vaults are characterized by semi-shells, which are portions of pavilion vaults, and, at the top, by a square or rectangular central plane made of a “flat” vault, i.e., a very low cloister vault (or with cloister vault head for a rectangular plan) probably levelled by the means of plaster layers. The thermographic investigation shows that these vaults are built with stone ashlars (room S7 in Figure 11, room S8 in Figure 12, room S9 in Figure 13 and room S10 in Figure 14). In some cases, the infrared survey makes evident some rows of calcarenite tufa starting from the vault impost. The thermograms of the flat central part do not show the presence of ashlars, probably due to the considerable thickness of the plaster. A change of color in the infrared is noted in the variation in the curvature to a flat configuration that is more affected by the heat exchange with the outside, uncovered in many parts (room S8 in Figure 12, room S9 in Figure 13 and room S10 in Figure 14).
Type of construction C: Camorcanna vault (false ceiling).
The so-called “camorcanna” system for the vaulted ceiling is only present in room S12 and it is partially collapsed, see Figure 15. It is made of reed mats tied with thread, arranged in a one-way direction and anchored to wooden ribs, which in turn are connected to the beams of the upper floor. A natural lime plaster was spread over the layer of reeds and then painted with frescoes (room S12 in Figure 16 and Figure 17).
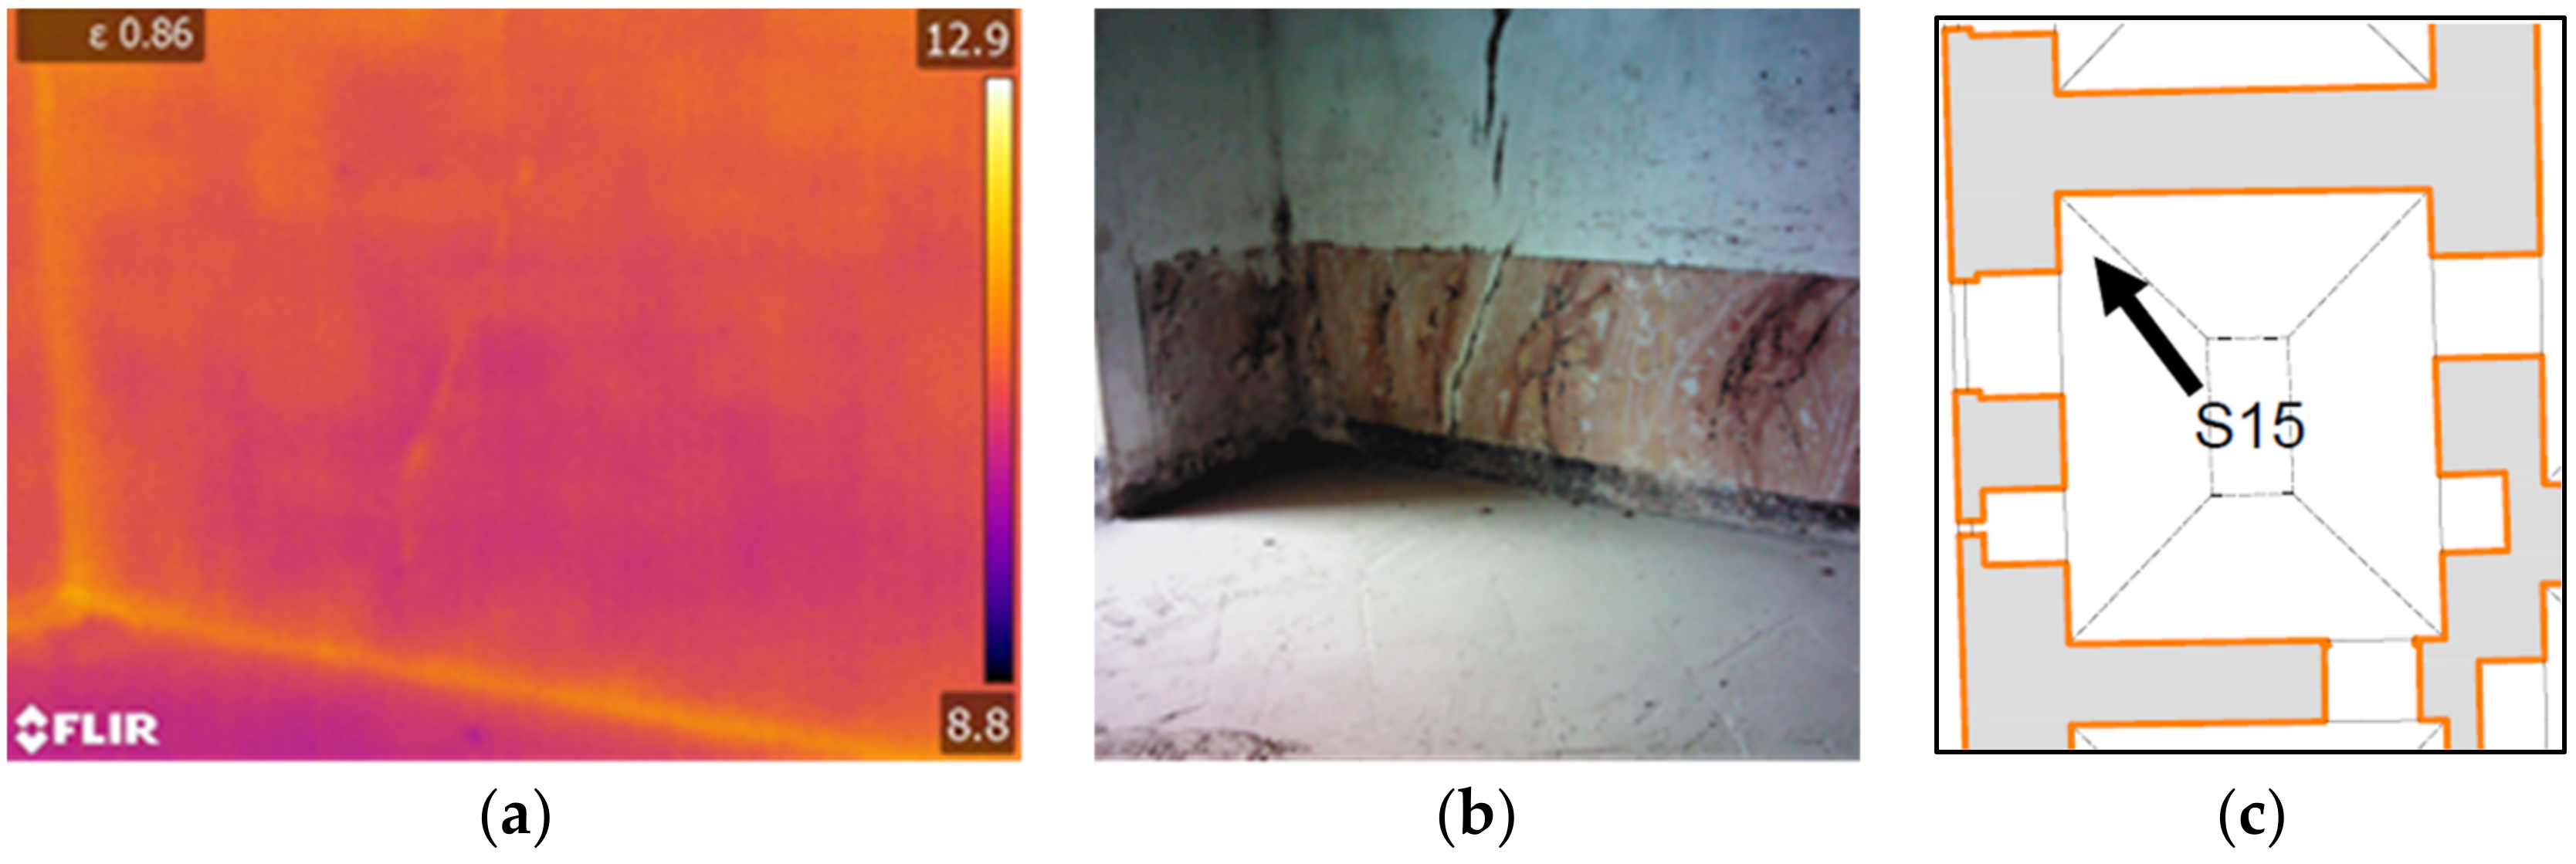
Through the infrared images, it was possible to identify the masonry ashlars with parallel courses, both in stone and in squared limestone blocks (Figure 6 and Figure 8). In particular, the perimeter walls are made of double-facing stone with a core filled with mortar and irregularly shaped stones. Some internal partition walls are entirely made of calcarenite blocks. In addition, in some cases, parallel rows of limestone are visible in the infrared to crown the stone walls. Concerning the connection between the perimeter walls and the internal walls, a thermal bridge is often detected, showing a structural discontinuity and therefore a poor connection (room S15 in Figure 18).
In many rooms, there are widespread cracks on the walls and vaults. In some cases, they are of considerable importance and severity (e.g., in Figure 13 and Figure 18). The infrared images revealed in some cases the path of the crack in relation to the wall structure.
Furthermore, numerous damp spots on both the vault and the masonry were found. The analysis of the thermograms made it possible to identify the material’s constructive characteristics and the state of conservation of the rooms under investigation. The coupling of each single IR shot with the simultaneously acquired visible image allowed immediate spatial positioning. The results of the analysis can be used as support for the planning of the static and seismic consolidation of the building, as they provide additional non-visible elements.

3.2. SonReb

A Schmidt rebound hammer and an Ultrasonic Pulse Analyzer (Pulsonic 58-E4900) were both used to perform a SonReb in situ experimental campaign. The SonReb is a non-destructive method to determine the compressive strength of existing construction materials. This non-invasive in situ test involves both the Schmidt rebound hammer [22] and the ultrasonic pulse velocity [23]. It must be mentioned that the references [22,23] are intended for concrete; nevertheless, they were adopted to define test conduction and the number of measurements. On the other hand, the correlation between rebound index, ultrasonic data and stone compressive strength was established according to [24]. Finally, the compressive strength of masonry can be determined from stone compressive strength, according to [20,25]. The experimental results collected using SonReb, also calibrated involving four destructive compressive tests, established a masonry compressive strength equal to 9.57 ± 0.10 MPa. It must be mentioned that different types of masonry textures were found in different walls, but the material can be considered homogenous.

3.3. Boroscopy

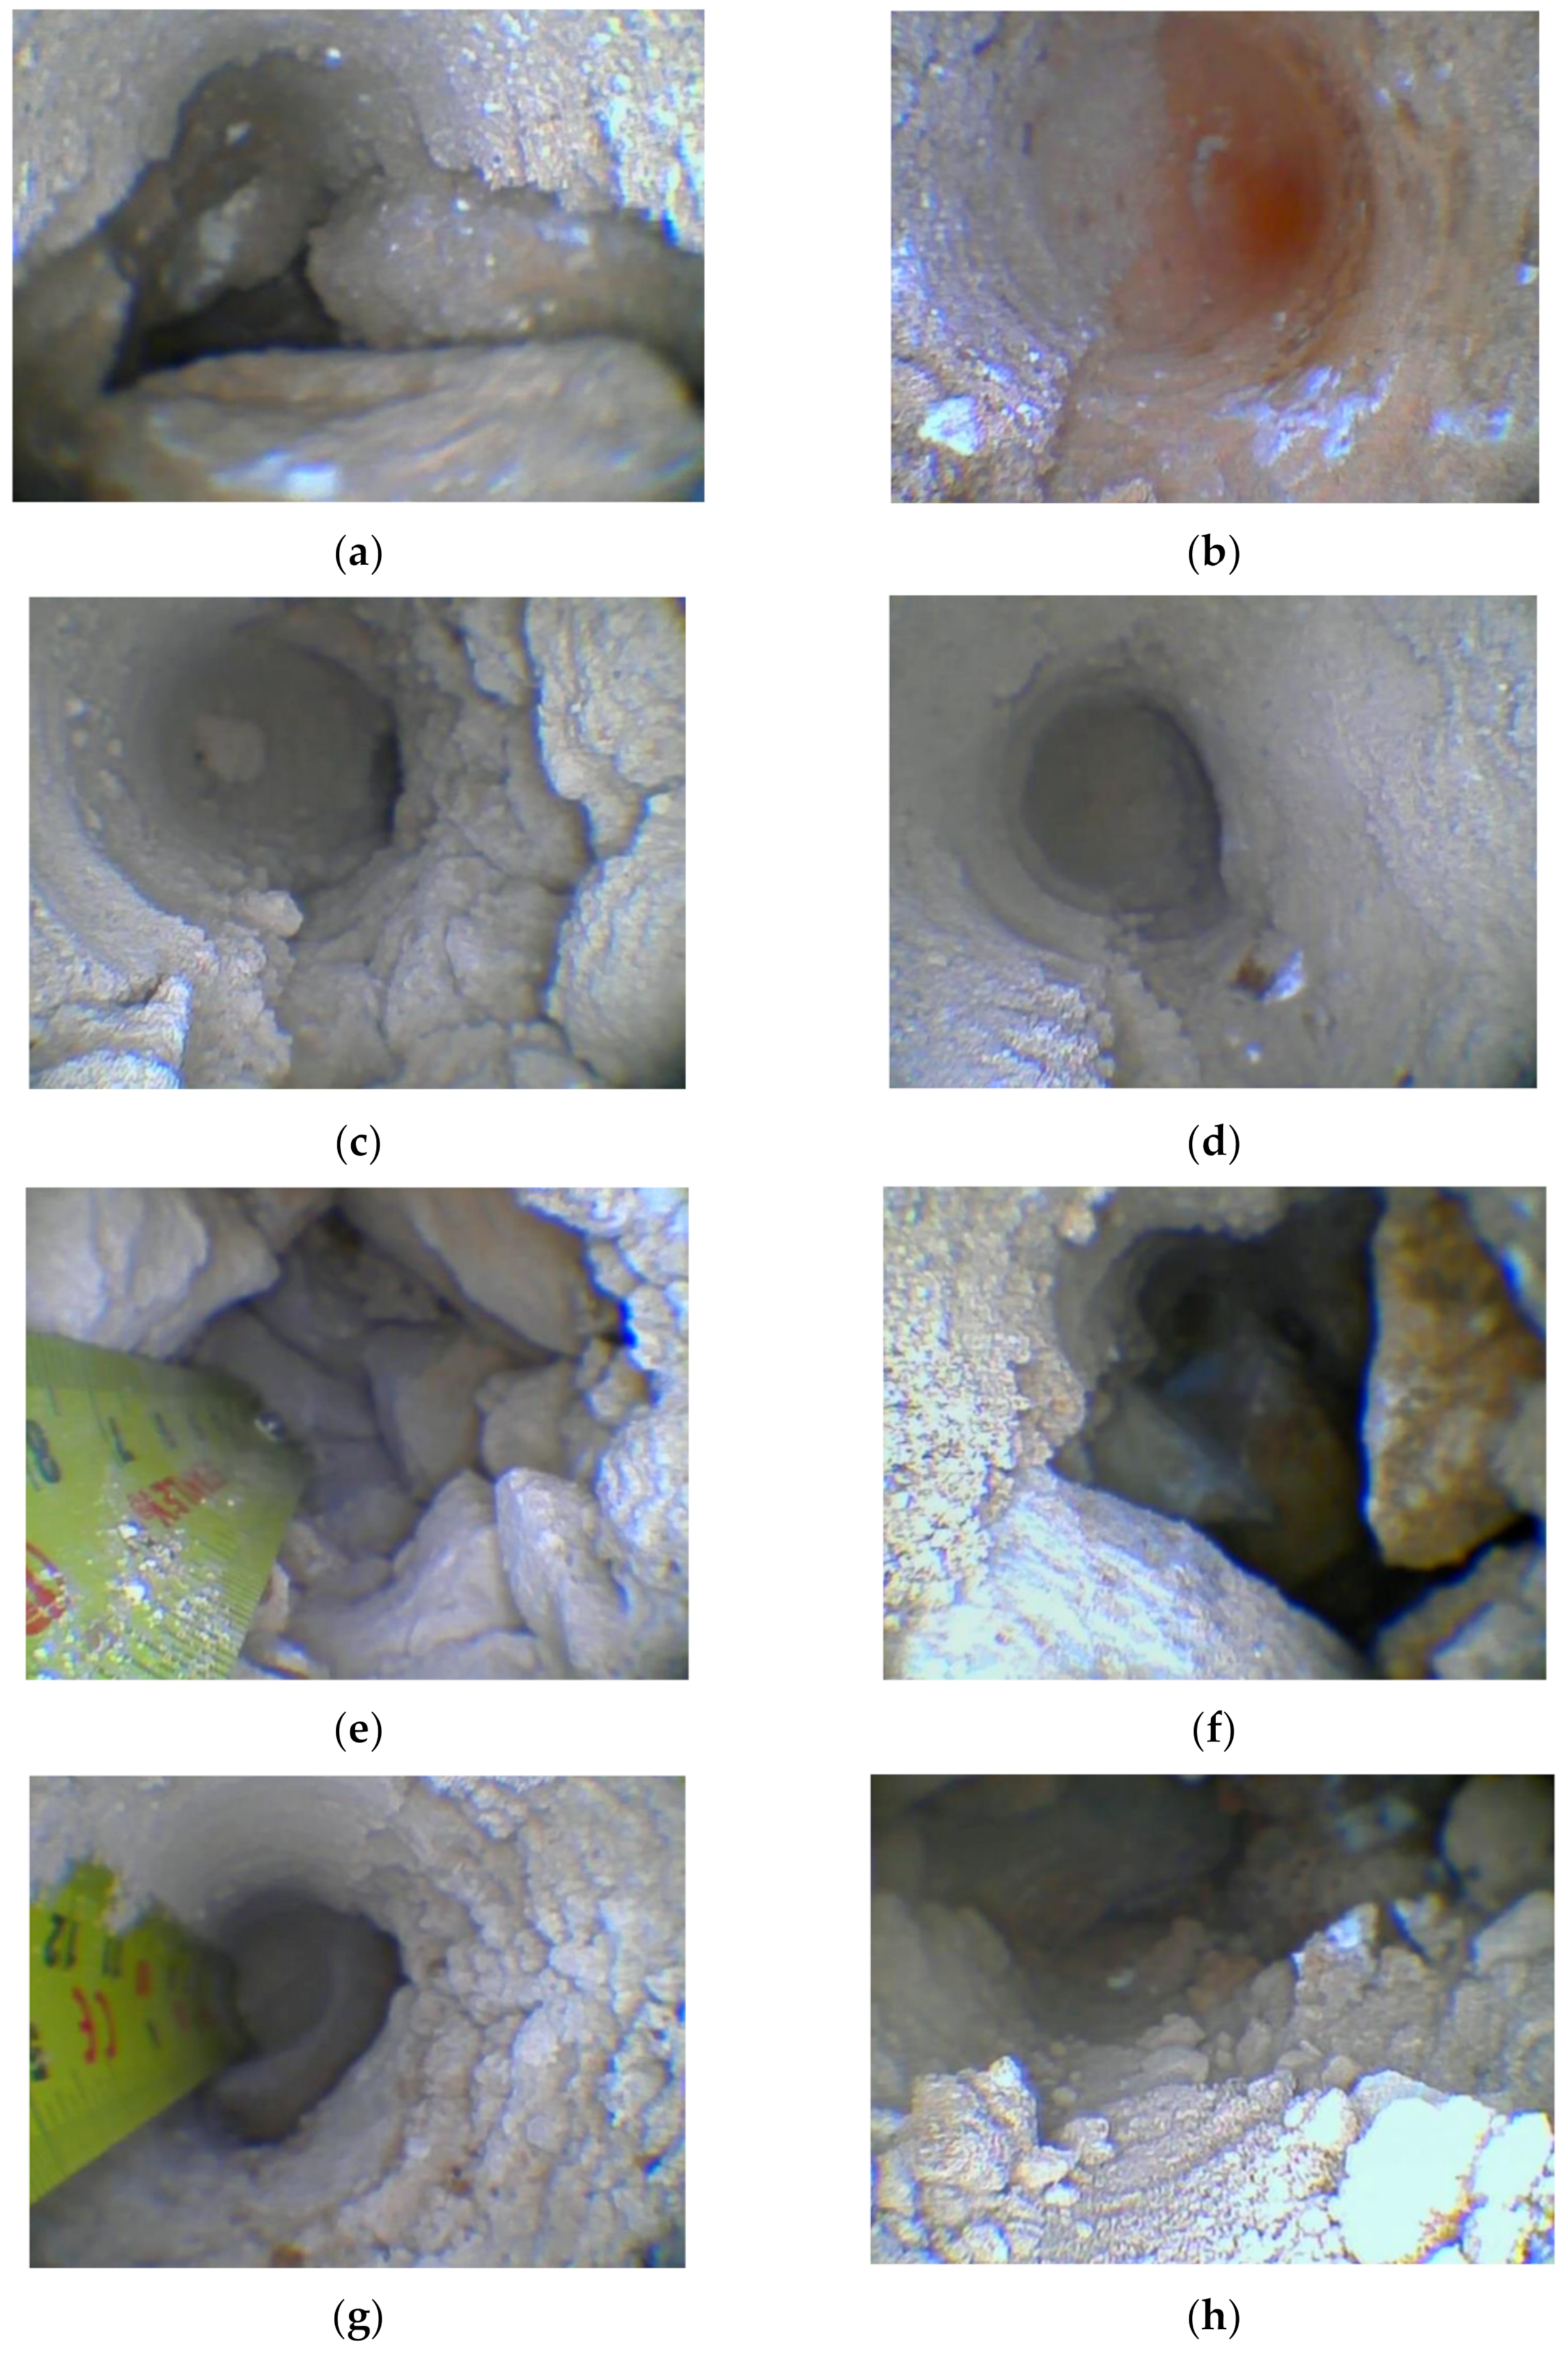
A Mincam GmbH inspection camera was adopted to perform a boroscopy test on eight different masonry walls. The boroscopy test is semi-destructive since it can be conducted using small holes (i.e., 20–30 mm). The acquired images (Figure 19) were useful to better understand the different masonry types and to detect three individual walls unbonded each other. As a result, the wall cannot be considered as a single 60 cm-thick wall, but it is made of three unclamped 20 cm-thick walls.

4. Structural Analysis

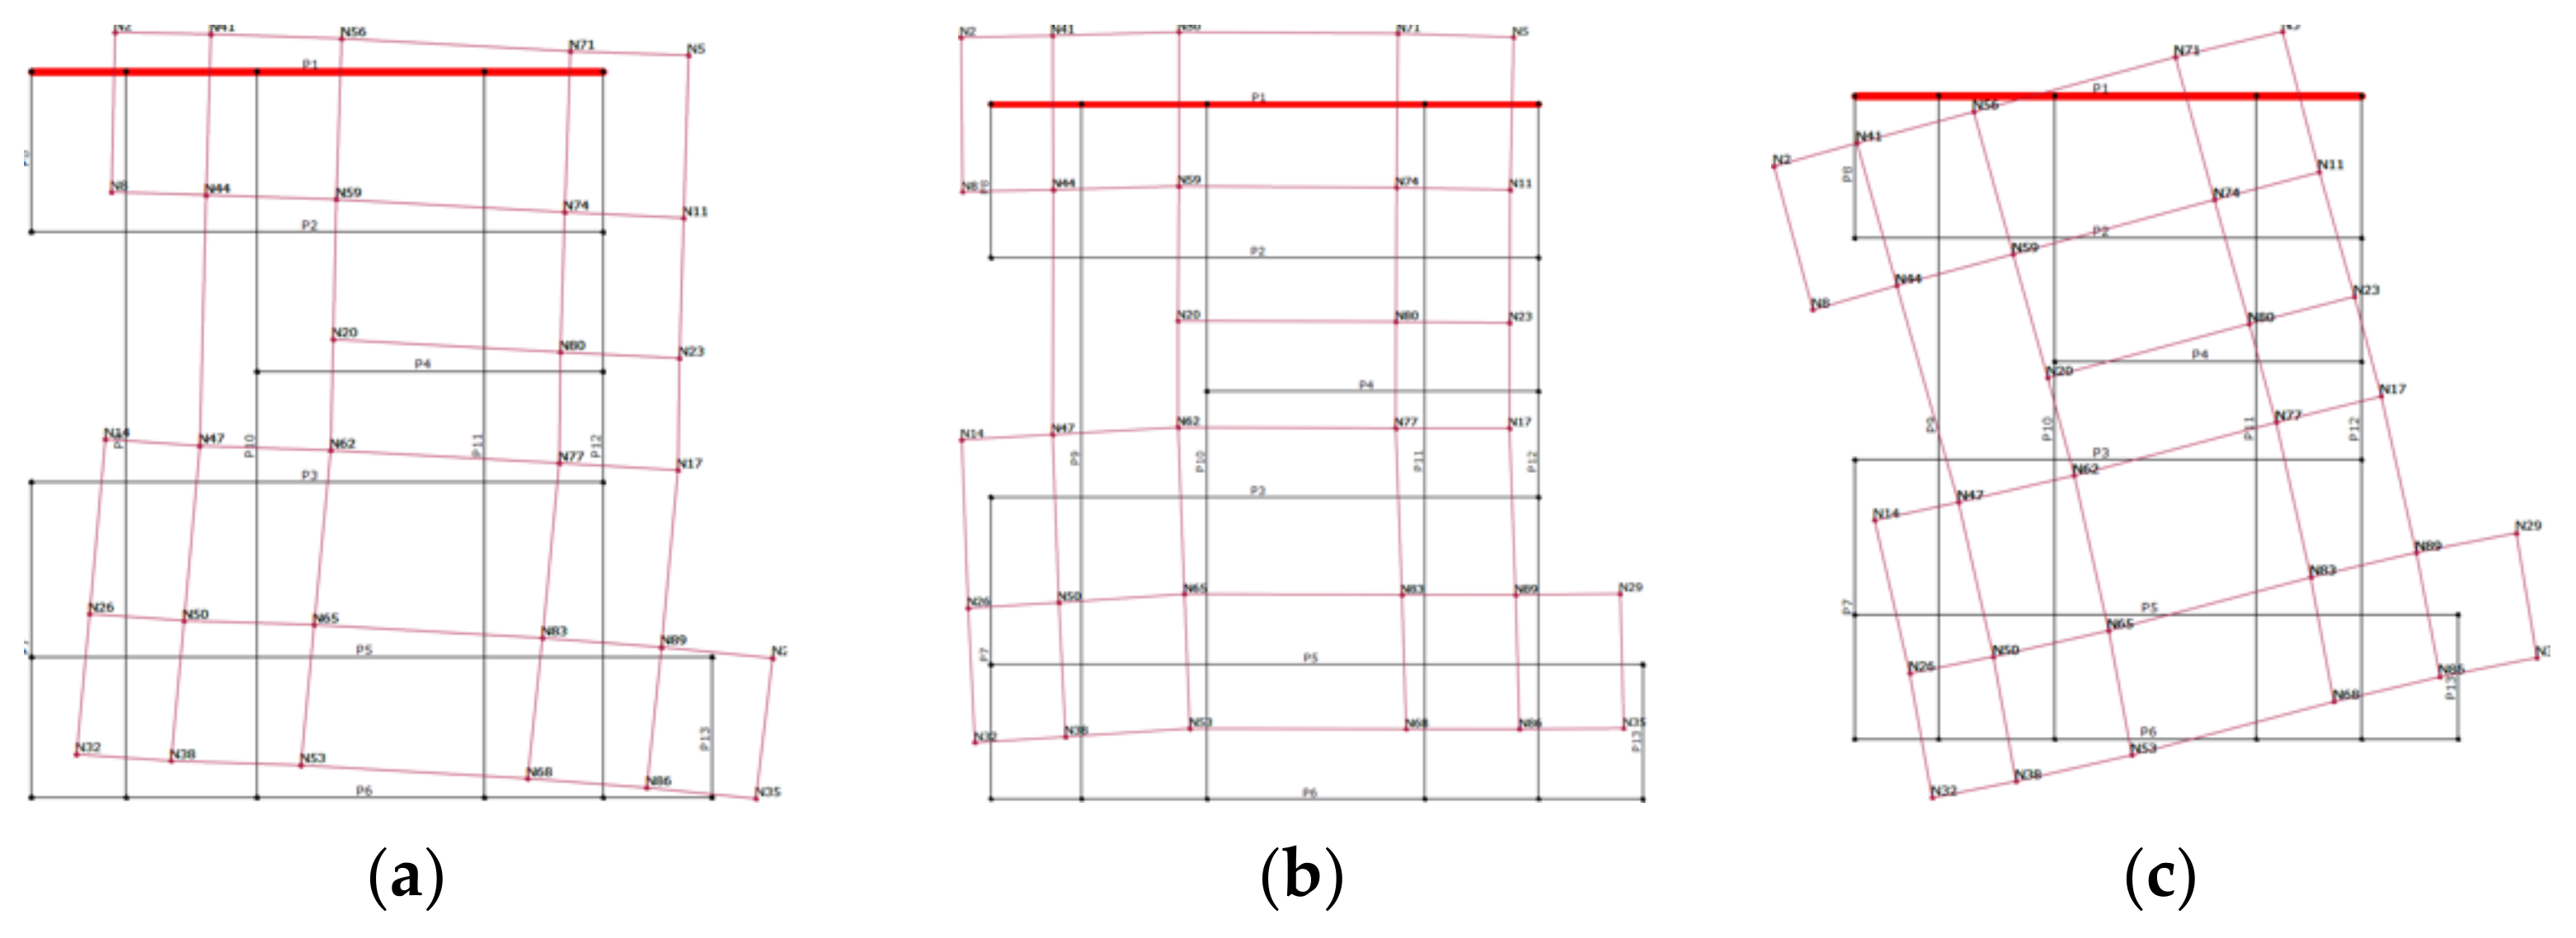
The response of the structure has been investigated by implementing a simplified 3D finite element model in the software 3Muri® [26]. In order to simulate the multi-leaf wall, the mass related to the total thickness and the strength of a single leaf were inputted. The masonry structure was simulated according to the equivalent frame approach [27]. In particular, the in-plane response of masonry walls with openings can be investigated by involving two main structural components: piers and spandrels. Piers are the vertical resistant elements, while spandrel elements represent parts of walls between two vertical openings. In this case, the vertical piers and the horizontal spandrels were modeled as non-linear beams, while the connections between each other are modeled as rigid links. Based on the in-situ investigation results and according to the suggestions reported in [20], the Young’s modulus of masonry was assumed to be equal to 2850 MPa. The cross-section of the beam-type elements (equivalent frame) was assessed based on the geometry of the openings, as well as the height and the thickness of the masonry walls. The obtained FEM model is illustrated in Figure 20. To perform a preliminary analysis for investigating the model’s sensitivity with respect to the floor stiffness, the simplifications listed in the following were assumed:
  • Just two floors were modeled, or rather the basement and mezzanine floor were neglected (due to the absence of vaulted floors and seismic forces, respectively);
  • All the balconies (i.e., cantilevered slabs) were modeled, only considering their seismic mass to avoid local vibration modes;
  • Fixed support at the ground level was considered;
  • To avoid numerical convergence issues, the masonry walls were assumed to be perpendicular to each other.
Figure 20. Three-dimensional view of the structural FEM model: piers in orange, spandrels in green and rigid links in blue.
Heritage 05 00107 g020
In this preliminary model, the self-weight of masonry and the loads associated with the slabs were considered, according to [25]. The permanent structural load (G1), permanent non-structural load (G2) and live load (Qk) were associated with every slab. The entire load was assigned to the linked walls according to the type of vaulted roof.
Non-linear beam elements were involved in the modeling of masonry piers and spandrels, as mentioned above. A degrading behavior was assumed, as displaced in Figure 21. According to the software user manual, the main features of non-linear elements are:
(1)
Initial stiffness given by elastic (cracked) properties;
(2)
Bilinear behavior with maximum values of shear and bending moment as calculated in ultimate limit states;
(3)
Redistribution of the internal forces according to the element equilibrium;
(4)
Detection of damage limit states, considering global and local damage parameters;
(5)
Stiffness degradation in the plastic range;
(6)
Ductility control by the definition of maximum drift (δu) based on the failure mechanism, according to the Italian seismic code and Eurocode 8;
(7)
Element discarded from analysis at ultimate drift reached without interruption of global analysis.
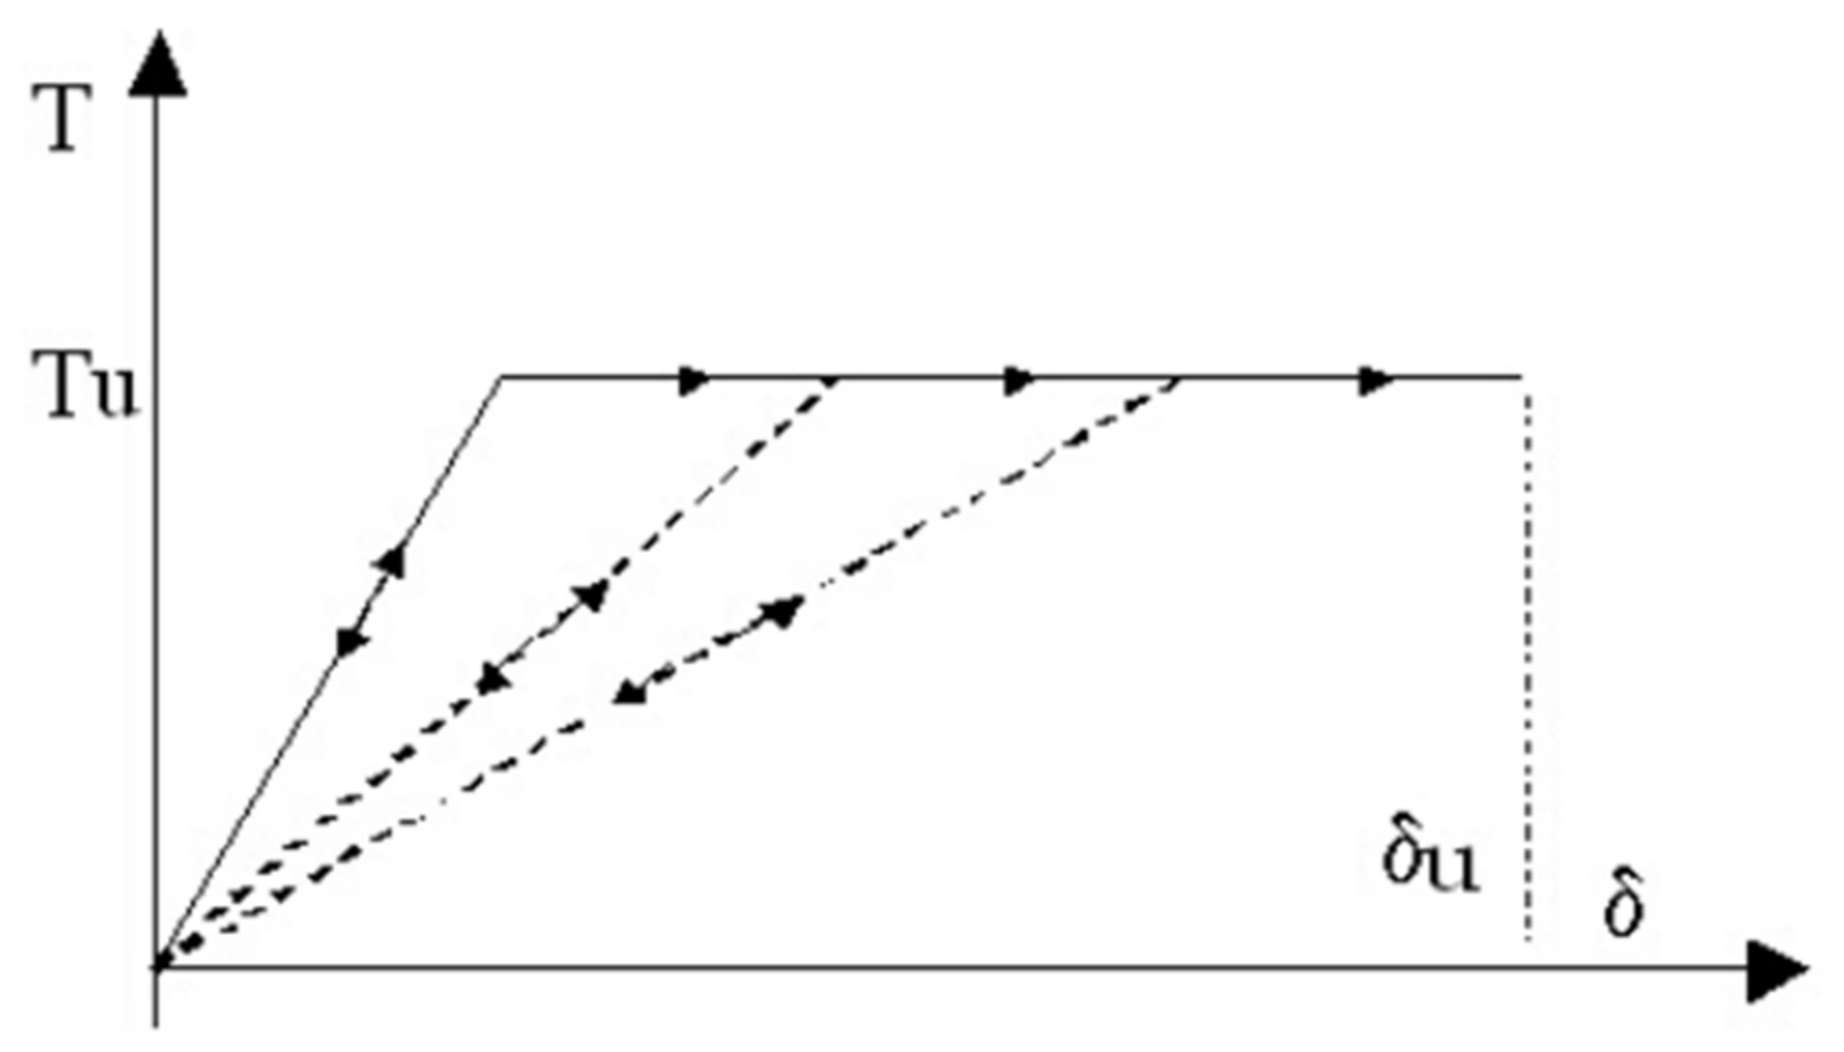
Figure 21. Non-linear beam law in terms of shear (T) versus displacement (δ).
Heritage 05 00107 g021
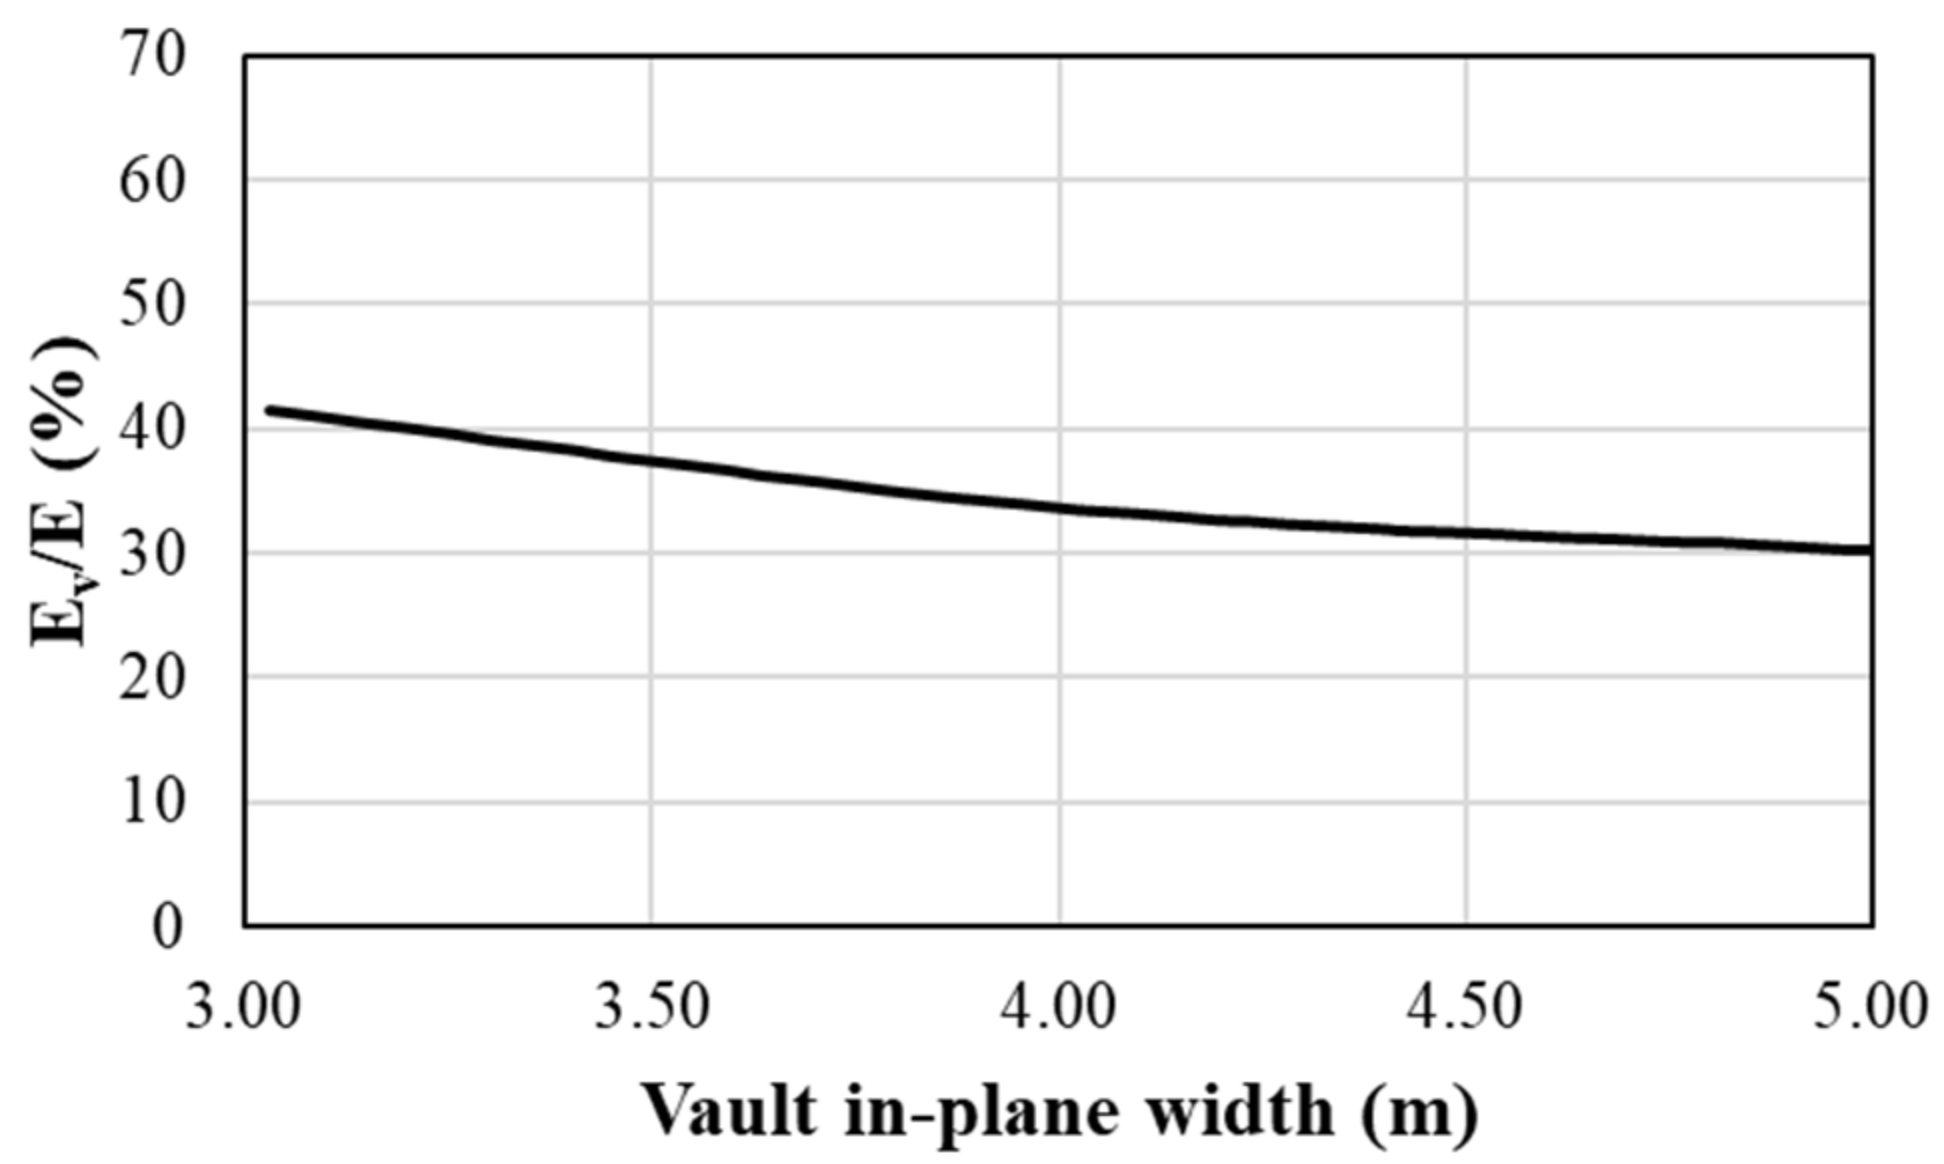
For the diagnosis, the considered building has many different vaults. This type of element is hard to simulate using finite element analysis and, consequently, the behavior of masonry vaults was modeled through equivalent plane elements. The model proposed in [28] was already applied to simulate the global behavior of an entire building by substituting the vaulted roofs with equivalent diaphragms [29]. For every type of vault, an ideal diaphragm can be defined as a generally orthotropic plate with the same footprint and the same thickness of the original vault. Through the formulations presented in [28,29], the longitudinal stiffness and tangential stiffness of the vaults were computed, as reported in Table 1 and Figure 22. It must be mentioned that the material characterizing the masonry vaults was assumed to be equal to wall masonry, while the “bubbole” tangential modulus was assumed to be equal to half the one of the masonry vaults. In both cases, the equivalent modulus (Ev in Figure 22) was assumed to be equal to 30% of the material’s modulus. Three different models were adopted to perform modal analysis. The first model, namely, Infinite Stiffness Floor (ISF), considers every floor element with an infinite in-plane stiffness. On the contrary, the second one was made under the assumption that every floor element has no in-plane stiffness (namely, Zero Stiffness Floor, ZFS). In the third model, the in-plane stiffness was computed from data in Table 1 and it was labeled as Computed Stiffness Floor (CSF).
Moreover, the three models were analyzed with both 100% and 50% of the total Young’s modulus. In fact, according to [20], the presence of diffusive cracking in the masonry can be taken into account by reducing Young’s modulus up to 50% of its value. Consequently, the models’ nomenclature presents 50 or 100 at the end to indicate the stiffness percentage assumed for the material (e.g., in ISF_50 and ISF_100).

4.1. Modal Analysis

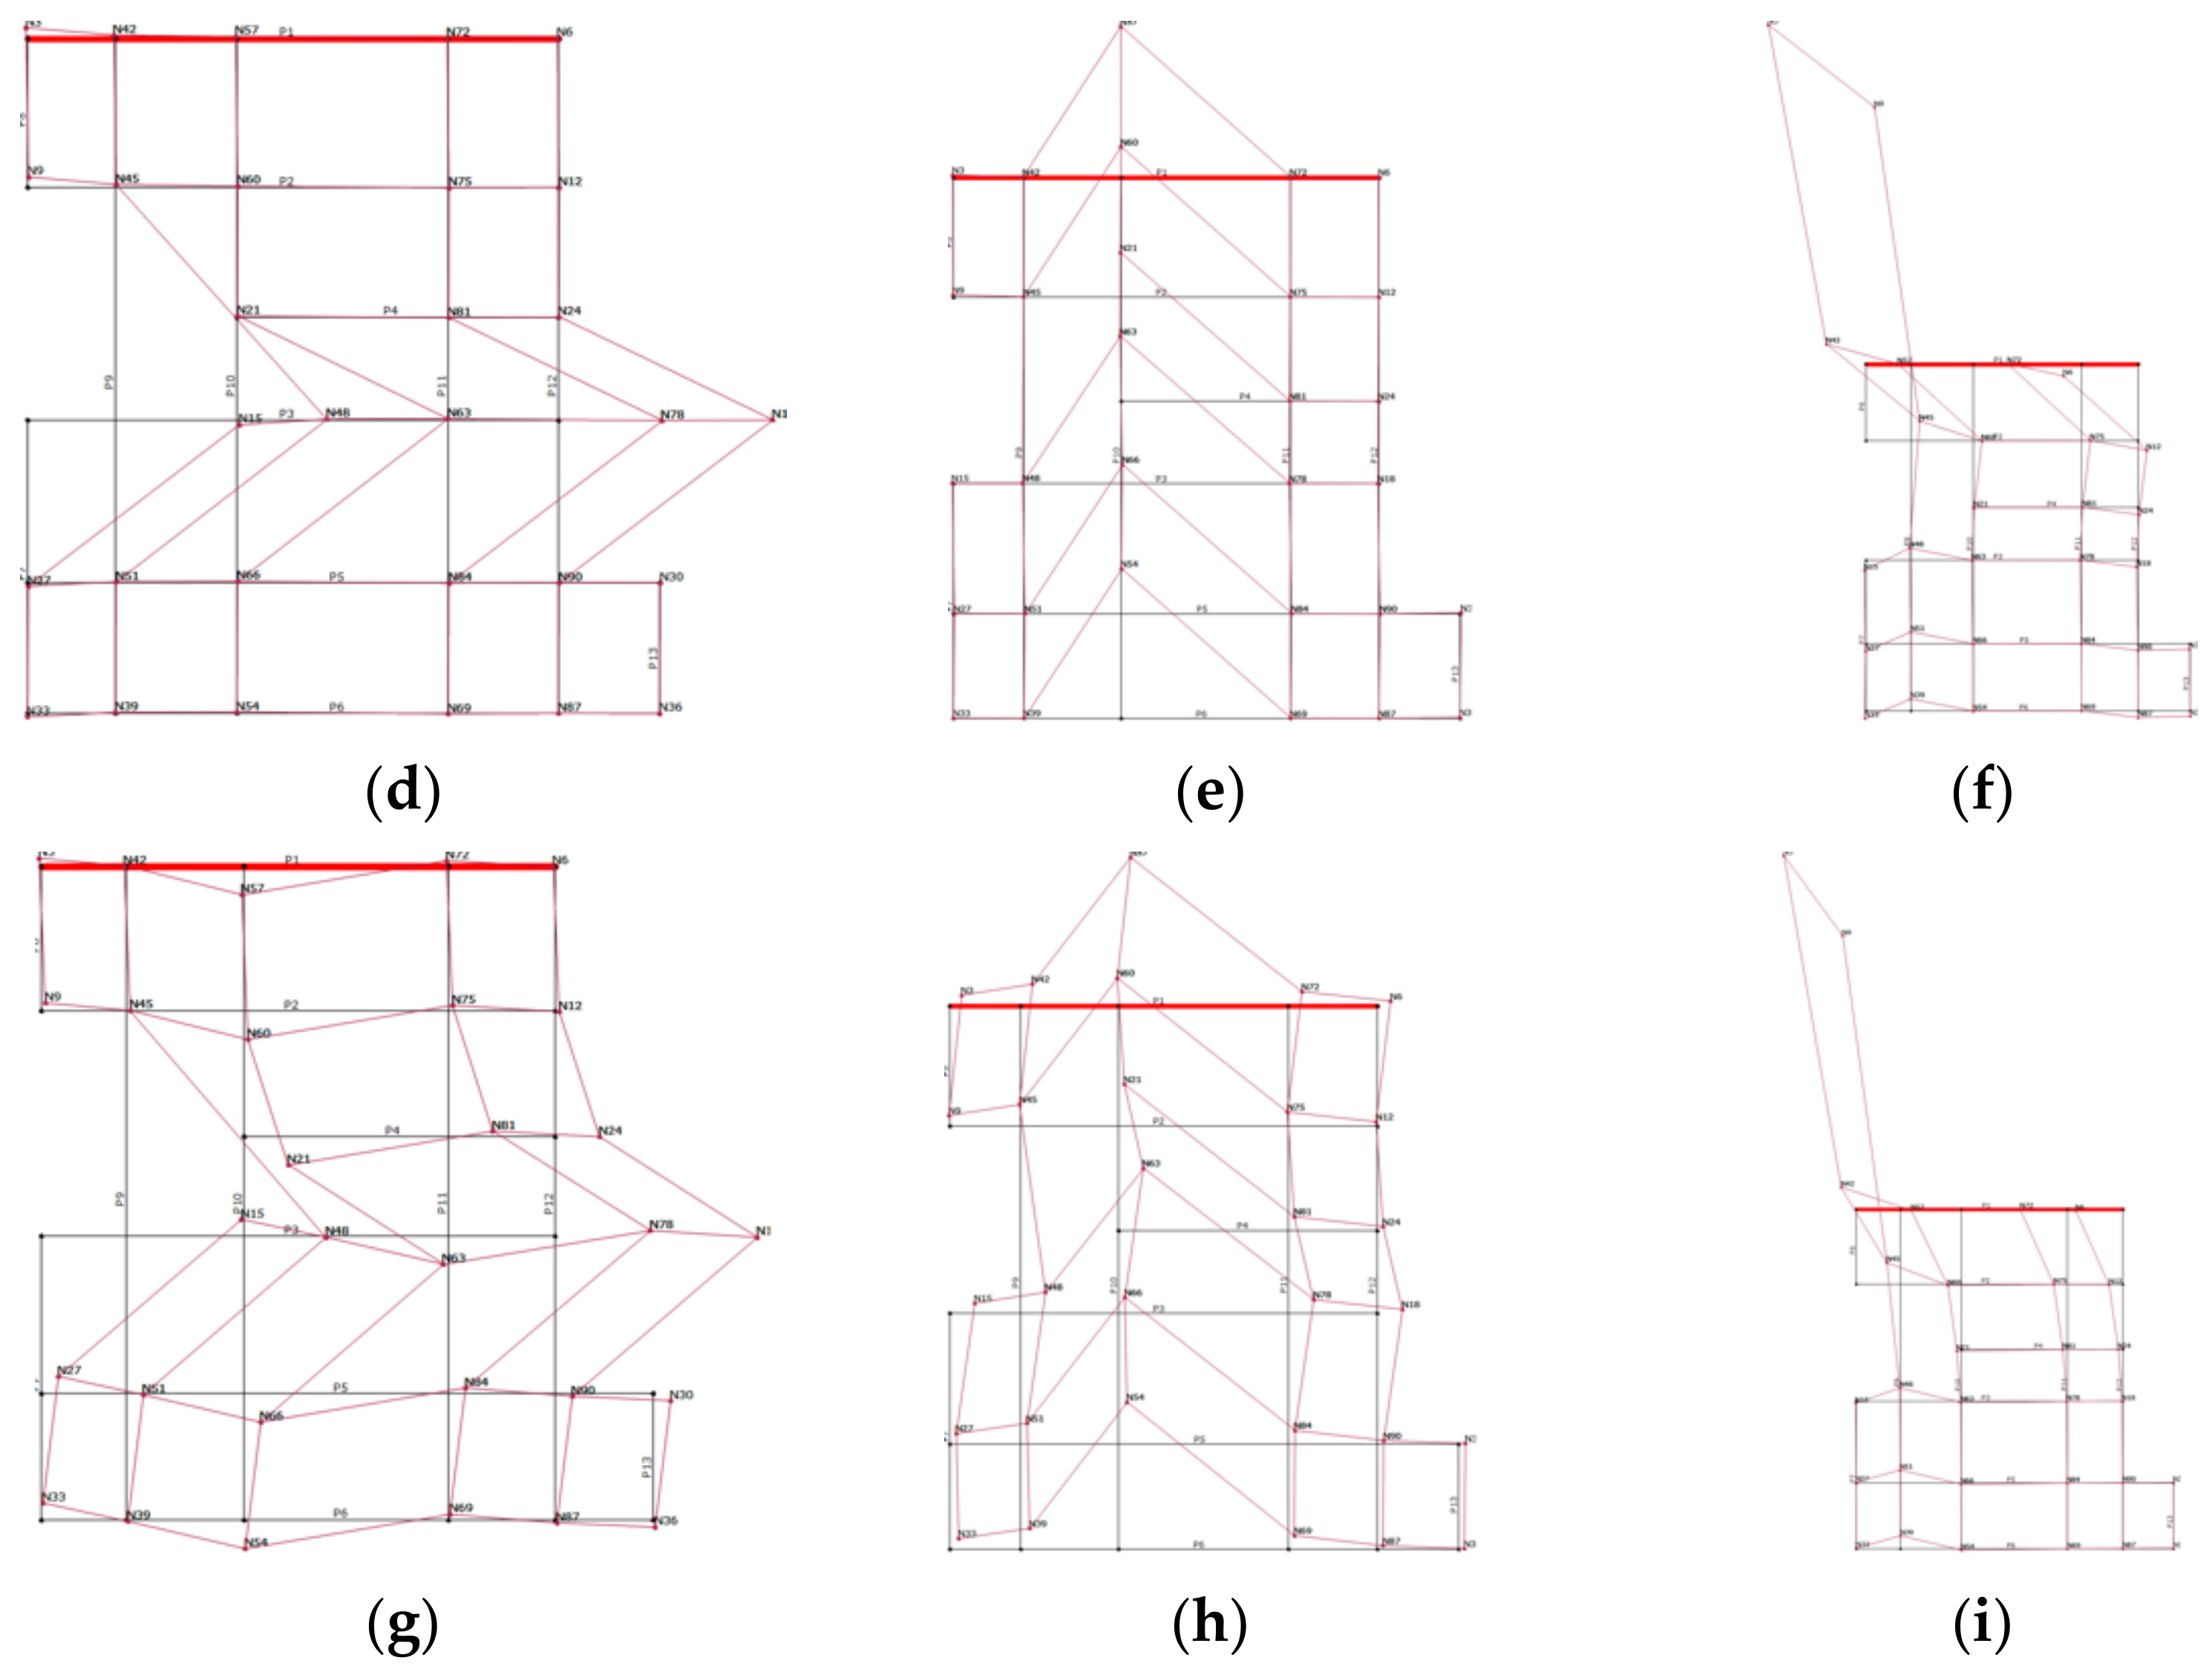
The modal analysis’ results, referring to the first three modal shapes of each configuration, are reported in Table 2. Moreover, the respective displacement contour plots are collected in Figure 23 and Figure 24. In Figure 23, the red color represents the maximum displacement, while the black one represents the minimum displacement. The results confirmed the well-known behavior of masonry structures in the presence or absence of a rigid diaphragm. As a matter of fact, in Figure 23a–c, the displacement of the entire last floor was found to be uniform, because ISF_50 nodes, belonging to the same plane, were in-plane connected. On the other side, in the case of ZSF_50 (Figure 23d–f), the displacement of some elements was more pronounced, due to a lack of in-plane connection with the other nodes belonging to the same plane. From the results in Figure 23g–I, it appears that the behavior of CFS_50 was similar to ZSF_50, although the first three modes involve more masonry panels. This result evidenced that the contribution of floor in-plane stiffness cannot be neglected, also according to previous research by Capanna et al. [30]. Furthermore, the participating mass data confirmed what modal shapes suggested: the models with the rigid plane activated a higher percentage of mass.
Similar considerations can be drawn for the models ISF_100, ZSF_100 and CSF_100, in which the Young’s modulus was not reduced (see Figure 24a–i). As a matter of fact, the presence of a stiffer material resulted in a higher stiffness of the entire building, as can been noted from higher frequencies in Table 2.

4.2. Pushover Analysis

The response of the structure was also investigated through a pushover analysis using the three numerical models previously described. According to Italian Design Code [25], two different horizontal load distributions were applied:
Uniform: a distribution of forces deduced from a uniform trend of accelerations along the height of construction;
Static: a distribution of forces proportional to static forces (i.e., the ones involved in equivalent static analysis).
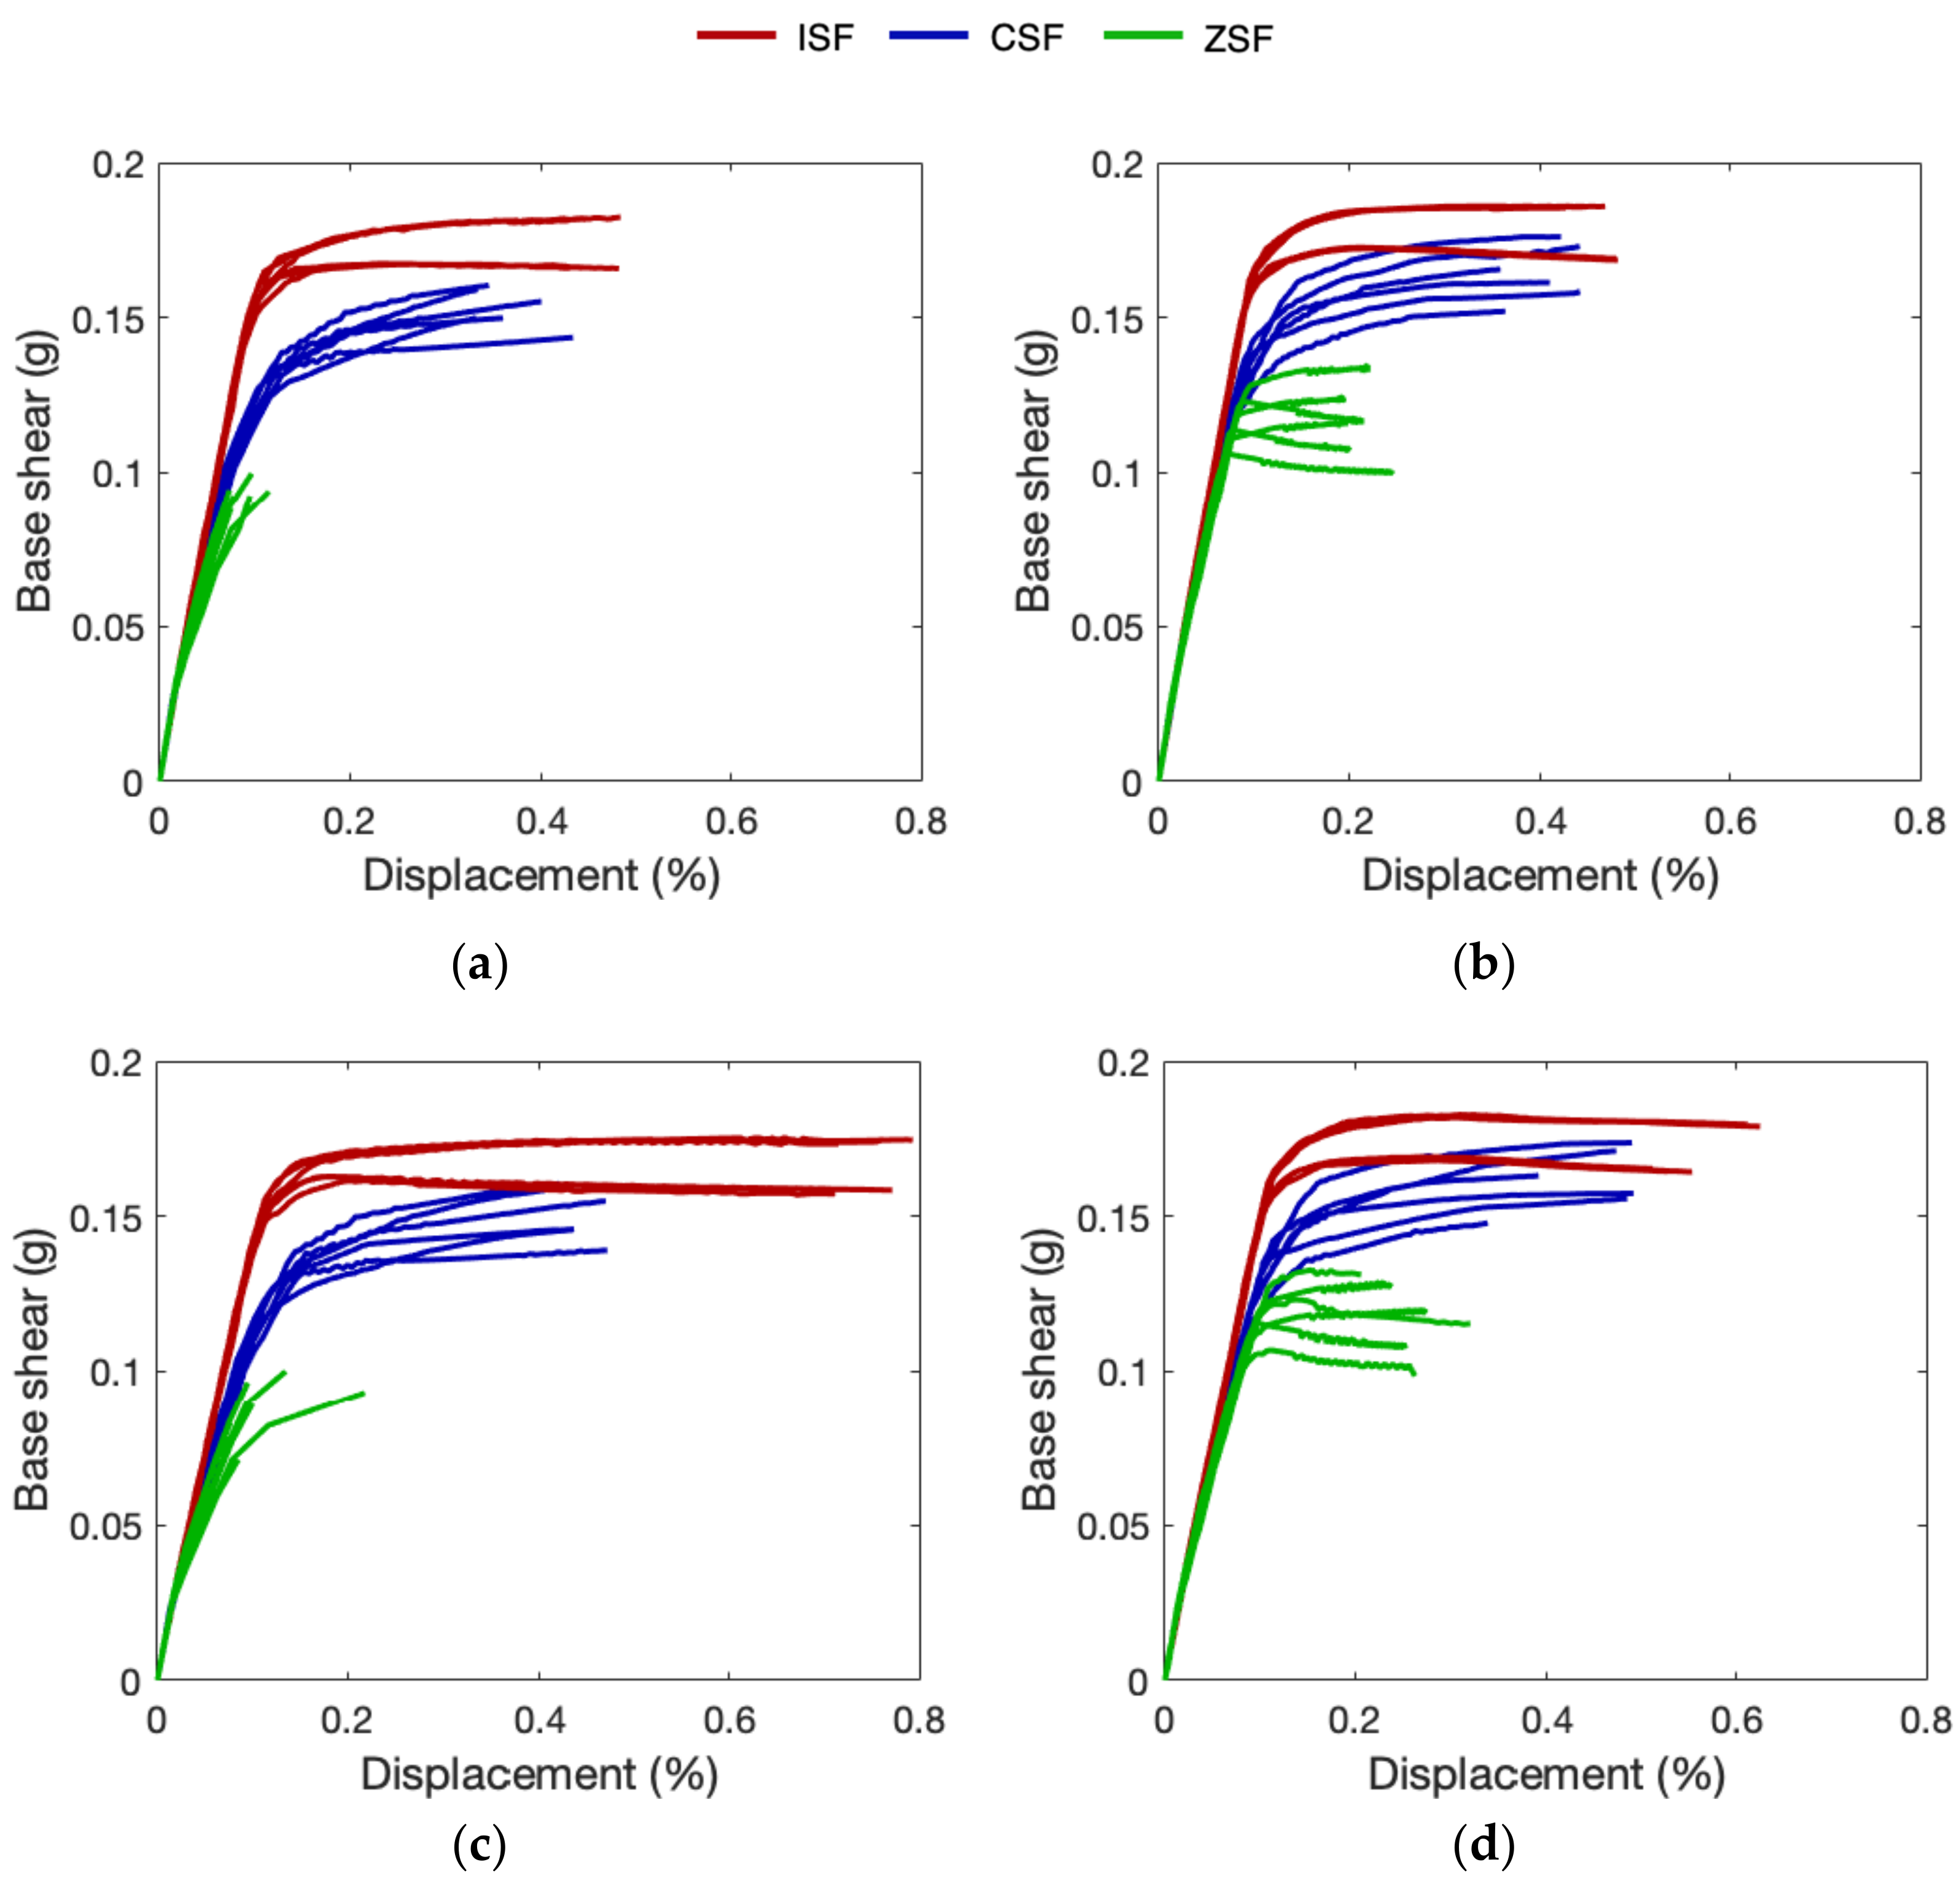
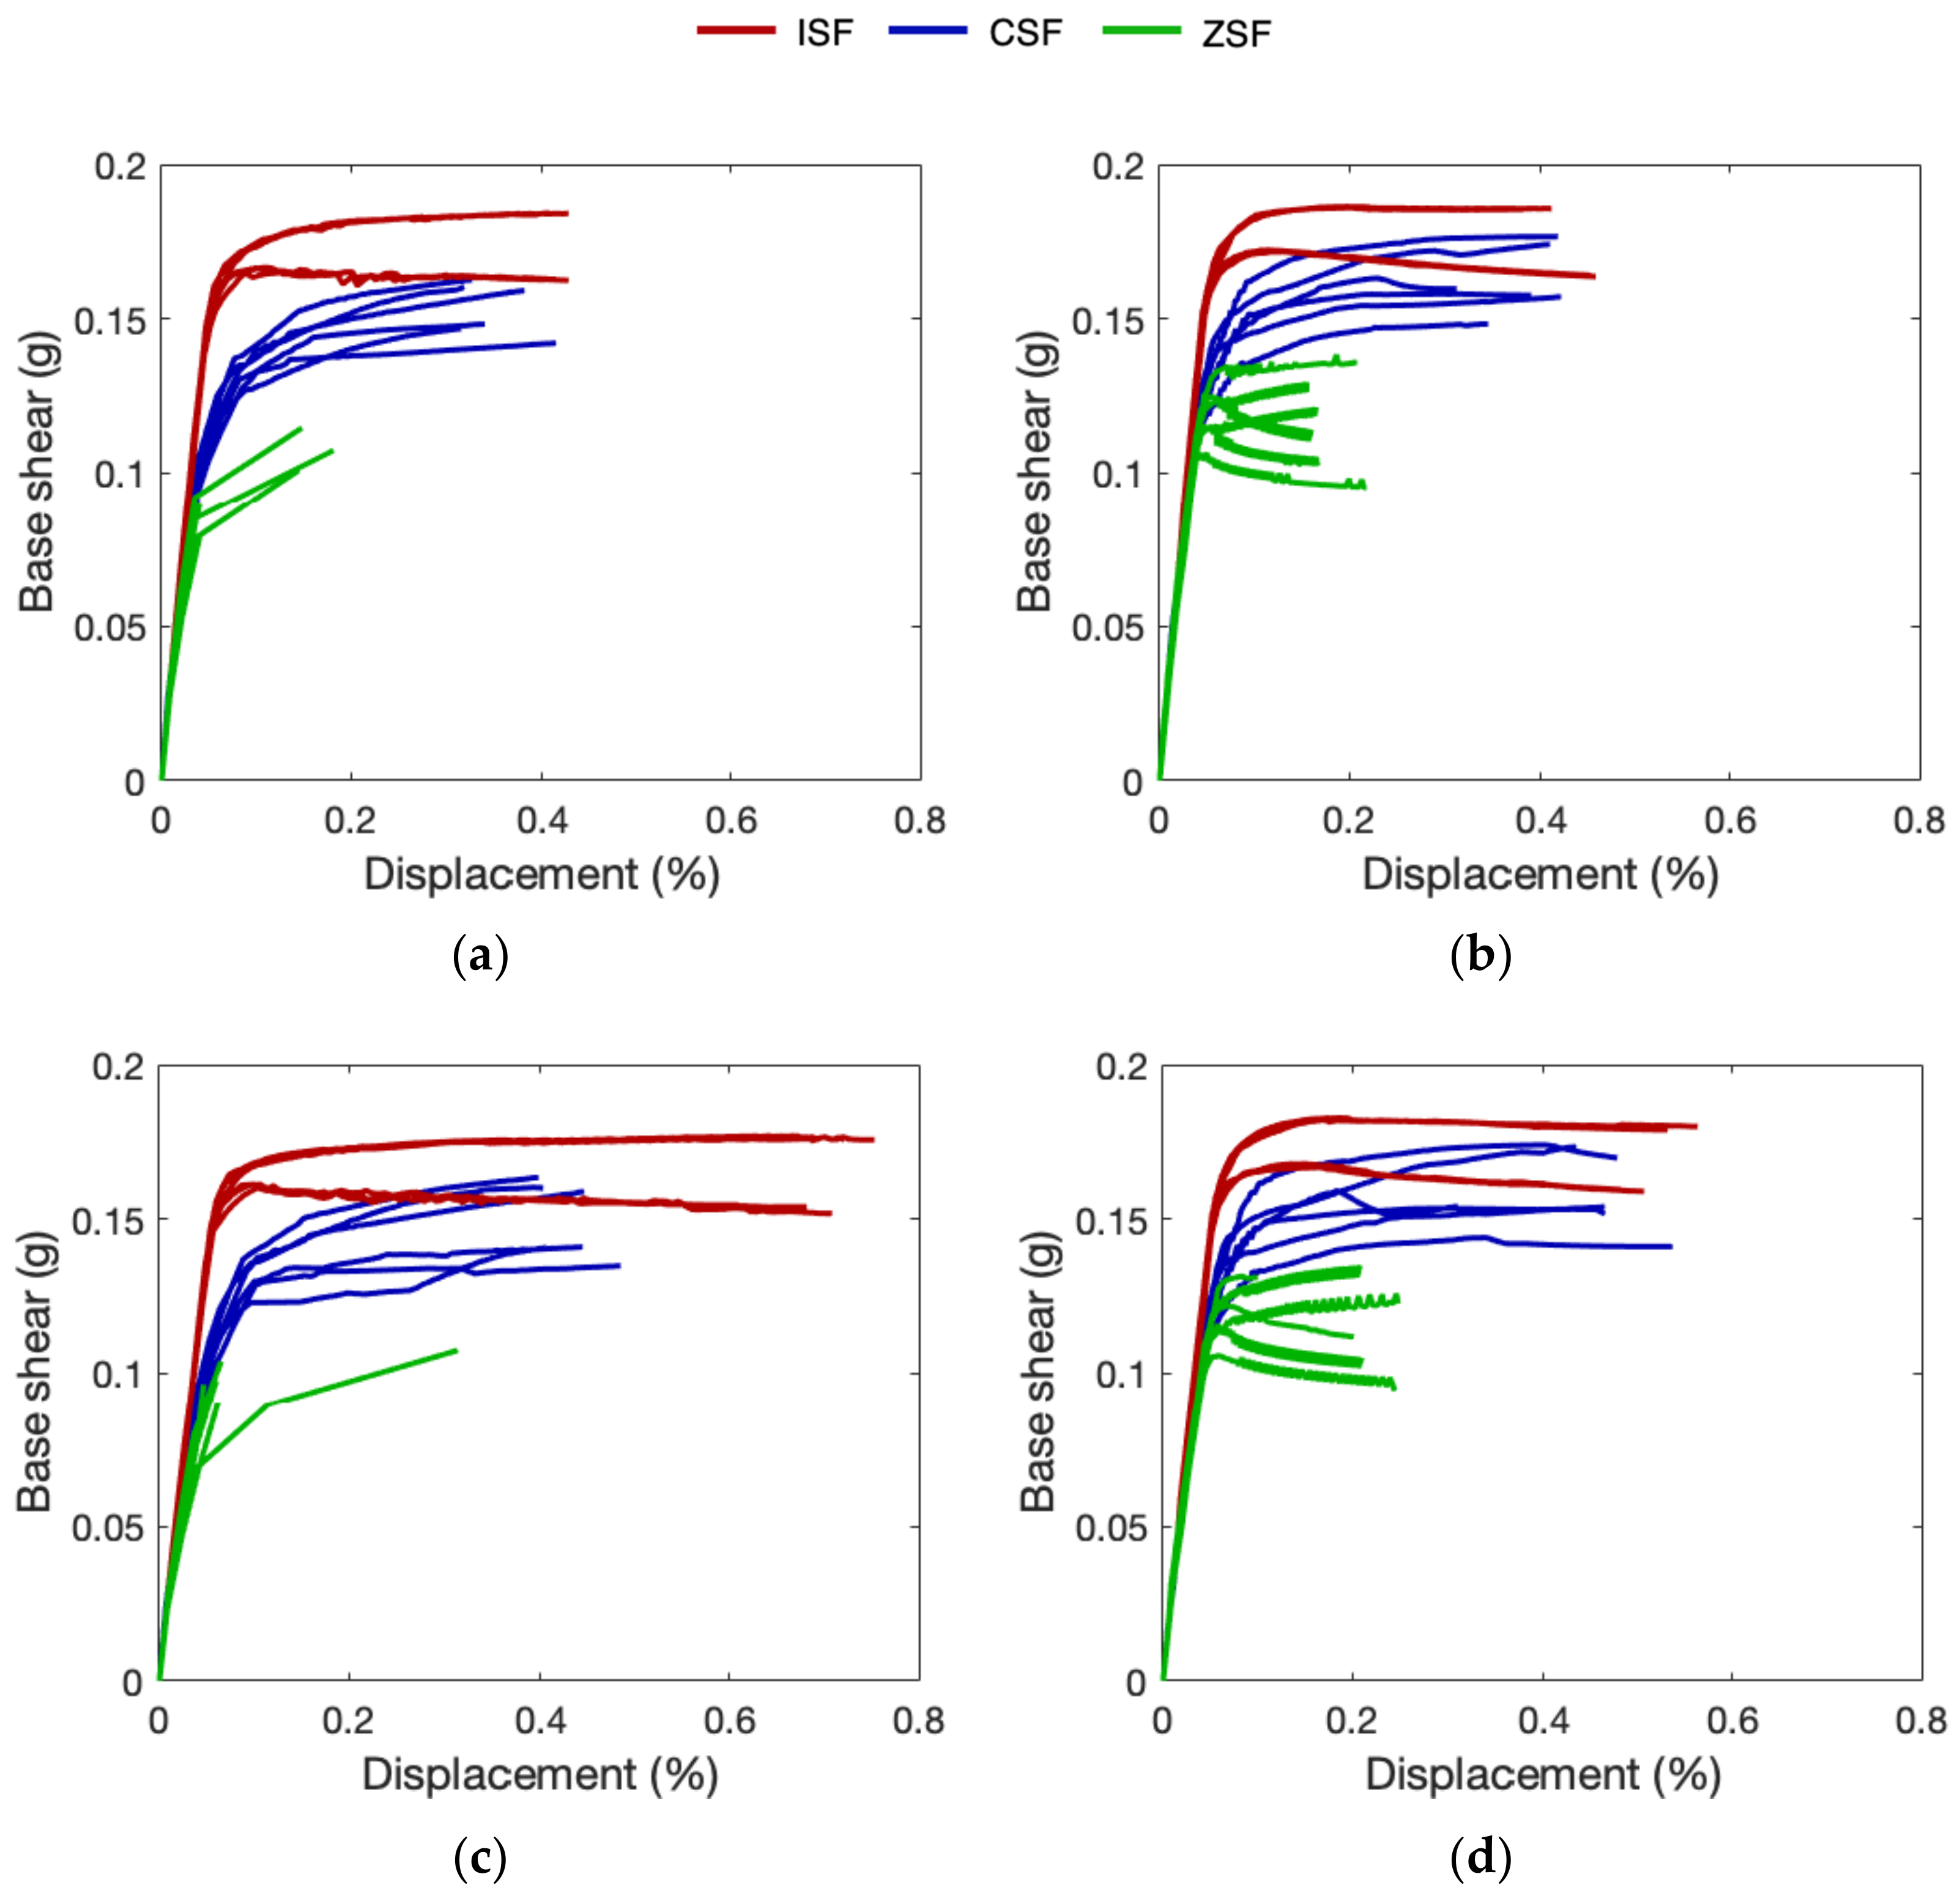
For each direction and distribution, an accidental eccentricity between the mass centroid and the stiffness centroid was considered, as suggested in [25]. Therefore, a total of 24 analyses were performed for each model. The results in Figure 25 referred to ISF_50, CSF_50 and ZSF_50. In particular, the curves obtained by applying a uniform distribution along X are reported in Figure 25a, while the results of the same distribution along Y were collected in Figure 25b. The pushover capacity curves related to static distribution along X and Y are reported in Figure 25c,d, respectively. While, in Figure 26, the results referred to ISF_100, CSF_100 and ZSF_100 and are similarly organized. The curves were plotted by normalizing the base shear with respect to the seismic mass and the displacement with respect to the total height of the building.
The difference between ISF_50 and ZSF_50 is clearly visible. In fact, ISF_50 and ZSF_50 represent the upper limit and lower limit cases, respectively. Both the capacity and ultimate displacement drastically decade in case of ZSF_50. Despite it being hard to find the total absence of floor’s in-plane stiffness, the ZSF_50 models were useful to determine the range in which CSF_50 models can be found. Moreover, the ZSF models exhibited a smaller ultimate displacement. In fact, a step-by-step analysis of the curves showed that the absence of floor stiffness caused a large deformation of first floor walls, which trigger local mechanisms. In fact, the software involved in the analysis provides a stop criterium after a large deformation is exhibited. On the other hand, CSF models reached the final step due to the shear and bending failure of different walls. As well known, the stiffer floor helps in horizontal force distribution and the failure involves a larger number of elements [31]. In fact, the increase in floor stiffness produces an increase in the shear capacity, as displayed in the capacity curves for every force distribution.
The same analyses were performed considering the masonry Young’s modulus without any reduction. The capacity curves, collected in Figure 26, manifested a higher initial stiffness, as also shown in Figure 27. Despite the difference in shear capacity and ultimate displacement, the failure modes were not too different, with respect to ISF_50, CSF_50 and ZSF_50 models. The reduction in modulus was also applied to equivalent diaphragms representing the vaulted roofs. As displayed in Figure 27, the correlation between the material’s modulus and the structure’s equivalent modulus is almost linear. In other words, the reduction of 50% in material stiffness produces almost the same reduction in structure equivalent modulus.
In Table 3, capacity and demand data related to the different capacity curves were collected. In particular, the capacity and demand metrics were computed in terms of Peak Ground Acceleration (PGA). Despite the fact that the results are affected by the assumptions stated in paragraph 3, it is crucial to observe how the capacity/demand ratio increases, involving the computed stiffness floors. In fact, the capacity/demand ratios of CFS_50 are nearly double with respect to the ones of ZSF_50. These results highlighted how critical the horizontal structures’ stiffness can be, even when a preliminary simplified model is involved in structural analysis.
The results confirmed what was previously evidenced in the scientific literature. In particular, the outcomes of [30] proved the displacement capacity was sensitive to the floors’ in-plane stiffness. Even in the herein proposed case study the capacity/demand ratio was hardly linked to the in-plane stiffness capacity assigned to the different vault roofs.

5. Conclusions

In this paper the influence of the floor’s stiffness on a masonry structure was discussed towards a case study. To this aim, a 3D finite element model was developed after collecting detailed information about the building in terms of history, material characterization and structure composition. Moreover, a parametric analysis was performed by varying both the floor in-plane stiffness and the Young’s modulus of the masonry.
The in situ experimental campaign played a crucial role. The results of the in-situ investigations were fundamental, not only to determine the masonry mechanical characteristics, but also to identify the different vault types hidden by frescoes. In fact, as clearly stated in the building’s history, the structure has had several changes since its actual concept. Therefore, three different types of vaults were identified, in addition to the presence of wooden and steel beam floors.
Both modal and pushover analysis highlighted a noticeable difference between the hypothesis of in-plane zero stiffness (i.e., ZSF models) and in-plane infinite stiffness (i.e., ISF models). Moreover, the equivalent stiffness of the horizontal structure was computed involving a method available in the literature. The modal analysis underlined a similar behavior between the CSF and ZSF models, while in ISF models the structure exhibited a uniform displacement in the first two modal shapes. Nevertheless, the capacity curves of ZSF models turned out to be too conservative, in terms of shear capacity and ultimate displacement, with respect to CSF ones. In fact, computing the capacity/demand ratios, a mean reduction of 40% can be observed between CSF and ZSF models. Assuming the absence of stiffness for every vaulted roof can potentially lead to an overestimation of the retrofitting interventions necessary to meet the required safety level. These results underlined once again how the in situ investigation efforts result in a better understanding of structure and, as a consequence, to an optimized retrofitting design. In other words, the economic efforts related to the experimental investigation result in an economic saving in the consequent phase of retrofitting design.

Author Contributions

Conceptualization, A.C. and F.L.; methodology, A.C.; software, F.L.; validation, D.P., P.L. and M.A.A.; formal analysis, F.L.; investigation, A.C. and P.L.; resources, M.A.A.; data curation, P.L.; writing—original draft preparation, A.C.; writing—review and editing, P.L. and M.A.A.; visualization, D.P.; supervision, A.C. and P.L.; project administration, A.C. All authors have read and agreed to the published version of the manuscript.

Funding

This research received no external funding.

Institutional Review Board Statement

Not applicable.

Informed Consent Statement

Not applicable.

Data Availability Statement

Data availability statements are not applicable here.

Conflicts of Interest

The authors declare no conflict of interest.

References

  1. Barbieri, G.; Biolzi, L.; Bocciarelli, M.; Fregonese, L.; Frigeri, A. Assessing the seismic vulnerability of a historical building. Eng. Struct. 2013, 57, 523–535. [Google Scholar] [CrossRef]
  2. Croci, G. General methodology for the structural restoration of historic buildings: The cases of the Tower of Pisa and the Basilica of Assisi. J. Cult. Herit. 2000, 1, 7–18. [Google Scholar] [CrossRef]
  3. Micelli, F.; Cascardi, A.; Marsano, M. Seismic strengthening of a theatre masonry building by using active FRP wires. In Brick and Block Masonry: Proceedings of the 16th International Brick and Block Masonry Conference; CRC Press: Padova, Italy, 2016; pp. 753–761. [Google Scholar]
  4. Micelli, F.; Cascardi, A. Structural assessment and seismic analysis of a 14th century masonry tower. Eng. Fail. Anal. 2020, 107, 104198. [Google Scholar] [CrossRef]
  5. Cascardi, A.; Micelli, F.; Aiello, M.A.; Funari, M. Structural analysis of a masonry church with variable cross-section dome. In Brick and Block Masonry-From Historical to Sustainable Masonry; CRC Press: Boca Raton, FL, USA, 2020; pp. 220–226. [Google Scholar]
  6. Micelli, F.; Cascardi, A.; Aiello, M.A. Seismic capacity estimation of a masonry bell-tower with verticality imperfection detected by a drone-assisted survey. Infrastructures 2020, 5, 72. [Google Scholar] [CrossRef]
  7. ICOMOS/Iscarsah Committee. Recommendations for the Analysis, Conservation and Structural Restoration of Architectural Heritage. 2005. Available online: www.icomos.org (accessed on 7 July 2022).
  8. Lourenço, P.B. Computations on historic masonry structures. Prog. Struct. Eng. Mater. 2000, 4, 301–319. [Google Scholar] [CrossRef]
  9. Ceroni, F.; Pecce, M.; Sica, S.; Garofano, A. Assessment of seismic vulnerability of a historical masonry building. Buildings 2012, 2, 332–358. [Google Scholar] [CrossRef]
  10. Saccucci, M.; Cima, V.; Grande, E.; Imbimbo, M.; Pelliccio, A. The Knowledge Process in the Seismic Assessment of Masonry Building Aggregates–An Italian Case Study. In International Conference on Critical Thinking in Sustainable Rehabilitation and Risk Management of the Built Environment; Springer: Cham, Switzerland, 2019; pp. 330–347. [Google Scholar]
  11. Lourenço, P.B.; Mendes, N.; Ramos, L.F.; Oliveira, D.V. Analysis of masonry structures without box behavior. Int. J. Archit. Herit. 2011, 5, 369–382. [Google Scholar] [CrossRef]
  12. Aşıkoğlu, A.; Vasconcelos, G.; Lourenço, P.B. Overview on the nonlinear static procedures and performance-based approach on modern unreinforced masonry buildings with structural irregularity. Buildings 2021, 11, 147. [Google Scholar] [CrossRef]
  13. Pagano, M. Teoria Degli Edifici, Edifi in Muratura; Liguori: Napoli, Italy, 1968; Volume 1. (In Italian) [Google Scholar]
  14. Binda, L.; Anzani, A.; Saisi, A. Failures due to long-term behaviour of heavy structures. Learn. Fail. Long-Term Behav. Heavy Mason. Struct. 2008, 23, 1–28. [Google Scholar]
  15. Heyman, J. The stone skeleton. Int. J. Solids Struct. 1996, 2, 249–279. [Google Scholar] [CrossRef]
  16. Heyman, J. The safety of masonry arches. Int. J. Mech. Sci. 1969, 11, 363–385. [Google Scholar] [CrossRef]
  17. Oliveira, D.V.; Lourenço, P.B. Repair of Stone Masonry Arch Bridges; International Center for Numerical Methods in Engineering: Barcelona, Spain, 2004. [Google Scholar]
  18. De Santis, S.; De Felice, G. Seismic analysis of masonry arches. In Proceedings of the Fifteenth World Conference on Earthquake Engineering, Lisbon, Portugal, 24–28 September 2012. [Google Scholar]
  19. Sisti, R.; Di Ludovico, M.; Borri, A.; Prota, A. Damage assessment and the effectiveness of prevention: The response of ordinary unreinforced masonry buildings in Norcia during the Central Italy 2016–2017 seismic sequence. Bull. Earthq. Eng. 2019, 17, 5609–5629. [Google Scholar] [CrossRef]
  20. Circolare 21 Gennaio 2019, n. 7 C.S.LL.PP. Istruzioni per l’Applicazione dell’ «Aggiornamento delle “Norme Tecniche per le Costruzioni”» di Cui al Decreto Ministeriale 17 Gennaio. 2018. Available online: https://www.gazzettaufficiale.it/eli/id/2019/02/11/19A00855/sg (accessed on 7 July 2022).
  21. Vollmer, M.; Klaus-Peter, M.Ã. Infrared Thermal Imaging: Fundamentals, Research and Applications; John Wiley & Sons: Hoboken, NJ, USA, 2010. [Google Scholar]
  22. UNI EN 12504-2:2021; Testing Concrete in Structures-Part 2: Non-Destructive Testing-Determination of Rebound Number. British Standards Institution: London, UK, 2021.
  23. UNI EN 12504-4:2021; Testing concrete in structures-Part 4: Determination of Ultrasonic Pulse Velocity. British Standards Institution: London, UK, 2021.
  24. Aliabdo, A.A.E.; Elmoaty, A.E.M.A. Reliability of using non-destructive tests to estimate compressive strength of building stones and bricks. Alex. Eng. J. 2012, 51, 193–203. [Google Scholar] [CrossRef] [Green Version]
  25. D.M. 17/01/2018. Aggiornamento delle “Norme Tecniche per le Costruzioni” (NTC 2018). Supplemento Ordinario alla “Gazzetta Ufficiale”, n. 42 del 20/02/2018. Available online: https://www.gazzettaufficiale.it/eli/id/2018/2/20/18A00716/sg (accessed on 7 July 2022). (In Italian).
  26. 3MURI. Seismic Calculation of Masonry Structures According to M.D.14/01/2018; 3MURI: Torino, Italy, 2009. [Google Scholar]
  27. Lagomarsino, S.; Penna, A.; Galasco, A.; Cattari, S. TREMURI program: An equivalent frame model for the non-linear seismic analysis of masonry buildings. Eng. Struct. 2013, 56, 1787–1799. [Google Scholar] [CrossRef]
  28. Marseglia, P.S.; Micelli, F.; Leone, M.; Aiello, M.A. Modeling of masonry vaults as equivalent diaphragms. In Key Engineering Materials; Trans Tech Publications Ltd.: Freienbach, Switzerland, 2015; Volume 628, pp. 185–190. [Google Scholar]
  29. Marseglia, P.S.; Micelli, F.; Aiello, M.A. Analysis of equivalent diaphragm vault structures in masonry construction under horizontal forces. Heritage 2020, 3, 989–1017. [Google Scholar] [CrossRef]
  30. Capanna, I.; Aloisio, A.; Di Fabio, F.; Fragiacomo, M. Sensitivity Assessment of the Seismic Response of a Masonry Palace via Non-Linear Static Analysis: A Case Study in L’Aquila (Italy). Infrastructures 2021, 6, 8. [Google Scholar] [CrossRef]
  31. Giongo, I.; Piazza, M.; Tomasi, R. Pushover analysis of traditional masonry buildings: Influence of refurbished timber-floors stiffness. In Proceedings of the International Conference on Structural Health Assessment of Timber Structure, Lisbon, Portugal, 16–17 June 2011; pp. 1–13. [Google Scholar]
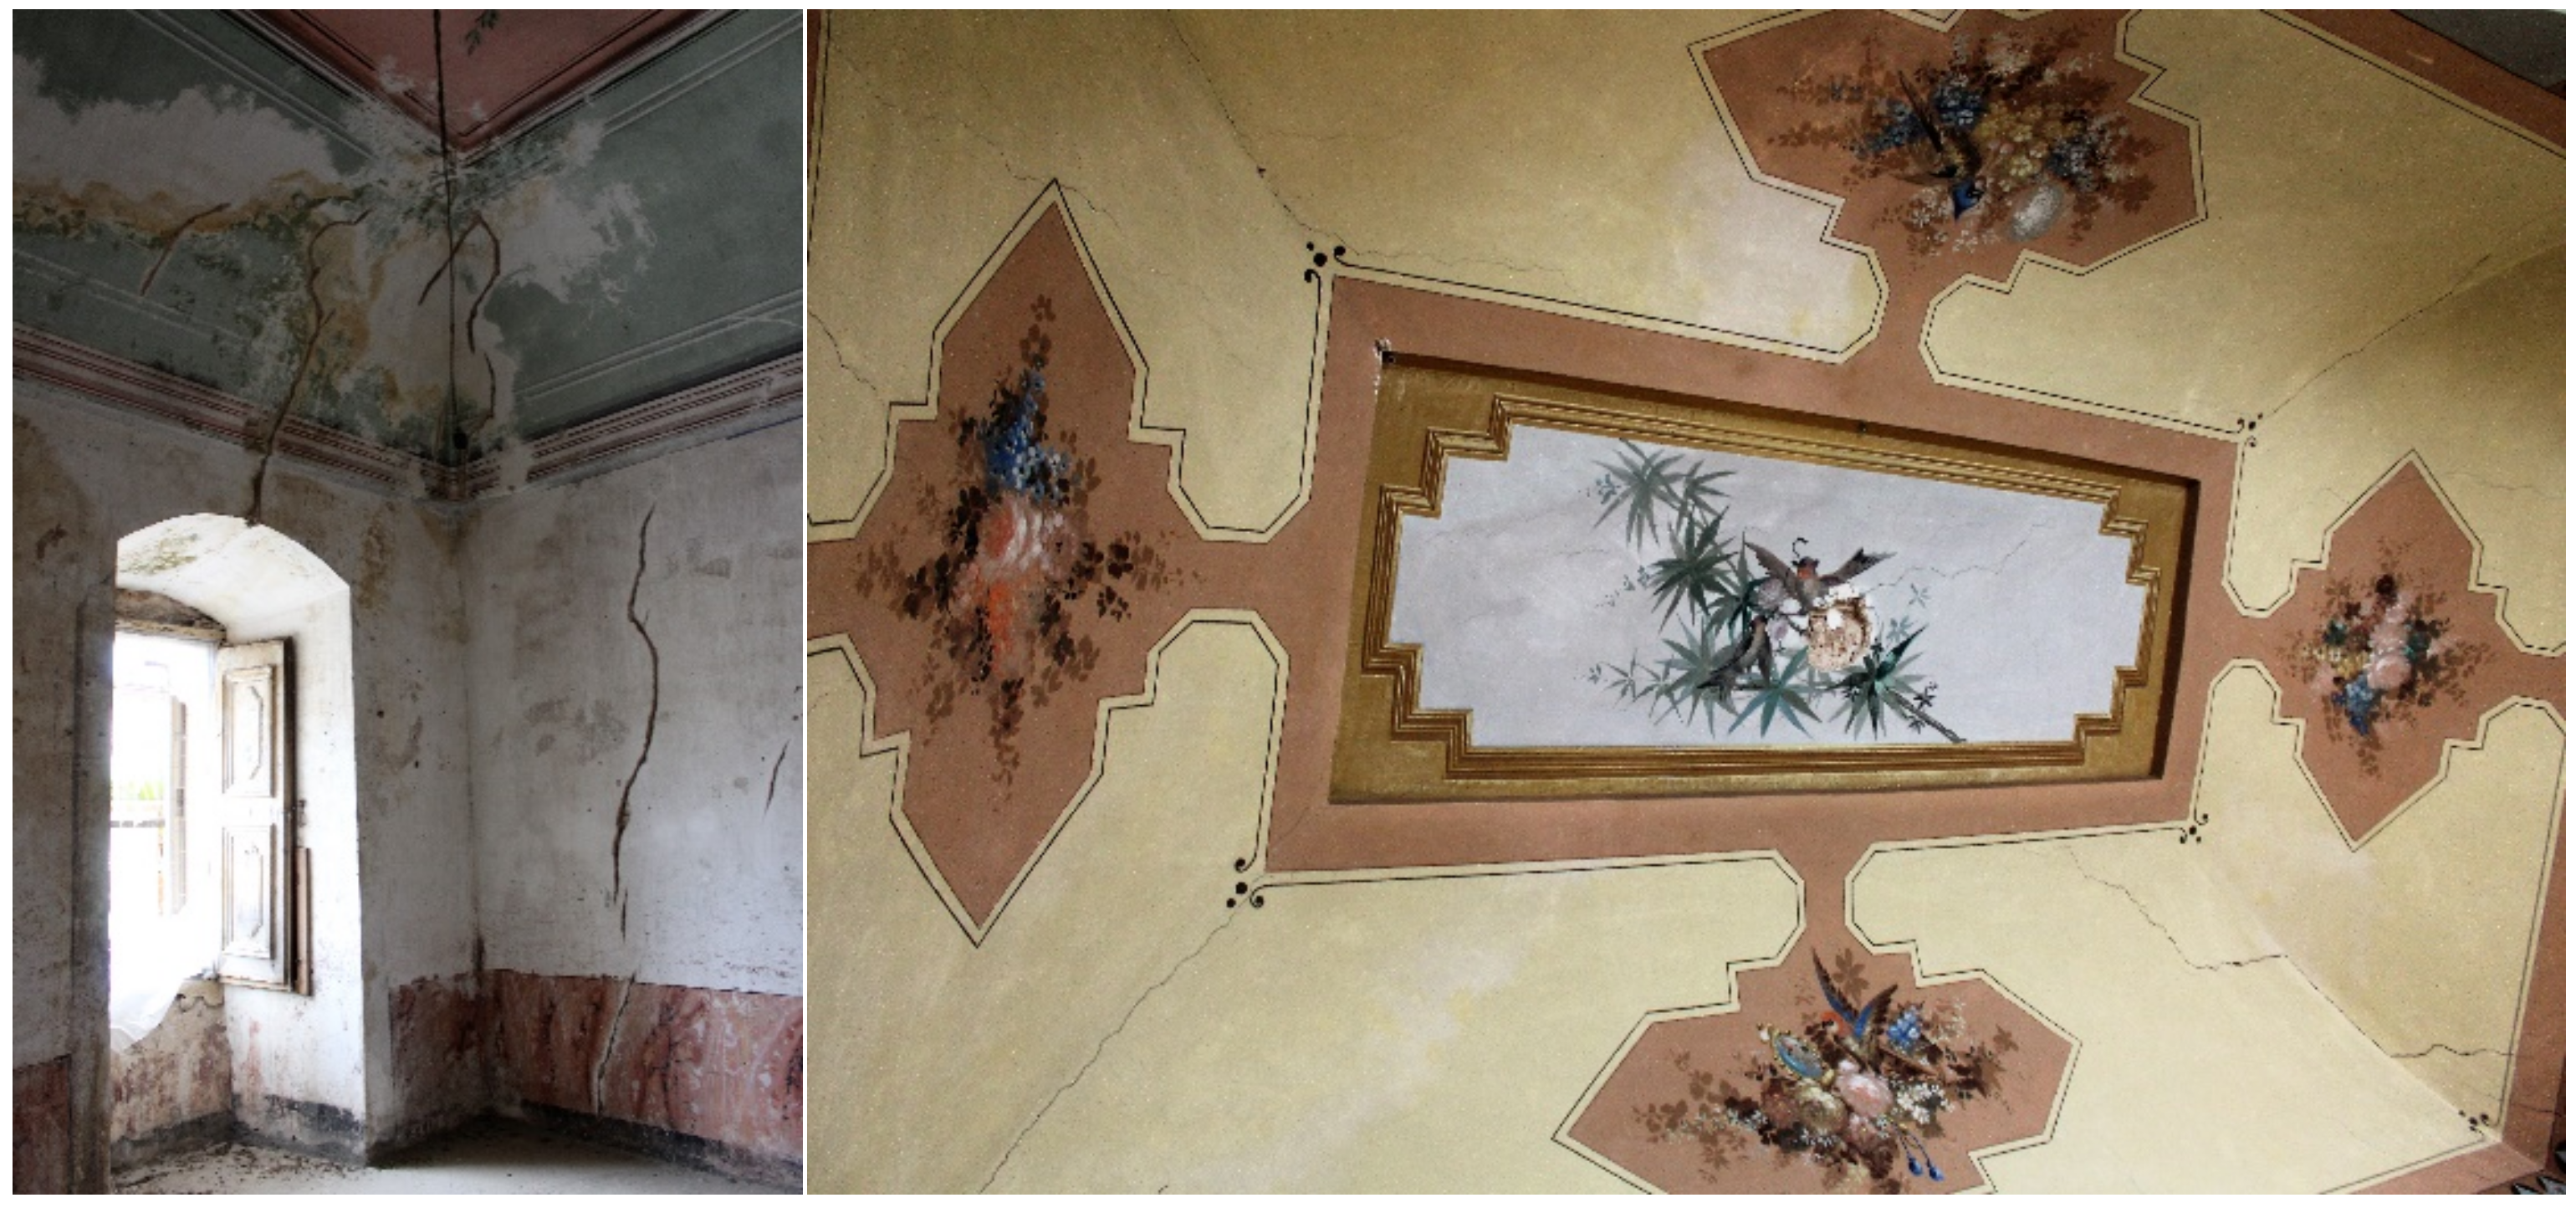
Figure 2. Examples of the crack pattern: corner walls (left) and vault (right).
Heritage 05 00107 g002
Figure 3. Orthophoto for the urban identification.
Heritage 05 00107 g003
Figure 4. Floor 1 plan view.
Heritage 05 00107 g004
Figure 5. Terracotta tubes in the Ducal Palace of Binetto: (a) front view, (b) top view and (c) in situ application.
Heritage 05 00107 g005
Figure 6. Room S1: (a) infrared image, (b) photography view and (c) plan view.
Heritage 05 00107 g006
Figure 7. Room S2: (a) infrared image, (b) photography view and (c) plan view.
Heritage 05 00107 g007
Figure 8. Room S2- bis: (a) infrared image, (b) photography view and (c) plan view.
Heritage 05 00107 g008
Figure 9. Room S3: (a) infrared image, (b) photography view and (c) plan view.
Heritage 05 00107 g009
Figure 10. Room S4: (a) infrared image, (b) photography view and (c) plan view.
Heritage 05 00107 g010
Figure 11. Room S7: (a) infrared image, (b) photography view and (c) plan view.
Heritage 05 00107 g011
Figure 12. Room S8: (a) infrared image, (b) photography view and (c) plan view.
Heritage 05 00107 g012
Figure 13. Room S9: (a) infrared image, (b) photography view and (c) plan view.
Heritage 05 00107 g013
Figure 14. Room S10: (a) infrared image, (b) photography view and (c) plan view.
Heritage 05 00107 g014
Figure 15. Room S12: (a) partially collapsed vault and (b) plan view.
Heritage 05 00107 g015
Figure 16. Room S12: (a) infrared image, (b) photography view and (c) plan view.
Heritage 05 00107 g016
Figure 17. Room S12-bis: (a) infrared image, (b) photography view and (c) plan view.
Heritage 05 00107 g017
Figure 18. Room S15: (a) infrared image, (b) photography view and (c) plan view.
Heritage 05 00107 g018
Figure 19. Boroscopy test: (a) E1 (~20 cm depth), (b) E2 (~30 cm depth), (c) E3 (~15 cm depth), (d) E4 (~20 cm depth), (e) E5 (~25 cm depth), (f) E6 (~20 cm depth), (g) E7 (~20 cm depth) and (h) E8 (~20 cm depth).
Heritage 05 00107 g019
Figure 22. Equivalent Young’s modulus of vaulted roofs, according to [29] adapted with the permission of the authors.
Heritage 05 00107 g022
Figure 23. Displacement referred to modal analysis. ISF_50 model: (a) Mode 1; (b) Mode 2; (c) Mode 3. ZSF_50: (d) Mode 1; (e) Mode 2; (f) Mode 3. CSF_50: (g) Mode 1; (h) Mode 2; (i) Mode 3. Red color represents the deformed configuration, while black color represents the undeformed configuration.
Heritage 05 00107 g023
Figure 24. Displacement referred to modal analysis. ISF_100 model: (a) Mode 1; (b) Mode 2; (c) Mode 3. ZSF_100: (d) Mode 1; (e) Mode 2; (f) Mode 3. CSF_100: (g) Mode 1; (h) Mode 2; (i) Mode 3. Red color represents the deformed configuration, while black color represents the undeformed configuration.
Heritage 05 00107 g024aHeritage 05 00107 g024b
Figure 25. Pushover capacity curves of ISF_50, CSF_50 and ZSF_50 considering: (a) uniform distribution along X; (b) uniform distribution along Y; (c) static distribution along X; (d) static distribution along Y.
Heritage 05 00107 g025
Figure 26. Pushover capacity curves of ISF_100, CSF_100 and ZSF_100 considering: (a) uniform distribution along X; (b) uniform distribution along Y; (c) static distribution along X; (d) static distribution along Y.
Heritage 05 00107 g026
Figure 27. Equivalent modulus of the models considering different distributions of horizontal forces (x_u = uniform distribution along X, y_u = uniform distribution along y, x_s = static distribution along X, y_s = static distribution along Y).
Heritage 05 00107 g027
Table 1. Stiffness of different types of floors.
Floor IDYoung’s
Modulus(GPa)
Tangential Modulus
(GPa)
Thickness
(cm)
Camorcanna vaultZero stiffness
Wooden floorZero stiffness
Masonry vault0.8550.28515
“Bubbole” vault0.4270.14215
Steel beams floorInfinite stiffness
Table 2. Modal analysis information, varying the stiffness of horizontal diaphragms.
Model IDMode NumberFrequency (Hz)% of Mass Excited along X% of Mass Excited along Y
ISF_5014.47777.4612.00
24.50811.5381.86
35.1524.380.00
ZSF_5013.29728.890.00
23.6870.0037.01
34.2321.302.10
CSF_5014.36734.610.64
24.4440.6350.13
35.0761.010.50
ISF_10016.26977.9511.78
26.29611.6481.83
37.2083.590.07
ZSF_10014.62828.760.00
25.1860.0037.00
35.8701.242.19
CSF_10014.90935.040.64
25.4291.4345.38
36.0991.873.00
Table 3. Building capacity versus demand in terms of Peak Ground Acceleration (PGA), varying the stiffness of horizontal diaphragms.
Model IDForce
Distribution
Capacity PGA (g)Demand PGA (g)Capacity/Demand
ISF_50x_u0.3120.0833.78
y_u0.3303.99
x_fs0.3253.93
y_fs0.3303.98
CSF_50x_u0.2623.16
y_u0.3103.75
x_fs0.3424.14
y_fs0.2603.14
ZSF_50x_u0.1521.84
y_u0.1611.94
x_fs0.1682.03
y_fs0.1722.08
ISF_100x_u0.4094.94
y_u0.4195.07
x_fs0.3944.76
y_fs0.4064.91
CSF_100x_u0.3644.40
y_u0.4004.84
x_fs0.4195.06
y_fs0.3704.47
ZSF_100x_u0.2342.83
y_u0.1892.29
x_fs0.2593.13
y_fs0.2132.58
Publisher’s Note: MDPI stays neutral with regard to jurisdictional claims in published maps and institutional affiliations.