Author Contributions
Conceptualization, V.G. and V.S.; methodology, V.G. and V.S.; software, V.G.; validation, V.G. and V.S.; formal analysis, V.G.; investigation, V.G. and V.S.; resources, V.G. and V.S.; data curation, V.G. and V.S.; writing—original draft preparation, V.G., C.S., and V.S.; writing—review and editing, V.G., C.S., and V.S.; visualization, V.G. All authors have read and agreed to the published version of the manuscript.
Figure 1.
(a) The Mjällby Crucifix currently displayed on a low platform at the Blekinge Museum surrounded by other artifacts. (b) Scanning of the crucifix base artifact located in the Mjällby church.
Figure 1.
(a) The Mjällby Crucifix currently displayed on a low platform at the Blekinge Museum surrounded by other artifacts. (b) Scanning of the crucifix base artifact located in the Mjällby church.
Figure 2.
(a) AR application visualizing the 3D model of the Mjällby Crucifix and its base during the museum exhibition at the Sölvesborgs Slott estate. (b) AR application visualizing the 3D model of the Mjällby Crucifix and its base in the lab room.
Figure 2.
(a) AR application visualizing the 3D model of the Mjällby Crucifix and its base during the museum exhibition at the Sölvesborgs Slott estate. (b) AR application visualizing the 3D model of the Mjällby Crucifix and its base in the lab room.
Figure 3.
(a) Screenshot from the AR application at the museum exhibition at the Sölvesborgs Slott estate. (b) Screenshot from the AR application, a closer view of the crucifix.
Figure 3.
(a) Screenshot from the AR application at the museum exhibition at the Sölvesborgs Slott estate. (b) Screenshot from the AR application, a closer view of the crucifix.
Figure 4.
Museum exhibition results. The horizontal blue line indicates the median value while the red square indicates the mean value.
Figure 4.
Museum exhibition results. The horizontal blue line indicates the median value while the red square indicates the mean value.
Figure 5.
Museum exhibition results grouped by genders. The horizontal blue line indicates the median value while the red square indicates the mean value.
Figure 5.
Museum exhibition results grouped by genders. The horizontal blue line indicates the median value while the red square indicates the mean value.
Figure 6.
Museum exhibition results divided by age groups: adults (18–39), middle-age adults (40–59), and older adults (60+). The horizontal blue line indicates the median value while the red square indicates the mean value.
Figure 6.
Museum exhibition results divided by age groups: adults (18–39), middle-age adults (40–59), and older adults (60+). The horizontal blue line indicates the median value while the red square indicates the mean value.
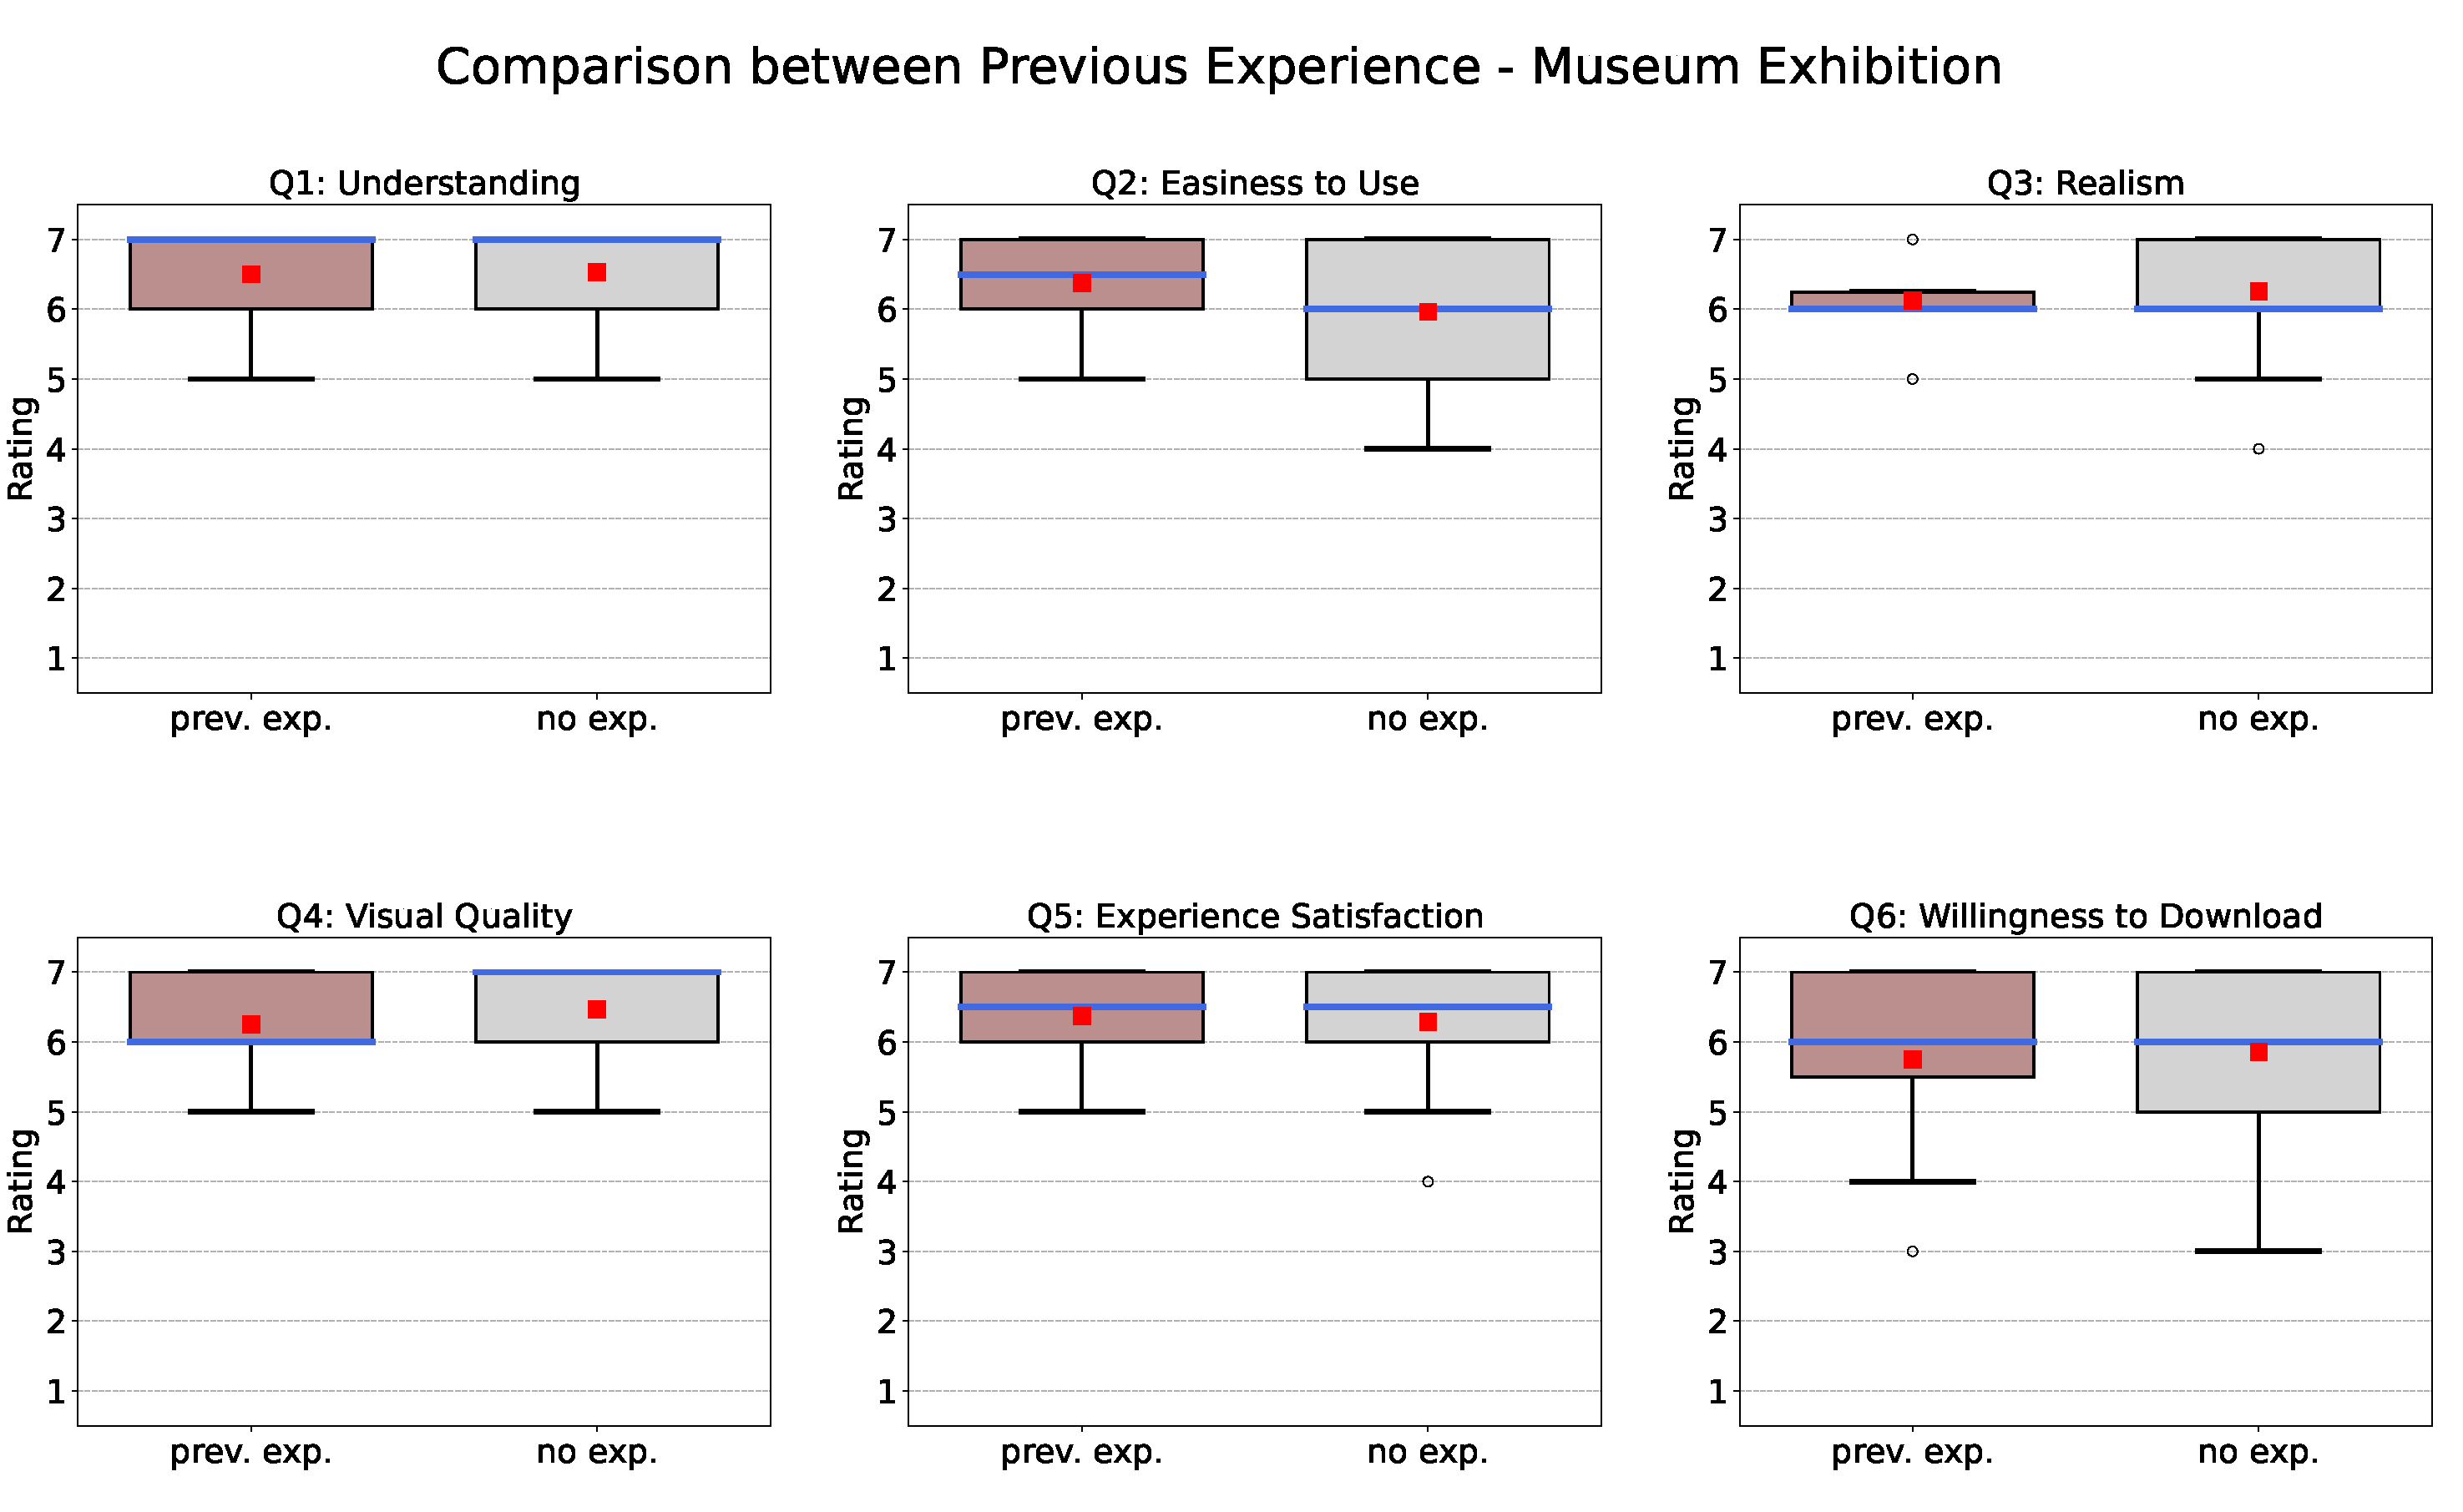
Figure 7.
Museum exhibition results compared between having previous experience with AR or no experience. The horizontal blue line indicates the median value while the red square indicates the mean value.
Figure 7.
Museum exhibition results compared between having previous experience with AR or no experience. The horizontal blue line indicates the median value while the red square indicates the mean value.
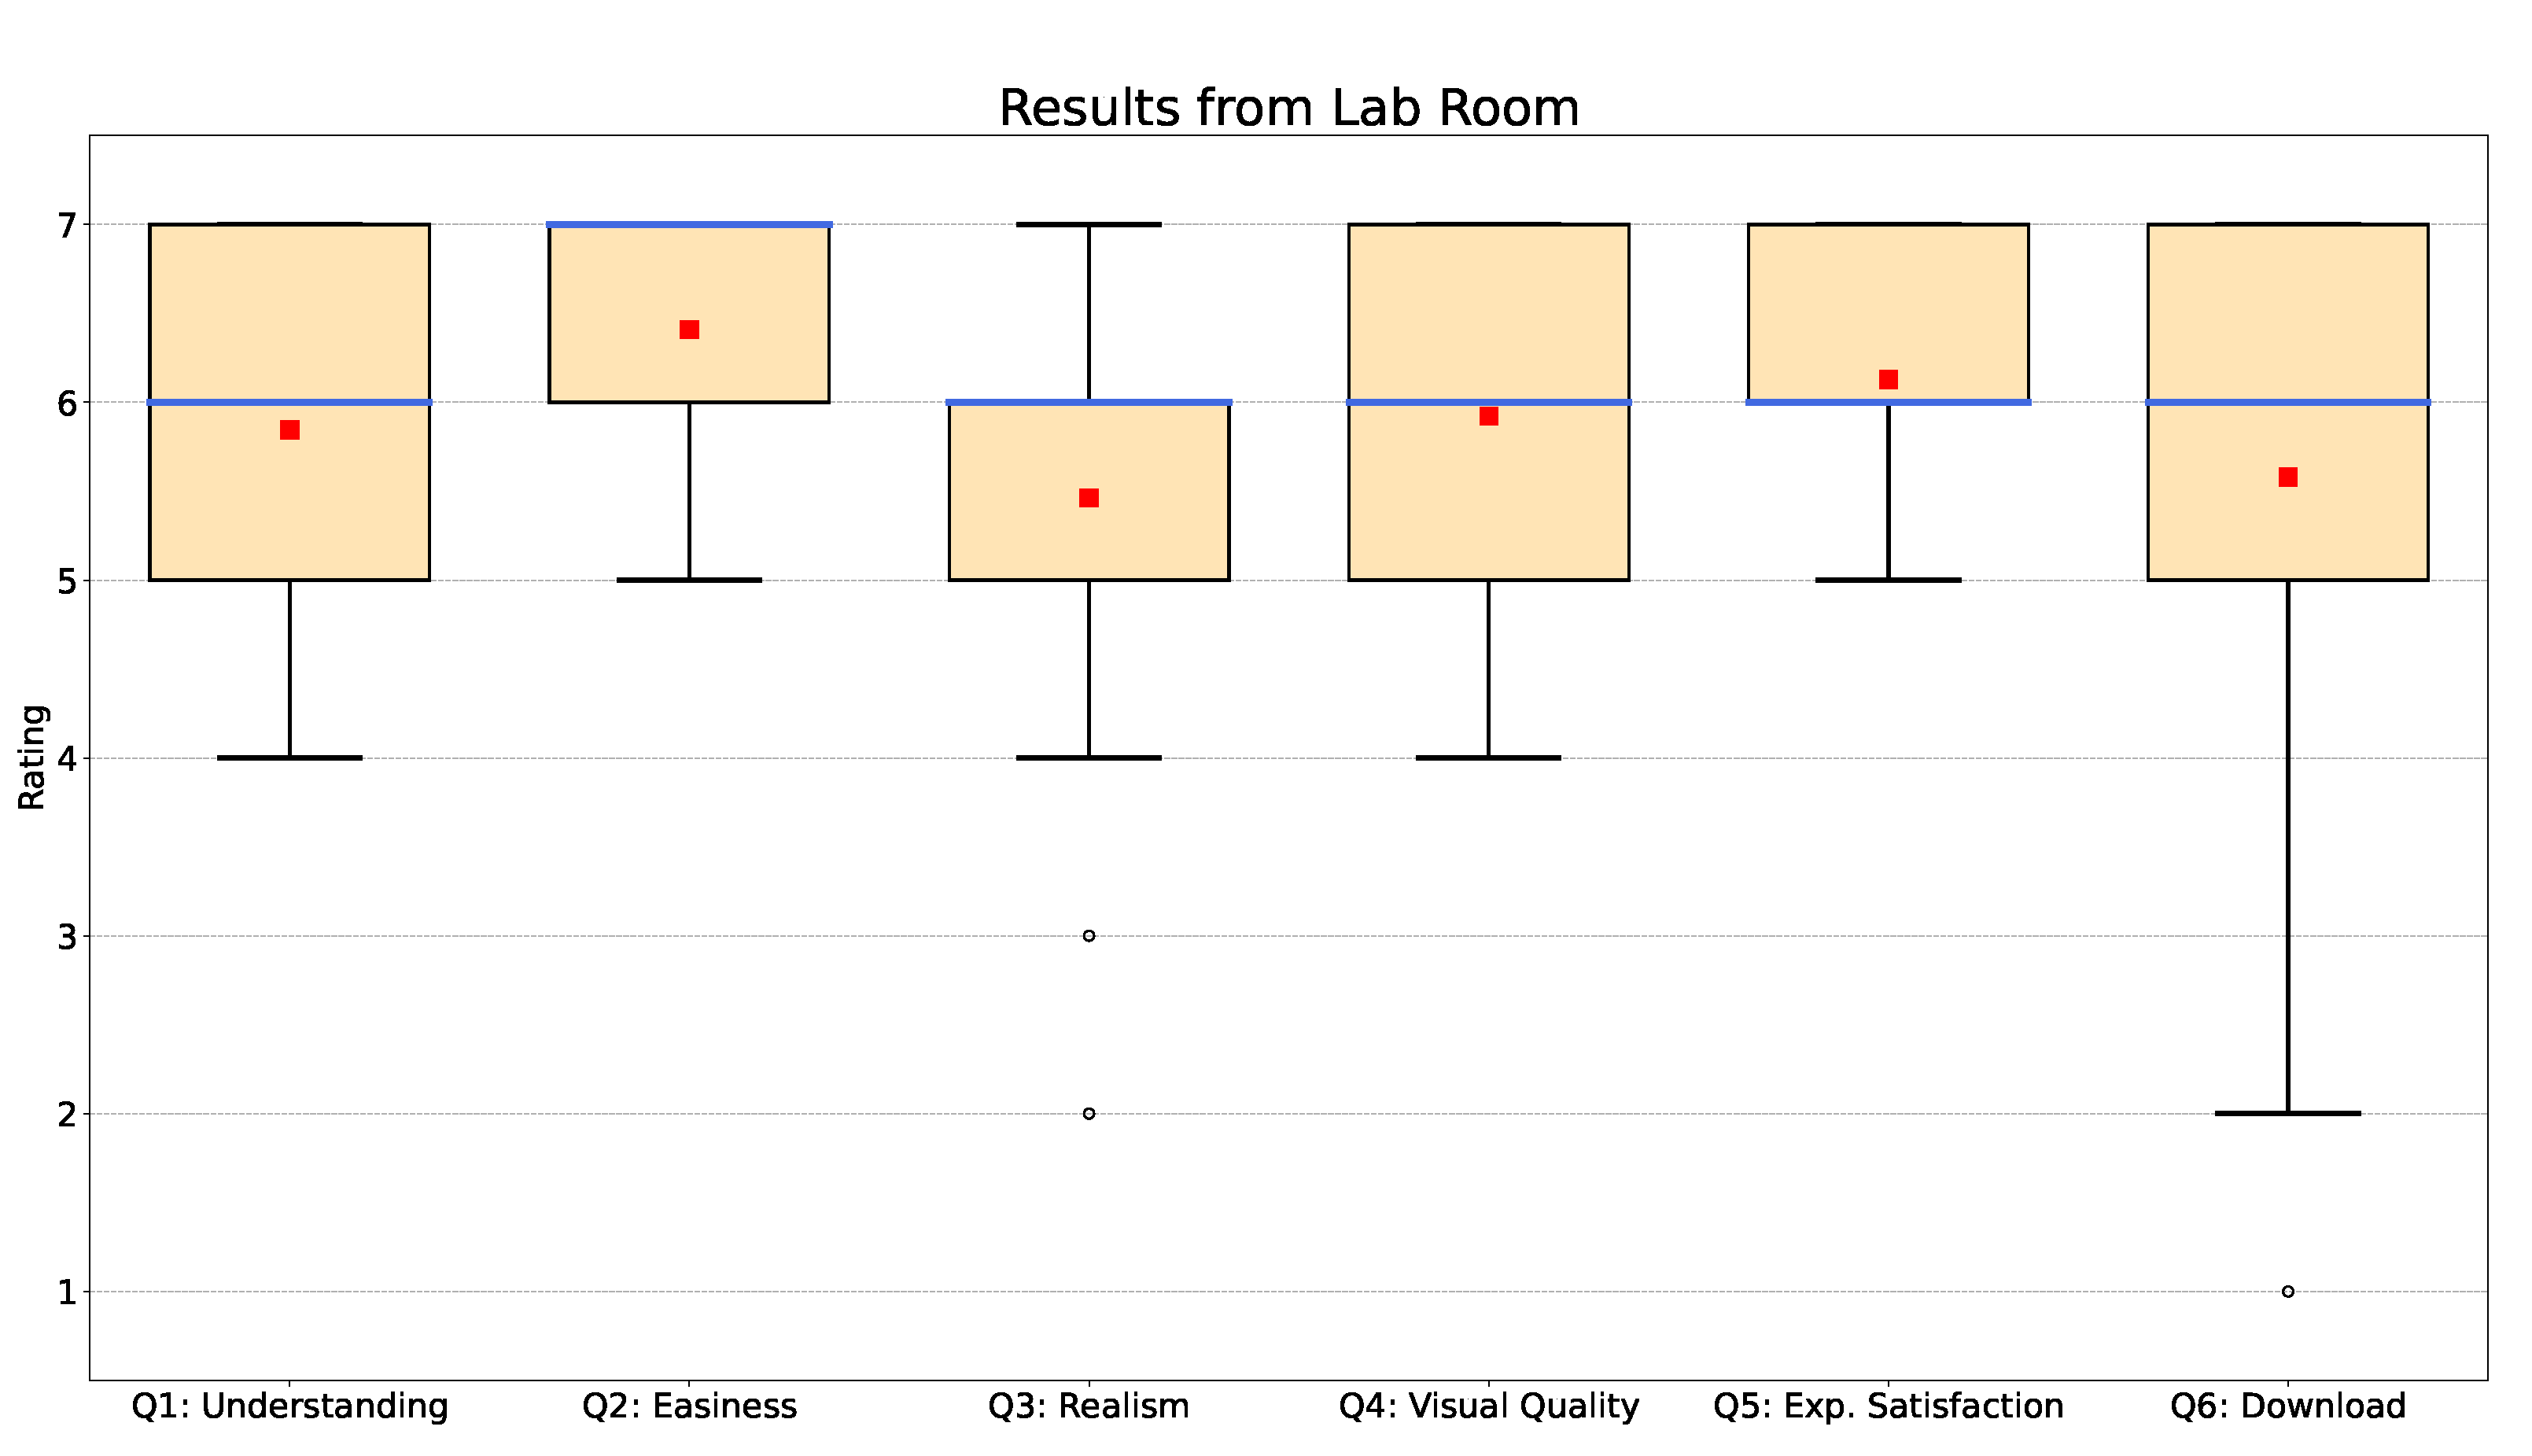
Figure 8.
Lab room results. The horizontal blue line indicates the median value while the red square indicates the mean value.
Figure 8.
Lab room results. The horizontal blue line indicates the median value while the red square indicates the mean value.
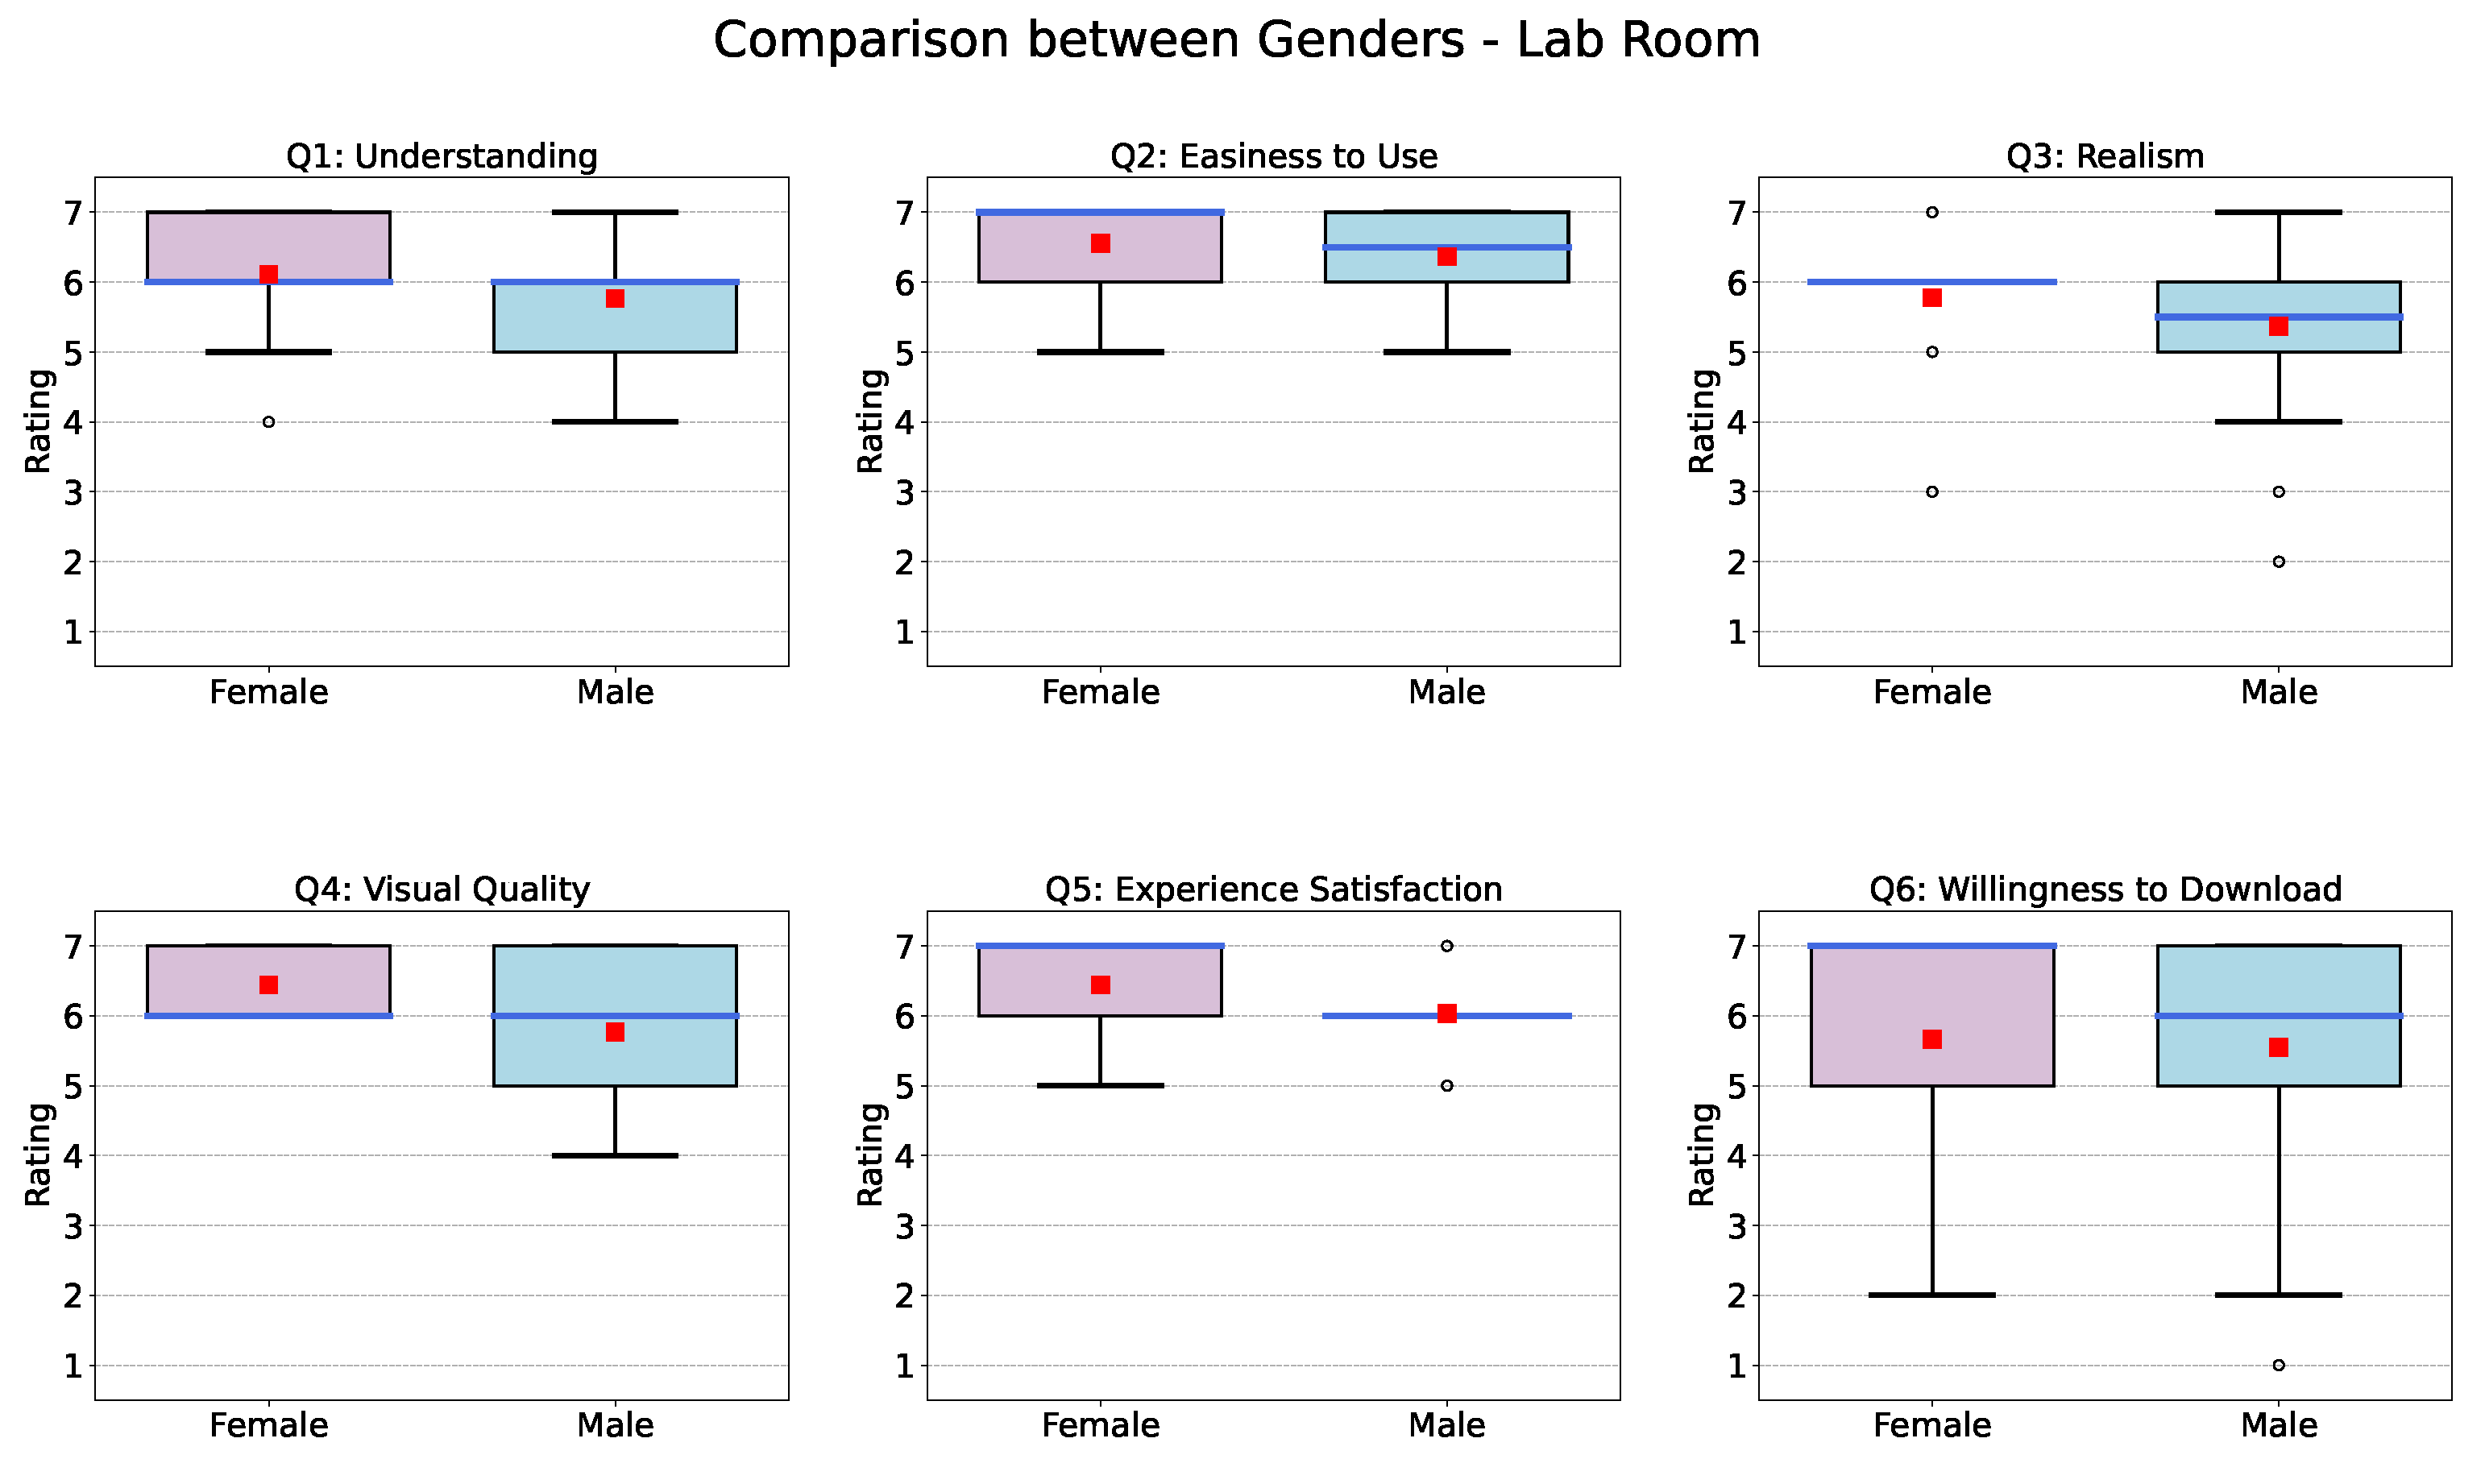
Figure 9.
Lab room results grouped by genders. The horizontal blue line indicates the median value while the red square indicates the mean value.
Figure 9.
Lab room results grouped by genders. The horizontal blue line indicates the median value while the red square indicates the mean value.
Figure 10.
Lab room results divided by age groups: adults (18–39) and middle-age adults (40–59). The horizontal blue line indicates the median value while the red square indicates the mean value.
Figure 10.
Lab room results divided by age groups: adults (18–39) and middle-age adults (40–59). The horizontal blue line indicates the median value while the red square indicates the mean value.
Figure 11.
Lab room results compared between having previous experience with AR or no experience. The horizontal blue line indicates the median value while the red square indicates the mean value.
Figure 11.
Lab room results compared between having previous experience with AR or no experience. The horizontal blue line indicates the median value while the red square indicates the mean value.
Figure 12.
Results for the six questions compared between sites, i.e., museum exhibition and lab room. The horizontal blue line indicates the median value while the red square indicates the mean value.
Figure 12.
Results for the six questions compared between sites, i.e., museum exhibition and lab room. The horizontal blue line indicates the median value while the red square indicates the mean value.
Figure 13.
Results for the six questions compared between sites excluding the data from the older adults age group. The horizontal blue line indicates the median value while the red square indicates the mean value.
Figure 13.
Results for the six questions compared between sites excluding the data from the older adults age group. The horizontal blue line indicates the median value while the red square indicates the mean value.
Table 1.
Questions asked in the surveys. For the Likert scale rating questions (Q1-6) their corresponding lower and higher extreme values of the Likert scale have been included.
Table 1.
Questions asked in the surveys. For the Likert scale rating questions (Q1-6) their corresponding lower and higher extreme values of the Likert scale have been included.
| Rating Questions | Likert Scale Extreme Values |
|---|
| 1 | 7 |
|---|
| Q1: To what degree do you think the AR application helps you get an understanding about the Mjällby Crucifix? | Not at all | To a very high degree |
| Q2: How easy did you think it was to use the AR application? | Extremely difficult | Extremely easy |
| Q3: To what degree did you think that the AR object (the crucifix) felt like part of the reality? | Not at all | To a very high degree |
| Q4: How would you rate the perceived visual quality of the AR object (the crucifix)? | Extremely poor | Excellent |
| Q5: How satisfied are you with the overall experience of the AR application? | Extremely unsatisfied | Extremely satisfied |
| Q6: How likely is it that you would like to download and use the AR application (with more objects from the museum) for your own phone/tablet? | Extremely unlikely | Extremely likely |
| Free Text Questions | | |
| Q7: As a visitor, what do you think are the benefits of AR-experiences in the context of an exhibition? |
| Q8: As a visitor, what do you think are the disadvantages of AR-experiences in the context of an exhibition? |
Table 2.
Museum exhibition results grouped by gender. Results include median values (Mdn), mean values (M), standard deviation values (SD), and p-values obtained from the Mann-Whitney U (MWU) test.
Table 2.
Museum exhibition results grouped by gender. Results include median values (Mdn), mean values (M), standard deviation values (SD), and p-values obtained from the Mann-Whitney U (MWU) test.
| | Female | Male | MWU Test |
|---|
| | Mdn | M | SD | Md | M | SD | p-Value |
|---|
| Q1 | 7 | 6.56 | 0.66 | 7 | 6.50 | 0.80 | 0.978 |
| Q2 | 7 | 6.41 | 0.91 | 6 | 5.91 | 1.11 | 0.118 |
| Q3 | 7 | 6.43 | 0.84 | 6 | 6.24 | 0.70 | 0.224 |
| Q4 | 7 | 6.61 | 0.66 | 6 | 6.27 | 0.63 | 0.051 |
| Q5 | 7 | 6.48 | 0.66 | 6 | 6.04 | 0.90 | 0.096 |
| Q6 | 6 | 6.00 | 1.13 | 6 | 5.45 | 1.40 | 0.182 |
Table 3.
Museum exhibition results divided by age groups. Results include median values (Mdn), mean values (M), standard deviation values (SD), and p-values obtained from the Kruskal-Wallis (KW) test.
Table 3.
Museum exhibition results divided by age groups. Results include median values (Mdn), mean values (M), standard deviation values (SD), and p-values obtained from the Kruskal-Wallis (KW) test.
| | Adults | Middle-Age Adults | Older Adults | KW Test |
|---|
| | Mdn | M | SD | Md | M | SD | Md | M | SD | p-Value |
|---|
| Q1 | 6.0 | 6.25 | 0.75 | 7.0 | 6.31 | 0.87 | 7.0 | 6.81 | 0.40 | 0.075 |
| Q2 | 6.5 | 6.50 | 0.52 | 6.0 | 5.93 | 1.22 | 6.0 | 6.06 | 1.06 | 0.571 |
| Q3 | 6.0 | 5.75 | 0.87 | 6.0 | 6.19 | 0.91 | 7.0 | 6.67 | 0.61 | 0.014 |
| Q4 | 6.0 | 6.17 | 0.83 | 7.0 | 6.44 | 0.73 | 6.5 | 6.44 | 0.63 | 0.611 |
| Q5 | 6.0 | 6.17 | 0.72 | 6.5 | 6.37 | 0.72 | 6.0 | 6.19 | 0.91 | 0.721 |
| Q6 | 5.5 | 5.33 | 1.37 | 6.0 | 6.00 | 1.21 | 6.0 | 5.75 | 1.34 | 0.400 |
Table 4.
Museum exhibition results compared between participants having previous experience with AR and participants with no experience. Results include median values (Mdn), mean values (M), standard deviation values (SD), and p-values obtained from the Mann-Whitney U (MWU) test.
Table 4.
Museum exhibition results compared between participants having previous experience with AR and participants with no experience. Results include median values (Mdn), mean values (M), standard deviation values (SD), and p-values obtained from the Mann-Whitney U (MWU) test.
| | Previous Experience | No Experience | MWU Test |
|---|
| | Mdn | M | SD | Md | M | SD | p-Value |
|---|
| Q1 | 7.0 | 6.50 | 0.75 | 7.0 | 6.53 | 0.74 | 0.855 |
| Q2 | 6.5 | 6.37 | 0.74 | 6.0 | 5.96 | 1.19 | 0.527 |
| Q3 | 6.0 | 6.12 | 0.64 | 6.0 | 6.26 | 0.86 | 0.500 |
| Q4 | 6.0 | 6.25 | 0.70 | 7.0 | 6.46 | 0.64 | 0.420 |
| Q5 | 6.5 | 6.37 | 0.74 | 6.5 | 6.28 | 0.85 | 0.901 |
| Q6 | 6.0 | 5.75 | 1.49 | 6.0 | 5.86 | 1.32 | 0.841 |
Table 5.
Lab room responses grouped by gender. Results include median values (Mdn), mean values (M), standard deviation values (SD), and p-values obtained from the Mann-Whitney U (MWU) test.
Table 5.
Lab room responses grouped by gender. Results include median values (Mdn), mean values (M), standard deviation values (SD), and p-values obtained from the Mann-Whitney U (MWU) test.
| | Female | Male | MWU Test |
|---|
| | Mdn | M | SD | Md | M | SD | p-Value |
|---|
| Q1 | 6.0 | 6.11 | 1.05 | 6.0 | 5.77 | 0.93 | 0.294 |
| Q2 | 7.0 | 6.55 | 0.73 | 6.5 | 6.37 | 0.72 | 0.446 |
| Q3 | 6.0 | 5.78 | 1.20 | 5.5 | 5.37 | 1.30 | 0.324 |
| Q4 | 6.0 | 6.44 | 0.53 | 6.0 | 5.77 | 1.07 | 0.102 |
| Q5 | 7.0 | 6.44 | 0.73 | 6.0 | 6.03 | 0.67 | 0.112 |
| Q6 | 7.0 | 5.57 | 1.94 | 6.0 | 5.55 | 1.57 | 0.543 |
Table 6.
Lab room responses divided by age group. Results include median values (Mdn), mean values (M), standard deviation values (SD), and p-values obtained from the Mann-Whitney U (MWU) test.
Table 6.
Lab room responses divided by age group. Results include median values (Mdn), mean values (M), standard deviation values (SD), and p-values obtained from the Mann-Whitney U (MWU) test.
| | Adults | Middle-Age Adults | MWU Test |
|---|
| | Mdn | M | SD | Md | M | SD | p-Value |
|---|
| Q1 | 6.0 | 5.80 | 1.00 | 6.0 | 5.81 | 0.98 | 0.960 |
| Q2 | 7.0 | 6.45 | 0.69 | 7.0 | 6.50 | 0.63 | 0.885 |
| Q3 | 5.0 | 5.15 | 1.39 | 6.0 | 5.69 | 1.14 | 0.242 |
| Q4 | 5.5 | 5.60 | 1.14 | 6.0 | 6.25 | 0.77 | 0.085 |
| Q5 | 6.0 | 6.15 | 0.74 | 6.0 | 6.06 | 0.68 | 0.702 |
| Q6 | 6.0 | 5.35 | 1.84 | 6.0 | 5.73 | 1.44 | 0.678 |
Table 7.
Lab room results compared between participants having previous experience with AR and participants with no experience. Results include median values (Mdn), mean values (M), standard deviation values (SD), and p-values obtained from the Mann-Whitney U (MWU) test.
Table 7.
Lab room results compared between participants having previous experience with AR and participants with no experience. Results include median values (Mdn), mean values (M), standard deviation values (SD), and p-values obtained from the Mann-Whitney U (MWU) test.
| | Previous Experience | No Experience | MWU Test |
|---|
| | Mdn | M | SD | Md | M | SD | p-Value |
|---|
| Q1 | 6.0 | 5.75 | 0.98 | 6.5 | 6.33 | 0.82 | 0.187 |
| Q2 | 7.0 | 6.41 | 0.71 | 7.0 | 6.67 | 0.52 | 0.457 |
| Q3 | 6.0 | 5.47 | 1.24 | 5.5 | 5.33 | 1.63 | 0.934 |
| Q4 | 6.0 | 5.94 | 1.01 | 6.0 | 5.83 | 1.17 | 0.867 |
| Q5 | 6.0 | 6.03 | 0.69 | 7.0 | 6.67 | 0.52 | 0.042 |
| Q6 | 6.0 | 5.51 | 1.73 | 6.5 | 6.00 | 1.26 | 0.621 |
Table 8.
Responses of the participants of both user studies grouped by site, i.e., the museum exhibition and the lab room. Results include median values (Mdn), mean values (M), standard deviation values (SD), and p-values obtained from the Mann-Whitney U (MWU) test.
Table 8.
Responses of the participants of both user studies grouped by site, i.e., the museum exhibition and the lab room. Results include median values (Mdn), mean values (M), standard deviation values (SD), and p-values obtained from the Mann-Whitney U (MWU) test.
| | Museum Exhibition | Lab Room | MWU Test |
|---|
| | Mdn | M | SD | Md | M | SD | p-Value |
|---|
| Q1 | 7.0 | 6.51 | 0.71 | 6.0 | 5.85 | 0.96 | 0.00058 |
| Q2 | 6.0 | 6.13 | 1.01 | 7.0 | 6.41 | 0.71 | 0.28537 |
| Q3 | 6.0 | 6.27 | 0.84 | 6.0 | 5.46 | 1.27 | 0.00124 |
| Q4 | 7.0 | 6.39 | 0.70 | 6.0 | 5.92 | 1.01 | 0.03187 |
| Q5 | 6.0 | 6.28 | 0.79 | 6.0 | 6.13 | 0.69 | 0.22459 |
| Q6 | 6.0 | 5.82 | 1.27 | 6.0 | 5.58 | 1.64 | 0.70388 |
Table 9.
Responses of the participants of both user studies grouped by site excluding the data from the older adults age group. Results include median values (Mdn), mean values (M), standard deviation values (SD), and p-values obtained from the Mann-Whitney U (MWU) test.
Table 9.
Responses of the participants of both user studies grouped by site excluding the data from the older adults age group. Results include median values (Mdn), mean values (M), standard deviation values (SD), and p-values obtained from the Mann-Whitney U (MWU) test.
| | Museum Exhibition | Lab Room | MWU Test |
|---|
| | Mdn | M | SD | Md | M | SD | p-Value |
|---|
| Q1 | 6.5 | 6.28 | 0.81 | 6.0 | 5.85 | 0.96 | 0.065 |
| Q2 | 6.0 | 6.18 | 1.00 | 7.0 | 6.41 | 0.71 | 0.500 |
| Q3 | 6.0 | 6.00 | 0.90 | 6.0 | 5.46 | 1.27 | 0.090 |
| Q4 | 6.5 | 6.33 | 0.77 | 6.0 | 5.92 | 1.01 | 0.120 |
| Q5 | 6.0 | 6.28 | 0.71 | 6.0 | 6.13 | 0.69 | 0.349 |
| Q6 | 6.0 | 5.71 | 1.30 | 6.0 | 5.58 | 1.64 | 0.995 |


