1. Introduction
The Turin Shroud (TS) is the most-studied archaeological object in the world [
1,
2]. The TS is an ancient linen cloth, 4.4 m long and 1.1 m wide, which wrapped the corpse and encoded the image of a tortured man, who was scourged, crowned with thorns, crucified, and pierced by a spear in the chest. In agreement with the Christian tradition, many researchers are convinced that the TS is the sepulchral cloth of Jesus Christ; however, in 1988, the Shroud was radiocarbon dated by three famous laboratories [
3] and attributed to the year 1325 Anno Domini (AD), with an uncertainty of ±65 years, implying that the TS should be a Medieval artifact. This result has been widely criticized [
4,
5] for both procedural and statistical problems, as was recently confirmed by the statistical analyses of raw data made available to the scientific community after only about thirty years and a legal action [
6]. A regression analysis of data on the TS carbon dating has shown their statistical heterogeneity, together with the implausibility of the spatial allocations of some measurement samples [
4,
5,
6]. Moreover, the
14C dating results remain controversial, especially because of the likely non-negligible carbon contamination of the textile [
6,
7]. This contamination could be due to many factors, including environmental ones [
8,
9].
Moreover, other dating methods agree in the assignment of the TS to the first century AD [
5,
10,
11,
12]. Spectroscopic methods, based on Fourier Transform Infrared spectroscopy/Attenuated Total Reflectance [
10] and Raman spectroscopy [
11], date the Shroud to 300 Before Christ (BC) ± 400 years and 200 BC ± 500 years, respectively. The mechanical multi-parametric method, based on an analysis of five parameters, including the breaking load and Young’s modulus and the loss factor, after an adequate calibration based on the results of two dozen samples of known age, dates TS as 400 AD ± 400 years old [
12]. Estimates of the kinetic constants for the loss of vanillin from lignin suggest that TS has an age range from 1300 to 3000 years [
5]. A recent numismatic analysis [
13] proposes that TS was already present in 692 AD.
A new method for dating ancient linen threads by inspecting their structural degradation by means of Wide-Angle X-ray Scattering (WAXS) [
14] was recently applied to small linen samples taken from ancient fabrics, previously dated with the radiocarbon method. Our work showed that when the ancient fabrics are preserved by environmental contamination—i.e., when they were kept in the tombs where they were found—X-ray and
14C dating agree well [
14].
The aim of this work is to apply this new dating method for ancient linen fabrics to a TS linen sample. In
Section 2, we describe the material and present the method that was adopted for the analysis, which was detailed in [
14]. In
Section 3, we summarize the X-ray experimental results obtained for the TS sample. In
Section 4, we resume the main formulae [
14], which were used to date the natural aging of linen cellulose, discussing their implications for TS X-ray dating. Finally, in
Section 5, we report on the conclusions.
3. Results
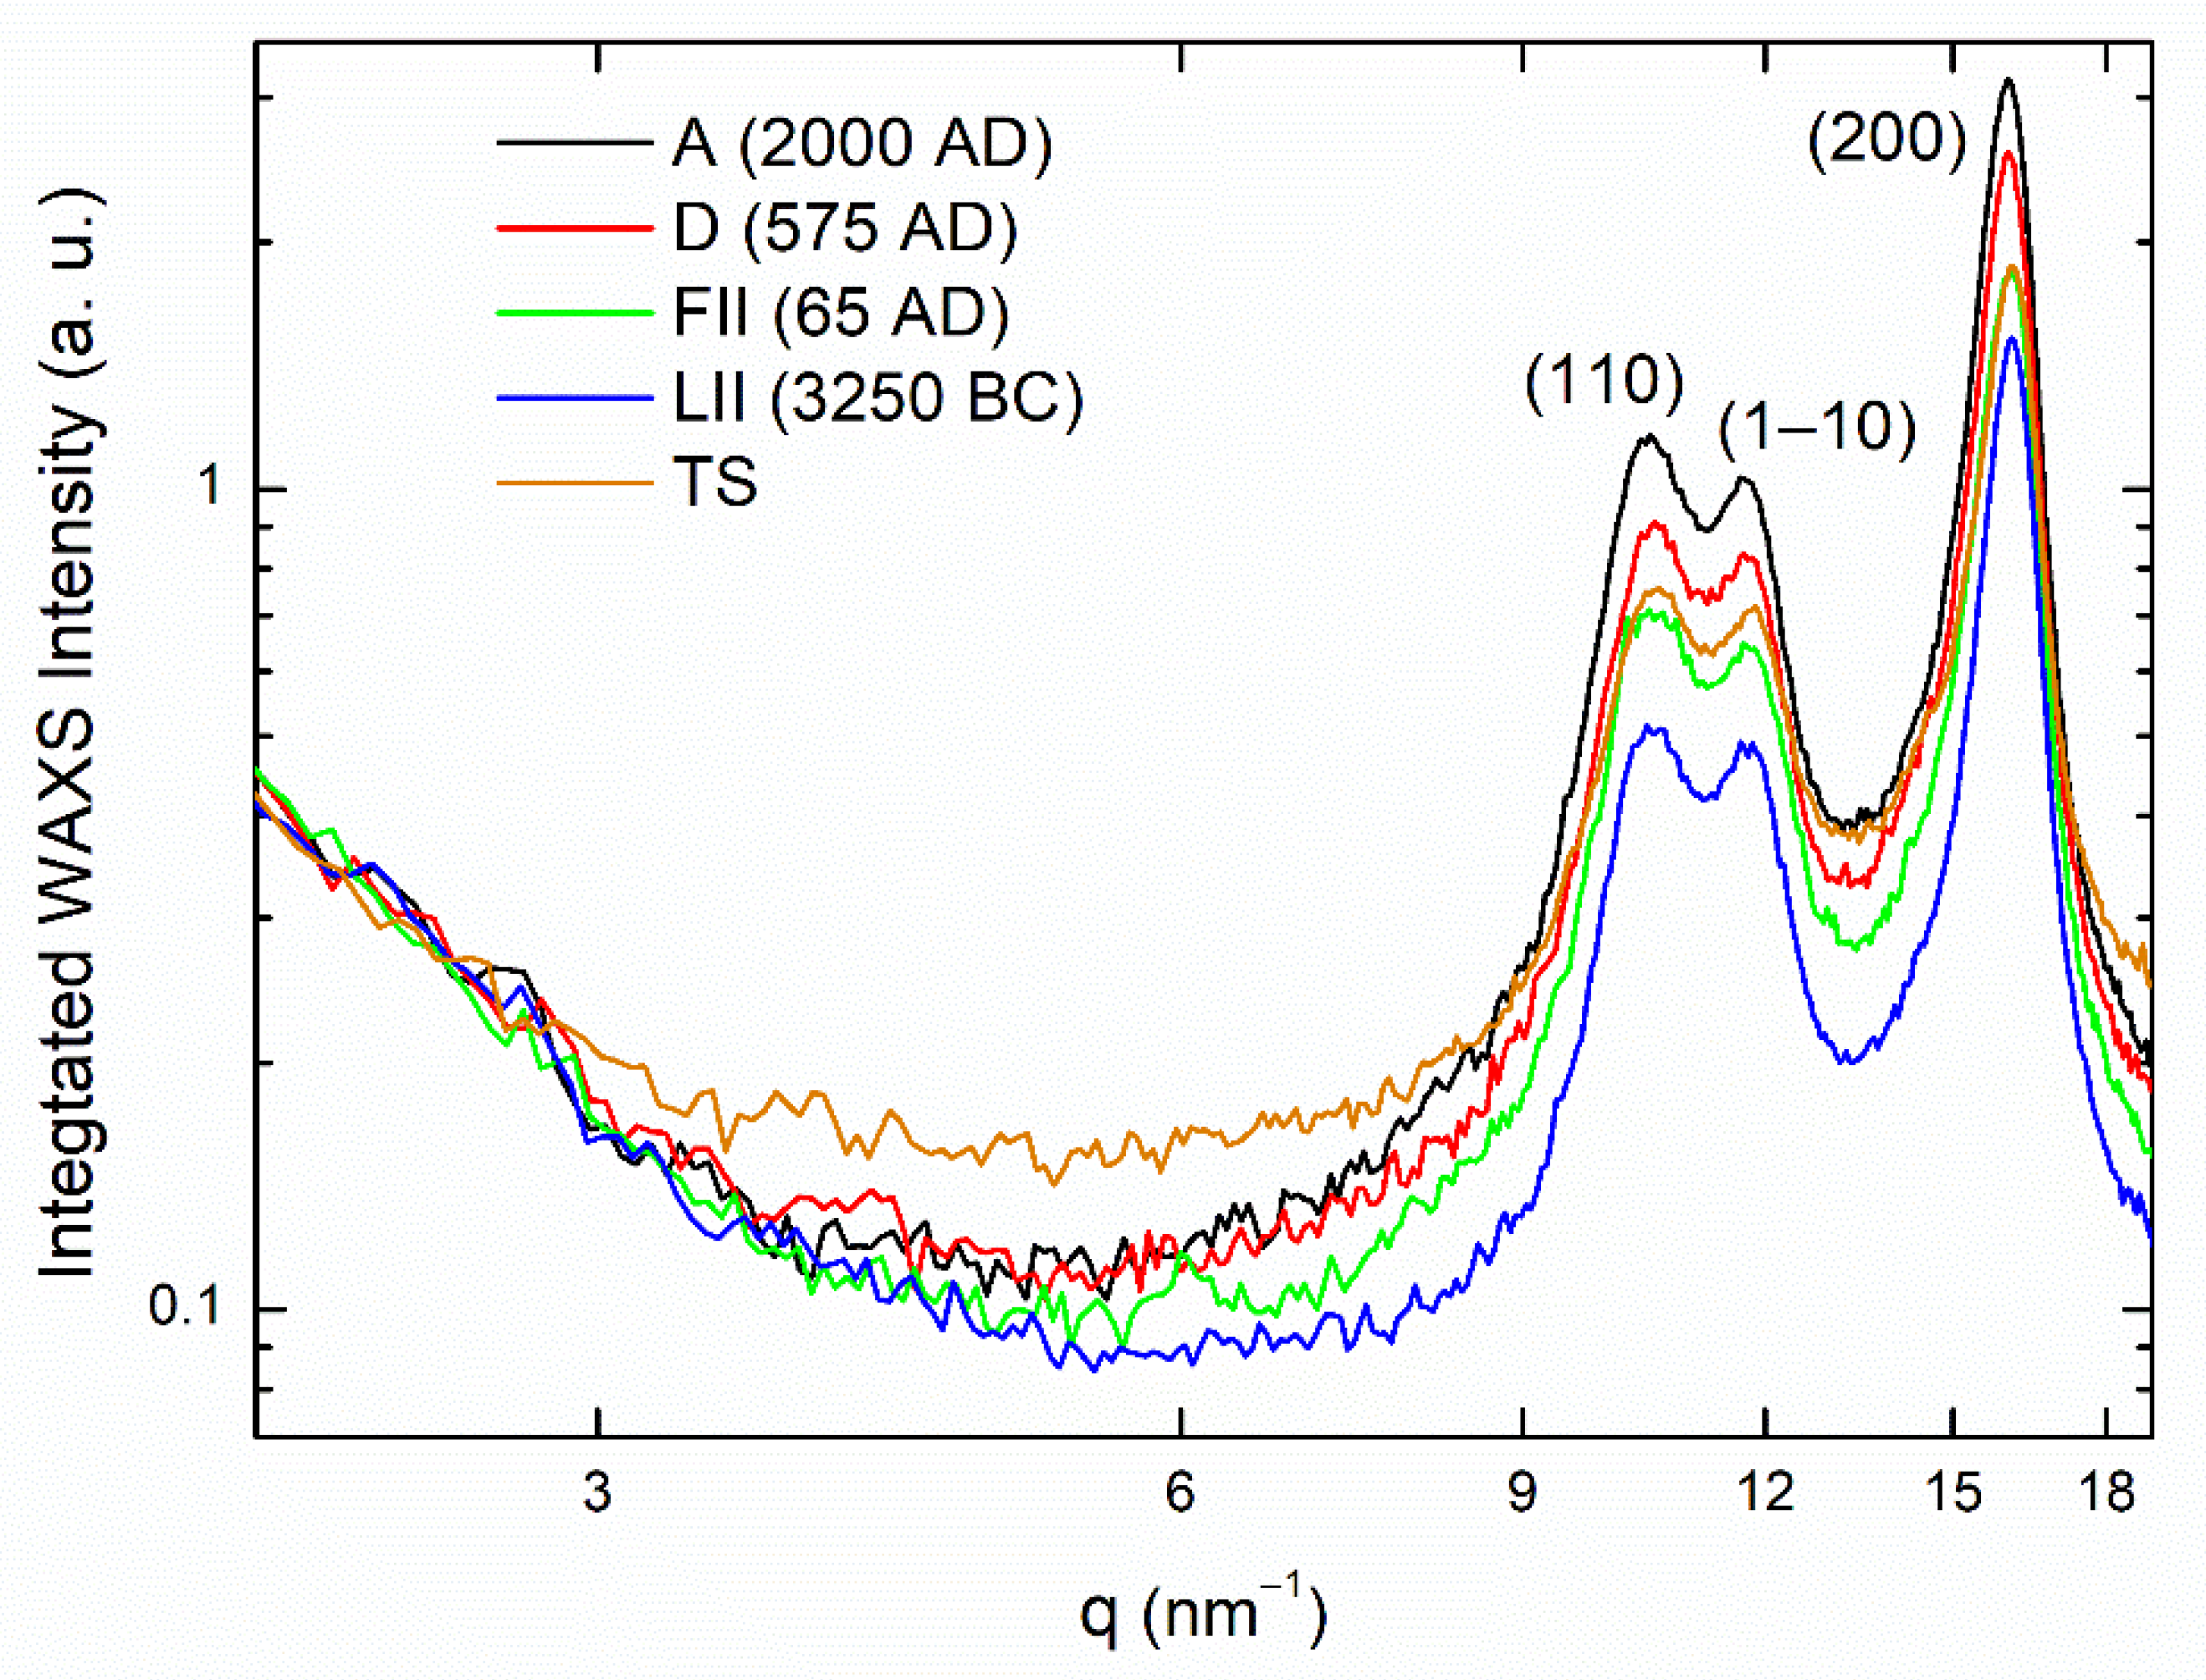
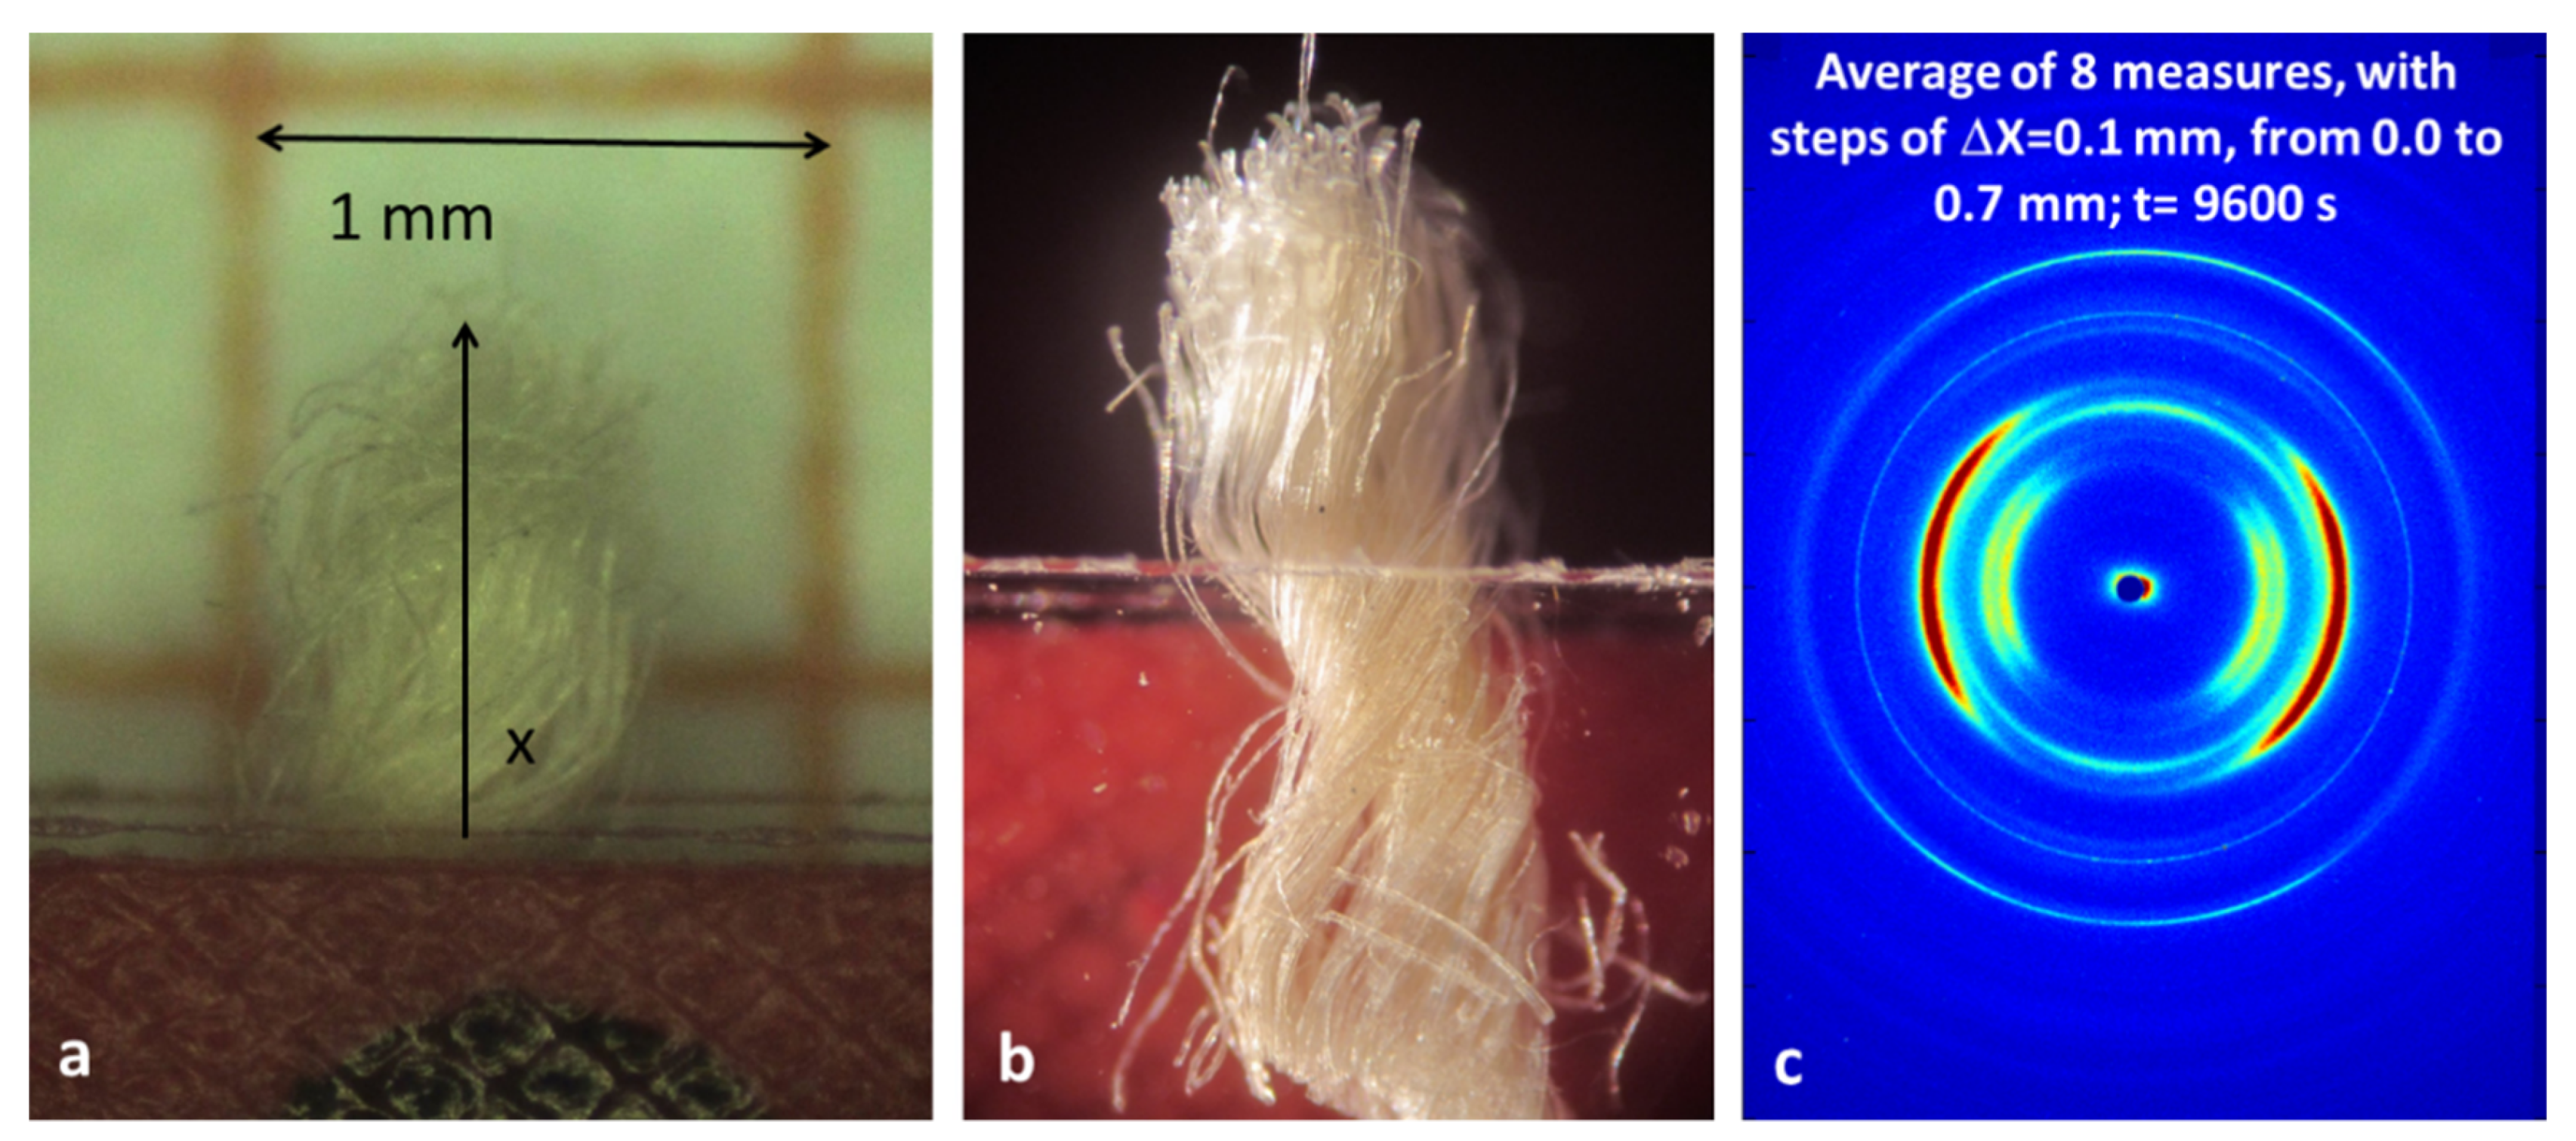
The 2D WAXS pattern shown in
Figure 1c was integrated in the azimuthal angular range of 10 degrees around the hk0 equatorial fiber–diffraction axis, as in [
14], for the other 2D WAXS patterns measured on the linen samples of
Table 1. These integrated profiles are indicated with I-profiles in the following. In
Figure 2, we added the TS I-profile, obtained using the WAXS pattern shown in
Figure 1c, to the I–profiles published in Figure 3 of [
14], rescaling the TS measured intensity to have the same integral in the q-range 1.5–4.0 nm
−1, i.e., in the region of the incident beam tail. The rescaling of all the profiles to the same integrated intensity in the region of the incident beam tail, allows for variations in the scattered intensity due to the eventual variations in the incident beam intensity to be eliminated.
The result obtained for the TS (orange curve), compared with the I-profile obtained for sample A (
Figure 2, black curve), FII (
Figure 2, green light curve), D (
Figure 2, red curve) and LII (
Figure 2, blue curve), by means of a qualitative inspection, indicates that the TS diffraction peak intensities are very close to those of the FII sample I-profile, taken from a sample whose Historical Record (HR) and
14C dating is 55–74 AD: the FII sample taken from a linen fabric found in the archaeological ruins of the Siege of Masada (Israel).
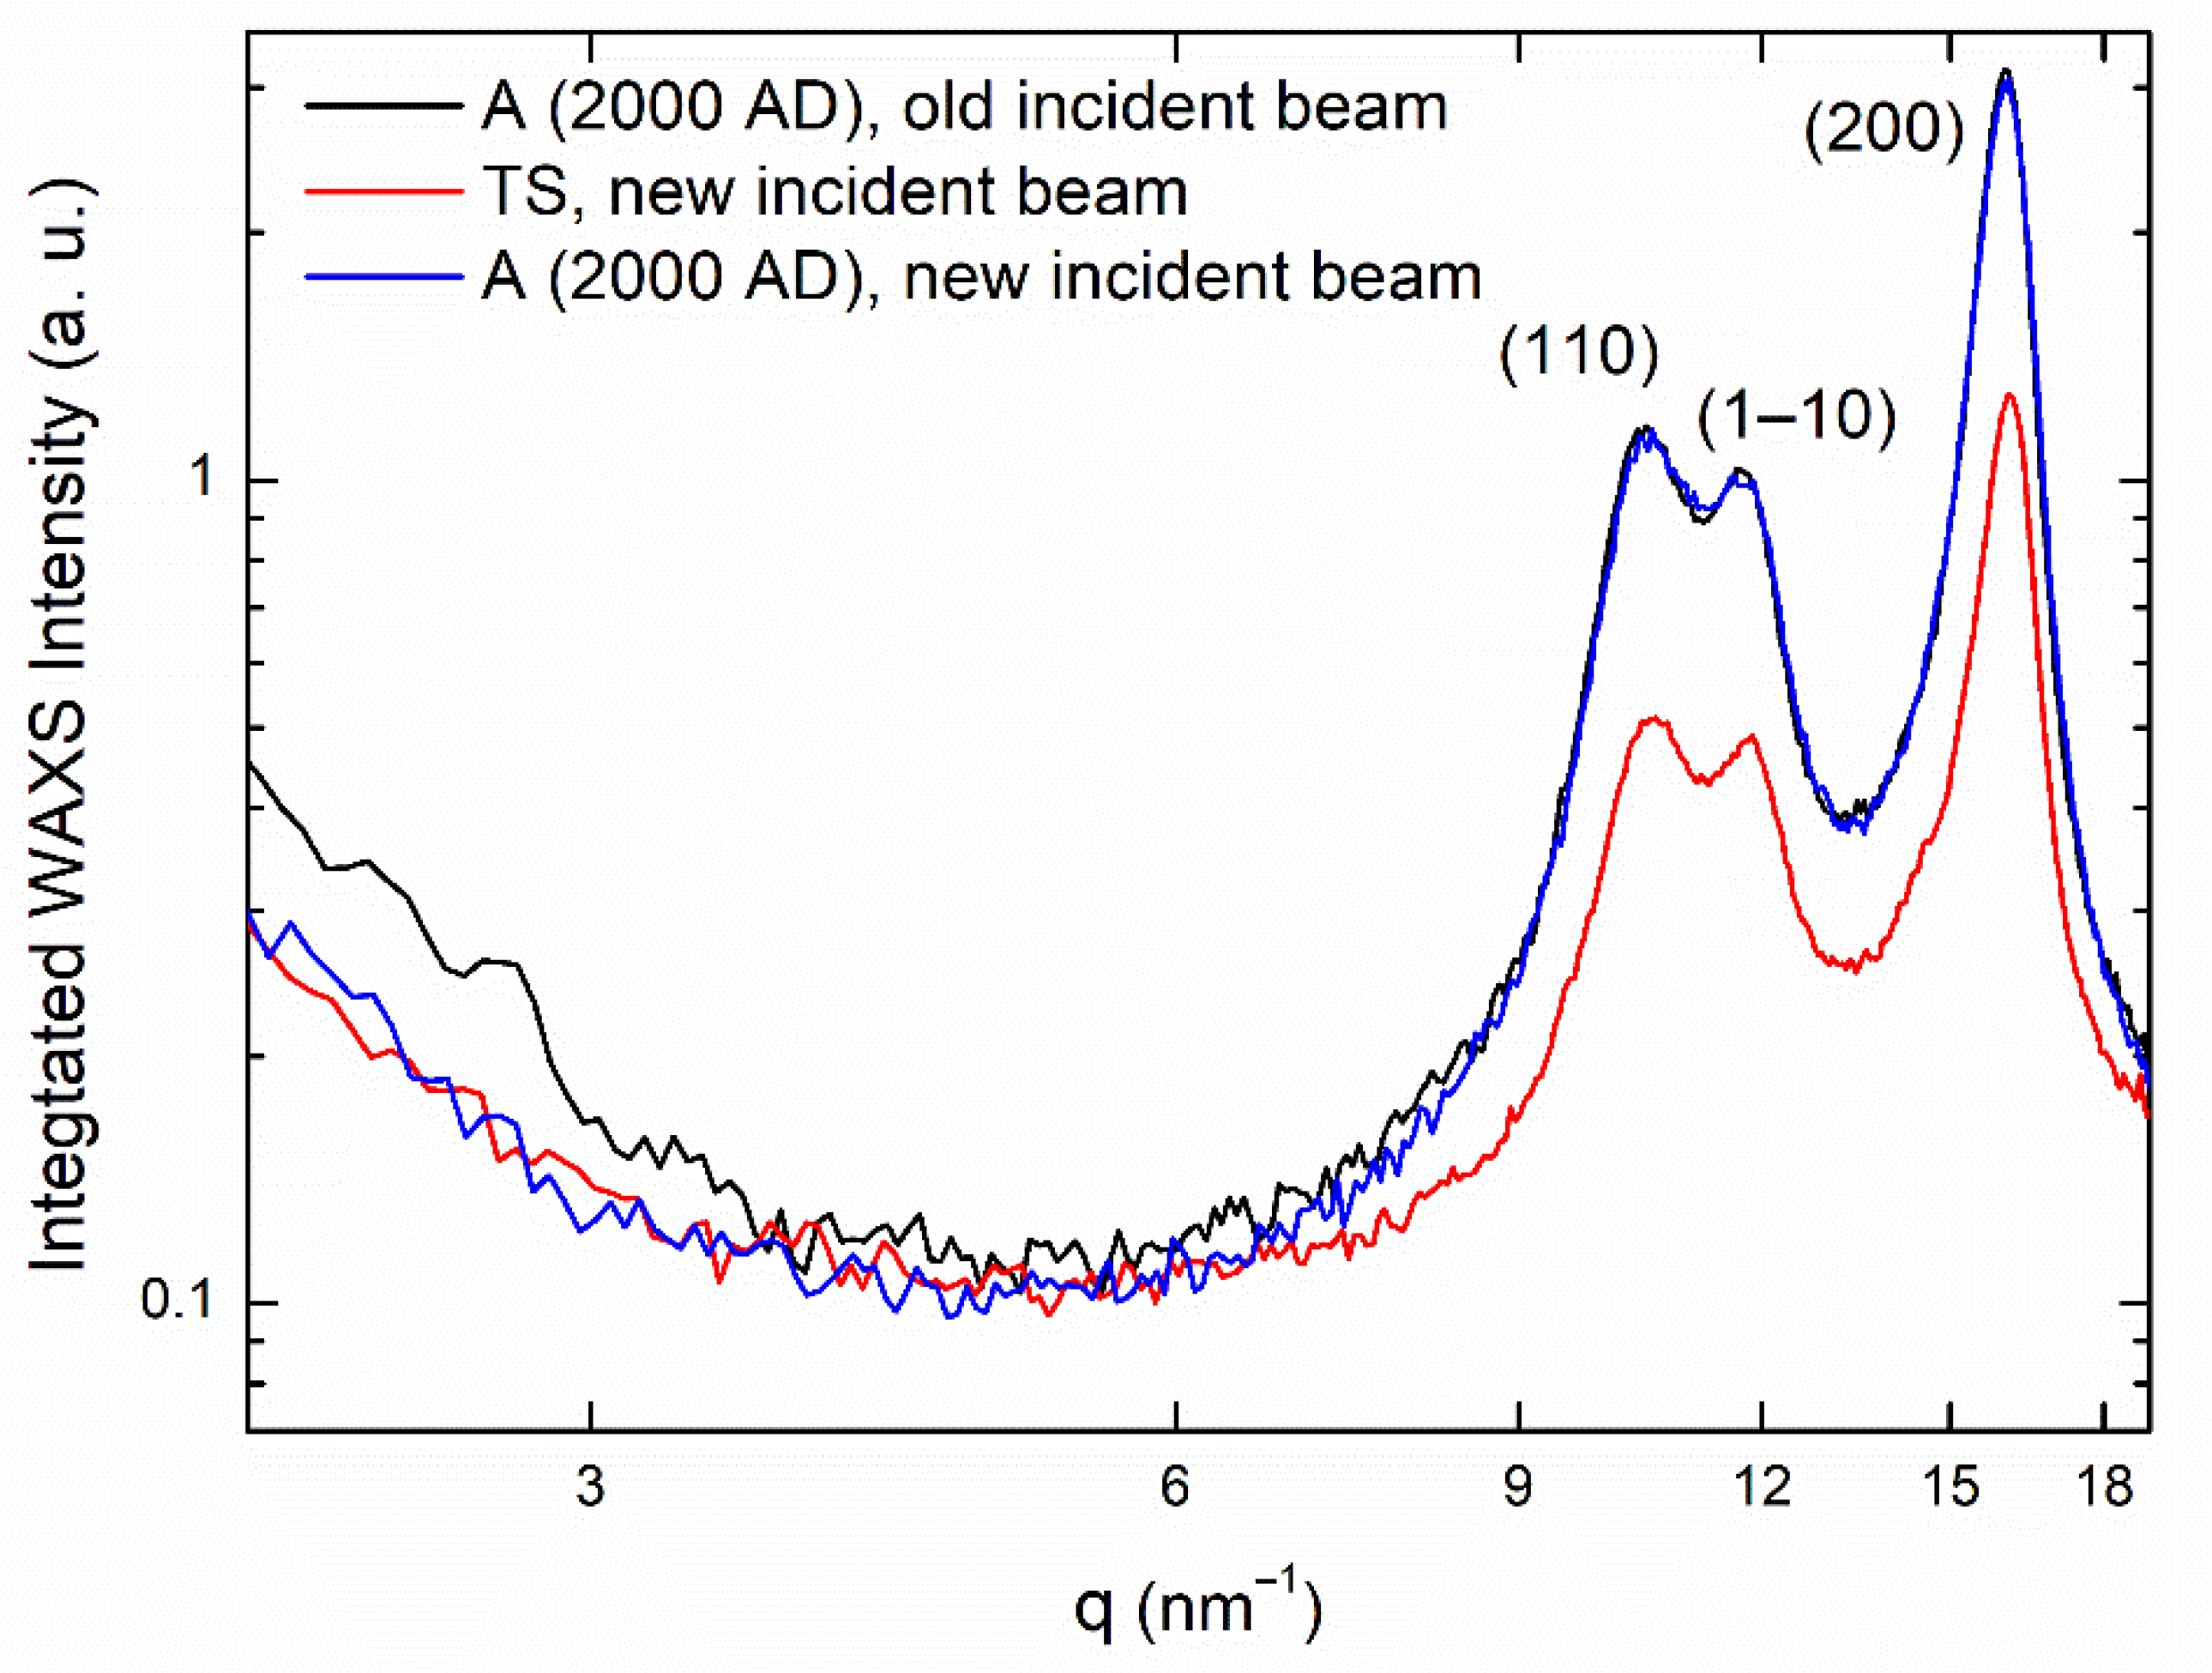
To be quantitative in our analysis, we need to consider that the measurements for the TS sample were made after several months, after replacement of the anode filament, and realignment of the focusing optics. This explains the new incident beam’s profile in the q-range 1.5–4.0 nm
−1, i.e., in the region of the incident beam tail used to perform an intensity scaling of the WAXS I-profiles, as described in [
14]. To evaluate the change in the incident beam’s profile in the q-range 1.5–4.0 nm
−1, we repeated the WAXS characterization for the A-sample of
Table 1. This procedure allows the TS I-profile to be placed on the correct intensity scale regarding the measurements that were obtained for other linen samples [
14]. The result is shown in
Figure 3, which shows the integrated WAXS profiles (I-profiles), extracted from the relevant 2D patterns, after integration in the angular sector of 10 degrees, around the hk0 equatorial fiber–diffraction axis. The A-sample black curve is the same profile already shown in Figure 3 in [
14].
The blue curve is the I-profile, measured on the same A-sample with a new incident beam. It was scaled to have the same integrated intensity under the (110) and (1–10) diffraction peaks in the I-profile measured in [
14]. The TS I-profile was rescaled to have the same integrated intensity, in the q-range 1.5–4.0 nm
−1, of the blue I-profile obtained on sample A with the new incident beam.
The Aging Factor (
AF, as defined in [
14]), for the TS and A I-profiles of
Figure 3 were reported in
Table 2, together with the
AF values that were published for the A, D, FII and DII samples, reported in Table 1 of [
14].
Table 2 summarizes some experimental quantities obtained by WAXS: the scattered intensity, integrated below the (110) and (1–10) diffraction peaks, <
I>
q∈[9,13], in the scattering vector q-range = 9.0–13.0 nm
−1; the maximum intensity in the entire q-range, dominated by the intensity of the (200) peak (
IM); the minimum background intensity between the (1–10) and (200) diffraction peaks (
Im). The symbol <…> stands for the average of the scattered intensities in the indicated q-range. <
I>
q∈[9,13] stands for the intensity in an angular sector of 10 degrees around the hk0 axis, averaged in the scattering q-range from 9 to 13 nm
−1, referred to in the following as
ID. The experimental data analysis is described in detail in [
14].
The aging factor
AF obtained for the TS sample confirms that it is comparable to that of the FII sample, whose HR dating corresponds to the Siege of Masada (55–74 AD). The
AP value, derived from WAXS-measured values for the TS sample, obtained as in [
14] and calculated using the minimum and maximum
AF values reported in Table 1 of [
14], is
4. X-ray Dating of the TS Sample
AP can be considered as an experimental evaluation obtained, by the WAXS of the ratio between
CB at any aging time
t and the normalized asymptotic value obtained for very long aging times [
14], as reported in Equation (1):
Equation (4) allows for an evaluation of the natural aging time
t of fabric threads.
t can be directly calculated from: the measured
AP value; the
DP activation energy
, and the
DP maximum fractional loss
; the estimated average room temperature
at which the linen fabric was preserved over the centuries. In [
14], for linen, we obtained:
=
kJ/mole;
. For
the reaction rate
of the linen
DP degradation, usually given in hours
−1, denoted as h
−1, is reported to be
[
16]. The
DP degradation’s reaction rate also depends on the humidity [
19]. The value of
was determined at a relative humidity value,
Hr = 50% [
16]. A variation in the relative humidity in the typical range of the average annual values registered almost everywhere on the earth’s surface, ranging from 50% to 80%, causes almost linear variations in the degradation rate (see Figure 5 of [
19]). An 10% increment in the relative humidity, from 50% to 60%, causes a
increment of 10% [
19]. Thus, variations of
can be put almost linearly proportional to variations of the annual relative humidity’s values, in the whole range of our interest, i.e., 50–80%. The average relative humidity values
Hr of the localities of Egypt and Israel from which the samples used in [
14] were kept for many centuries are all around 55 ± 5%. This, in turn, caused a
increment of only about 5%, from
to
, as used in [
14], since, in measurements of the accelerated aging of cellulose [
16], the relative humidity of the oven was kept constant at
Hr = 50%.
Other localities, for example in Italy, Turin, where the TS was kept for many centuries, are characterized by average relative humidity values
Hr = 75 ± 5%. In this case, we should expect a
value 1.5 times the value measured at a relative humidity
Hr = 50%, i.e., a
of about 0.0033 ± 0.0001 h
−1. This increment is important, but it plays a less important role regarding the secular average room temperature
in affecting the natural aging of linen, since the dependence on the temperature is realized through an exponential factor, as shown in Equation (2), whereas
is a multiplicative factor. To provide a quantitative indication of the different role of relative humidity and room temperature in affecting the natural aging of cellulose, from Equations (1)–(4) we found that the same natural aging process for the cellulose constituting linen would be obtained if one increased the average relative humidity from 50% to 75% and, at the same time, reduced the secular average room temperature by about 2.5 °C, e.g., from 22.5 °C to 20 °C. Indeed, to obtain the same rate of natural aging at
,
and
,
from Equations (1) and (2) it is sufficient to satisfy the following condition
where the temperature is expressed in Kelvin. The previous numerical example can be derived from Equation (5).
Thus, relative humidity is less important than the room temperature in affecting natural aging of cellulose. Nevertheless, high humidity promotes new life: molds, fungi, bacteria, insects, etc., which are more effective at destroying cellulose with respect to natural aging due to the action of the room temperature. Therefore, ancient linen fabric are, usually, only well preserved in semi-desert or desert climates, as for the linen samples found in the tombs of the mummies analyzed in [
14]. Conversely, this preservation of fabrics in other parts of the world, where the relative humidity can be much higher than semi-desert climates, is not guaranteed. Relics are an exception, due to their religious importance: they are also well preserved in geographical regions characterized by high relative humidity values; however, this slightly affects the rate of natural aging, and this finding has to be taken into account through Equation (5).
Moreover, it could be argued that some historically documented fires were suffered by the TS [
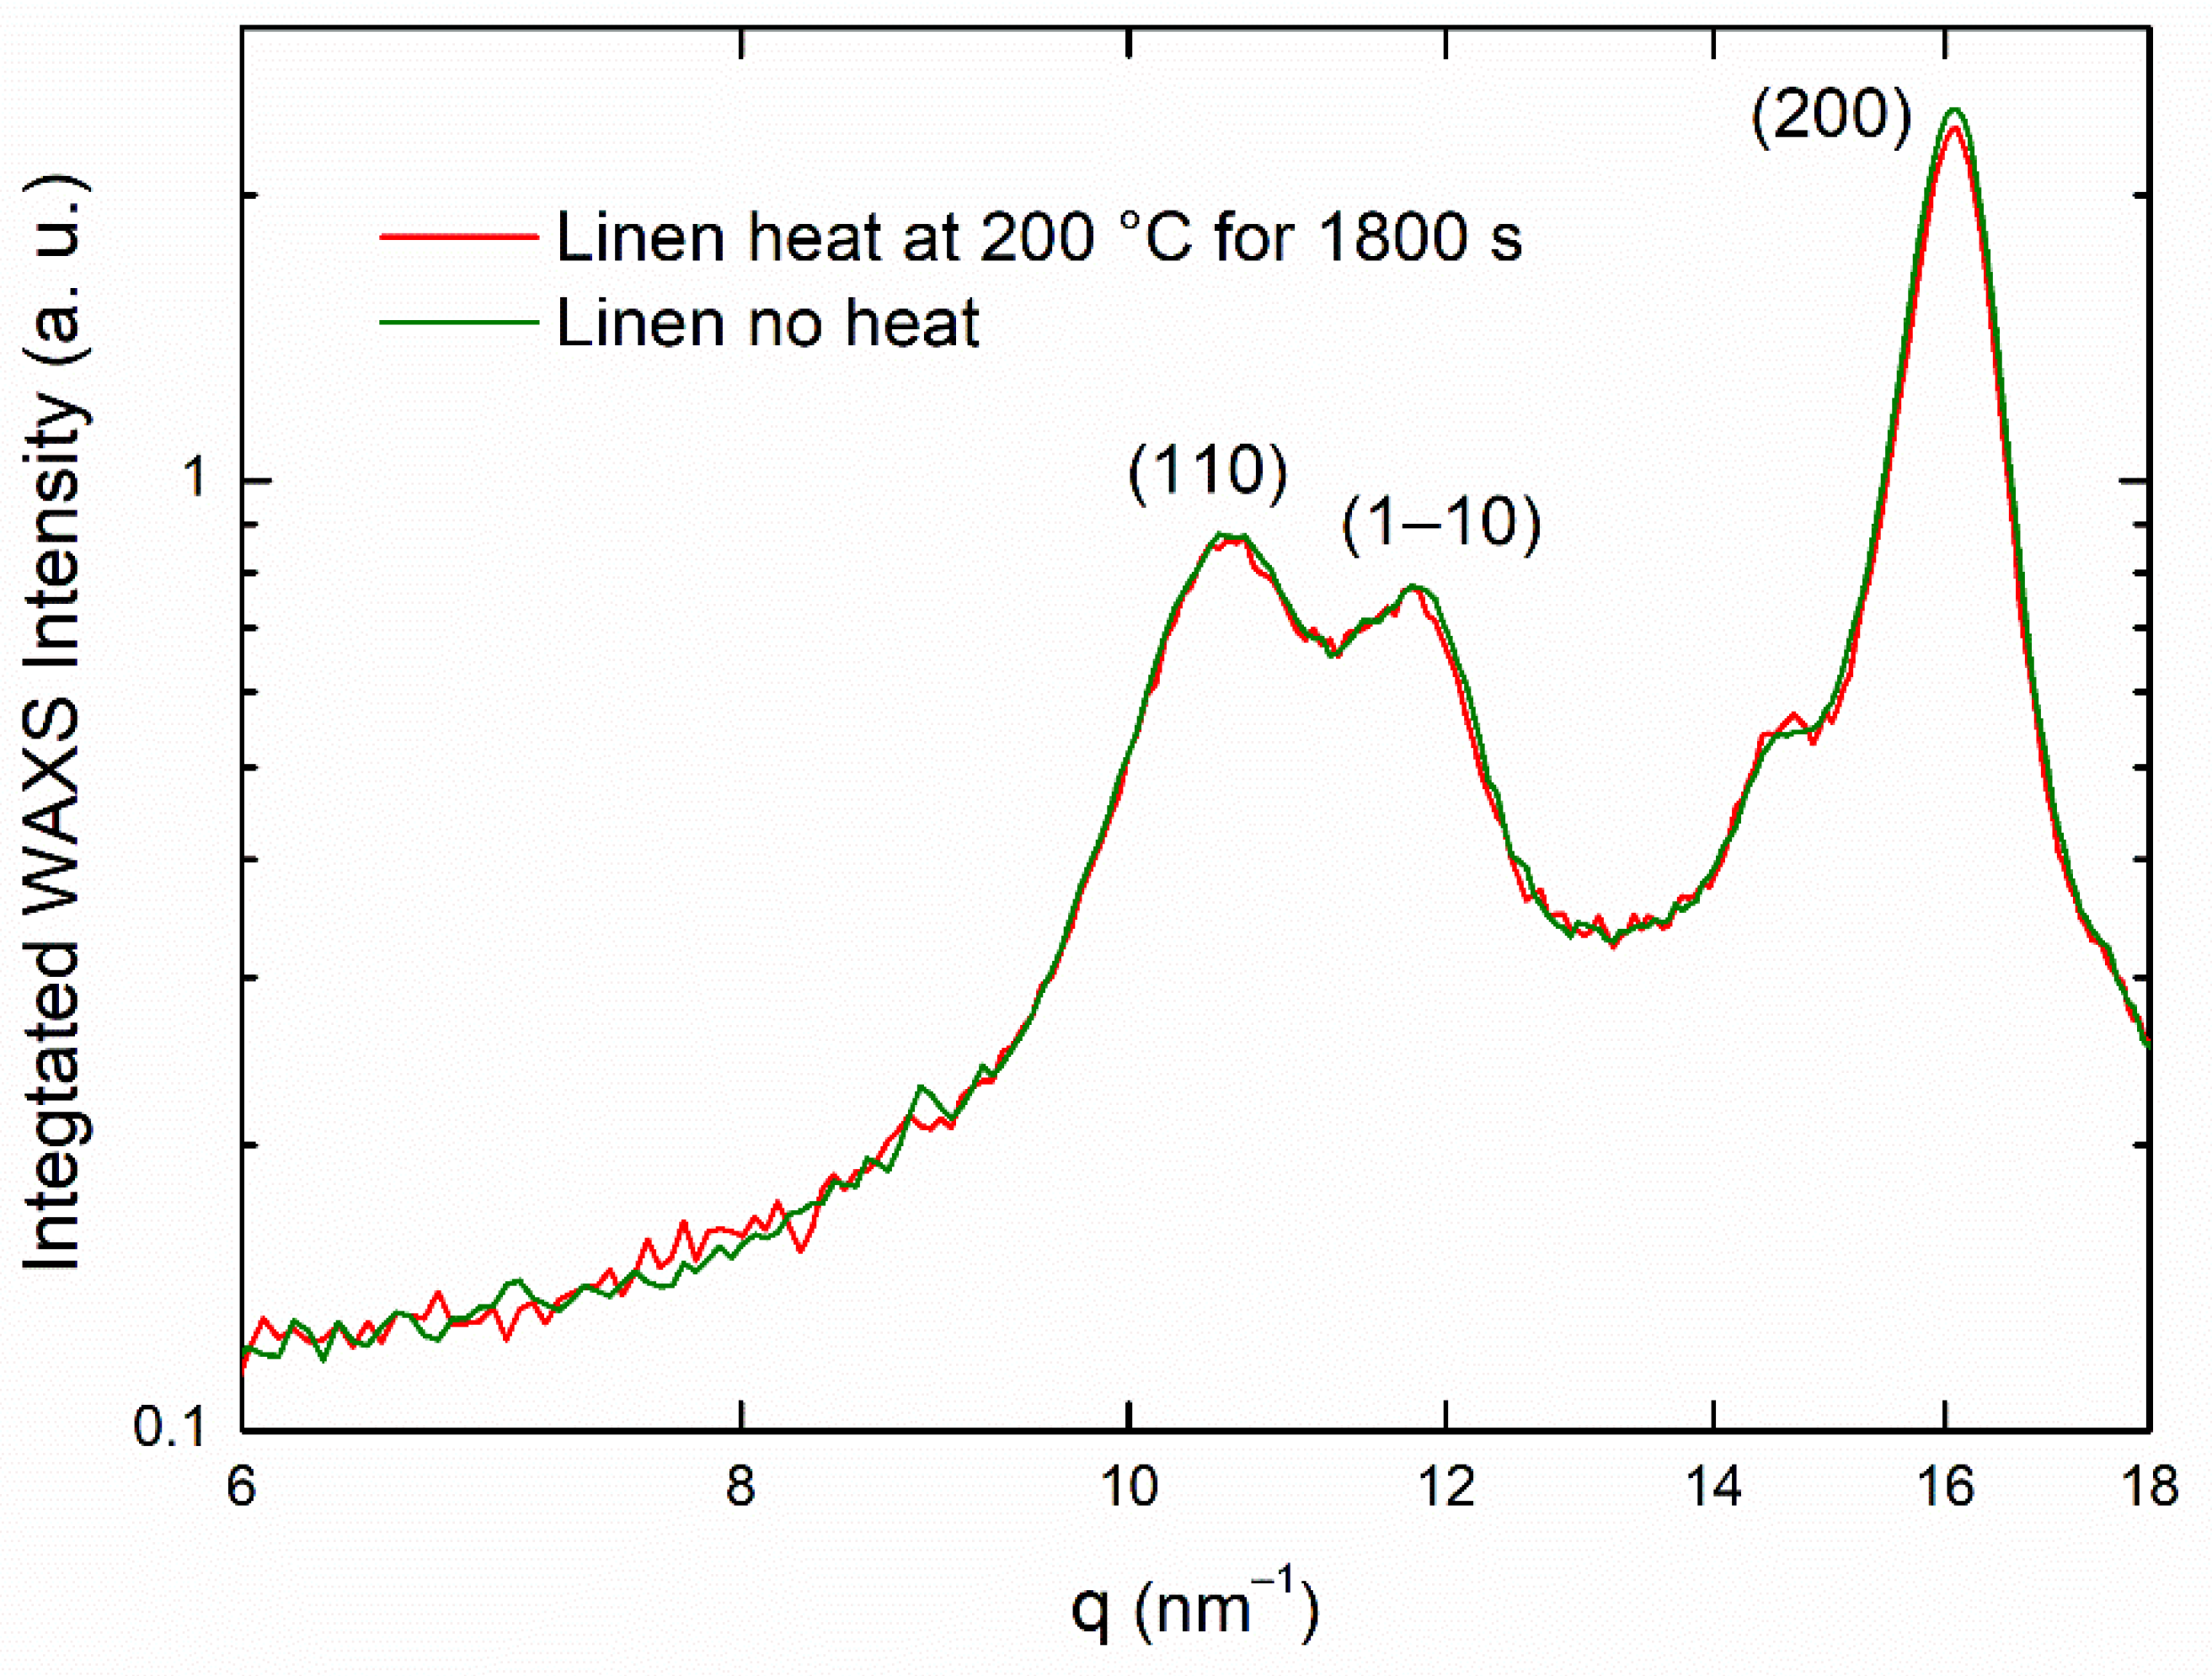
12]. These accidental events could have influenced the aging of the cellulose constituting its linen fibers. To verify this eventuality, we measured the WAXS maps of linen samples before and after exposure to a temperature of 200 °C in an oven for half an hour, without any control of the relative humidity, which became very low during the fabric’s exposure at these temperatures, as happens in real accidental fires. After this thermal treatment, the WAXS map of the samples was unaltered, as shown by the integrated profiles reported in
Figure 4, but the yellowing of the linen was very pronounced, as was also seen in the experiments discussed in [
20], where a detailed study about the linen yellowing, as a function of both the oven temperature and the time permanence in the oven, was performed.
The reason that a thermal shock at 200 °C does not affect the natural aging level of cellulose is related to the fact that, during a fire, the relative humidity becomes very low, reducing the reaction rate
of the linen
DP degradation by at least one order of magnitude. The only visible effect on the linen is its yellowing, caused by surface oxidation of fibers. Indeed, detailed experimental tests have demonstrated that a few minutes at a temperature of 200 °C could be enough to cancel out the TS image [
20], due to the high level of yellowing of the fabric. Moreover, our WAXS experimental tests allow any contribution of the thermal shocks caused by historically documented fires to the secular natural aging of the TS fabric to be excluded.
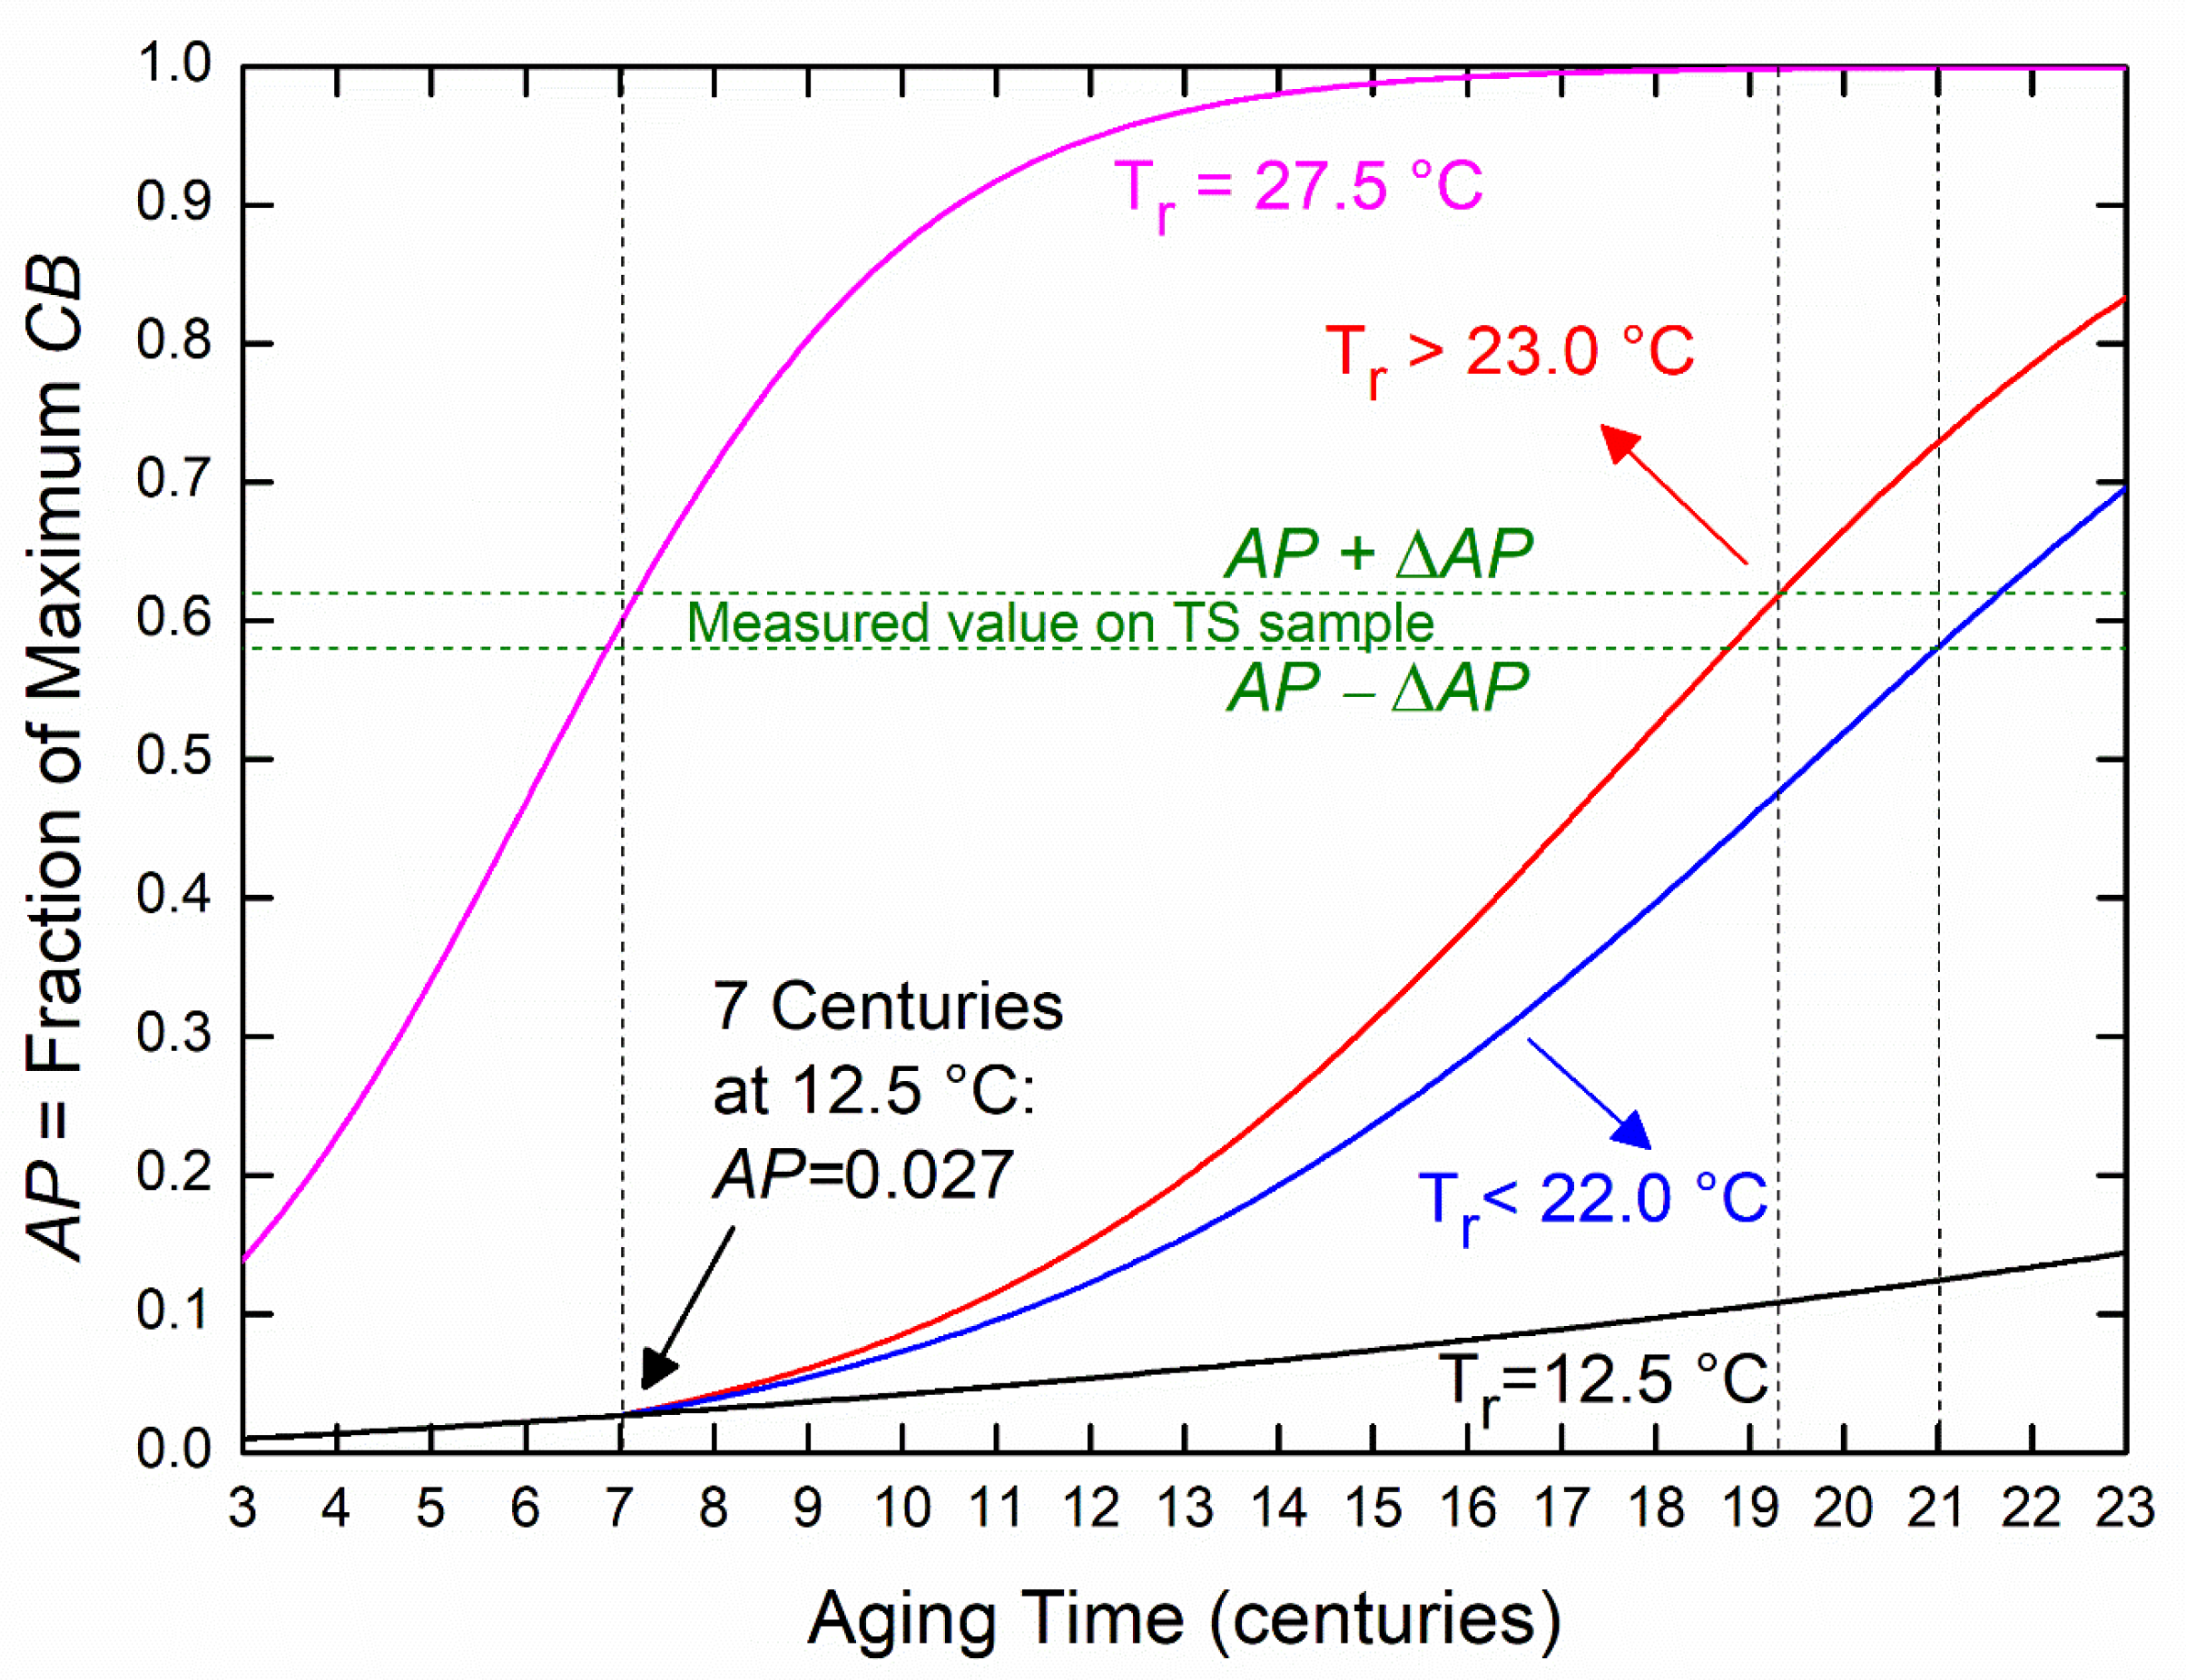
Figure 5 shows the Equation (4)’s prediction regarding the natural aging of the cellulose constituting the linen of the TS sample. From documented history, we know that, from the XIV century, this was kept in France for about two centuries and at Turin (Italy) for about five centuries [
12]. The secular average room temperature of Turin is of 12.5 ± 0.5 °C, and the average relative humidity is 75 ± 5% [
21]. The European secular average room temperature is even smaller than that of Turin, at around 8.5–9 °C [
22]. Even assuming seven centuries of history, always at a secular temperature of 12.5 ± 0.5 °C and an average relative humidity of 75 ± 5%, from Equation (2), we can obtain that the total
AP would be very low, equal to 0.027 (black curve of
Figure 5) of the order of the experimental error Δ
AP = 0.02 with which the
APTS was determined. The
14C dating of the TS suggests it is seven centuries old [
3]. Consequently, the
14C dating of TS is fully incompatible with the TS X-ray dating (green dashed lines in
Figure 5), because historical documents regarding TS’ presence in France and at Turin (Italy) for a total of seven centuries, would lead to a maximum final value of
AP ≤ 0.027, which is much lower than the measured value of
APTS = 0.60 ± 0.02. Seven centuries would be enough to cause the measured value of
APTS = 0.60 ± 0.02 only in the hottest region of the world. The magenta curve is the prediction for Mali (Africa), one of the hotter regions of the world. For example, in the years 1901–1930, it was characterized by an average temperature of 27.8 °C [
23]. Secular average room temperatures in the last seven centuries should be smaller than this value. Relative humidity in Mali is also only 40–45%. The magenta curve in
Figure 5 was plotted for the highest annual value,
Hr = 50%, for that region, to allow for maximum
DP degradation.
Therefore, to obtain an
AP value of the order of 0.60 ± 0.02 (measured value), we necessarily need to assume additional centuries of history for the TS. Adding to the seven centuries of European history of the TS, further centuries of history in any place in the world characterized by an average secular temperature of
Tr = 22.5 ± 0.5 °C and an average relative humidity of 55 ± 5% will lead to a total natural aging time of 20.2 ± 0.8 centuries. For
Tr < 22.0 °C, the TS linen would be more ancient (blue curve in
Figure 5) than 20 centuries old. For
Tr > 23.0 °C, the TS linen would be less ancient than 20 centuries (red curve in
Figure 5).
Thus, an X-ray evaluation of the natural aging of the cellulose composing the TS linen implies that it would be less than 2000 years old only if, for some centuries, before the last seven centuries in Europe, it was kept in a geographical region of the world characterized by a higher average secular temperature than about 23 °C. The other possibility—Tr <22 °C—would be compatible with Christian tradition, leading to a TS age of more than 20 centuries.
In principle, the hypothesis that the TS fabric, for many centuries, could have endured an average secular room temperature higher than about 23 °C at an average relative humidity of 55 ± 5% is possible, since there are linen fabrics, such as sample NII of [
14], taken by a mummy in Engedi (Israel), that were preserved for many centuries at an average secular temperature of about 23.5 °C and relative humidity values of 55 ± 5%. However, under the hypothesis that the TS is much less than 20 centuries old, it would be quite curious if it was always kept in localities in the world characterized by very high secular average temperatures. The European secular average room temperature is around 8.5–9 °C [
22], much lower than 23 °C. This simple consideration also seems to exclude the hypothesis that the TS linen is much less than 20 centuries old.
5. Conclusions
More than 30 years ago, it was argued that the measurement of the depolimerization of the cellulose constituting the linen of the TS could have offered the possibility of dating its fabric [
24]. This was the aim of this work. In particular, the WAXS analysis presented here, for the natural aging of the cellulose in the linen of a TS sample, allows us to conclude that it is very probable that the TS is a relic of about 20 centuries old, even if we only have European historical documentation for the last seven centuries. Since the
14C dating [
3] does not agree with our results, or with the dating obtained by other works (see
Table 1), a more accurate and systematic X-ray investigation of more samples taken from the TS fabric would be mandatory to confirm the conclusions of our study. In this regard, it is very interesting to note that X-ray dating can be realized on half-mm-sized samples and, contrary to
14C dating, the WAXS allows for repetitive measurements to be taken of the same sample. Therefore, many laboratories could repeat the X-ray dating on the same samples, and the procedure would also be blinded, because submillimetric or millimetric samples of linen fabric are indistinguishable, compared to the cm-sized samples needed for
14C dating, which prevented a blind measurement protocol from being carried out in the 1988–1989
14C study [
3]. Indeed, the particular TS weaving was clearly identifiable, invalidating the achievement of a blind analysis procedure. As a result, the bias in the 1988–1989
14C analyses occurred, as was demonstrated for this famous relic [
6].
Our tests on the effects of a thermal shock on the linen, obtained by measuring the WAXS patterns before and after a thermal treatment in the oven of a linen piece at a temperature of 200 °C for 30 min, allow for an increment in the natural aging due to the action of accidental fires, which have surely characterized the history of the TS fabric [
12], to be excluded. In particular, detailed experimental tests about the yellowing of the linen have demonstrated that a few minutes at a temperature of 200 °C could be enough to cancel out the TS image [
20].
Moreover, it is interesting to point out that our analysis has shown that, in order for the TS fabric to be about 20 centuries old, it should have necessarily been kept at an average secular temperature of about 22.5 ± 0.5 °C and an average relative humidity of 55 ± 5% for 13 centuries preceding the XIV century. From Equation (5), it follows that if the average relative humidity was of the order of 75 ± 5%, to obtain the same value of the measured natural aging of 0.60 ± 0.02 for the TS sample, the average secular room temperature should be about 20.0 ± 0.5 °C. Therefore, from our WAXS characterization it follows that we have a range of allowed secular average room temperatures of 20.0–22.5 °C, correlated with a range of average relative humidity values of 75–55%, as climate constraints, for the TS to be a 20-centuries-old relic. These physical constraints on the secular average room temperature and the average relative humidity, obtained by measuring the natural aging of the cellulose of the TS sample, here realized through WAXS characterization, could help historians test their hypotheses throughout the possible locations in the world and historical periods in which the TS could have been kept during the 13 centuries before its documented history in Europe.
Finally, since X-ray dating indicates that the TS is older than its seven centuries of European history, we can also argue that it was fortunate that the TS was carried to Europe seven centuries ago. Indeed, our analysis has shown that, from the XIV century until today, the natural aging of the cellulose of the TS linen has been very low, due to the low secular European average room temperatures, thereby preventing the TS body image from fully disappearing, which would have happened at an average secular room temperature of 22.5 °C. Indeed, Equation (4) implies that, under the hypothesis that the TS is 20 centuries old, after 20 centuries at an average value of Tr = 22.5 °C and a relative humidity of 55%, a natural aging of about 90% would have already occurred; this value is much higher than the 60% that was experimentally determined for the TS sample. Therefore, by chance, only the recent history of the TS in Europe has prevented the TS linen from fully yellowing and the TS image from fully disappearing, thus preserving a puzzle that is very difficult for science to solve. New WAXS analyses on the natural aging of the cellulose in linen could allow for the correct age of the TS to be determined, which is a fundamental piece of this puzzle.


 ,
, 


