Abstract
The complex and colorful textiles of ancient Peru have long been a focus of technical study, particularly to characterize the sources of the wide variety of dyes utilized by these Andean artisans. This manuscript describes the characterization of the dyes of both primary (red, blue, and yellow) and secondary (purple, orange, and green) colors sampled from textiles spanning five major civilizations: the Paracas Necropolis, the Nazca, the Wari, the Chancay, and the Lambayeque, all from Peru. All but the Paracas Necropolis samples were part of technical conservation studies of the ancient South American textiles collections of the Michael C. Carlos Museum. Analysis of the dyes was carried out utilizing direct analysis in real time time-of-flight mass spectrometry (DART-MS) and paper spray MS. To validate these ambient ionization MS methods, the samples were further investigated using high-performance liquid chromatography (HPLC) with ultraviolet-visible diode array detection (DAD). These results show that ambient ionization MS methods are simple and fast for characterization of the general classes of dyes, e.g., plant reds vs. insect reds, and indigoids in blues and greens. Due to the myriad possible sources of yellow dyes and their tendency to undergo oxidative decomposition, positively identifying those components in these yarns was difficult, though some marker compounds and flavonoid decomposition products were readily identified by ambient ionization mass spectrometry.
1. Introduction
The ancient weavers of Peru are known for their complex multicolored textiles, preserved in burial contexts primarily due to the dry and cold conditions of these high-altitude locations. These textiles, which span a wide range of time and geography across the Andes, have long been admired for their intricate workmanship and complex designs. Determining the sources of the dyes used to achieve the colors in these priceless objects has been the object of a great amount of study over the years, dating back to work by dye chemists Fester [1] and later Saltzman [2,3] in the mid-20th century.
The characterization of dyes in ancient textiles is challenging for numerous reasons, including difficulty in obtaining material in sufficient quantity for analysis while minimizing damage to objects. The high tinting strength of most dyestuffs means that while the color of the sample may be readily visible, the actual amount of colorant present may be below the limits of detection of many analytical approaches. Degradation may complicate the identification of dye colorants, particularly those present in the fugitive yellow dyes, due to photo-oxidation [4] or other decomposition pathways [5] that may occur. Further, decomposition—either during burial or after excavation—may complicate determining color, as what appears blue today may have once been green, but the yellow colorants have decomposed. Colorants, or dye chromophores, are the molecules that come from the dye preparation to impart color to a textile. It should be noted, though, that some mordants and additives can also alter the apparent color of the dye. In some cases, identifying a colorant also identifies the dye source, as in the case of carminic acid, which is indicative of cochineal from Dactylopius coccus and various subspecies. Other colorants, such as luteolin and quercetin, are found in numerous plant dye sources. Thus, characterizing the dyes in textile samples to identify the colorants may or may not identify the dye sources that were used by their makers.
Yellow dyes have long been considered the most difficult to identify because the sources of yellow dyes are myriad and have many overlapping colorants in common. A wide variety of different plants have been suggested as possible sources of yellow dyes in pre-Columbian Peruvian textiles by previous researchers [6,7,8]: Bidens andicola and other Asteraceae (including commercially available Coreopsis and Dahlia); Baccharis species, including B. floribunda and B. genistelloides; and Alnus jorullensis. Previous work has also investigated the composition of Kageneckia lanceolata and Hypericum larcifolium [9]. The Asteraceae contain the chalcone colorants butein and okanin and their glycosides, while the others, along with Chlorophora tinctoria (locally called insira), are primarily flavonoid dyes. The flavones luteolin and apigenin and the flavonols quercetin and kaempferol are the most abundant colorants, along with their corresponding methyl ethers [10]. Bocconia pearcei contains the benzoisoquinoline alkaloids sanguinarine and chelerythrine [11,12]. Chuquiraga espinosa and Dicliptera hookeriana are not yet well characterized, but both appear to be flavonoids, as well.
Early work on the identification of Andean dyestuffs relied predominantly on UV-visible spectroscopy, and occasionally on separations by thin layer chromatography [8,13]. More recently, the bulk of research on the identification of dyes in textiles has been carried out with chromatographic separations, primarily by high-performance liquid chromatography (HPLC), considered the “gold standard” method for such materials. Wouters and Rosario-Chirinos [6] reported an extensive study in which they used HPLC with diode array detection (DAD) to separate, quantify, and identify all components of purple, red, and blue dyes in textiles from a range of samples from pre-Columbian to Inca period civilizations. Niemeyer et al. [14] performed HPLC dye analysis on South American red and blue textiles, finding evidence of trade throughout the region due to the presence of non-local dye sources. Degano and Colombini [15] described the analysis of blue and red dyes in 11th and 13th century materials using HPLC with a variable wavelength UV-vis detector to determine what dyes were present in textiles associated with a mummy from a pre-Columbian site in Peru. Price et al. [16] described the identification of dyes in materials from a pre-Columbian weaver’s toolkit. Most recently, Boucherie et al. [17] reported on HPLC analyses of Nazca textile dyes, and Sabatini et al. [7] combined HPLC-MS/MS with X-ray fluorescence to characterize both the mordants and dyes in Paracas textiles. HPLC is the most effective way to separate components of dyes. Using UV-vis spectroscopy alone to identify the components can be difficult, particularly when reference standards of the pure colorants are unavailable, as is often the case.
Mass spectrometry (MS) has the advantage of identifying components based on their molecular masses and, in some cases, fragmentation patterns, which are generally more specific than UV-vis spectra. Michel et al. [18] utilized high-resolution mass spectrometry to characterize red, blue, and purple textiles from the Atacama desert of northern Chile. They found evidence that the Pachacamác people used both shellfish purple and combinations of red and blue dye sources to color their textiles. This early work required a relatively large 1-centimeter-long sample to be destructively extracted in hot dimethyl sulfoxide for direct exposure electron impact mass spectrometry. The potential of some spectroscopic methods for non-invasive identification of dyes in Andean textiles is also of note, particularly applications of fiber-optic reflectance spectroscopy and Raman spectroscopy [19,20,21]. With secure contexts for the materials being characterized, a great deal can be learned about the culture and technology of the textile artists, as demonstrated by Boytner [22].
Another method that shows potential for dye analysis is direct analysis in real time mass spectrometry (DART-MS) [23] with a time-of-flight mass analyzer. Armitage et al. [24] undertook analysis of the dyes in red textile samples from the Paracas Necropolis period, which had been previously identified as Relbunium. A major limitation of all soft ionization mass spectrometric methods is the inability to distinguish structural isomers, such as indigotin and indirubin, or alizarin and xanthopurpurin, based solely on molecular mass. Yellow colorants are particularly difficult to differentiate with DART-MS alone, as in-source collision-induced dissociation, useful for pure substances, yields complex results for mixtures [25]. DART-MS and another “ambient” ionization method, paper spray, [26] have shown potential efficacy for characterizing a wide variety of dyes in reference collections [9], though HPLC with MS/MS detection is necessary for identifying true unknowns.
The work reported herein stems from projects carried out over several years, with a focus on the primary colors of red, blue, and yellow as well as the secondary colors of purple, green, and orange in dyed textiles from several pre-European contact civilizations of South America, ranging in time from 800 BCE to 1460 CE. The sampled objects are either from the Paracas Necropolis or have been attributed stylistically to the Nazca, Wari, and Chancay, all of which rose and fell throughout that period within the geographic area that is present-day Peru. Here, we compare the results of two approaches—ambient ionization mass spectrometry and high-performance liquid chromatography—for the identification of these dyes in yarns from ancient Peruvian textiles. We compare the capabilities and limitations of these approaches in terms of (1) the amount of sample necessary, (2) the limits of detection, (3) the selectivity, (4) the speed of analysis, and (5) the skill required of the analyst. This study serves as a step in the process of validating the use of ambient ionization mass spectrometry for characterizing dye colorants in ancient textiles.
2. Materials and Methods
2.1. Materials
From August to December 2017, the Threads of Time: Tradition and Change in Indigenous American Textiles exhibition was on display at the Michael C. Carlos Museum at Emory University. The objects in the exhibition had entered the museum from historical private collections, and lacking archaeological context, they were attributed on the basis of style. As part of the technical study in tandem with this exhibition, we undertook mass spectrometry analyses to answer questions about the colorants. Encouraged by the exhibition curator, Dr. Rebecca Stone, we chose to focus on the secondary colors: green, orange, and purple. The central question was whether these colors were obtained from a single dye source or if they were produced through overdyeing or mixing of dyes in the dye pot, or through dyeing naturally colored yarns. The colors of dyed objects selected for this study were determined by eye, with multiple individuals interpreting and agreeing on the colors as orange, green, or purple. Organic color is fugitive and subject to deterioration (fading, color shift, color loss). Even if the visible color of a dye had deteriorated, evidence of the original dye would be expected to remain detectable through chemical analysis for characteristic compounds. Secondary colors can be achieved by the use of mordants with a single primary dye. In these examples, we would expect only one dye source to be identified. The secondary colors of the objects were judged visually without assuming how the object might have originally appeared. If an object appeared blue, it was not assumed that the yellow had faded from a mixed green, and thus, the object was not sampled for green. In the case of orange, in particular, it is possible that a red dye could fade to appear orange. The color was evaluated throughout the object, confirming that protected areas (seams, insides, backs) did not reveal evidence of color loss or shift before a sample was removed to represent a given color.
The objects, along with the relevant samples and the historic time periods from which they originate, are listed in Table 1. Each sample consisted of anywhere from a few plucked fibers of the color of interest to a snippet of yarn from a frayed edge. Yarn snippets varied in size from a few millimeters to 2 cm or more in cases where the edge was already heavily damaged such that sample was readily separating from the object. The samples were collected at the Carlos Museum conservation laboratory, and the colors were determined by consensus of those selecting and observing the collection process. The original collection of Nazca, Wari, and Chancay samples were collected in collaboration with Dr. Cathy Selvius DeRoo, formerly of the Detroit Institute of Arts. These samples were placed into labeled polypropylene microcentrifuge tubes, or, in the case of the plucked fiber samples, placed between two glass microscope slides and taped closed for transport back to the laboratory at Eastern Michigan University (EMU) for analysis. A separate technical study was later undertaken of another Peruvian textile from the Pacatnamú site in northern Peru, attributed to the Lambayeque culture of the Central Andes. The Lambayeque samples were collected in glass vials and shipped to EMU for analysis. Images of the textiles and samples are provided in Supplementary Figures S1–S10.

Table 1.
Textile samples from the Michael C. Carlos Museum; images in Supplementary Figures S1–S10.
For comparison through time, samples of similar primary and secondary colors from the Paracas Necropolis period were also included in this study. These were collected at the Museo Nacional de Arqueología, Antropología, e Historia del Perú (MNAAHP) in Lima, Peru, by Anne Paul in 1985 from loose fibers and yarns closely associated with mummy textiles; no fibers were removed from the textiles themselves. The colors of these samples were determined visually by Paul when the samples were collected, and transcribed and confirmed by Jakes [27], also through visual observation. These samples have been stored in a climate-controlled museum storage environment at The Ohio State University, Columbus, OH, USA, since they were collected. The samples come from a total of four different mummy bundles in order to sample a wide range of colors and are listed in Table 2. Images of these samples are provided in the Supplementary Figures S11–S14.
Table 2.
Paracas Necropolis samples from Museo Nacional de Arqueología, Antropología, e Historia del Perú (MNAAHP), Lima, Peru, collected in 1985 by A. Paul. Identification numbers refer to a specific mummy bundle, specimen, and subspecimen (bundle-specimen subspecimen) as recorded by Paul. Images of samples are found in Supplementary Figures S11–S14.
Reference samples from the Peruvian dyes collection prepared by Kay and Erik Antúnez de Mayolo in the 1970s in collaboration with Max Saltzman were included as comparative materials [28] in the latter stages of the project with an emphasis on the yellow dyes. The materials in this collection were prepared on spun sheep’s wool, cotton, and Peruvian alpaca yarns, all of unknown origin, both unmordanted and with alum mordant. This collection was also the basis for the widely cited report on Peruvian dye plants [29]. Previous studies of portions of this collection have been reported elsewhere [9]; additional samples not included in the reference collection attributed to Saltzman stored at UCLA, Los Angeles, CA, USA, have been included here. The samples analyzed here were only the alum-mordanted sheep’s wool yarns. Additional reference materials were prepared from commercial sources as necessary, particularly for secondary colors; details can be found elsewhere [30].
The solvents used in the methods described here were acetonitrile (ACN) of HPLC grade (Sigma-Aldrich, St. Louis, MO, USA); deionized water (H2O) from a Barnstead Diamond water polishing system; methanol, N,N-dimethylformamide (DMF), and dimethyl sulfoxide (DMSO), all of HPLC grade (VWR Chemicals, Radnor, PA, USA); formic acid (FA) of high purity grade (VWR); and hydrochloric acid (HCl) and Na2EDTA both from laboratory stocks. Trifluoroacetic acid (TFA) of ReagentPlus purity (99%) was obtained from Sigma-Aldrich. Dye colorant reference compounds were obtained commercially from a variety of sources. The xanthopurpurin standard was synthesized by T. Friebe and S. Augustin, EMU Chemistry Department.
2.2. Methods: Ambient Ionization Mass Spectrometry
2.2.1. DART-MS
A short section (approximately 1 mm) from the end of each yarn sample was cut off using a clean razor blade on a clean glass microscope slide. The resulting loose fibers were divided roughly in half for analysis, with each clump of fibers collected in the tip of cleaned tweezers. The fibers were then introduced into the gap between the DART ionization source (IonSense, Saugus, MA, USA) and Orifice 1 of the AccuTOF mass spectrometer (JEOL USA, Peabody, MA, USA). The helium DART gas was heated to 350–450 °C as needed to obtain good signal-to-noise ratios, and spectra were collected in both positive and negative ion modes using the default grid voltages in the DART controller software. The “peaks voltage” on the AccuTOF was selected for maximum intensity in the range of interest (150–1000 Da), while the ring lens and Orifice 2 voltages were set to ±5 V, depending on whether the spectra were being collected in positive (+) or negative (−) ion modes. Orifice 1 was set to ±30 V (again corresponding to the ionization mode) to minimize fragmentation. One half of the sample was analyzed directly without any preparation, and the second half was treated with approximately 1 µL of formic acid (88%) prior to introduction into the DART ion source gap. Previous studies have shown that acid treatment yields a stronger signal for most dye colorants during DART-MS analysis [25,31].
2.2.2. Paper Spray MS
Paper spray mass spectrometry (PS-MS) was carried out using a home-built ion source consisting of an alligator clip and filter paper (Whatman No. 4, from laboratory stocks) electrode that was powered by the AccuTOF electrospray port. For the PS-MS, +3500 V was applied to the paper electrode, with the Orifice 1 and ring lens voltages set to +80 V and +10 V, respectively. The tip of the paper electrode was positioned in front of Orifice 1 on the AccuTOF. A 3 μL aliquot of the extract was placed on the paper electrode for analysis. PS-MS was chosen for analysis as the electrospray ionization source available in the EMU Chemistry Department required large volumes (20–50 µL) of sample.
Calibration of each data file collected on the AccuTOF from both DART and PS-MS was carried out with PEG-600 in methanol, and files were processed using TSS Pro 3.0 software (Shrader Analytical and Consulting Laboratories, Detroit, MI, USA). Further data analysis was undertaken with Mass Mountaineer software (various versions, RBC Software, provided by R. B. Cody).
2.3. Methods: HPLC-DAD
2.3.1. Sample Preparation (HPLC and PS-MS)
Indigoids in the blue and purple samples were initially extracted following an adaptation of the procedure [15] used by Degano and Colombini. Roughly 1–2 mm of yarn was treated with 50 μL of dimethylsufoxide (DMSO) at 60 °C for 60 min in a sonicator bath, resulting in Solution I. Originally, the anthraquinone colorants were extracted from red yarns using a 1:1 (v/v) mixture of dimethylformamide (DMF) with 0.1% Na2EDTA in water, as reported elsewhere [32]. This mixture purportedly preserves the glycosides and results in a more accurate representation of all the compounds present in a dyed yarn. A 50 μL portion of the EDTA/DMF solution was added to a similar size fragment of yarn in a microcentrifuge tube, which was then sonicated at 60 °C for 60 min to yield Solution II.
A third protocol [33] was later determined to be more reliable, wherein yarn fragments were extracted with 50–100 μL of 30:1 (v/v) methanol:HCl solution, hereafter referred to as Solution III. Fibers were then sonicated for 60 min at room temperature to assist extraction. While the EDTA/DMF extractant did likely preserve the glycosides, the chromatograms for the textile yarns were of low quality, possibly due to a problem with the detector controller board that was identified after a portion of the analyses were completed. As the project spanned several years and numerous operators, the methanol/HCl extract was selected as it appeared to be more reliable for the identification of the characteristic colorants in these samples by HPLC and PS-MS.
2.3.2. HPLC Methods
The HPLC system consisted of a Shimadzu (Kyoto, Japan) LC-20AT pump paired with an SPD-M20A photodiode array detector. The flow rate was 1 mL/min and a 20 μL injection volume was used for each of the methods employed. In the method used initially for indigoids, separations were conducted at controlled temperature (25 °C using a heating tape plugged into a variable AC source, monitored with a thermocouple) on an ACE Equivalence 5 C18 150 × 4.6 mm analytical column (VWR, Radnor, PA, USA) attached to a C18 guard column. The analytical column used for separation of Solution III preparations was a Discovery C18 column from Supelco (Bellefonte, PA, USA, 25 cm × 4.6 mm and 5 μm particle size) without temperature control. For the indigoid method, deionized water (solvent A) and acetonitrile (ACN, HPLC grade from Sigma-Aldrich, St. Louis, MO, USA, as solvent B), each at 0.1% (v/v) TFA served as mobile phases. The program for separation of the indigoids was 15% B for 5 min, followed by a linear gradient to 50% B in 25 min, then to 70% B in 10 min, followed by 90% B in 10 min held for 10 min (total run time 60 min); re-equilibration time was 15 min. For the Solution III preparations in methanol/HCl (after Manhita et al. [32]), the mobile phase consisted of acetonitrile (A) and 2.5% (v/v) aqueous acetonitrile with 0.5% (v/v) formic acid (B) in a gradient of 0–100% A from 0–10 min, 100% A from 10–15 min and a 5-minute rinse of 100% solvent B between runs. UV-vis spectra were acquired in the range of 200–650 nm with a resolution of 4 nm. Data were processed using Shimadzu LabSolutions software.
2.4. Methods: Microscopy and Fourier-Transform Infrared Spectroscopy
Each of the ancient samples was visually inspected and photographed under magnification (10×–200×) using a Dino-Lite AM4815ZT digital microscope. The samples from the Lambayeque textile were further examined using scanning electron microscopy with energy dispersive spectroscopy thanks to the short-term loan of a JEOL (JEOL USA, Peabody, MA, USA) JCM-7000 NeoScope benchtop instrument, used in our curriculum-based undergraduate research experience (CURE) in September 2019. SEM images were collected under high-vacuum conditions with a landing voltage of 10.0 kV at a working distance of approximately 12 mm. Animal hair—presumably camelid wool—was identified on the basis of visible scales and the presence of S and N, while cellulose—presumably cotton—was identified based on visible morphological features including convolutions similar to other cotton species and a marked lack of nodal structures, along with a lack of significant S and N signals.
When SEM-EDS was not available and fibers were not readily identifiable visually by optical microscopy, fibers were characterized using attenuated total reflectance Fourier-transform infrared spectroscopy. Measurements were obtained using a Pike Technologies (Madison, WI, USA) MIRacle ATR attachment with a ZnSe crystal in a Shimadzu IRTracer spectrometer (Shimadzu Corp, Kyoto, Japan). Spectra were collected by averaging 32 scans at a resolution of 4 cm−1 over the range of 4000–600 cm−1. The presence of the amide I and II bands around 1600 and 1500 cm−1, respectively, were considered characteristic of animal hair protein. Absorbance bands at 1020 cm−1 combined with the presence of an –OH stretching band around 3300 cm−1 were indicative of cellulose.
3. Results
The purpose of this study was twofold. First, we sought to identify the colorants present in the yarn samples from the ancient Peruvian textiles to add to the existing body of knowledge about the dyes used over the time periods described above, ideally to determine the relationships between the primary and secondary colors. Second, we applied ambient ionization mass spectrometry methods for these identifications, specifically to compare this approach to HPLC with diode array detection, which is the most commonly reported means of identifying dyes in archaeological and historical textiles. The two approaches differ significantly in how much material is needed for analysis, how many colorants can be detected and identified, and the length of time needed to complete the analysis. The results from the analyses of the ancient Peruvian textiles are summarized in Table 3 for the samples from the collections of the Michael C. Carlos Museum and in Table 4 for the Paracas samples from the MNAAHP. Results of the analyses of the Peruvian dyes reference collection are presented in Table 5. Complete results, including those for the fiber identifications, are found in Supplementary Tables S1 and S2.
Table 3.
Results for MCCM textile samples. Details in Supplementary Table S1.
Table 4.
Results of the analysis of the dyes in the Paracas Necropolis samples from Museo Nacional de Arqueología, Antropología, e Historia del Perú (MNAAHP), Lima, Peru. Details in Supplementary Table S2.
Table 5.
Results of analysis of reference samples from the Antúnez de Mayolo Peruvian dye plant collection.
3.1. Primary Colors
3.1.1. Blue
Indigo, derived from Indigofera species, including I. suffructosa and I. truxillensis, Cybistax antisyphilitica, or other such species native to South America, are the most likely sources of the blue colorants indigotin and indirubin in all of the investigated samples, which is consistent with previous studies of pre-Columbian Andean textiles [6,7,8,14,15,17,18]. DART-MS cannot differentiate between these two isomers, and the result is a single peak at m/z 262.07 for the M- ion in negative ion mode. DART-MS is extremely sensitive to indigoids, and this peak (or the MH+ in positive ion mode at m/z 263.08 [34]) often dominates the spectra of the samples in which it is present. Due to solubility issues, the signal is quite variable in paper spray mass spectra, making this approach less than ideal for identification of indigoids. Only HPLC-DAD was able to separate the isomers and clearly identify each of them based on their different UV-visible spectra. While the ratio of indigotin to indirubin has been suggested to be indicative of the dyeing process or even the altitude at which the dyes were prepared due to the lower concentration of atmospheric oxygen content at high altitudes [14], the peak areas for the isomers are variable depending on the wavelength used for integration. Further, we observed that the dark blue Lambayeque sample extracted into dimethyl sulfoxide (one of the few solvents in which indigoids are readily soluble) changed color from blue to reddish-purple during a delay between preparation and HPLC analysis, indicating some shift from indigotin to indirubin in solution. Indeed, HPLC analysis of this sample showed only indirubin, while a re-extracted sample showed both isomers in a ratio indicating more of the indigotin and less indirubin, as expected for the dark blue solution. Based on these observations, the ratio of the isomers should not be interpreted as particularly meaningful. Both the DMSO and methanol/HCl extractants were appropriate for the HPLC analyses of the indigoids. Example chromatograms, UV-vis spectra, and mass spectra for a blue sample are shown in Supplementary Figure S15.
3.1.2. Reds
The source of red dyes in ancient South American textiles has long been of interest [2,24,27,35,36] and, as such, has been widely studied. Plant reds consistent with those derived from the roots of Relbunium or Galium species were used throughout the Paracas and Nazca periods, as indicated by the presence of purpurin and other related anthraquinones. Carminic acid from cochineal insects (Dactylopius coccus) appears later, specifically in the Wari and Lambayeque textile fragments. Samples from the discontinuous warp and weft textiles attributed to the Wari period showed no evidence of cochineal, only anthraquinone compounds characteristic of the plant reds. This may be due to the difference in preparation of these textiles, where tie- and over-dyeing were used to create the unique patterns of “white” undyed fabric with primary and secondary color designs. The other red yarns from the Wari tapestry weave textiles were prepared with cochineal, as indicated by the presence of carminic acid in those samples. While the Chancay would have had access to cochineal, the reddish-brown yarn from the weaver’s basket was clearly dyed with a plant red consistent with a Relbunium or Galium. Example chromatograms, UV-vis and mass spectra for a Relbunium red sample are shown in Supplementary Figure S16. Chromatograms and mass spectra for red yarns from the Antúnez de Mayolo Peruvian dye plant collection reference samples are part of another manuscript in preparation with Degano et al. at the University of Pisa. Detailed results are shown in Supplementary Tables S1 and S2.
Of the anthraquinone aglycones present in the plant reds, purpurin was the major component by HPLC. A peak at m/z 239.04 in the negative ion DART mass spectra may be indicative of either xanthopurpurin or alizarin, both dihydroxyanthraquinones differing only in the position of the –OH groups: xanthopurpurin is 1,3-dihydroxyanthraqui-none, while alizarin is 1,2-dihydroxyanthraquinone. Both give nearly identical UV-vis spectra, and under the conditions used for the majority of the HPLC analyses, both also give identical retention times as determined from multiple analyses of standards; the synthesized xanthopurpurin used as a standard may have contained trace impurities. Under collision-induced dissociation conditions (with the AccuTOF Orifice 1 set to 90 V), reference samples of alizarin and xanthopurpurin yielded different mass spectra consistent with what has been reported [24,37]. However, under these conditions, dyed yarn samples yield complex spectra that do not clearly differentiate between these compounds. Dutra Moresi [38] carried out significant work to characterize the anthraquinones found in various species of Relbunium, finding that they contain no alizarin, as determined by HPLC. Negative ion DART mass spectra of reference dyeings prepared from three Relbunium species and Galium antuneziae [39,40] from Peru showed no consistent differences in the distribution of the characteristic anthraquinone compounds, as indicated in Table 5. Differences that have been attributed to different species may actually be due to differences in dye preparation conditions such as temperature, age of the roots, pH, and mordants. Further complicating the situation is the fluidity of the classification of these plants at the genus level [39,41]. Thus, we have not attempted to differentiate the plant reds and consider all to be “Relbunium” for simplicity, though further studies are warranted.
Carminic acid and other glycosides are not well identified with DART-MS [9,25], likely because they cannot be desorbed from the fibers solely by heat. For red samples that do not show the characteristic peaks for the plant red anthraquinones (purpurin, rubiadin, etc.) by DART-MS, we followed up with paper spray MS on the extracted solution used for HPLC analysis. Carminic acid readily ionizes by this method, as do the other glycosides characteristic of cochineal. HPLC of the same extracts showed primarily carminic acid; the other glycosides were either not detected or not identified, as no standards were available for comparison. Example chromatograms, UV-vis spectra, and mass spectra for a cochineal red sample are shown in Supplementary Figure S17.
3.1.3. Yellows
The two yellow samples from the Paracas mummy fragments showed all of the hydroxybenzoic acid compounds that Zhang et al. [5] describe as characteristic of degradation products of the flavonoids quercetin, isorhamnetin, and kaempferol. While signals at m/z values consistent with the presence of a number of different flavonoids were observed in the Cave #5 mummy sample (Table 4), none were consistent across the various mass spectrometry methods, and none were unambiguously identifiable by HPLC. While two of the peaks in the HPLC had retention times consistent with the benzoisoquinoline alkaloids of Bocconia, their signal intensities were too low to yield a good spectral match. As the positive ion DART-MS did not show any signal for sanguinarine or chelerythrine, the most likely source of the yellow color is a degraded flavonoid. The gold sample from the loose threads associated with the turban in bundle 382-54 (02846) appears to be most similar to a degraded yellow obtained from Bidens or another Asteraceae, as indicated by signals at m/z values consistent with okanin ([M-H]− at m/z 287.06) and butein ([M-H]− at m/z 271.06) by negative ion DART-MS. For the reference samples, only those of Asteraceae (e.g., Bidens, Coreopsis, Dahlia) showed significant signals at these m/z values. This was confirmed by the HPLC results, which showed significant overlap in the pattern of compounds absorbing at 375 nm in the Bidens andicola sample from the Peruvian dye reference materials, as shown in Figure 1. Reference standards of butein and okanin were used to confirm the identities of the peaks at 7.7 min and 8.6 min, respectively.
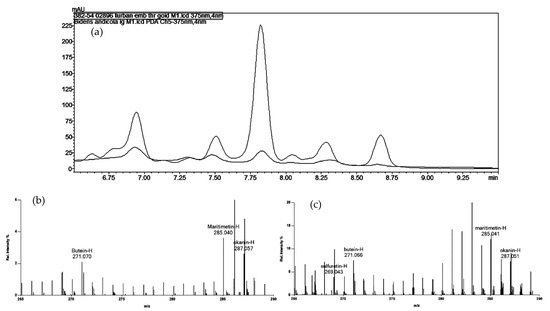
Figure 1.
(a) Chromatograms (at 375 nm) for the gold embroidery thread from Paracas turban 382-54 02896 (black) and the reference sample of Bidens andicola (gray). The peak at 7.8 min was identified with a standard as okanin, and the peak at 8.6 min is consistent with butein (see Supplementary Figure S18 for spectra). (b,c) DART mass spectra for a few fibers of yarn from the same sample (b) and the reference sample of Bidens andicola (c), both treated with formic acid prior to introduction into the ion source. The spectra clearly show [M-H]− ions consistent with those of butein, okanin, and another aglycone, maritimetin. Sulfuretin is also present in the reference dye sample.
Zhang et al. [5] described the difficulties of identifying chalcone colorants and how they may have been missed in earlier analyses where strong acid extraction protocols were used for HPLC analyses. Comparison of methods where the sample preparation differs is difficult at best. The DART mass spectra for the yellow dyes in the Wari textile samples from the Carlos collections showed primarily the degradation products of flavonoid yellows and little or nothing else. The HPLC results, in some cases, showed peaks at retention times different from that of luteolin, yet with markedly similar spectra, as was described by Wouters and Rosario-Chirinos in their extensive study of ancient Peruvian textile dyes [6]. The yellows from the Wari discontinuous warp and weft textiles were not consistent within the textiles, either due to variations in how they were prepared, degradation, or limitations of the methods to detect such low concentrations of chromophores. It is likely that pale undyed fibers were used to achieve the pale or off-white color observed. This seems to be the case for the cream, white, and beige samples from the one Lambayeque textile investigated, as well, which showed only traces of the hydroxybenzoic acids, some contamination from carminic acid, and no compounds specific to yellow colorants.
3.2. Secondary Colors
Because secondary colors were of the most interest when the initial sampling of the textiles was undertaken, the majority of the results fall into this category. Example chromatograms, UV-vis spectra, and mass spectra for the secondary colors purple, green, and orange are shown in Supplementary Figures S19–S21.
3.2.1. Purple
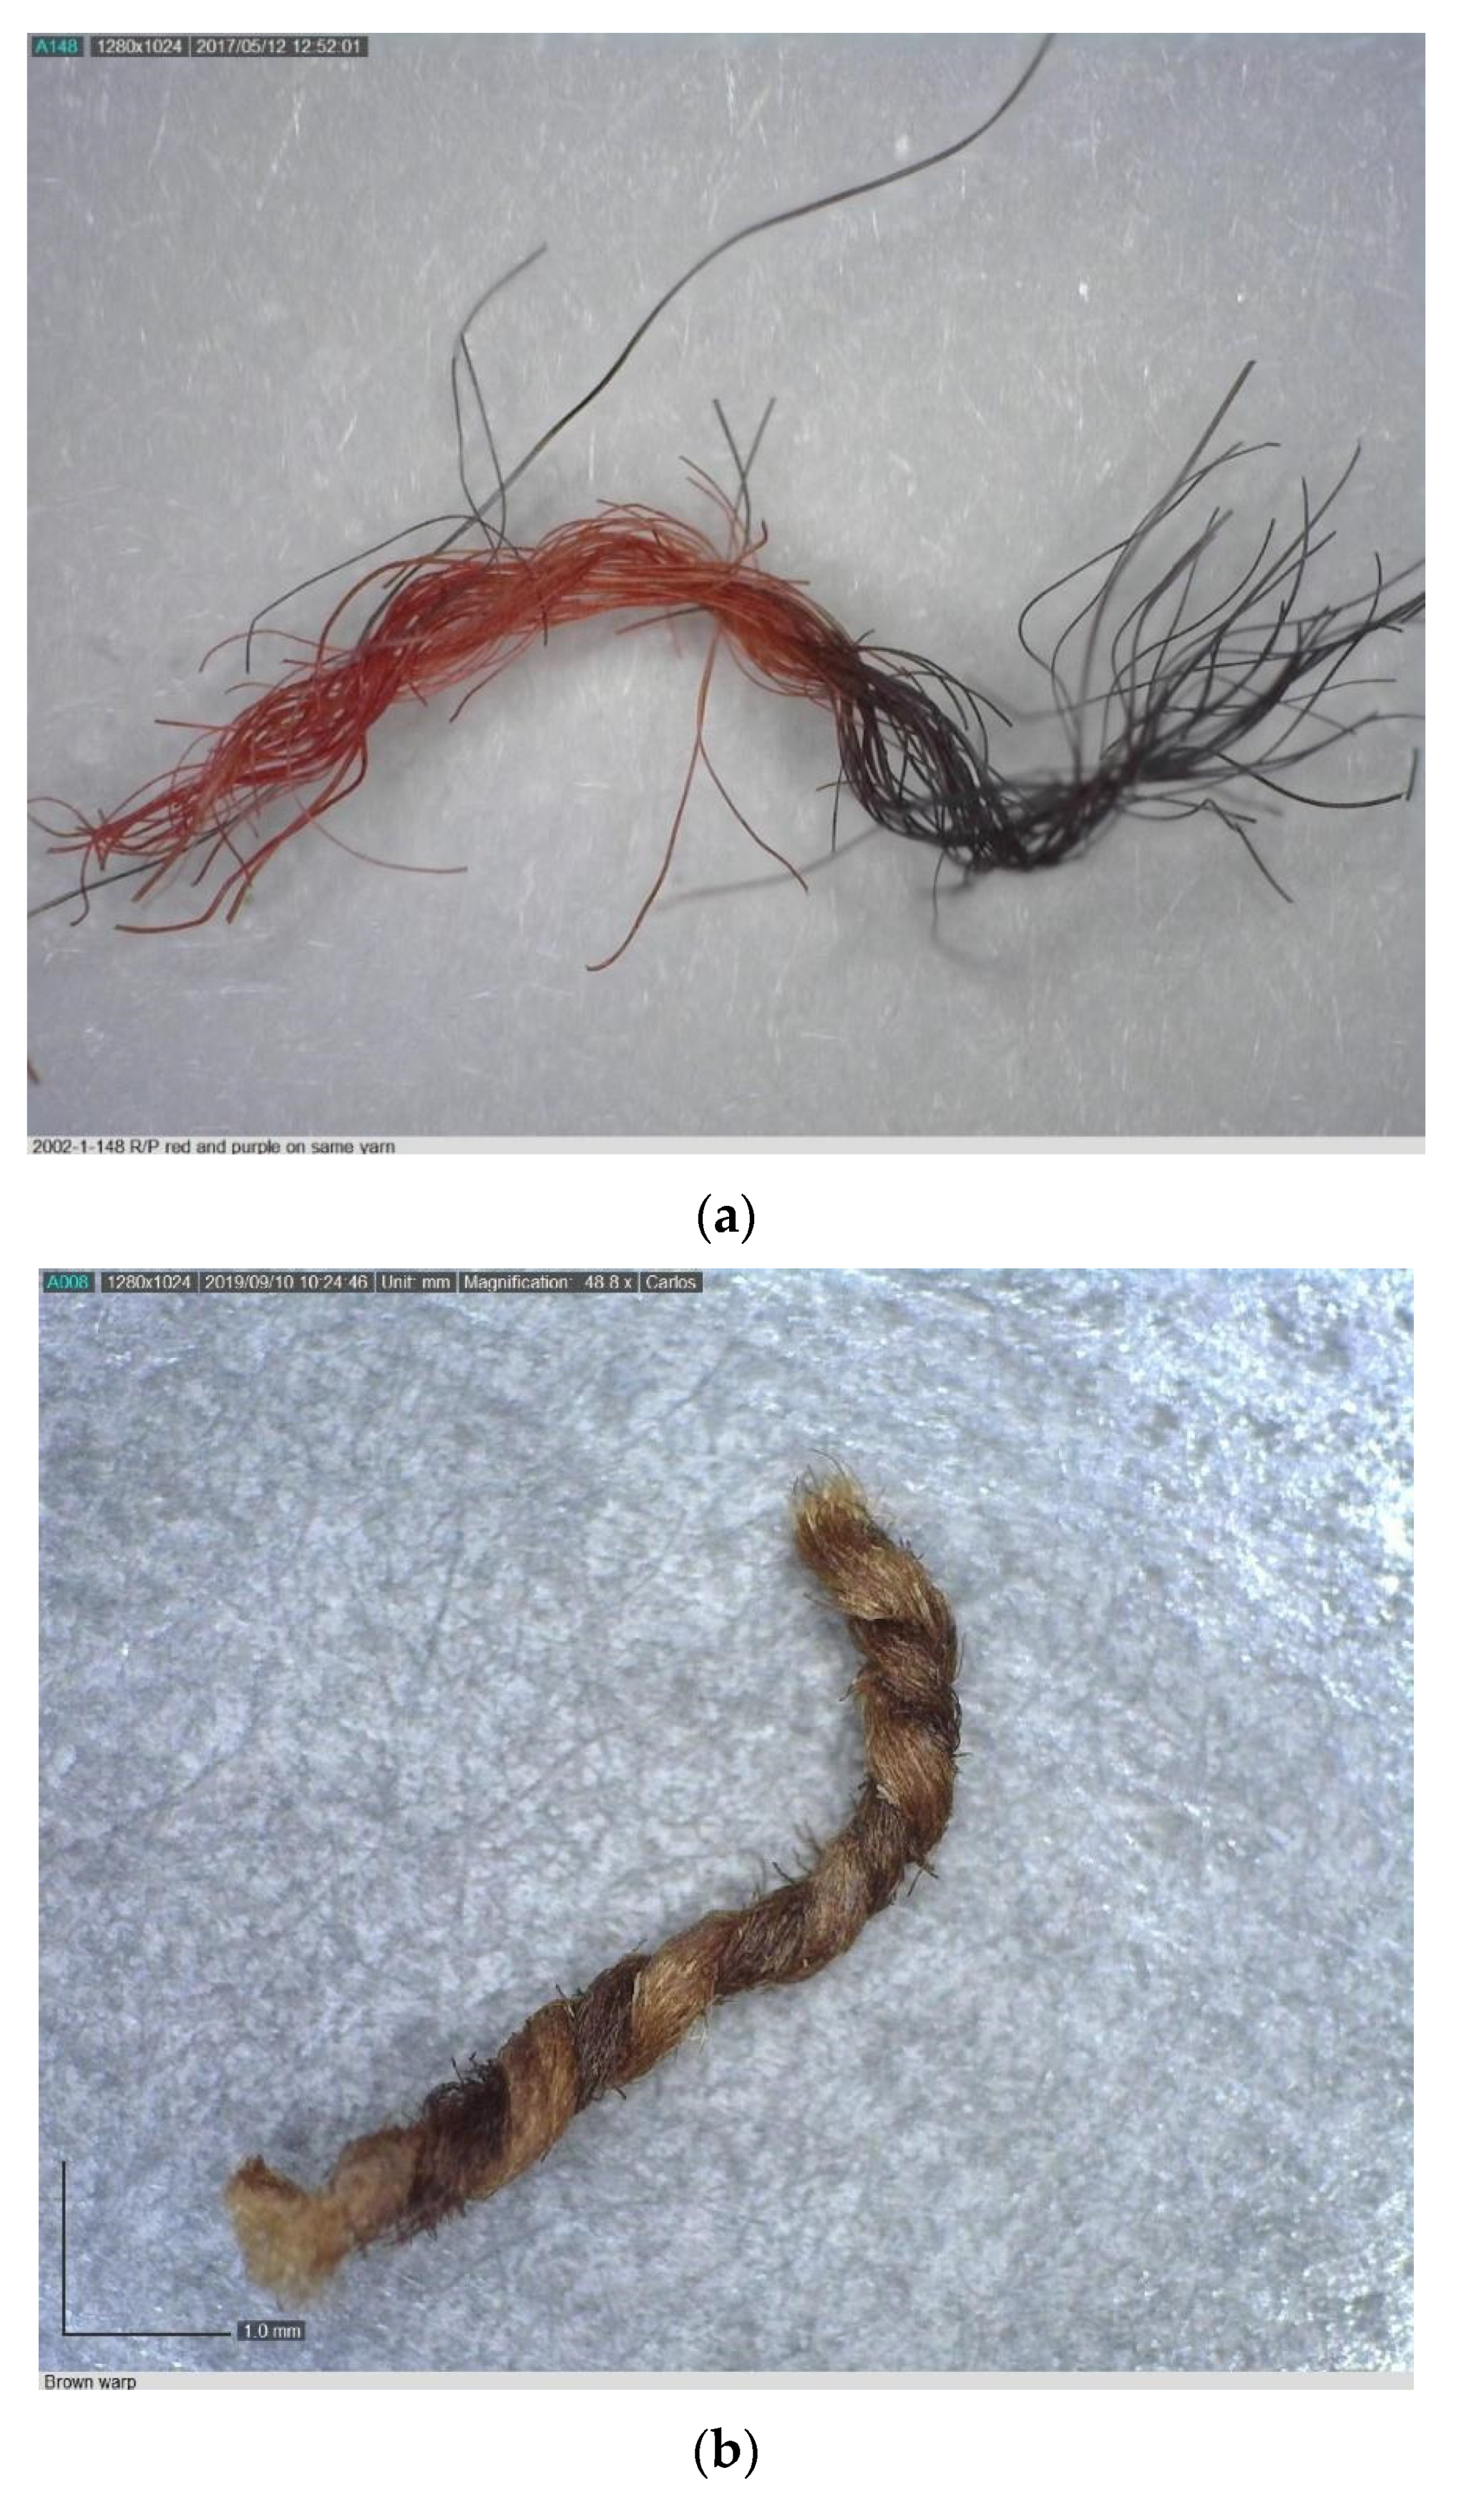
All the purple samples contained indigoids, likely obtained by applying the indigo vat process to yarns (or textiles) previously dyed red; this is definitely the case for the tie-dyed discontinuous warp and weft Wari textiles, as indicated by one yarn sample that was red on one end and purple on the other (Figure 2a). The purple sample from the frayed Wari band (2003.40.5) was the only one containing both indigo and cochineal, as shown by the presence of carminic acid that was detected by both PS-MS and by HPLC. All of the other purples, from the Paracas mummies to the Nazca cross-knit looped border fragments, contained plant reds consistent with Relbunium. Interestingly, this also included the Wari discontinuous warp and weft textiles with tie-dye patterning. While cochineal was available to the Wari and widely used in other textiles, perhaps the unique construction and preparation of these textiles precluded its use for some reason. No evidence of brominated indigoids obtained from shellfish were observed in any of the chromatographic or mass spectrometric results, save for a single analysis early on that indicated a trace of dibromoindigo by positive ion DART-MS, which could not be reproduced. Wallert and Boytner [8] also noted the surprising absence of dibromoindigo in purple samples from the south coast of Peru, near the source of the shellfish from which the dye is obtained. Saltzman [2], however, believed that shellfish purple was utilized in the preparation of Andean textiles; the use of these purples was confirmed by studies carried out by Michel et al. [18], showing brominated indigoids attributed to the use of Concholepus concholepus.
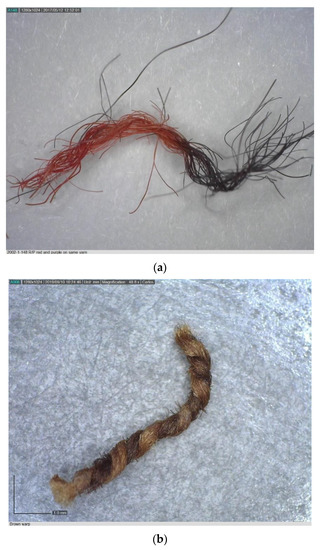
Figure 2.
Examples of some of the yarn samples collected for analysis. (a) Red and purple yarn from MCCM 2002.1.148, a discontinuous warp and weft textile, showing evidence of overdyeing to achieve the purple color. (b) Brown warp yarn from MCCM 2004.64.1 from the Lambayeque textile, showing plying of two shades of brown cotton yarn.
3.2.2. Green
As expected, the green samples appear to be indigo overdyed onto yellow—either dyed or naturally yellowish—yarns. Indigotin (and usually indirubin, depending on the sample) was observed in the chromatographic profiles of all the green yarns, and was detected as the M- ion (formed by direct Penning ionization) as well as the [M-H]− ion at m/z 262.08 and 261.07, respectively, in negative ion mode by DART-MS. Indigo was detected in all the green samples, as well, both by DART-MS and by HPLC. Separation of the indigoid isomers by HPLC showed that indirubin was a minor component, and in several cases, was not detected. Thus, the peak at m/z 262.08 in the negative ion DART spectra can be attributed primarily to indigotin, the major constituent. The yellow components in the green yarns were, as with the yellow yarns, difficult to interpret. The Paracas sample of mantle threads from 382-10 05904 indicated a luteolin-based dye by both direct mass spectrometry and by HPLC. Unfortunately, it did not directly correlate with any of the yellow reference dyes. The Paracas poncho ground cloth yarns from 382-68 02929 indicated a different source of yellow lacking evidence of luteolin, with a unique chromatogram. The DART mass spectra (negative ion mode) also did not indicate the presence of any luteolin, but peaks at m/z 343.07 and 373.09 correlate to the [M-H]− ions of eupatorin or of cirsilineol and gardenin D, respectively. The corresponding MH+ ions were observed in the positive ion PS mass spectra of this sample, as well. With no reference standards for these compounds, their presence could account for the unique chromatographic profile observed. According to Cardon [10], these compounds are found in some species of Baccharis, though the lack of luteolin, also expected in dyes prepared from Baccharis, complicates the identification.
The Nazca samples were all extremely small, as they were obtained from intact objects. Only negative ion DART-MS and HPLC analyses were performed on the green samples, showing little in addition to indigo. Luteolin and its methyl ether were observed in two of the samples, the snake band and the hummingbird border, by DART-MS. Luteolin-like components, differing significantly in retention time from luteolin and luteolin methyl ether standards, were observed by HPLC. The snake band sample also showed traces (less than 1% relative abundance) of the same ions observed in the green Paracas poncho ground cloth. A tentative identification of Baccharis seems probable for this Nazca sample. The yellow component in the green yarn from the anthropomorphic human “bean people” border was significantly different from the other two Nazca samples and may be completely oxidized.
Similarly, the green samples from the Wari and Lambayeque textiles showed no significant evidence of yellow dyes. Only the yellow-green sample from the frayed Wari band (2003.40.5) showed evidence of quercetin and kaempferol by HPLC; neither was detected by negative ion DART-MS. Both of these compounds have been proposed to oxidize to form the hydroxybenzoic acids described by Zhang et al. [5], all of which were found in the Wari and Lambayeque green samples based on the presence of molecular ions of the same mass in the negative ion DART mass spectra. The most likely explanation is that the yellow component of the greens in these textiles has decomposed over time. As the objects sampled at the Carlos Museum textiles came from collectors, it is reasonable to presume that the objects were displayed and may have experienced at least some light exposure, leading to photo-oxidation. It is also possible that the green coloration was obtained by applying indigo to naturally yellowish or buff-colored yarns, which may themselves contain these hydroxybenzoic acids. Further studies on naturally colored wools are needed.
3.2.3. Orange
The orange yarn from the Lambayeque textile and the salmon fibers from the Wari tunic contained carminic acid. All of the other orange samples had components characteristic of plant reds from Relbunium in both the negative ion DART mass spectra and by the presence of purpurin in the chromatograms. Of the Paracas samples investigated, only the orange ground cloth from the skirt in 382-49 (23808) 03174 showed sufficient evidence to suggest that Bidens may be the source of the yellow, based on the negative ion DART mass spectra showing a small peak at m/z 287.06, consistent with the [M-H]− ion of okanin. Confirmation with HPLC was not possible due to the low signal intensity. The yellow component in the only orange sample from the Nazca textiles is likely to be oxidized, as was the case with the green.
The salmon and orange fibers from the Wari tapestry tunic differed in their source of red dye, with the former being carminic acid and the latter consistent with Relbunium plant red. Neither showed any evidence of yellow dyes. Mordants or the dyeing process (e.g., temperature, pH, etc.) may account for the different shades of color observed without the addition of a yellow dye. The HPLC of the Lambayeque orange yarn showed primarily carminic acid but little evidence for yellow dyes. The negative ion DART-MS showed a peak at m/z 301.05, consistent with a number of possible flavonoids, along with the decomposition products expected for flavonols. PS-MS failed to detect carminic acid in this sample.
3.2.4. Browns
Brown yarns may be naturally colored fibers in shades of brown, or they may have been dyed with tannins, which are difficult to identify and can be sourced from a variety of different plants. Indeed, the brown yarn from the Wari tapestry weave tunic appears to be undyed, as none of the methods showed any evidence of dye chromophores. The brown fragments from the Paracas textile 421-132 02096, on the other hand, have a composition similar to that of the gold sample from 382-54 02846 described above and consistent with the reference samples of Bidens andicola. The presence of both butein and okanin, identified by their [M-H]− ions in negative ion DART, could not be confirmed by HPLC due to the low signal intensity; monitoring the chromatogram at 375 nm, a trace of butein may be present at 7.7 min, as shown in Supplementary Figure S22.
Both the brown warp yarn (consisting of two plies, one dyed brown and one possibly natural, Figure 2b) and the golden brown yarn from the Lambayeque textile had a peak in the HPLC at 7.4 min with a UV-vis spectrum consistent with that of one of the laccaic acids found in Kerria lacca, which is native to Asia and not found in South America (Figure 3). None of the laccaic acids were detected in the paper spray mass spectra of the extracts from these yarns, though peaks at m/z 331.05 and 353.04, consistent with the MH+ and [M+Na]+ ions for kermesic acid, were observed in the PS mass spectra of the EDTA/DMF extracts of both of these samples, though no carminic acid was present. Degano and Colombini [15] observed laccaic acids in red yarn from the belt of a child mummy from the transitional period between the Wari and Chancay cultures, overlapping the time period of the Lambayeque, as well. These findings further emphasize the importance of developing a database of known reference dyes available to the textile artists of ancient Peru.
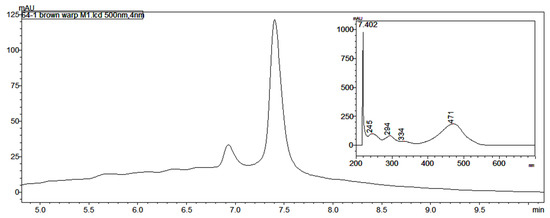
Figure 3.
Unusual chromatogram (at 500 nm) and UV-vis spectrum (inset) for peak at 7.402 min in the brown warp yarn (MCCM 2002.64.1) shown in Figure 2b.
4. Discussion
These results demonstrate the successful identification of many of the dyes present in samples from pre-Columbian Peruvian textiles spanning more than two millennia. This interpretation is complicated by deterioration, the use of undyed naturally colored fibers, similarity among the wide variety of plant sources, dyeing processes, and deterioration over time. The results presented above show the difficulty of positively identifying yellow colorants due to their tendency to decompose, the many possible sources from which they can be obtained, and the overlap in compositions between many of the plant sources. These challenges affect the secondary colors, as well. If yellow colorants are not identified in an orange or green sample, it is impossible to determine if yellow colorants were present to begin with, if some other method of achieving those colors was utilized, or if a naturally yellow-colored fiber was used. Mordants, dye bath temperatures, and fermentation conditions can each affect the final color obtained from various dye plants, perhaps enabling some secondary colors to be obtained without combining dyes.
This work also compares the results obtained by ambient ionization mass spectrometry with results from high-performance liquid chromatography. We consider how much sample is needed for analysis, how sensitive and selective the methods are for the dye components, and performance characteristics such as the time required for analysis and the operator skill necessary to carry out both the analyses and data interpretation. Each of the methods has capabilities and limitations that make using them together the best choice for cases where LC-MS/MS is not available, as is the case here at EMU and many other laboratories. Ideally, dyes would be identified completely non-invasively; fiber optic reflectance spectroscopy (FORS) and surface-enhanced Raman spectroscopy have been shown to be useful for some dyes, particularly the reds [20,21,42]. However, these techniques are not yet as widely available and used as are HPLC and MS. The lower limits of detection for the colorant compounds are critical for their identification by any analytical technique and are dependent upon the amounts of sample used for analyses and, more critically, how that sample is prepared for analysis.
To roughly compare the limits of detection of the ambient ionization mass spectrometry methods and HPLC-DAD, solutions of four of the colorant compounds characteristic of the dyes identified were prepared in methanol and diluted to concentrations of 1 and 10 parts per million (ppm). These compounds included luteolin, okanin, purpurin, and carminic acid. Each solution was run by DART-MS (or paper spray MS in the case of carminic acid) and by HPLC, with the chromatogram monitored at an appropriate wavelength for each compound: 350 nm for luteolin, 380 nm for okanin, 480 nm for purpurin, and 500 nm for carminic acid. Of the 1 ppm solutions, only luteolin was reliably identified with HPLC using both retention time and UV-vis spectrum; all the rest were easily detected in the 10 ppm solutions at the appropriate wavelengths.
By DART-MS, both luteolin and purpurin were readily detected in the 1 ppm solutions applied on the closed end of a capillary melting point tube, while okanin gave a large even-electron molecular ion signal at 10 ppm, placing the LOD for okanin in solution by DART-MS somewhere between 1 and 10 ppm. Interestingly, carminic acid was not detected in positive ion mode with PS-MS at either concentration, likely due to the lack of Na+ ions to aid in adduct formation. This may explain why this compound was not identified in the orange-colored fibers from the Lambayeque textile (2004.1.64). The use of negative ion mode would likely remedy this problem. It is important to consider how little of the chromophore can be differentiated from background by the method of choice for small and limited samples. Further, the sample preparation method—except in the case of DART-MS, where none is necessary—strongly affects both the quantity and quality of the data obtained, with different combinations of organic solvents, chelating agents such as EDTA, and acids (formic, oxalic, HCl, etc.) yielding different results even for the same samples. Acid strength can cause changes in the overall profile of the dye as glycosidic linkages are broken to yield aglycone components [32,43], and some dye components including the chalcones are decomposed by strong acids. Solubility, particularly for indigoids, further affects how much dye is in the solution being analyzed. How the extraction solvent(s) disrupt the binding of mordant metal ions also influences the results.
DART-MS, in particular, is affected by the presence of certain mordants and how the mordant and dye bind to either cellulose or proteinaceous fibers, at least for some dyes such as logwood [39] with transition metal mordants such as Fe, Sn, and Cu. A recent study of mordants in Paracas textiles with X-ray fluorescence spectroscopy [7] showed that Fe and Cu may indeed have been used as mordants in Paracas textiles, which would likely influence the signal intensity observed in the DART-MS results. The binding of dye colorants with cotton fibers appears to be quite strong, as DART-MS spectra show reliably stronger signals from dyes applied to wool and other animal hair yarn compared to those dyed on cotton [25,31]. Nearly all of the fibers investigated herein were camelid wool; two of the Paracas samples, three of the Chancay yarn balls, and three samples, including both warp threads from the Lambayeque textile, were cotton, as identified visually with optical and/or scanning electron microscopy or with attenuated total reflectance Fourier-transform infrared spectroscopy (ATR-FTIR). Two of the Paracas samples yielded FTIR spectra consistent with the presence of both cellulose and protein, which is consistent with previous reports of some of the yarns containing a mixture of fibers [27,44].
The primary advantage of ambient ionization mass spectrometry methods is the ability to characterize molecules with little or no sample preparation and very short analysis times on the order of a few seconds. However, collecting data is not the same as interpreting data, and making sense of the results takes expertise and, ideally, another method such as HPLC-DAD for confirmation. Knowing what does and does not ionize by DART-MS (e.g., glycosides such as carminic acid) and under what conditions (e.g., benzoisoquinoline alkaloids such as sanguinarine forming ions in positive mode, but not in negative) requires analysis of known materials such as the database of Peruvian plant dyes, as in this case. Comparing ambient ionization mass spectrometry results directly, even with multivariate analysis, may provide more insight into dye sources that would be difficult or even impossible otherwise. The application of these methods to art and archaeological materials is in its infancy, and much work remains.
5. Conclusions
Here, we have shown the characterization of the dyes present in both the primary and secondary colors found in ancient Peruvian textiles from multiple cultural periods over a span of nearly 1800 years, including the Paracas Necropolis, the Nazca, the Wari, the Chancay, and the Lambayeque. The dyes were identified by both direct analysis in real time time-of-flight mass spectrometry (DART-MS) and paper spray MS, and these results were compared to ones obtained from extraction and separation with high-performance liquid chromatography (HPLC) with ultraviolet-visible diode array detection (DAD). The ambient ionization MS methods were simple and fast: DART-MS required no sample preparation at all, and paper spray results were obtained in a few seconds of analysis time once the samples were extracted into an appropriate solvent system (30:1 methanol:HCl). In general, the ambient ionization MS results compared well with the more traditional HPLC-DAD analyses, which provided the advantage of separation and identification of isomeric species (e.g., indigotin and indirubin). Analysis with DART-MS yielded the general classes of dyes, either through rapid identification of marker compounds (e.g., indigotin/indirubin, purpurin, luteolin, etc.) or the marked absence of such (as was the case with carminic acid). Many of the possible yellow dyes have overlapping compositions, making their identification difficult regardless of analytical approach. Oxidative decomposition, either due to age or light exposure, further complicates the conclusive identification of yellow dyes in the Peruvian textiles. Chalcone biomarkers characteristic of Bidens were observed in some of the samples by use of DART-MS; these findings were confirmed with HPLC-DAD. The speed and simplicity of ambient ionization mass spectrometry holds significant promise for the identification of textile dyes using only small samples, though much work remains to understand the breadth and depth of possible sources of dyes available to the artisans of the ancient Andes.
Supplementary Materials
The Supplementary Tables and Figures are available online at www.mdpi.com/article/10.3390/heritage4030091/s1. Figure S1, (a) Tapestry fragment with fish and snake designs (MCCM accession number 2002.1.100), made of camelid fiber; attributed to the Nazca, Early Intermediate Period. (b–d) Samples from (a). Figure S2, (a) Mantle fragment with crossloopknit stitched embroidered border of hummingbird motifs (MCCM accession number 2002.1.3), made of camelid fiber; attributed to the Nazca, Early Intermediate Period. (b–d) Samples from (a). Figure S3, (a) Fragments of a mantle border (MCCM accession number 2002.40.4 A-C), made of camelid fiber; attributed to the Nazca, Early Intermediate Period. (b–c) Samples from (a). Figure S4, (a) Tie-dye textile fragment (MCCM accession number 2002.1.148), made of camelid and cotton fibers; Wari related, Middle Horizon. (b–h) Samples from (a). Figure S5, (a) Tie-dye textile fragment (MCCM accession number 2002.1.1), made of camelid fiber; Wari related, Middle Horizon. (b–h) Samples from (a). Figure S6, (a) Single interlocked tapestry administrator’s tunic (MCCM accession number 2002.1.16), made from cotton and camelid fibers, Wari Middle Horizon. (b–g) Samples from (a). Figure S7, (a) Brocade textile fragment with winged staff-bearer figures in headdresses (MCCM accession number 2002.1.83), made from cotton and camelid fibers, Wari Middle Horizon. (b–c) Samples from (a). Figure S8, (a) Woven band (MCCM accession number 2003.40.5), no additional information available, attributed to Wari. (b–f) Samples from (a). Figure S9, (a) Weaver’s work basket yarns (MCCM accession number 2002.1.126 A-U), cotton and camelid fibers, Late Intermediate Period Chancay. (b–h) Samples from (a). Figure S10, (a) Red tasseled tunic fragments (MCCM accession number 2004.64.1), cotton and camelid fibers, Late Intermediate Period Pacatnamú. (b–k) Samples from (a), brown warp shown in Figure 2b. Figure S11, Paracas Necropolis yarn fragment samples collected by Anne Paul in 1985 from the Museo Nacional de Arqueología, Anthropología, e Historiadel Perú (MNAAHP). (a) Orange yarn from mummy bundle textile designated 310-58c 02912; (b) yellow yarn from mummy bundle textile designated Cave #5 12-5236 0093, cloth (oldest). Figure S12, ParacasNecropolis yarn fragment samples collected by Anne Paul in 1985 from the Museo Nacional de Arqueología, Anthropología, e Historiadel Perú (MNAAHP), mummy bundle 382. (a) Specimen 10, subspecimen 05904, green yarn from mantle; (b) specimen 45, subspecimen 02763, orange loose threads from skirt; Specimen 48, subspecimen 01017, (c) skirt fringe blue and (d) black/purple (continued next page). Figure S12, continued. Specimen 49, subspecimen (23808) 03174, (e) orange from skirt ground cloth; Specimen 54 subspecimen 02846, (f) gold embroidery threads; (g) blue fibers from turban ground cloth; (h) green threads from turban. Figure S13, continued. Specimen 68, subspecimen02929, (i) poncho purple braid and (j) poncho border ground cloth green fibers; Specimen 72, subspecimen 02519, (k) black skirt fringe and (l) red skirt embroidery thread. Figure S14, Paracas Necropolis yarn fragment samples collected by Anne Paul in 1985 from the Museo Nacional de Arqueología, Anthropología, e Historiadel Perú (MNAAHP), mummy bundle 421. (a) Specimen 39, subspecimen 03083, red loose fibers from mantle; (b) specimen 132, subspecimen 03096, brown mantle fibers from box. Figure S14, Paracas Necropolis yarn fragment samples collected by Anne Paul in 1985 from the Museo Nacional de Arqueología, Anthropología, e Historiadel Perú (MNAAHP), mummy bundle 421. (a) Specimen 39, subspecimen 03083, red loose fibers from mantle; (b) specimen 132, subspecimen 03096, brown mantle fibers from box. Figure S16, Example chromatogram at 500 nm (a) for a red sample from 2002.1.1, yarn from tie-dye Wari textile, indicative of a plant red consistent with Relbunium. UV-vis spectrum for the major peak identified as purpurin (b) detected at 10.4 min. DART mass spectra in negative ion mode (c) and positive ion mode (d) of the same sample. Figure S17, Example chromatogram at 495 nm (a) for a red sample from 2004.61.1, yarn from Lambayeque tasseled tunic, indicative of insect red consistent with cochineal. UV-vis spectrum for the major peak compared with that of carminic acid standard (b) detected at 6.6 min. Paper spray mass spectrum (c) in positive ion mode of the same sample extracted in methanol:HCl. Figure S18, UV-vis spectra for peaks observed in the chromatogram shown in Figure 1 in the main text. Spectrum of peak at 7.8 min in the extract from the gold embroidery thread from Paracasturban 382-54 02896 (a), compared to the spectrum of the okaninstandard (b). Spectrum of peak at 8.6 min in the extract from the gold embroidery thread from Paracasturban 382-54 02896 (c), compared to the spectrum of the buteinstandard (d). Figure S19, Example chromatogram at 606 nm (a) for a purple sample from 382-68 02929, yarn from poncho braid, indicative of both Relbunium and indigo. UV-vis spectra for the major peaks (b) show that purpurin (λmax~480 nm) and indigotin (λmax at 606 nm) co-elute under the chromatographic conditions used; only a trace of indirubin (c) was observed, in part because it does not absorb strongly at 606 nm. DART mass spectrum in negative ion mode (d) of the same sample. Figure S20, Example chromatograms at 350 nm (a) and 606 nm (b) for a green sample from 382-68 02929, yarn from poncho border ground cloth, indicative of indigo and an as-yet undetermined but unique yellow. The UV-vis spectrum for the peak at 10.6 min (b, inset) is consistent with that of indigotin. The other peaks observed at 350 nm gave similar spectra (c–f), which did not correlate with any of the standards or reference dyes. Figure S21, Example chromatograms at 350 nm (a) and 450 nm (b) for an orange sample from 310-56c 02912, yarn from a decorative border from a Paracas Necropolis period textile. The UV-vis spectrum for the peak at 10.5 min (b, inset) is consistent with that of purpurin from Relbunium. No major peaks were observed at 350 nm and none could be identified as any of the known yellow components. No signal consistent with any of the yellow colorants was observed above 1% relative abundance by DART-MS; the negative ion spectrum (c) shows only purpurin and caffeic acid. Figure S22, Example chromatogram at 375 nm (a) for the deteriorated brown fibers from 421-132 03096 (brown). The chromatogram from the gold yarn consistent with Bidens or Coreopsis is shown in gray for comparison. A trace of butein may be present around 8.6 min, but the poor signal-to-noise ratio limits the identification. Several signals consistent with yellow colorants from Bidens or Coreopsis were observed both by negative ion DART-MS (b) and paper spray mass spectrometry (c); no glycosides were detected, likely due to the sample extraction in methanol:HCl. Table S1, Detailed results from analysis of yarns from ancient Peruvian textiles from the Michael C. Carlos Museum collections. Table S2, Detailed results from analysis of yarns from Paracas Necropolis samples collected in 1985 by Anne Paul at the MNAAHP in Lima, Peru.
Author Contributions
Funding acquisition, R.S. and R.A.A.; Investigation, J.C.A., S.M., B.W. and R.A.A.; Methodology, R.A.A.; Project administration, R.S. and R.A.A.; Resources, K.A.d.M. and K.J.; Validation, R.A.A.; Writing—original draft, J.C.A., R.S. and R.A.A.; Writing—review & editing, J.C.A., S.M., B.W., K.A.d.M., K.J., R.S. and R.A.A. All authors have read and agreed to the published version of the manuscript.
Funding
This research was funded by the Andrew W. Mellon Foundation, Grant ID# G-1806-05955. The APC was funded in part by the EMU College of Arts and Sciences Dean’s Faculty Professional Development Award program.
Data Availability Statement
Data not found in the paper and Supplementary Materials can be requested from the corresponding author.
Acknowledgments
The authors acknowledge a number of undergraduate students who contributed to this work, including Clara Gonzales from Georgia State University; Bennet Dunstan and Christin Neiman from the EMU Chemistry Department; and Chelsea Van Buskirk, Ethan Burke, and Jenna Zoerman from the Fall 2019 Analytical Instrumentation curriculum-based undergraduate research experience at EMU. Support for graduate student authors was provided by the EMU College of Arts and Sciences Dean’s Faculty Professional Development Award Program, the James H. Brickley Faculty Professional Development and Innovation Award, EMU Faculty Research Fellowships, the EMU Chemistry Department and Sellers Fund, and an EMU Graduate School Research Support Award to J.C.A. The AccuTOF DART mass spectrometer was purchased through NSF MRI-R2 award #0959621, and the HPLC-DAD and FTIR instruments used for this project were purchased with funding from the Kresge Foundation. SEM-EDS analyses were made possible by JEOL USA through the loan of a JSM-7000 Neoscope in August–September 2019.
Conflicts of Interest
The authors declare no conflict of interest.
References
- Fester, G.A. Some Dyes of an Ancient South American Civilization. Dyestuffs 1954, 40, 238–244. [Google Scholar]
- Saltzman, M. The Identification of Dyes in Archaeological and Ethnographic Textiles. In Archaeological Chemistry; Carter, G., Ed.; American Chemical Society: Washington, DC, USA, 1978; Volume 171, pp. 172–185. [Google Scholar]
- Saltzman, M.; Keay, A.M.; Christensen, J. The Identification of Colorants in Ancient Textiles. Dyestuffs 1963, 44, 241–251. [Google Scholar]
- Ferreira, E.S.B.; Quye, A.; McNab, H.; Hulme, A.N. Photo-Oxidation Products of Quercetin and Morin as Markers for the Characterisation of Natural Yellow Dyes in Ancient Textiles. Dye. Hist. Archaeol. 2002, 18, 63–72. [Google Scholar]
- Zhang, X.; Boytner, R.; Cabrera, J.L.; Laursen, R. Identification of Yellow Dye Types in Pre-Columbian Andean Textiles. Anal. Chem. 2007, 79, 1575–1582. [Google Scholar] [CrossRef]
- Wouters, J.; Rosario-Chirinos, N. Dye Analysis of Pre-Columbian Peruvian Textiles with High-Performance Liquid Chromatography and Diode-Array Detection. J. Am. Inst. Conserv. 1992, 31, 237–255. [Google Scholar] [CrossRef]
- Sabatini, F.; Bacigalupo, M.; Degano, I.; Javér, A.; Hacke, M. Revealing the organic dye and mordant composition of Paracas textiles by a combined analytical approach. Herit. Sci. 2020, 8, 1–17. [Google Scholar] [CrossRef]
- Wallert, A.; Boytner, R. Dyes from the Tumilaca and Chiribaya Cultures, South Coast of Peru. J. Archaeol. Sci. 1996, 23, 853–861. [Google Scholar] [CrossRef]
- Armitage, R.A.; Fraser, D.; Degano, I.; Colombini, M.P. The analysis of the Saltzman Collection of Peruvian dyes by high performance liquid chromatography and ambient ionisation mass spectrometry. Herit. Sci. 2019, 7, 1–23. [Google Scholar] [CrossRef]
- Cardon, D. Natural Dyes: Sources, Tradition, Technology and Science; Archetype: London, UK, 2007. [Google Scholar]
- Duke, J.A. Duke’s Handbook of Medicinal Plants of Latin America; Taylor & Francis: Abingdon, UK, 2008. [Google Scholar]
- Little, E.L.; Woodbury, R.O.; Wadsworth, F.H. Common Trees of Puerto Rico and the Virgin Islands; United States Department of Agriculture: Washington, DC, USA, 1974. [Google Scholar]
- Saltzman, M. Analysis of Dyes in Museum Textiles or, You can’t Tell a Dye by Its Color. In Textile Conservation Symposium in Honor of Pat Reves; McLean, C., Connel, P., Eds.; Conservation Center, Los Angeles County Museum of Art: Los Angeles, CA, USA, 1986; pp. 32–39. [Google Scholar]
- Niemeyer, H.M.; Agüero, C. Dyes used in pre-Hispanic textiles from the Middle and Late Intermediate periods of San Pedro de Atacama (northern Chile): New insights into patterns of exchange and mobility. J. Archaeol. Sci. 2015, 57, 14–23. [Google Scholar] [CrossRef]
- Degano, I.; Colombini, M.P. Multi-analytical techniques for the study of pre-Columbian mummies and related funerary materials. J. Archaeol. Sci. 2009, 36, 1783–1790. [Google Scholar] [CrossRef]
- Price, K.E.; Higgitt, C.; Devièse, T.; McEwan, C.; Sillar, B. Tools for Eternity: Pre-Columbian Workbaskets as Textile Production Toolkits and Grave Offerings. Br. Mus. Tech. Res. Bull. 2015, 9, 65–86. [Google Scholar]
- Boucherie, N.; Nowik, W.; Cardon, D. La Producción Tintórea Nasca: Nuevos Datos Analíticos Obtenidos Sobre Textiles Recientemente Descubiertos En Excavaciones. Nuevo Mundo Mundos Nuevos 2016. [Google Scholar] [CrossRef]
- Michel, R.H.; Lazar, J.; McGovern, P.E. Indigoid Dyes in Peruvian and Coptic Textiles of the University Museum of Archaeology and Anthropology. Archaeomaterials 1992, 6, 69–83. [Google Scholar]
- Bernardino, N.; De Faria, D.; Negrón, A. Applications of Raman spectroscopy in archaeometry: An investigation of pre-Columbian Peruvian textiles. J. Archaeol. Sci. Rep. 2015, 4, 23–31. [Google Scholar] [CrossRef]
- Burr, E.A. Dye Analysis of Archaeological Peruvian Textiles Using Surface Enhanced Raman Spectroscopy (Sers). Ph.D. Thesis, University of California, Los Angeles, CA, USA, 2016. [Google Scholar]
- Sepúlveda, M.; Urzúa, C.L.; Cárcamo-Vega, J.; Casanova-Gónzalez, E.; Gutiérrez, S.; Maynez-Rojas, M.; Ballester, B.; Ruvalcaba-Sil, J.L. Colors and dyes of archaeological textiles from Tarapacá in the Atacama Desert (South Central Andes). Herit. Sci. 2021, 9, 59. [Google Scholar] [CrossRef]
- Boytner, R. Class, Control, and Power: The Anthropology of Textile Dyes at Pacatnamú. In Andean Textile Traditions: Papers from the 2001 Mayer Center Symposium at the Denver Art Museum; Young-Sánchez, M., Simpson, F.W., Eds.; Denver Art Museum: Denver, CO, USA, 2006; p. 50. [Google Scholar]
- Cody, R.B.; Laramee, J.A.; Durst, H.D. Versatile New Ion Source for the Analysis of Materials in Open Air under Ambient Conditions. Anal. Chem. 2005, 77, 2297–2302. [Google Scholar] [CrossRef]
- Armitage, R.A.; Jakes, K.A.; Day, C.J. Direct Analysis in Real Time-Mass Spectroscopy for Identification of Red Dye Colorants in Paracas Necropolis Textiles. Sci. Technol. Archaeol. Res. 2015, 1, 60–69. [Google Scholar] [CrossRef]
- Day, C.J.; DeRoo, C.S.; Armitage, R.A. Developing Direct Analysis in Real Time Time-of-Flight Mass Spectrometric Methods for Identification of Organic Dyes in Historic Wool Textiles. In Archaeological Chemistry; Armitage, R.A., Burton, J.H., Eds.; ACS: Washington, DC, USA, 2013; Volume 8, pp. 69–85. [Google Scholar] [CrossRef]
- Liu, J.; Wang, H.; Manicke, N.E.; Lin, J.-M.; Cooks, R.G.; Ouyang, Z. Development, Characterization, and Application of Paper Spray Ionization. Anal. Chem. 2010, 82, 2463–2471. [Google Scholar] [CrossRef] [PubMed]
- Jakes, K.A. Physical and Chemical Analysis of Paracas Fibers. In Paracas Art and Architecture; Paul, A., Ed.; University of Iowa Press: Iowa City, IA, USA, 1991; pp. 222–239. [Google Scholar]
- Antúnez de Mayolo, K.K. Report on the Collection of Peruvian Dye Plants; 1997; p. 43, (unpublished report to the Smithsonian Museum). [Google Scholar]
- Antúnez de Mayolo, K.K. Peruvian Natural Dye Plants. Econ. Bot. 1989, 43, 181–191. [Google Scholar] [CrossRef]
- Campos Ayala, J. Purple Dyes from the Carlos Museum Pre-Columbian Textiles Collection: Direct Mass Spectrometry and HPLC Analyses. Master’s Thesis, Eastern Michigan University, Ypsilanti, MI, USA, 2019. [Google Scholar]
- Geiger, J.; Armitage, R.A.; DeRoo, C.S. Identification of Organic Dyes by Direct Analysis in Real Time-Time of Flight Mass Spectrometry. In Collaborative Endeavors in the Chemical Analysis of Art and Cultural Heritage Materials; Lang, P.L., Armitage, R.A., Eds.; American Chemical Society: Washington, DC, USA, 2012; pp. 123–129. [Google Scholar] [CrossRef]
- Manhita, A.; Ferreira, T.; Candeias, A.; Dias, C.B. Extracting natural dyes from wool—an evaluation of extraction methods. Anal. Bioanal. Chem. 2011, 400, 1501–1514. [Google Scholar] [CrossRef]
- Degano, I.; Magrini, D.; Zanaboni, M.; Colombini, M.P. The Saltzman Collection: A Reference Database for South American Dyed Textiles. In Proceedings of the ICOM-CC 18th Triennial Conference, Copenhagen, Denmark, 4–8 September 2017. [Google Scholar]
- DeRoo, C.S.; Armitage, R.A. Direct Identification of Dyes in Textiles by Direct Analysis in Real Time-Time of Flight Mass Spectrometry. Anal. Chem. 2011, 83, 6924–6928. [Google Scholar] [CrossRef]
- Martoglio, P.A.; Jakes, K.A.; Katon, J.E. The Use of Infrared Microspectroscopy in the Analysis of Etowah Textiles: Evidence of Dye Use and Pseudomorph Formation. In Proceedings of the 50th Annual Meeting of the Electron Microscopy Society of America; Bailey, W., Bentley, J., Small, J.A., Eds.; Microbeam Analysis Society: San Francisco, CA, USA, 1992; pp. 1534–1535. [Google Scholar]
- Jakes, K.A.; Katon, J.E.; Martoglio, P.A. Identification of Dyes and Characterization of Fibers by Infrared and Visible Microspectroscopy: Application to Paracas Textiles. In Archaeometry’90; Wagner, G.A., Pernicka, E., Eds.; Birkhäuser: Basel, Switzerland, 1991. [Google Scholar]
- Szostek, B.; Orska-Gawrys, J.; Surowiec, I.; Trojanowicz, M. Investigation of natural dyes occurring in historical Coptic textiles by high-performance liquid chromatography with UV–Vis and mass spectrometric detection. J. Chromatogr. A 2003, 1012, 179–192. [Google Scholar] [CrossRef]
- Dutra Moresi, C.M.; Wouters, J. Hplc Analysis of Extracts, Dyeings and Lakes, Prepared with 21 Species of Relbunium. Dye. Hist. Archaeol. 1997, 15, 85–97. [Google Scholar]
- Dempster, L.T. Three New Species of Galium from the Northern Andes. Madroño 1988, 35, 1–5. [Google Scholar]
- Dempster, L.T. The Genus Galium (Rubiaceae) in South America. II. Allertonia 1982, 3, 211–258. [Google Scholar]
- De Toni, K.L.G.; Mariath, J.E.A. Developmental Anatomy and Morphology of the Flowers and Fruits of Species from Galium and Relbunium (Rubieae, Rubiaceae). Ann. Mo. Bot. Gard. 2011, 98, 206–225. [Google Scholar] [CrossRef]
- Prikhodko, S.V.; Rambaldi, D.C.; King, A.; Burr, E.; Muros, V.; Kakoulli, I. New advancements in SERS dye detection using interfaced SEM and Raman spectromicroscopy (μRS). J. Raman Spectrosc. 2015, 46, 632–635. [Google Scholar] [CrossRef]
- Zhang, X.; Laursen, R.A. Development of Mild Extraction Methods for the Analysis of Natural Dyes in Textiles of Historical Interest Using LC-Diode Array Detector-MS. Anal. Chem. 2005, 77, 2022–2025. [Google Scholar] [CrossRef]
- Martoglio, P.A.; Bouffard, S.P.; Sommer, A.J.; Katon, J.E.; Jakes, K.A. Unlocking the secrets of the past: The analysis of archaeological textiles and dyes. Anal. Chem. 1990, 62, 1123A–1128A. [Google Scholar] [CrossRef]


Publisher’s Note: MDPI stays neutral with regard to jurisdictional claims in published maps and institutional affiliations. |
© 2021 by the authors. Licensee MDPI, Basel, Switzerland. This article is an open access article distributed under the terms and conditions of the Creative Commons Attribution (CC BY) license (https://creativecommons.org/licenses/by/4.0/).