Abstract
In this work, a protocol of a partially invasive sampling for the archaeometric characterization of ancient mortars from the little Roman Bath of Nora (Sardinia, Italy) is presented. Optical microscopy and different analytical techniques such as X-ray diffraction, X-ray fluorescence, thermo-gravimetric analysis, and physical/mechanical tests have been carried out on the mortars. These analyses were performed to investigate the chemical composition, alteration products, and binder pozzolanic activity. An innovative method of image analysis has been tested to obtain information about the size and shape of both the mortar aggregates and the binder/aggregate ratio. This new particle-size analysis has two different advantages: (i) it saves a huge volume of material compared to a classic granulometric classification through its use of a sieve and (ii) is eco-friendly in respect to the environment by saving a large volume of liquid waste derived from the acid attack for the separation of the insoluble aggregate from the soluble binder, as would be done for a common sieving. Results show a local provenance of the aggregates. The use of two different limestones for the mortars’ binder production was detected and probably this raw material belongs to the nearby Roman town of Karales (current day Cagliari).
1. Introduction
In heritage materials research, sampling is important to develop a specific analytical protocol to obtain different data sets. It is possible to collect information regarding the origin, characteristics, and used technologies, and to evaluate the composition of different alteration products that undermine the conservation of the artefact. However, it is important that any sampling exercise must guarantee the preservation of the object’s integrity [1,2,3]. During sampling, it is extremely important to balance the volumetric representativeness of the specimen to acquire the required information. In this manner, an analytical protocol can be developed and the artifacts or structures therefore do not suffer any visible damage [4].
In this study, the authors undertook a series of micro-destructive analyses for the complete characterization of the ancient mortars from the little Roman Bath of Nora (Pula, Italy). The building is in the eastern sector of the Roman city of Nora (southwestern Sardinia, Italy) and is currently an archaeological area in the municipality of Pula (Figure 1). It is positioned along the east side of the main road, directly connecting the harbor area between the south housing facilities complex and the neighborhood of the shophouses located north (Figure 1).
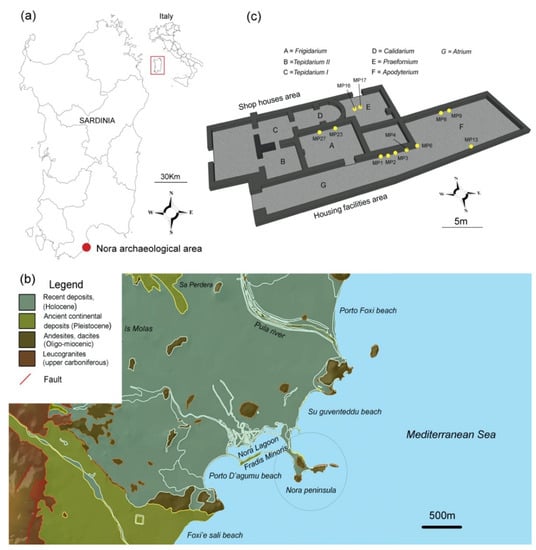
Figure 1.
(a) Localization of the archaeological area, (b) geological map, and (c) Nora Small Bath with sampling points in yellow.
The first documented excavation campaign of the building was in the 1950s [5], with the intention of unearthing the central area of the city. The current plan of the building is the result of two construction phases: one dating to the beginning of the 3rd century AD and the second, including the mosaic floor, dating to the 4th century AD [6]. The little Bath of Nora is a building accessible through steps leading to a corridor. A side entrance leads to the Apodyterium (the main vestibule room). From the corridor, a small staircase leads to the Frigidarium (a thermal environment for cold baths). Next to the Frigidarium is the Calidarium (thermal environment for steam baths), heated by a Praefurnium system located to the east, which is still visible at a lower level.
In 2016 a sampling campaign was carried out by the authors and several samples of mortars were collected from different subdivisions of the little Roman Bath of Nora. Due to legal and ethical restrictions, it was not possible to collect large number of samples and in a large quantity from the monument. Thus, the adopted sampling strategy offers the opportunity to develop/test a specific semi-destructive laboratory protocol to obtain a complete archaeometric characterization using a very small amount of material (e.g., only 5 cm3 and about 14 g for each sample).
Even with a small amount of sample, the classical laboratory protocol, normally utilized for mortar characterization, was developed. In particular, it was possible to prepare thin sections to evaluate the mineralogic–petrographic composition of the mortars [7,8,9,10]. A small amount of samples was utilized to perform TGA analyses to assess the presence of hydraulic compounds in the binder and to estimate mortars pozzolanic activity according to the loss of volatiles (e.g., H2O and CO2) [11,12,13]. Pozzolanic activity consists of the capacity of the mortar to harden in the presence of humidity and water through the addition of pozzolan.
This paper also focuses on the physical characteristics of the mortars including, for example, the particle size distribution of the aggregates, which principally influences the mechanical strength of the material [14,15]. Due to legal and ethical restrictions, it is not possible to collect large amounts of mortars from the monuments. Therefore, the purpose of this experiment is to study mortars with micro and non-invasive techniques. In this regard, the image particle size distribution (iPSD) is an innovative method useful for making particle-size analyses in a digital/graphic way, beginning with the scanning image of thin section. Image analysis has at least two main advantages: (i) it saves a huge volume of material compared to a classic granulometric characterization through the use of its sieves and (ii) is eco-friendly because it is possible to save a large volume of liquid waste derived from the acid attack for the separation of the insoluble aggregate from the soluble binder, as would be done for a common particle size calculation and aggregate/binder evaluation.
Furthermore, other micro-destructive and micro/semi-destructive analyses on mortars have been executed to obtain the mineralogical and chemical composition. Concerning the mineralogical composition, the powder-diffraction technique (p-XRD) is a micro-destructive test that has been used on scrap fragments derived from the thin section manufacture (0.2 cm3) of the mortars. p-XRD is also used in detecting minerals not identifiable by optical microscopy [16,17,18,19]. Normally, the powder-diffraction is used for identifying pigments [20] and alteration phases on stone surfaces [3,18]. In regard to the chemical analysis, an X-ray fluorescence (XRF) on the mortars has been performed. The technique is useful to understand the typology of the limestone used as a raw material for the binder [21].
2. Materials and Methods
2.1. Materials
In total, 27 samples comprised of 12 mortars, 6 alteration layers, 5 stones, and 4 bricks were collected in the little thermal Bath of Nora to attain a better understanding of the construction materials employed in the site. Among those samples, only the mortars were selected to be analyzed in this paper, as we are focused exclusively on the innovative particle-size analyses, mortar composition, and production technologies. Samples are shown in Figure 1c and Table 1 and consist of both 6 bedding and 6 rendering layers. Each sample has a ~5 cm3 volume. Sampling was conducted according to sampling normative UNI EN 16085 (Conservation of Cultural Property: Methodology for sampling from materials of cultural property, General rules).

Table 1.
Sampling log according to UNI EN 16085 normative. Sampling elevation was measured with respect to the floor level. Samples are collected by hand with the use of a hammer and scalpel.
2.2. Methods
After sampling, the thin sections of the mortars were studied in the laboratory. A 1-mm thickness of the mortars was cut and glued on a glass support with the dimension of 4.6 × 2.6 cm. Following this procedure, the thickness was reduced until 0.5 mm and subsequently to 30 mm with the help of a grinding wheel. Optical mineralogy analyses were carried out using the optical polarized microscope Leica DM2500P. Modal analysis of mortar aggregates was determined with the points counter on 320 points for each thin section. The circularity of mortar aggregates was estimated by synoptic table according to Krumbein (1941) [22]. For the thin sections, a volume of about 1 cm3 of the mortar was used.
For particle size, the method of image analysis particle-size distribution (iPSD) was performed. A high-definition image of the thin section was created using a 1200 dpi scanner (Figure 2a). Each photo was binarized in black and white by the software imageJ 1.51 s (Figure 2b) in order to distinguish between the aggregate (black color) and the binder (white color). According to a pre-set scale, the particle size distribution of the aggregate was calculated by identifying the Feret diameter (DF) of the clasts (Figure 2c,d). Each particle of residue was therefore linked to a virtual sieve of the UNI 3121 series (virtual mesh openings of 8000, 4000, 2000, 1000, 500, 250, 125, and 63 μm).
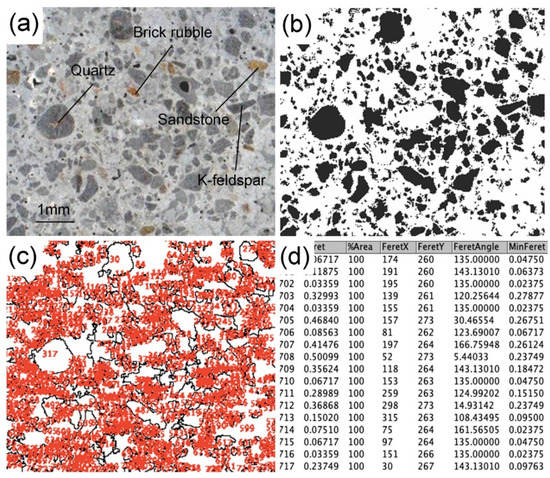
Figure 2.
Analytical steps to perform the image analysis particle-size distribution. (a) 1200 dpi scanning image of a portion of the thin section. Aggregates of brick rubble, quartz, K-feldspar, and sandstones were present. (b) Binarization of the (a) by image J 1.51 s software. Black represents the aggregate and the white part represents the binder. (c) Analyzed particles with outline command and a progressive number was assigned to every clast to better identify it. (d) Data results of the Feret diameter DF together with other data regarding every detected clast.
To convert a 2D surface into a 3D shape, the Feret diameter (DF) was used to calculate the volume of the equivalent sphere (VES) as: VES = 4/3π(DF/2)3. The hold mass in a X sieve (WX) was determined by considering the sum of the equivalent volume of the hold clasts (∑VES), multiplied for the density of the clasts. This last density was estimated as a weight average bulk density (ρX) of every sieve according to their aggregate percentage and typology (e.g., brick rubble, magmatic aggregate, sedimentary aggregates, crystal-clasts, etc.).
The final formula to find the sieve hold mass is WX = ∑VES/ρX. The relative percentage of every aggregate component is detected by optical mineralogy observations (Table 2). Aggregate bulk densities are the following:

Table 2.
Modal percentage analysis of the mortar aggregates.
- Magmatic aggregate = 2.36 g/cm3 considering a weighted average density represented by 70% leucogranites (2.55 g/cm3), 10% dacites (2.75 g/cm3), 10% obsidian (2 g/cm3), and 10% andesites (1.65 g/cm3);
- Sedimentary aggregate = 1.68 g/cm3 considering a weighted average density represented by 50% siltstone (1.70 g/cm3) and 50% Thyrrenian sandstone (1.65 g/cm3) [3];
- Bioclasts = 2.5 g/cm3;
- Brick rubble = 1.68 g/cm3 [11];
- Sialic crystal-clasts = 2.59 g/cm3 considering a weighted average density represented by 80% Quartz (2.6 g/cm3) [23], 10% K-feldspar (2.56 g/cm3), and 10% plagioclase (2.62 g/cm3);
- Mafic crystal-clasts = 4.96 g/cm3 considering a weighted average density represented by 90% Magnetite (5.2 g/cm3) and 10% Biotite (2.8 g/cm3) [24]; and
- Charcoal = 1.9 g/cm3 [25].
The method of the particle-size analysis for the thin section, with respect to a normal sifting, has some limitations. Considering it is a 2D analysis, the observer can only see a 2D cross-section of the clast even if the same clast could have different elongations in 3D. The technique, which is still in the experimental phase, must be trustworthy and correlated with a particle-size analysis on real sieves to define its reliability and its error size in the future.
The remaining 4 cm3 of material was selected for physical, XRF, and pXRD analyses. For the latter, the Bruker AXS D8 Discover instrument with a CuKα source, operating at 40 kV and 40 mA, and a Lynxeye 1-dimensional detector were used. Scans were performed from 3 to 75° 2θ, with 0.05° 2θ step and 1 s/step measuring time by point. Diffract-Eva software from Bruker with the PDF-2 mineralogical database (International Centre for Diffraction Data-ICDD) was utilized to interpret the scans.
A volume of 0.2 cm3 of powder binder had been placed in platinum crucibles for thermo-gravimetric analysis (TGA) and the test was carried out using a balance Netzsch STA449F3jupiter. The measurements were performed under Ar flow (60 mL/min) in the temperature range 30–850 °C with a heating rate of 10 °C/min. Before thermal analysis, the binders were manually separated to the aggregate by a stereo-microscope Wild Heerbrugg. For determining the macroscopic color of the mortar’s binder, a portable DATACOLOR check II plus colorimeter, set with the CIELAB (or CIE L *a *b *) color system, was used.
XRF spectroscopy quantified major oxides such as Na2O, MgO, Al2O3, SiO2, P2O5, K2O, CaO, TiO2, MnO, Fe2O3, and SO3. Analyses were performed by Energy Dispersive X-Ray Spectrometer (EDS-XRF, S2 Puma, Bruker). Fused beads were produced on a Claisse LeNeo using a flux (Li-tetraborate) with a sample ratio of 10:1 (12 g flux, 0.4 cm3 of sample) [26]. Concentrations (Wt. %) were obtained using a linear regression method with 35 Standard Reference Materials [27]. Spectra Elements 2.0 was utilized for the acquisition and data processing. Loss on ignition (L.O.I.) was calculated by TGA analysis.
Physical–mechanical properties of the mortars were measured according to the methods of Sitzia [9] by using a Sartorius CPA324S balance and Quantachrome ULTRAPY1200e Pycnometer. The imbibition coefficient was obtained by measuring the saturated weight (WW) after seven days of water immersion. The imbibition coefficient was calculated with the formula ICW = (WW − WD/WD) × 100, where WD is the dry weight of the sample.
The point load strength index was calculated with the point load tester CONTROL D550. The compressive strength (RC) and tensile strength (RT) were indirectly calculated from the point load strength index according to the Palmström equations [28]. About 3 cm3 of mortars were required for the physical–mechanical characterization.
3. Results and Discussions
3.1. Optical Mineralogy on the Mortar Thin Section
The mortars of the little Roman Bath showed a color from light grey (CIELAB82*2*3) to dark grey (CIELAB55*1*1). They could be divided into two large groups represented by bedding mortars of stone or brick and plasters (represented by renderings). Macroscopically, all samples had a conglomeratic to micro-conglomeratic structure.
The binder was a carbonate with rare lumps of lime up to 2.5 mm in size, in percentages from 1% to 5% vol. Mechanical stress and shrinkage fractures were absent but some samples presented principles of decohesion between the binder and aggregate.
The aggregates consisted of magmatic (Figure 3b) and sedimentary rocks (Figure 3d,h), bioclasts (Figure 3f), brick rubble (Figure 3g,e) and crystal-clasts mainly composed of quartz-feldspar (Figure 3a,c), mafic, and charcoal.
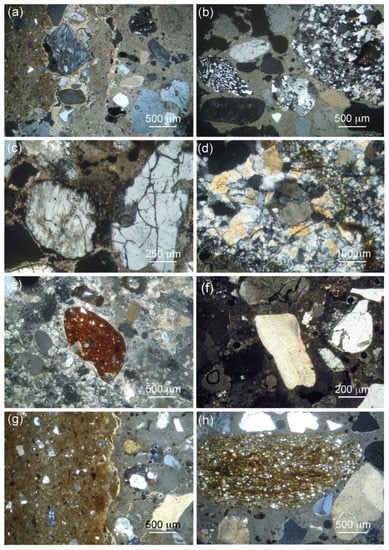
Figure 3.
OM observation on mortar thin sections: (a) quartz and feldspar crystal-clasts aggregates; (b) fragments of leucogranitic rock rubble; (c) clay-altered crystal-clasts of feldspar on the left and fractured crystal-clast of quartz on the right; (d) sandstone fragment; (e) brick rubble aggregate; (f) bioclast fragment; (g) interface between a brick rubble fragment and binder; and (h) aggregate of silty sandstone.
Magmatic aggregates were constituted by fragments of andesites, dacites, obsidians, and leucogranites. Siltstones and Tyrrhenian sandstones represented the sedimentary rocks aggregates. The magmatic and sedimentary aggregates ratio was variable (Table 2). Typically, rock aggregates have a dimension from 0.1 mm to 1.5 cm and a circularity of C > 0.6. Mafic type crystal-clasts mainly are opaque (magnetite) and rare biotite. The bioclasts found in the mortars ranged from 1.4% to 4.9% and were mainly bivalves, gastropods, echinoids, foraminifera, and coralline algae, typically of the marine environment. In addition, the fraction of sialic and mafic crystal-clasts, with a very rounded shape, was compatible with the nearest sands of Sant’Efisio, Su Guventeddu, and Agumu beaches (Figure 1b). The quartz-feldspar aggregates belonged to mature-compositional sand with 80% quartz, 10% K-feldspar, and 10% plagioclase, with a dimension 0.1–6 mm and with usually well-rounded shapes (0.5 < C < 0.7).
The percentage of brick rubble aggregates from 0.0 to 40.5% wase detected on mortars. They consisted of angular shapes (C < 0.3) and dimensions usually around one millimeter. They did not show any reaction edges with the carbonate binder. The charcoal had an unclear origin and it was difficult to be establish in the thin section. It could be an accidental aggregate resulting from limestone combustion residues in the firing kiln. Charcoal was found in small percentages in MP1 and was absent in the other mortars.
The volcanic rock rubble andesites and dacites have a local provenance, located on the outcrops from the first volcanic cycle of Sardinia occurring between the Upper Eocene and the Miocene period (38–15 Ma) [29].
These lithologies were extracted for the production of ashlars at Su Casteddu hill and for the construction of other buildings within the archaeological area [30]. A local provenance is also suggested for the fragments of leucogranites derived from the reliefs of the mountain belt of Sarroch-Pula-Domus De Maria, located 5 km northwest away from the archaeological area [31]. The outcrops are dated to the Upper Carboniferous period (Figure 1b). Particles of leucogranites were present in the archaeological area by alluvial fans transport.
The obsidian is not local. A research study conducted in 2017 with geochemical analysis [32] demonstrated that the obsidian from the theater of Nora, located 130 m from the little Roman Bath, derived from the Monte Arci area (90 km North).
Sedimentary rock rubble such as siltstones and Tyrrhenian sandstones derive from local lithologies and were already used for ashlar production at the archaeological area of Nora. Siltstones can be found as massive outcrops in the inland of Nora (Sa Perdera Roman quarry, Figure 1b) and in the archaeological area, presenting as particles from an alluvial fan. The siltstone derived from the geological formation of Cixerri (48.6–37.2 Ma) [33], as already studied by Costamagna and Schafer (2018) [34]. Thyrrenian sandstone (0.08–0.1 Ma), as confirmed by Sitzia 2019, [3] was present in some small coastal outcrops located on the beaches of Sant’Efisio, Guventeddu, and Porto Foxi.
At the Su Guventeddu beach, there was no real front of Thyrrenian sandstone extraction but rather only the presence of worked and squared blocks on the beach were present. However, it is possible that rising tides have submerged the quarry at relatively low depths [35].
At Fradis Minoris (500 m west to the Nora peninsula), a large quarry of Thyrrenian sandstones is located near a rocky berm dividing the sea from the Nora lagoon (Figure 1b). The quarry extends for 12,000 m2 with twelve extractive fronts, nine of which face to the sea and another three which overlook the lagoon.
Generally, the high circularity of rock aggregates suggests that they belong to marine sands and the hypothesis that this aggregate could represent a waste of quarry activities is unlikely.
No information is available regarding the calcareous raw material used in the production of the binder. No limestones outcrops were present in the area of Nora.
Limestone was probably transported by sea from the city of Karalis (now called Cagliari), which is located 25 km to the northeast. Mining activity at Karalis is known from the Roman period on the local biomicrite and biolitite outcrops [36]. These limestone deposits were also exploited and used for mortar production in the Roman Basilica of San Saturnino (Cagliari) [3].
In addition, it is probable that the binder for the production of Nora mortars was produced by firing reused limestone (e.g., marble or other limestone) belonging to previous settlements, as it often occured in the Roman period [37]. Another hypothesis is that the limestone belongs to the actual area of Capo Teulada-Monte Lapanu, which is located 36 km to the southwest. Here, the metacalcareous and dolomitic formations of Gonnesa (lower Cambrian) were already exploited during the Roman period [38].
3.2. Physical–Mechanical Analysis
Regarding the physical–mechanical characterization of the mortars, Table 3 shows that the real density of bedding samples was greater than the renderings (layer of plaster). The reason for this density difference does not seem to be linked to the aggregate fraction, considering usually light aggregates such as brick rubble, which tends to lighten the mortar cast, are more abundant in the renderings (Table 2). Furthermore, the rock rubble aggregate that determines the final weight of the cast was greater in the beddings (Table 2). It is therefore probable that with the same aggregate composition, the binders of the mortars have different compositions and different real densities. An effective porosity of 46.66% was identified in bedding mortars and 45.47% in renderings (Table 3). The saturation index of 80.52% in the beddings and 94.37% in the renderings could be due to a different pore tortuosity. The imbibition coefficient is 21.05% in the bedding mortars and 23.76% in the renderings. The mechanical characteristics, however, indicate a point load strength index of 0.48 MPa in the beddings and 0.60 MPa in the renderings. Higher mechanical strength values in the renderings compared to the beddings have already been identified in the literature on mortars of the Tharros archaeological area (Sardinia, Italy) [3]. Normally, the mechanical strengths of the beddings are greater than the renderings, thus these case studies are an exception.

Table 3.
Physical–mechanical analysis of the selected mortars.
3.3. pXRD Diffraction
X-ray diffraction results are presented in Table 4. Calcite derived from the binder was abundant. The large amount of quartz, plagioclase, K-feldspar, and biotite that constitute the aggregate of sialic and mafic crystal-clasts have also been detected.

Table 4.
Diffraction (pXRD) on mortars: Tr = traces (≤2% Wt.); “•” indicates present (2–10% Wt.); “••” indicates abundant (10–40% Wt.); and “•••” indicates very abundant (≥40% Wt.).
In samples MP16 and MP27 (Table 2), halite (NaCl) was identified, which is typical of marine spray and saline fog. Kaolinite Al2Si2O5(OH)4 was found in MP17, MP13, and MP23. Kaolinite could derive from the clayey brick rubble that was not subjected to adequate firing. This suggests that the 575 °C temperature, which is required to fire the bricks properly [27], was not achieved. At this temperature, the kaolinite is converted to mineral phases of higher temperatures such as metakaolinite, spinel, or mullite [39,40]. Other possible sources of kaolinite could be in small part due to the alteration of plagioclases and K-feldspar, a natural decay process already observed in thin sections on aggregate crystal-clasts (Figure 3c). Rarely, kaolinite may derive from an intentional mineral addition. The kaolinization technique of the mortar (porcelain mortar) was designed by Phoenicians, who occupied the archaeological area of Nora as early as in the 8th century BC Although the kaolinization of Nora mortars could be possible, there are no written sources that attest to the use of porcelain mortar before 400 AD in Europe [41]. After the Phoenicians period, the technique was gradually forgotten; however, it began again to be used in Italy towards the late middle ages (XV century AD) at Genova schools [41].
Regarding the presence of alteration minerals, gypsum (up to 8% by weight) was found in almost all of the samples as a product of calcite sulfation by the sulphate anion SO4−2, which was abundantly present in the coastal environment of Nora.
Calcium sulphide (oldhamite, CaS) was present as a trace phase in the MP8 and MP9 samples. According to Poole and Sims (2016) [42], oldhamite is a “minor” product derived from slags formed in the kilns for the production of mortars.
Oldhamite is often found in association with calcite and gypsum, and phases are also present in the two samples (Table 4).
In the mortars, no hydraulic phases of neo-formation, due to the reactions of calcium carbonate with the silicates, were present in the aggregates identified. This is mainly due to the fact that the pozzolanic reaction process (chemical interchange between the binder and reactive aggregate) usually produces amorphous phases (gel) that cannot be detected in X-ray diffraction [7].
3.4. Thermal TGA Analysis on Binder
The plot in Figure 4a highlights the presence of at least three groups of mortars, grouped according to degrees of hydraulicity (Table 5). All of the samples are arranged on the graph according to a polynomial correlation line with coefficient R2 = 0.79 (Figure 4b).
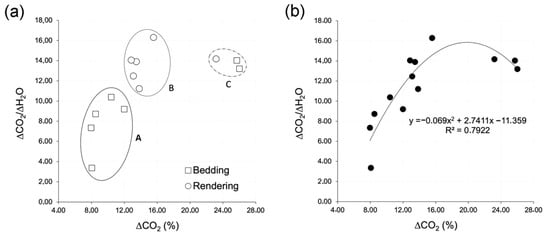
Figure 4.
Thermal characterization of mortars: (a) ΔCO2 vs. ΔCO2/ΔH2O diagram for bedding and rendering mortars and (b) ΔCO2 vs. ΔCO2/ΔH2O diagram for all the samples in a single series.

Table 5.
Thermal characterization (TGA) on binders.
The ellipse (A) shows the presence of five brick bedding mortars with higher hydraulicity, namely 8.05 < ΔCO2 < 11.98% and 3.37 < ΔCO2/ΔH2O < 10.39%. In a second ellipse (B), we found a group of five rendering mortars with intermediate hydraulicity, namely 12.85 < ΔCO2 < 15.56% and 11.22 < ΔCO2/ΔH2O < 16.29%. Finally, in the ellipse (C), spaced from the two ellipses A and B, we found two bedding mortars and one rendering with 23.17 < ΔCO2 < 25.99% and 13.21 < ΔCO2/ΔH2O < 14.18%.
In this latter mortar, a high hydraulicity could be explained by the presence of some lumps in the analyzed material not correctly separated from the binder. The difference of hydraulicity between the bedding (ellipse A) and rendering (ellipse B) could typically be explained with different percentages of reactive aggregates (e.g., brick rubble and volcanic rocks) that have conferred the hydraulicity to the binder. In this case, as Table 2 exhibits, a higher percentage of brick rubble was detected in the renderings (1.4% vs. 16.8%) and a higher percentage of magmatic rocks was detected in the bedding mortars (28.9% vs. 21.8%). However, the involvement of these two components in the hydraulic reactions with the binder remains unclear because no reaction borders had been detected in the thin section. It is probable, as already observed in other works [38], that the hydraulicity degree can be entirely conferred by the binder. As previously discussed, there is no information about the limestone quarries. However, if the limestone was imported from the ancient city of Karalis, then at least two types of limestones with different degrees of clay content and therefore hydraulicity would have been transported. It has been demonstrated that the limestones of Karalis quarries have a clay content of 5–15% in biomicrite [43] and 0–2% in biolitite [14].
3.5. Image Analysis Particle-Size Distribution (iPSD)
Table 6 shows the average values and standard deviations of binder aggregate ratios (B/A) for bedding mortars and renderings. The binder/aggregate ratio (B/A) depends on the thickness of the application of the samples and the mortar’s function. In our case, a ~2 cm thickness for the layers of the bedding mortars and a ~0.5 cm thickness for the renderings had been detected on the monument. According to the prescription of Vitruvio [44], a thickness of 1–2 cm provides a percentage of the aggregate of about 65 and 70 vol.%, corresponding to a 0.42 < B/A < 0.53. A thickness of > 2 cm provides percentages of aggregates in the order of 70–80 vol.%, corresponding to a 0.25 < B/A < 0.42.

Table 6.
Particle-size distribution by image (iPSD) of mortar aggregates: hold mass percentage according to virtual UNI 3121 sieve series. Abbreviation: B/A = binder/aggregate ratio.
Usually, the ratio of B/A is inversely proportional to the thickness of the cast. In our case, the bedding mortars have B/A = 1.13. Contrary to what the Roman architect Vitruvio recommended, the mortars at the little Roman Bath present a high B/A ratio. A B/A ratio equal to 1.23 had been found in the renderings. This value is higher in respect to other B/A ratios identified in other Roman mortars from Sardinia [9]. Bedding mortars are mainly represented by an aggregate of a 1000–500 μm diameter, identified as a coarse sand (Table 6, Figure 5). In the sample MP3, a fine iPSD was related to the higher hold mass of aggregates at the sieves of 500–250 μm (medium sand). In MP16, conversely, the aggregate had a 2000–1000 μm dimension (very coarse sand). In the renderings group, all the mortars had a primary coarse sand (1000–500 μm) particle size (Figure 6), apart from the sample of MP23 in which an aggregate of very coarse sand, of 2000–1000 μm, was present.
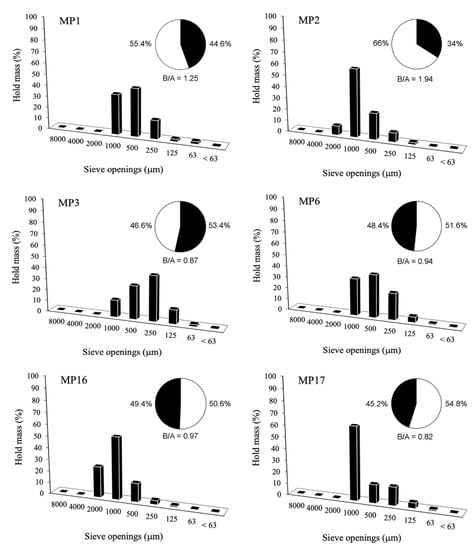
Figure 5.
Image PSD histograms of the bedding mortars.
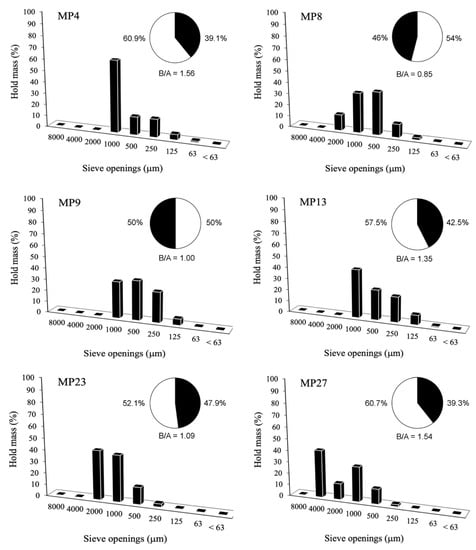
Figure 6.
Image PSD histograms of the rendering mortars.
3.6. Chemical Analysis
XRF analysis on mortars (Table 7 and Table 8, Figure 7) identified a carbonate composition of the binder with magnesium oxide, which presented in a small concentration of 0.34 < MgO < 1.22 Wt. %.

Table 7.
XRF chemical analysis of the bedding mortars (Wt. %).

Table 8.
XRF chemical analysis of the rendering mortars (Wt. %).
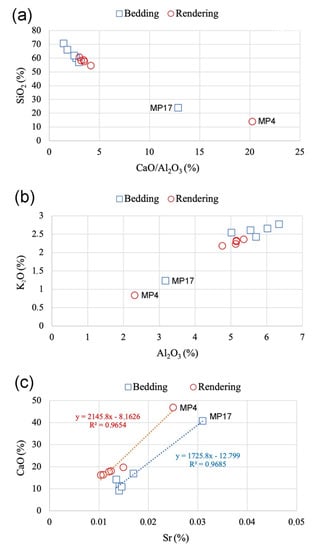
Figure 7.
(a) CaO/Al2O3 vs. SiO2, (b) Al2O3 vs. K2O, and (c) Sr vs. CaO diagrams.
Figure 7a–c displays the diagrams of the CaO/Al2O3 ratio vs. SiO2, Al2O3 vs. K2O, and CaO vs. Sr. The CaO/Al2O3 ratio vs. SiO2 (Figure 7a) gives an indication of the binder and aggregate ratio. SiO2 was mainly included in the sand component, while CaO and Al2O3 were included in the binder (C-S-A gel) and/or on brick rubbles. The plot shows an exponential trend with R2 = 0.99 and most samples cluster together, but on the rendering MP4 and in the bedding mortar MP17, more binder was utilized. Similar results were also obtained by iPSD (Figure 5 and Figure 6). The linear correlation between Al2O3 and K2O (R2 = 0.99) supports this observation (Figure 7b), showing that these two oxides are hosted by the same inclusion (e.g., brick rubbles), and less aggregate was added in the case of samples MP4 and MP17. The correlation between CaO and Sr clearly divided all bedding and rendering mortars, and two different linear correlation lines are visible with R2 equal to 0.96 (Figure 7c). This observation suggests that different limestones were utilized to make the binder.
4. Conclusions
The analyses of the 12 mortars (rendering and bedding layers) reveal that they were produced mostly using aggregates of local raw materials outcropped close to the archaeological area (Fradis Minoris and Casteddu quarries, Figure 1b). This means that the extraction of the natural stone used as the aggregate took place around the archaeological site. Some other aggregates necessary to activate the pozzolanic reactions to obtain durable mortars in highly humid conditions had to be extracted in other areas of Sardinia quite far from the site. The obsidian found in all the mortar groups was mined at the Monte Arci site.
The origin of calcareous rocks utilized to produce the mortars is unknown; however, they probably derive from the nearby Karalis Roman city, which is current day Cagliari. In Karalis, some quarries of biolitite and biomicrite were already exploited during Roman times. It should also be noted that, in addition to the two lithologies, biocalcarenites with intermediate clay contents (2–10%) between biomicrite and biolitite were extracted at the Karalis hills. The different percentages of clay could explain the different degrees of hydraulicity of the binders identified in the thermogravimetry.
Ultimately, this research study confirmed that about 5 cm3 of materials are necessary for an almost-complete characterization of the mortars, extracting important archaeometric information about the production methods. Some methods of analysis, such as iPSD as proposed in this work, have allowed for a significant saving of archaeological material and can be used in modern applications on concretes and cements. The method also saves a considerable volume of the liquid waste produced with normal acid dissolution of mortars that need to be disposed of. Some further insights about this method are being studied and published. This method must be carefully compared with a classic sieve analysis in order to establish its error size and representativeness. It is important to highlight that iPSD on thin sections can suffer of a lack of representativeness if compared with 200 g of the material necessary by a classical sieving.
Author Contributions
F.S.: conceptualization, data curation, formal analysis, investigation, project administration, resources, software, supervision, validation, visualization, writing—original draft preparation, and writing—review and editing. C.L.: methodology, validation, visualization, and writing—review and editing. M.B.: methodology, validation, visualization, and writing—review and editing. J.M.: funding acquisition, investigation, methodology, validation, visualization, and writing—review and editing. All authors have read and agreed to the published version of the manuscript.
Funding
This research was founded by Sardinian Regional Government for the financial support (P.O.R. Sardegna F.S.E.—Operational Program of the Autonomous Region of Sardinia, European Social Fund 2014–2020—Axis III Education and training, Thematic goal 10, Investment Priority 10ii), Specific goal 10.5.
Institutional Review Board Statement
Not applicable.
Informed Consent Statement
Not applicable.
Data Availability Statement
No data reported.
Conflicts of Interest
The authors declare no conflict of interest.
References
- Martinho, E.; Dionisio, A. Nondestructive and micro-invasive techniques for stone cultural heritage diagnosis: An overview. In Advances in Material Science Research; Nova Publishers: Hauppauge, NY, USA, 2016; pp. 1–30. [Google Scholar]
- UNI EN 16085 Conservation of Cultural Property—Methodology for Sampling from Materials of Cultural Property. 2012. Available online: https://www.google.com.hk/url?sa=t&rct=j&q=&esrc=s&source=web&cd=&ved=2ahUKEwi-5cuchorzAhWLBKYKHabzByEQFnoECAIQAQ&url=https%3A%2F%2Fgost-snip.su%2Fdownload%2Funi_en_16085_2012_conservation_of_cultural_property_methodol&usg=AOvVaw3-gz-85HGBO5xzpPzrlHl8 (accessed on 13 August 2021).
- Sitzia, F. Degradation Monitoring and Conservation of Sardinia Monumental Heritage by Geochemical, Petrographic, Physical and Micro-Photogrammetric Characterization of Stone Surfaces. Ph.D. Thesis, University of Cagliari, Cagliari, Italy, 2019. Available online: https://iris.unica.it/handle/11584/285249#.YOrQdC12TOQ (accessed on 13 August 2021).
- Castro, K.; Rodilla, I.; Madariaga, J.M.; Azkarate, A. Science and technology for the characterization of decay products and building materials on the ancient wall of Vitoria-Gasteiz using micro analytical instrumental techniques. In Science and Technology; Rogerio-Candelera, M.A., Lazzari, M., Cano, E., Eds.; CRC Press: Boca Raton, FL, USA, 2013. [Google Scholar] [CrossRef]
- Pesce, G. Nora, Guida Agli Scavi, Cagliari. 1972. Available online: https://www.maremagnum.com/libri-antichi/nora-guida-agli-scavi/146195617 (accessed on 13 August 2021).
- Tronchetti, C. Nora, Sassari. 2001. Available online: http://nora.beniculturali.unipd.it/storia-del-sito/bibliografia-essenziale/ (accessed on 13 August 2021).
- Garau, A.M. The mortars and the stones of Nora Theater (SW Sardinia). Ph.D. Thesis, University of Cagliari, Cagliari, Italy, 2005. [Google Scholar]
- Ortega, L.A.; Zuluaga, M.C.; Alonso-Olazabal, A.; Insausti, M.; Ibáñez, A. Geochemical characterization of archaeological lime mortars: Provenance inputs. Archaeometry 2008, 50, 387–408. [Google Scholar] [CrossRef]
- Fabio, S.; Massimo, B.; Stefano, C.; Carla, L.; Catarina, M.; José, M. Ancient restoration and production technologies of Roman mortars from monuments placed in hydrogeological risk areas: A case study. Archaeol. Anthr. Sci. 2020, 12, 147. [Google Scholar] [CrossRef]
- Crisci, G.M.; Franzini, M.; Lezzerini, M.; Mannoni, M.; Riccardi, M.P. Ancient mortars and their binders. Mineral 2004, 73, 259–268. [Google Scholar]
- Moropoulou, A.; Bakolas, A.; Bisbikou, K. Characterization of ancient, byzantine and later historic mortars by thermal and X-ray diffraction techniques. Thermochim. Acta 1995, 269–270, 779–795. [Google Scholar] [CrossRef]
- Bakolas, A.; Biscontin, G.; Moropoulou, A.; Zendri, E. Characterization of structural byzantine mortars by thermogravimetric analysis. Thermochim. Acta 1998, 321, 151–160. [Google Scholar] [CrossRef]
- Moropoulou, A.; Bakolas, A.; Bisbikou, K. Investigation of the technology of historic mortars. J. Cult. Herit. 2000, 1, 45–58. [Google Scholar] [CrossRef]
- Sitzia, F.; Lisci, C.; Mirão, J. Accelerate ageing on building stone materials by simulating daily, seasonal thermo-hygrometric conditions and solar radiation of Csa Mediterranean climate. Constr. Build. Mater. 2020, 266, 121009. [Google Scholar] [CrossRef]
- Mertens, G.; Elsen, J. Use of computer assisted image analysis for the determination of the grain-size distribution of sands used in mortars. Cem. Concr. Res. 2006, 36, 1453–1459. [Google Scholar] [CrossRef]
- Valadas, S.; Tavares, D.; Pedro, J.; Mirão, J.; Coroado, J.; Silva, A.S.; Candeias, A.E. Characterisation of the mural paintings from the Misericordia Church of Odemira (Portugal). Mater. Sci. Forum 2008, 587-588, 1019–1023. [Google Scholar] [CrossRef]
- Elsen, J.; Mertens, G.; Van Balen, K. Raw materials used in ancient mortars from the Cathedral of Notre-Dame in Tournai (Belgium). Eur. J. Miner. 2011, 23, 871–882. [Google Scholar] [CrossRef]
- Maravelaki, P.-N.; Bakolas, A.; Moropoulou, A. Physico-chemical study of Cretan ancient mortars. Cem. Concr. Res. 2003, 33, 651–661. [Google Scholar] [CrossRef]
- Zaouia, N.; Elwartiti, M.; Baghdad, B. Superficial alteration and soluble salts in the calcarenite weathering. case study of almohade monuments in Rabat: Morocco. Environ. Earth Sci. 2005, 48, 742–747. [Google Scholar] [CrossRef]
- Columbu, S.; Lisci, C.; Sitzia, F.; Lorenzetti, G.; Lezzerini, M.; Pagnotta, S.; Raneri, S.; Legnaioli, S.; Palleschi, V.; Gallello, G.; et al. Mineralogical, petrographic and physical-mechanical study of Roman construction materials from the Maritime Theatre of Hadrian’s Villa (Rome, Italy). Measurement 2018, 127, 264–276. [Google Scholar] [CrossRef]
- Alvarez, J.; Navarro, I.; Martín, A.; Casado, P.G. A study of the ancient mortars in the north tower of Pamplona’s San Cernin church. Cem. Concr. Res. 2000, 30, 1413–1419. [Google Scholar] [CrossRef]
- Krumbein, W.C. Measurement and Geological Significance of Shape and Roundness of Sedimentary Particles. J. Sediment. Res. 1941, 11, 64–72. [Google Scholar] [CrossRef]
- Klein, C.; Philpotts, A. Introduction to crystallography. In Earth Minerals: Introduction to Mineralogy and Petrology, 2nd ed.; Cambridge University Press: Cambridge, UK, 2016; pp. 87–134. [Google Scholar] [CrossRef]
- Gertisser, R.C.; Klein, A. Philpotts 2013. In Earth Materials: Introduction to Mineralogy and Petrology; Cambridge University Press: Cambridge, UK, 2013. [Google Scholar]
- Huang, H.; Wang, K.; Bodily, D.M.; Hucka, V.J. Density measurements of argonne premium coal samples. Energy Fuels 1995, 9, 20–24. [Google Scholar] [CrossRef]
- Columbu, S.; Gioncada, A.; Lezzerini, M.; Sitzia, F. Mineralogical-chemical alteration and origin of ignimbritic stones used in the old cathedral of Nostra Signora di Castro (Sardinia, Italy). Stud. Conserv. 2019, 64, 397–422. [Google Scholar] [CrossRef]
- Beltrame, M.; Sitzia, F.; Arruda, A.M.; Barrulas, P.; Barata, F.T.; Mirão, J. The islamic ceramic of the Santarém Alcaçova: Raw materials, technology, and trade. Archaeometry 2021. [Google Scholar] [CrossRef]
- Palmström, A. RMi—A Rock Mass Characterization System for Rock Engineering Purposes. Ph.D. Thesis, University of Oslo, Oslo, Norway, 1995. [Google Scholar]
- Assorgia, A.; Barca, S.; Spano, C. Lineamenti stratigrafici, tettonici e magmatici del terziario della sardegna. In Proceedings of the Convegno Sulla Fossa Sarda, Villanovaforru, Italy, 19–22 June 1997; pp. 13–25. [Google Scholar]
- Columbu, S. Petrographic and geochemical investigations on the volcanic rocks used in the Punic-Roman archaeological site of Nora (Sardinia, Italy). Environ. Earth Sci. 2018, 77, 577. [Google Scholar] [CrossRef]
- Carmignani, L.; Oggiano, G.; Funedda, A.; Conti, P.; Pasci, S. The geological map of Sardinia (Italy) at 1:250,000 scale. J. Maps 2015, 12, 826–835. [Google Scholar] [CrossRef]
- Columbu, S.; Garau, A.M.; Luglié, C. Geochemical characterisation of pozzolanic obsidian glasses used in the ancient mortars of Nora Roman theatre (Sardinia, Italy): Provenance of raw materials and historical–archaeological implications. Archaeol. Anthr. Sci. 2018, 11, 2121–2150. [Google Scholar] [CrossRef]
- Costamagna, G.L.; Schäfer, A. Evolution of a Pyrenean molassic basin in the Western Mediterranean area: The Eocene–Oligocene Cixerri Formation in Southern Sardinia (Italy). Geol. J. 2018, 53, 424–437. [Google Scholar] [CrossRef]
- Nervi, C. Life of Nora (Province of Cagliari—South Sardinia): Roman quarries and their organization in the rural landscape. In Interdisciplinary Studies on Ancient Stone ASMOSIA X; Proceedings of the Tenth International Conference ASMOSIA, Association for the Study of Marble and Other Stones in Antiquity Rome, Rome, Italy, 21–26 May 2012; L’Erma di Bretschneider: Rome, Italy, 2012; pp. 585–591. Available online: https://www.torrossa.com/en/resources/an/3070822 (accessed on 13 August 2021).
- Previato, C. Nora. Le Cave di Pietra Della Città Antica; Edizioni Quasar: Rome, Italy, 2016. [Google Scholar]
- Coroneo, R. Architettura Romanica Dalla Metà del Mille al Primo ‘300; Nuoro: Illiso, Italy, 1993. [Google Scholar]
- Columbu, S.; Antonelli, F.; Sitzia, F. Origin of Roman worked stones from St. Saturnino Christian Basilica (South Sardinia, Italy). Mediterr. J. Archeaol. Archaeom. 2018, 18, 17–36. [Google Scholar] [CrossRef]
- Vannelli, V. Guida al Verde di Teulada e del suo Territorio; Cuec: Cagliari, Italy, 2001. [Google Scholar]
- Bellotto, M.; Gualtieri, A.; Artioli, G.; Clark, S.M. Kinetic study of the kaolinite-mullite reaction sequence. Part I: Kaolinite dehydroxylation. Phys. Chem. Miner. 1995, 22, 207–217. [Google Scholar] [CrossRef]
- Gualtieri, A.; Bellotto, M.; Artioli, G.; Clark, S.M. Kinetic study of the kaolinite-mullite reaction sequence. Part II: Mullite formation. Phys. Chem. Miner. 1995, 22, 215–222. [Google Scholar] [CrossRef]
- Mannoni, T.; Gianluca, P.; Vecchiattini, R. Rapporti tra archeologia, archeometria e cultura materiale nello studio dei materiali impiegati nelle opere portuali. In Le Strutture Dei Ponti e Degli Approdi Antichi; Rubettino: Soveria Mannelli, Italy, 2004. [Google Scholar]
- Pole, A.; Sims, I. Concrete petrography: A handbook of investigative techniques. Choice Rev. Online 1998, 35, 35–6252. [Google Scholar] [CrossRef]
- Barroccu, G. Urban geology and hydrogeology of the metropolitan Area of Cagliari. In Il Caso di Studio dell’Area Metropolitana di Cagliari: Pianificazione Sostenibile: Paesaggio, Ambiente, Energia; Abis, E., Ed.; Gangemi Editore: Rome, Italy, 2016; pp. 116–121. [Google Scholar]
- Wetmore, M.N.; Vitruvius; Morgan, M.H. Vitruvius: The ten books on architecture. Class. Wkly. 1916, 9, 116. [Google Scholar] [CrossRef]
Publisher’s Note: MDPI stays neutral with regard to jurisdictional claims in published maps and institutional affiliations. |
© 2021 by the authors. Licensee MDPI, Basel, Switzerland. This article is an open access article distributed under the terms and conditions of the Creative Commons Attribution (CC BY) license (https://creativecommons.org/licenses/by/4.0/).