Abstract
In the present report, we offer a novel way for studying (via optical and digital means) features in Renaissance and Leonardo’s (and of course any other painter who followed this canon) paintings, based on a software that separately recognizes white, red, green, blue colors and measures the intensity of single bright spots in canvasses. After mapping the distribution of individual colors, the software proposes a trajectory considering the different geometrical and topological aspects. What we propose here is not just a variant of known methods for discovering the color distribution in a painting; on the contrary, it represents a new way to find unknown parameters in any Renaissance painting. In addition, via multispectral and hyperspectral analyses and image processing, the developed software permitted us to monitor the decay of some pigments in these canvasses at macro- and microscopic levels.
1. Introduction
The physical and chemical analysis of a Renaissance painting requires new digital tools and techniques to study styles, materials, layering processes and their processes of transformation over time and degradation. New algorithms and software for optical, spectroscopic methods, together with image processing, would enable art specialists and experts in materials to find fragments of the “author’s layer” that have survived after numerous restorations in Renaissance paintings. Automated image analysis techniques help the attribution process of paintings and allow finding of unknown motives and features of painting styles. Software for analyzing images at different levels should help conservators and restorers to locate image fragments that have disappeared during the aging process of the painting and various processes in the layers of the painting. The topography of the paintings is three-dimensional. Usually, experts study the stratigraphy of layers in Renaissance paintings. Digital analysis of the distribution of layers along the plane of the painting can provide additional information for navigating the collection of samples for analysis. Additional opportunities for optical microscopy allow detecting the processes of aggregation and transformation of pigment particles and ground particles and binders. It also makes it possible to distinguish between fragments of a painting after restorations at different periods of time by the packing density of pigment particles and their mutual orientations.
One interesting example is finding new style features of Leonardo’s school. In our previous article, we presented the “radial distribution” of elements in images of the Madonna and Child [1]. In the present article, we disclose an analysis of the distribution of “hot spots” in Madonna and Child paintings as well as in other Leonardo school works of art. Geometric distribution of “hot spots” may have been one of the techniques used by Leonardo to achieve special visual effects. Connecting hot spots by using line segments into groups is reminiscent of inventing constellations of stars in the night sky. In Leonardo’s school, such “constellations” of “hot spots” are almost always found in our research in Leonardo’s work. The digital tools for the analysis of the stratigraphy and topography of Renaissance paintings are an important part of the physicochemical methods for the analysis of materials and technologies from the Renaissance period. Describing software for recognizing such patterns in paintings is the purpose of this article.
2. Methods
2.1. Software at the Macroscopic Level for Optical and Spectroscopic Examination of Paintings
To study the distribution of different colors and their shades along a given coordinate, a special software was written that analyzes the colors reflected from the surface of the painting. This software analyzes the distribution in the Red, Green, Blue (RGB) or cyan, magenta, yellow, and key (CMYK, i.e., black) color models. The software allows one to select any color coordinate or several coordinates in the RGB or CMYK color models. After choosing these coordinates, mapping was carried out in the XY space of the canvas. Thus, the software builds a picture of the distribution in the XY geometric space of a certain color or color’s tone and measures the intensity of the reflected diffusive color of a specific color. The software measures the reflection intensity of white diffuse light (RGB (255,255,255, the three-dimension coordinates in red, green and blue axes), and assigns a “pseudo colour” to each reflected light intensity. Each spot is coded by three different colors, representing the highest (red), medium (yellow) and lowest (green) intensities. The software for visualizing the measurement results connects points with approximately the same intensity of the reflected color and makes an approximation of a function that corresponds to such a connecting curve. For the diffuse white color from light reflected from the surface of the painting, the software generates groups of lines connecting points with white color. These groups of lines, with a deviation of up to 12–15%, were approximated by a “golden spiral”-like or with a deviation of up to 17–22% by a “logarithmic” spiral. The software builds the XY distribution with a certain probability that the researcher can put into the software interface. This allows for statistical analysis of the color distribution on the image of a painting and permits identification of certain “colour maps” or “hidden signs” or specific motifs made by artist with a statistical probability. Analysis of the distribution of points in Leonardo’s different “Madonna and Child” paintings with diffuse white color makes it possible to look for the white pigments that Leonardo used, namely lead oxides, calcium carbonate or zinc oxide.
The software we have developed is written in C++ language to run on Windows OS and it requires an input of a painting image with at least 300 dpi resolution. Through image processing, all the contours in the painting were detected using OpenCV library. The accuracy and reliability depend on the condition of the painting and the quality of its image that is inserted in the software. A smartphone application for Android is being developed based on the described software. It will have an additional functionality allowing capturing a picture of a painting with the smartphone camera. We intend to distribute it on Google’s Play Store.
2.2. Software at the Microscopic Level
Paintings are, in general, characterized by the use of several layers. Each of the layers is a heterogeneous mixture of pigment particles ranging in size from microns to tens of microns. Priming and color layers are composed of pigment particles in a binding medium. The quality, distribution of pigment particles by size in paint, standardization from portion to portion of paint or material (paint’s batch to batch) of impregnation in the Renaissance period depended on the conditions of each workshop, school, artist.
Thus, during the application of the coloring layer in the period of painting, the pigment particles were distributed with varying densities of the number of particles in the volume of the coloring layer. The different levels of packing of the pigment particles relative to each other is a parameter that distinguishes different schools or artists of the Renaissance period. Additionally, when applying paint, pigment particles are distributed depending on the hydrodynamics of applying a viscous liquid layer of paint and depend on the parameters of the technique of applying the paint layer of each artist. The degree of packing of the pigment particles, the presence of a certain order in the arrangement of the pigment particles, and the orientation of the distribution of the particles during the application of the coloring layer are parameters that can be found using our digital tool that processes images from a stereomicroscope examination.
The software measured the distances between the pigment particles and built segments between the centers of the particles. The degree of packing and determination of the order was carried out using an algorithm of several approximations (Voronoi diagrams and other types of triangulation and optimization).
In contrast to ordered media, it is less obvious how one can reliably distinguish two amorphous yet structurally different heterogenic materials. In our software, we used a topological tool based on distance between disordered structures that compares local graph neighborhoods of the microscopic pigment particle centroid networks. Leveraging structural information contained in the neighborhood motif distributions, the new metric allows an interpretable reconstruction of equilibrium and non-equilibrium phase spaces and embedded pathways from static system snapshots alone.
Applied to single pigment particle resolution imaging data, the framework recovers ordering without prior knowledge about the underlying dynamics. Extending our geometric analysis to pigment particle distribution, we found a neighborhood size distribution.
3. Results
Figure 1 shows the Madonna Litta (painted by Leonardo and school ca. 1490, now at the Hermitage in St. Petersburg) and its interpretation by our software. Figure 1A is the canvas as such, 1B is its exploration by the software, inserting the three color levels on each brilliant spot and 1C is the final result showing the golden section both as standard geometrical measures (thin squares and rectangles) as well as a logarithmic spiral (thick yellow line). Let us investigate how the golden spiral on the bodies of the Madonna and Child was constructed (note that we follow the single color called “incarnato”, i.e., flesh or skin color in the two figures): the spiral originates on a bright spot on the shoulder of the Child (No. 1), it continues on an equally bright spot on the side of its belly (No. 2), it takes an abrupt upward turn on spot 3 (this time on the revers of the mantle of the Madonna, but having the same color hue as the bodies’ flesh), it continues on an equally intense spot just below and on the right side of the Madonna’s neck and has its fifth point on a brilliant spot on the front of the Madonna. As the viewer’s eye follows this spiral, it will enter in resonance with the unique atmosphere (unsuspected by the naïve observer) emanating from the figures on the canvas.
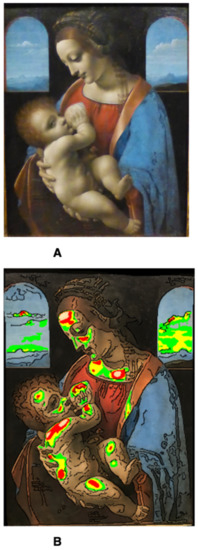
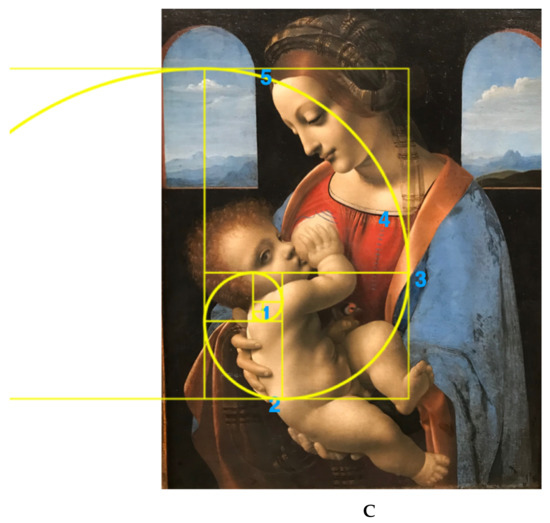
Figure 1.
(A): Madonna Litta (Hermitage, St. Petersburg); (B): its rendition on mapping of “hot spots” of individual colors by our software; (C): construction of the golden rule (thin squares and rectangles) based on geometrical ratios of various lengths and the golden spiral (thick yellow).
The software receives, as an input, a captured painting image and calculates the distance in the RGB color space of each pixel color to a selected white color (the optional colors for selection are white, red, green, blue). A mapping of the image is created where the software uses a red color to present the pixels in which the distance from the selected white color is the closest range, yellow color in the further range and green in the furthest range. The ranges are manually adjustable by the user or automatically by software to find patterns in the painting.
Figure 2 shows the construction of a golden spiral on Madonna Benois (painted by Leonardo in 1478–1482, now at the Hermitage in St. Petersburg). Here, Figure 2A shows how the software encodes the different bright spots in the bodies of the two figures. However, here the golden spiral can be constructed in two ways: in Figure 2B, the spiral originates on a brilliant spot on the right cheek of the Madonna (No. 1), it continues on her nose (No. 2) and on her front (No. 3), it twists around on a bright spot on the right side just below her neck to reach a fifth point on the front of the Child. Figure 2C show another way to construct the spiral: here it has its origin on the right hand of the Madonna (No. 1), it continues on a brilliant spot on the right leg of the Child (No. 2), followed by his left shoulder (No. 3) to swing upwards on the fronts of the Child (No. 4) and of the Madonna (No. 5).
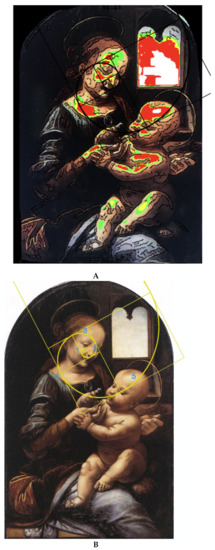
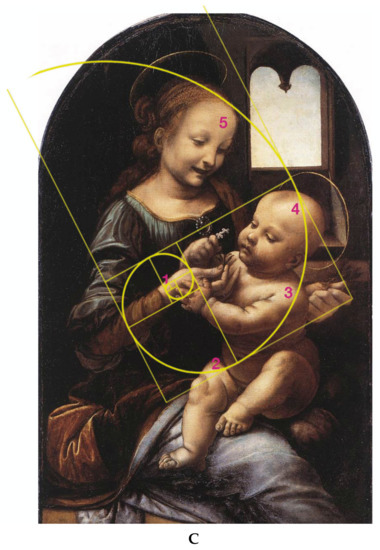
Figure 2.
(A): Madonna Benois (Hermitage, St. Petersburg) rendering based on mapping of “hot spots” of individual colors by our software; (B): construction of the golden spiral (thick yellow curved line) starting from the right cheek of the Madonna (1) and ending with the left side of the head of the child (5); (C): construction of a second golden spiral (thick yellow curved line) starting from the right wrist of the Madonna (1) and ending with the center of her front (5).
Figure 3 shows the same set of analyses performed on the Madonna del Garofano (painted by Leonardo ca. 1473 and housed at the Alte Pinakothek of Munich). Figure 3A exhibits the distribution of hot spots as mapped by the software on the two bodies. Figure 3B shows the golden spiral constructed by starting at the right cheek of the Child (No. 1) and continuing on to his front (No. 2). The trajectory extends to a bright spot on his right shoulder (No. 3) to swing up to the hand of the Madonna (No. 4) and finally to the tip of her nose (No. 5). This is not the only solution. As shown in Figure 3C, the spiral can have, as a starting point, the lips of the Madonna (No. 1), continuing on to her throat (No. 2) and her front (No. 3). It is also seen in the right side of the Child’s front (No. 4) to the hand and up to the wrist of the Madonna (No. 5). In both cases (Madonna’s Benois and Garofano), a viewer could enjoy the two canvasses by exploiting either of the two (or both) spirals.
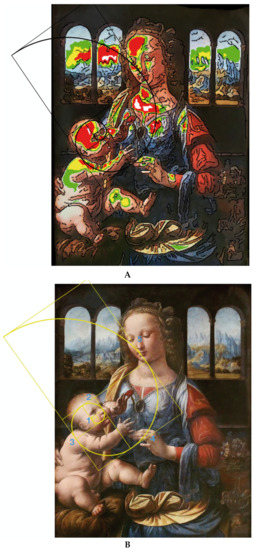
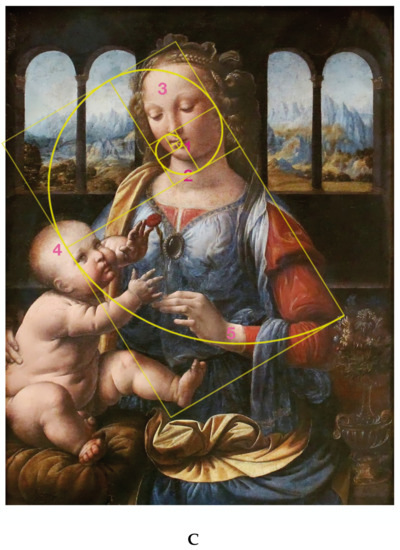
Figure 3.
(A): Madonna del Garofano (Alte Pinakothek, Munich) representation based on mapping of “hot spots” of individual colors by our software; (B): derivation of the golden spiral (thick yellow curved line) starting from the right cheek of the Child (1) and ending with the tip of the nose of the Madonna (5); (C): construction of a second golden spiral (thick yellow curved line) starting from the chin of the Madonna (1) and ending with her left wrist (5).
We have also turned to non-religious paintings and analyzed a very famous portrait, La Belle Ferronnière (portrait of a noble lady), painted by Leonardo in around 1490–1495 and housed at the Louvre in Paris. Figure 4A displays the pattern of hot spots mapped by the software on the body of the dame and Figure 4B offers the spiral created by our program. The spiral starts on a bright spot just below her left eye (No. 1), continues on to two points on her front—one at the center (No. 2) and one just above the right eye (No. 3). It then swings down to the center of her chin (No. 4) to finally reach the fifth point on the very top of her left shoulder.
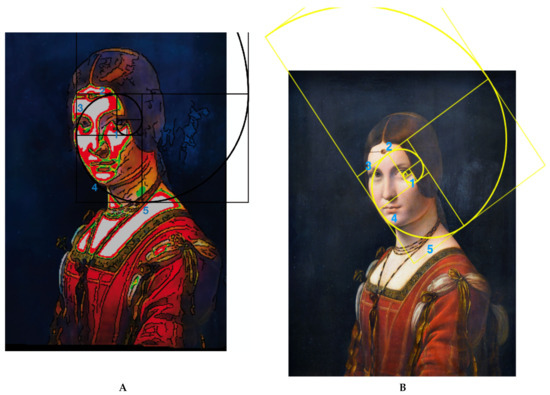
Figure 4.
(A): La Belle Ferronière’s (portrait of a noble lady, Louvre, Paris) transformation based on mapping of “hot spots” of individual colors by our software; (B): derivation of the golden spiral (thick yellow curved line) starting from a brilliant white spot under her left eye (1) and ended with a hot spot on her left shoulder (5).
One would have to test our software against negative controls, of course. We have stated that, in general, any medieval or Gothic painting would not follow the golden rule, simply because the knowledge of this canon in art and architecture had been lost after the fall of the Roman Empire. We could display any such a control. We have selected an altarpiece painted on a wooden table by Bernando D’Addi in 1345 (thus relatively late Gothic, present at the National Art gallery in Washington DC) a Madonna and Child with Saints and Angels, as shown in Figure 5A. Figure 5B shows the pattern of hot spots assessed by our software: it can be seen that there is a completely random distribution and therefore it is not possible to construct either a geometrical golden ratio nor a logarithmic spiral as in all previous figures. This applies to very many Gothic paintings that we have so far analyzed as well as to other Renaissance paintings of Leonardo’s time, in which the GS was absent.
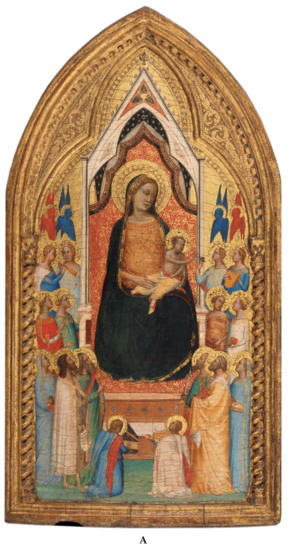
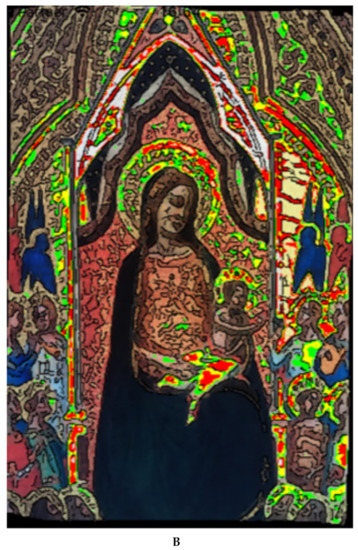
Figure 5.
(A): Altarpiece on a wooden table by Bernando D’Addi (National Art gallery in Washington DC) representing a Madonna and Child with Saints and Angels. (B): Its rendering based on mapping of “hot spots” of individual colors by our software. This is clearly a negative control on which no golden rule nor golden spiral can be drawn and it essentially epitomizes all Gothic paintings.
We also used Fayum mummy portraits and Encaustic images as negative controls. We did not find geometric patterns of chiaroscuro as we found in Leonardo’s paintings. The use of volumetric light-shadow modeling of forms in the Hellenistic encaustic technique as a predecessor of the Leonardo style can be assessed with the help of our software.
Yet, as stated in the introduction, our software, via multispectral and hyperspectral analyses and image processing, could also monitor the decay (if any) of pigments in the paintings of the Maestro. We have taken as an example the famous drawing Madonna Litta, in which it is known that Leonardo used, as a blue pigment, azurite (a copper carbonate of blue color, an analogue of lazurite, a tecto-silicate of complex sodium calcium aluminum silicate sulphate formula, which forms the bulk of the precious stone lapis lazuli). Lapis lazuli has been mined for centuries from a location still in use today in the mountain valley of Kokcha, Afghanistan. In Europe, this expensive powdered pigment was also called ultramarine, which literally means over the sea. During the Renaissance, Raphael, Leonardo da Vinci and Michelangelo Buonarroti used this pigment. On the contrary, azurite, as just stated, is composed of mineral basic copper carbonate, found in many parts of the world in the upper oxidized portions of copper ore deposits. The azurite mineral is usually associated in nature with malachite, the green basic copper carbonate that is far more abundant. Azurite was the most important blue pigment in European paintings throughout the middle ages and Renaissance, since it was much less costly than lapis lazuli. It might be expected that azurite, over the centuries, as canvasses are exposed to humidity, might slowly convert into malachite via a hydration process. Ultimately, then, the blue mantle of the Madonna Litta would turn from blue to green. Indeed, our software shows that this process has already begun in quite a few areas of the painting (Figure 6). Figure 7 shows a preparatory drawing of Madonna Litta’s mantle made by Boltraffio. See the text for explanation of the blue and yellow arrows. Figure 8 is a cross-section sample from the blue part of a Renaissance painting with priming, a warm brown underlayer, and black or dark gray layer blue paint. The triangulation shows the lazurite particles inside painting layer. White circles are centers of triangulation made by our software for identification of level of order between pigment particles. The malachite color in RGB color code coordinates is (11, 218, 81). The lapis lazuli color in the RGB color code is (18, 10, 143). Azurite stone color in RGB code is (0, 127, 255).
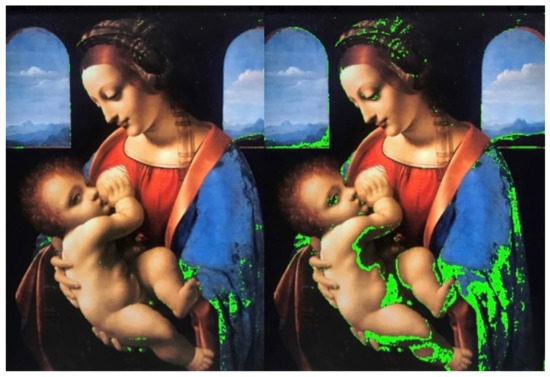
Figure 6.
Monitoring the decay of azurite in the Madonna Litta painting via multispectral and hyperspectral analyses. The green areas show the progressive transformation of azurite (blue) into malachite (green) via a hydration process. For control, see Figure 1A. Malachite color in RGB color code coordinates is (11, 218, 81). Azurite stone color in RGB code is (0, 127, 255). (left) Malachite color spots locations on azurite color background; (right) distribution of other green tones on azurite color background.
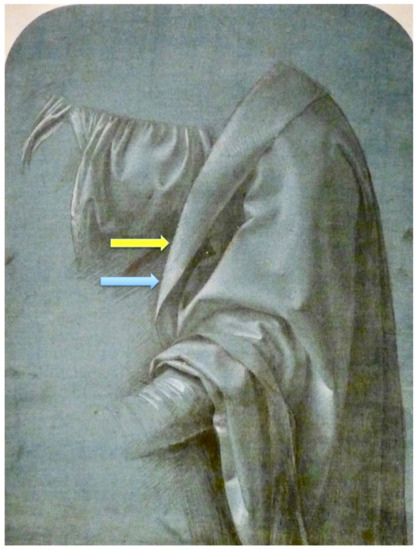
Figure 7.
Preparatory drawing of Madonna Litta’s mantle made by Boltraffio. See text for explanation of the blue and yellow arrows.
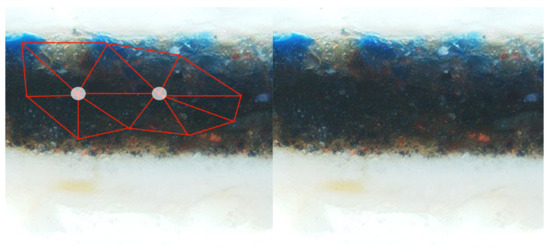
Figure 8.
Cross-section sample from blue part of Renaissance painting with priming, a warm brown underlayer, and black or dark gray layer blue paint. Triangulation of lazurite particles inside painting layer. White circles are centers of triangulation made by our software for identification of level of order between pigment particles. This is analysis of part of image (Figure 5) from (https://heritagesciencejournal.springeropen.com/articles/10.1186/s40494-020-00382-3, accessed on 2 March 2021) by our software to identify order in pigment particle distribution. This analysis demonstrates possibilities of using this software for identification of a specific order and packaging of pigments at the microscopic level. Packaging parameters and order are specific signatures of the artist, school and period of time when the picture was created.
4. Discussion
4.1. Leonardo’s Paintings and the Golden Spiral
There is such an extensive literature on the golden ratio that it would be impossible to cover it in the present report. In any event, this is outside the aims of our scientific investigation. We here list a number of books published in this domain [2,3,4,5,6,7,8,9,10,11,12,13,14,15,16,17,18].
To start with, we suggest that, by adopting the GS canon in religious paintings with just the Madonna and Child, Leonardo wanted to create a special, intimate feeling emanating from the two bodies and show the humanity inherent to such a relationship between a mother and her offspring. This is a far cry from the byzantine icons where everything was hieratic and humanity was entirely suppressed in favor of a spiritual relationship. For instance, in the representations of the Virgin Hodegetria (Greek term meaning “she who points the way”), in which the Virgin Mary holds the Child Jesus at her side while pointing to him as the source of salvation for humankind, only hieratic feelings are expressed, leaving aside any human relationship between mother and child. The Virgin’s head usually inclines towards the child, who raises his hand in a blessing gesture. Moreover, the Child is dressed in regal robes, in contrast to the almost naked figure of the baby in most renaissance tables. The canon of the golden rule, thus, underlies the harmony and beauty of the universe, especially in the form of the golden spiral, as found here in some of Leonardo’s paintings. In the firmament, one can observe its expression in the galaxies that typically assume the form of spirals. Here on earth, one can note its presence throughout nature’s forms, e.g., ferns, flowers (such as the sun flower), succulents (saucer plants, such as Aeonium tabuliforme and Aeonium urbicum, showing even multiple spiral arrangements), seashells (the Nautilus and a very large variety of other shells), even hurricanes.
It is not possible to know when Leonardo started adopting the golden rule in some of his paintings, since less than half of his manuscripts have survived. As an example, when Francesco Melzi, his pupil, left France and returned to his villa in Vaprio D’Adda, he had with him 18 manuscripts of his Trattato della Pittura. Today, only six are known. What were the contents of the missing ones? Will we ever know? We suggest that Leonardo preferentially used the golden spiral rather that the simple golden rule, since the former is more inspiring and more intriguing to the viewers of his canvasses. We believe that Leonardo arrived at elaborating the golden spiral by sectioning conical seashells (easily available during his stay in Florence and visits to Pisa) and noticing the unique harmony of their growth in a spiral form. It is thus reasonable to assume that the Maestro used this biological inspiration, in a tri-dimensional structure, to reproduce it into the two-dimensional space of his canvasses. This might not be far from the truth if we examine, in detail, Figure 1C, showing the shape of the spiral in the Madonna Litta painting. Four points of the spiral (Nos. 1, 2, 4 and five) lie on the bodies of the Child and the Madonna, but this would not have resulted in a correct spiral. He needed a fifth point, which is to be found on a bright spot (No. 3) in the brown ribbon on the blue mantle of the Madonna. It should be noted that this bright spot has the same tinge and hue of the “incarnato” in the bodies of the two figures. There would have been no reason to place this bright, flesh-colored spot on the mantle ribbon unless he knew a priory that it was needed in order to obtain the correct shape of the golden spiral. Such harmonious spirals are also quite evident in the other paintings analyzed (see Figure 2, Figure 3 and Figure 4) and are confirmed too by the standard geometric ratios depicted in the black squares and rectangles imposed on each of the four paintings. There might be an aesthetic reason why Leonardo preferred the spiral arrangement: the eye of the viewer would be captured by the sinuosity of the spiral and this would ingenerate in him a kind of contemplative ecstasy, not dissimilar from the “Stendhal syndrome”. As additional information, we note here that Leonardo possibly did not make paintings of crucifixion of Jesus. The distribution of figures in these iconic representations are based on rectangular geometric arrangements of personages and difficult to be reduced to the golden section canons. On the contrary, in Gothic paintings, where knowledge of the golden rule was absent, crucifixions are very popular, since these painters had adopted rectangular and triangular schemes as canons of their layouts for their figures. We additionally remark here that, although there have been reports of the canon of golden ratio in the most famous painting the Mona Lisa, most of them drawn geometrically, the only report that traces a golden spiral on the same painting does not give a clue nor the positioning of a minimum of five points needed to generate it, so that such attribution appears to be quite arbitrary.
4.2. Potential Controversial Issues
Towards the end of the XX century, a bitter debate and polarizing conflict arose on the golden section (GS) topic, with quite a few authors rejecting it altogether (see [19,20,21] to quote only a few)—e.g., Maor [21] states: “this subject has (at least in my opinion) been grossly overplayed by generations of number enthusiasts obsessed with finding hidden numerical meanings in everything from the Great Pyramid in Egypt to the music of Mozart”. It would thus appear that this is a topic that inspires people in a wide range of disciplines to write about, but also one that most people do not seem to fully understand. Therefore, it is not uncommon to find articles by some people claiming the golden ratio to be much more than it really is, and articles by others trying to refute and debunk everything about it. We believe that one very recent book [18] by Meisner offers a very balanced view of the field, driven by his very high competence in the field and we recommend his work to dissipate the fog in this arena. It is at least comforting to us that Meisner fully acknowledges the fact that Leonardo did use GS in several of his works and exploited this concept to permeate his canvasses with harmony (even though some authors have claimed that Leonardo had no ideas about GS and of course never used it). The following sentence of Leonardo confirms his full knowledge of GS: “Vedesi inelle montagnie di Parma e Piacenzia le moltitudine de’ njchi e coralli intarlati, ancora appiccati alli sassi; de’ quali, quand’io facevo il gran cavallo di Milano, me ne fu portato un gran sacco nella mia fabbrica da certi villani, che in tal loco furon trovati” (Leicester Codex, folio 9r) (one can see in Parma and Piacenza mountains a multitude of shells and corroded corals, still bound to rocks; of which, when I was working at the giant horse in Milano, I had a gift of an entire sac by farmers, who found them in this region). It cannot have taken much for Leonardo to section conical shells and bring to light the inner spiral.
There still remains an unanswered question: could we have had a bias in our work and discovered something (the GS) we were looking for even prior to starting this project, in this way bending our data towards something that had nothing to do with Leonardo’s art? We have an answer to this fundamental question, thanks to the opportunity we had to analyze in detail not only the Madonna Litta, but also his preparatory drawings made by Leonardo’s pupils, which had been exhibited at the Poldi Pezzoli museum (Figure 7). This picture represents the preparatory drawing of Madonna Litta’s mantle executed by Boltraffio, believed to be the best pupil in Leonardo’s atelier. It was customary, in the Renaissance, to have the scholars of a maestro to depict some preparatory drawings of parts of a canvas that would later on be executed by the head of the school himself. This drawing, made to the same dimensions of the final Madonna Litta canvas, was carried-out on a greyish-bluish high-quality paper (in those days produced in Fabriano via maceration of cotton rags). It was brought to our attention by Dr. Andrea di Lorenzo, curator of the Poldi Pezzoli exhibition, that the point of light in the reverse of the mantle (see blue arrow) was much too low as compared to the final Leonardo painting (see yellow arrow and compare it to the point of light No. 3 in the spiral of Figure 1C). This suggests to us that Leonardo, having the golden spiral in mind, realized that if this point of light had been placed as in Boltraffio’s drawing, it would have disrupted the spiral, thus forcing him to place it in the right position to generate the correct shape of the spiral. This very important detail suggests to us that our interpretation of this famous painting is fully correct and that we had no bias in mind but followed rigorous scientific protocols.
4.3. On the Pigment Decay in Canvasses
As shown in the two panels of Figure 6, it would appear that the blue mantle in the Madonna Litta, thought to have been colored with azurite, seems to have been slowly converted into malachite (green). A visitor to the Metropolitan Museum of Art of New York City would certainly notice the Madonna and Child Enthroned with Saints (also known as the Colonna Altarpiece), painted by Raphael, c. 1504. The painting was drawn on wood using oil and gold on a 172.4 by 172.4 cm frame. It is stated that, for the Madonna’s blue mantle, Raphael used azurite. At a close-up inspection, the same visitor would notice that the azurite blue of the Virgin’s mantle has darkened due to its degradation into green malachite and now this mantle looks greenish to the naked eye. The Madonna Litta masterpiece was exhibited at the Poldi Pezzoli museum in Milano for a couple of months early in 2020. We visited this exhibition a few times and accurately checked the Madonna’s blue mantle in search for any greenish hue, but none could be detected by naked eye and the only signs for this color decay could be revealed by our newly developed software. How do we reconcile these discrepancies, considering that most art historians state that here azurite was used by Leonardo, just as in the case of Raphael, and that the two paintings are coeval? The only explanation we can offer is that perhaps Leonardo did not adopt pure azurite but admixed it with other blue pigments, e.g., lapis lazuli (ultramarine), Egyptian blue, maybe even smalt (ground cobalt glass). Leonardo loved to play around with pigments and admix them until he obtained the special hue he was dreaming of. This being the case, such a mixture might have masked the slow decay process of azurite into green malachite.
There are other mysteries in the two panels of Figure 6 that need decoding. A greenish hue also appears in the elaborate knots in the hairs of the Madonna, well visible in the right panel. It is quite likely that in this region Leonardo used the umber pigment (natural brown or reddish-brown earth pigment that contains iron oxide and manganese oxide) that should not decay into a green shade [22]. Yet here too we suggest that Leonardo might have admixed umber with some azurite, in order to obtain a special color hue variation. If so, this would explain the appearance of the malachite green. The same could apply to the eye sockets of Madonna and Child, where here too some greenish hue begins to appear (see right panel). We suggest that Leonardo might have admixed his various white pigments (lead oxides, calcium carbonate and zinc oxide) with some azurite, in order to darken this area around the eyes, as it occurs in vivo. It is thus seen that Leonardo’s paintings are a Pandora’s vase of unexpected marvels. We would like to close here by citing a few recent manuscripts that deal with color changes of pigments due to ageing [23,24,25].
4.4. Are There Hidden Patterns in Particle Distribution?
Upon casual glance, the pigments’ particle distribution in the painting might appear randomly placed. However, hidden patterns can appear (see Figure 8). This is a main feature of possible particle orientations and aggregations in the period of painting, polymerization of binders and aging. In the Renaissance period, it was difficult to expect standardization of pigment particle preparation and the painting process. Each pattern of particle networks can indicate some specific artist or school.
5. Conclusions
There is no denying that Leonardo had a profound effect on the painters of Lombardy and, in a short time, of all of Europe during his lifetime and after his death. When he arrived in the fiefdom of Lodovico il Moro in Milano in 1482, he found most artists and painters still dragging their feet in the late Gothic style. When he terminated his altar piece in the San Francesco church on the “Madonna, il Bambino, San Giovannino e l’Angelo” even established painters such as Bergognone and Vincenzo Foppa quickly adopted his revolutionary Renaissance style. Additionally, when he terminated l’Ultima Cena in the refectory of S. Maria delle Grazie, painters flocked down to Milano from all over Europe and everybody realized that it was the final blow to residual Gothic art. All Middle Age frescoes of the Last Supper in churches all over Italy were flat and devoid of any expression, but here Leonardo had made a “tableau vivant”, theatrical in the gestures and glances of the twelve apostles, which amazed the viewers. During his life and after the death, his four disciples (Marco d’Oggiono, Antonio Boltraffio, Andrea Solario and Gian Giacomo Caprotti, nicknamed Solaino) followed his style and teachings so closely that even today it is hard to distinguish their canvasses from those of the Maestro. After his death, his disciples kept propagating Leonardo’s style and made further conversions among the painters of their epoch. Additionally, even after Marco d’Oggiono and Andrea Solario died on a 1524 plague epidemic a second generation of “leonardesque” painters arose, among them Bernardino Luini, Pietro Rizzoli, the Giampietrino, and Cesare Magni, who kept the figure of the Maestro alive.
In conclusion, our software, based on mapping of “hot spots” of individual colors, appears to be a robust tool for searching for the presence of any golden ratio in any painting, not just Leonardo’s but anything created after him up to the present day. There is another important reason why we started developing this software—namely, in order to increase the probability of finding the original “author layer” in paintings that have undergone extensive restoration. After such manipulations, over a period of at least 500 years, there is a big challenge in discriminating the original author hand from restoration layers, as we observed in the case of “Donna Nuda” [26]. Our software is a navigation tool for more targeted sampling for chemical analysis. Our software also underlies another important aspect we have detected by oversaturating any individual color in his canvasses: the need to explore chemical composition of his paintings because in present times the colors look different than at Leonardo’s time. For example, green is very rare in his paintings and indeed our multispectral and hyperspectral analyses show that the appearance of a greenish hue in Madonna Litta’s mantle seems to be due to the conversion, over the centuries, of the pigment azurite into green malachite.
We would like to add other observations/hypotheses pertaining to the work here presented. Leonardo’s period of painting should be considered taking into account the fact that he lived during a period of Great Geographical Discoveries (the expeditions of Columbus, Magellan and other travelers). Technology and materials from all over the world, discovered by Europeans, influenced Leonardo’s school. Additionally, the influence of older styles, techniques and materials on the school of Leonardo is interesting. One and a half thousand years before him, tempera appeared in Fayum portraits mummies in Egypt. Additionally, painting techniques from Byzantium might have influenced his style. It will be very interesting to explore common features using our software. Note that the search for hidden signs in Leonardo’s paintings should be carried out as a projection of the state of knowledge and religion of that period. The absence of scenes of the crucifixion of Christ resembles the permission at that time in Eastern countries to translate the New Testament into local languages, but without mentioning that Christ was crucified and then resurrected. The active missionary activity of the travelers was adapted to the customs and laws of the newly discovered lands.
6. Addendum
Although not directly pertinent to the topic dealt with here, at the request of one referee we added a list of representative references to analytical and spectroscopic techniques used up to the present of analysis of wood/canvas paintings. To start with, an in-depth survey of a variety of methods for exploring Cultural Heritage was proposed in 2016 by Dallongeville et al. [27]. This review is extraordinary not only because it is 77 pages long, but also because it quotes no less than 603 references, a bibliographic list rarely seen in any review article. Yet, we will cover here some important developments that occurred during the four years (2017 to 2020) not surveyed by these authors.
Nuclear Magnetic Resonance—Mobile Universal Surface (NMR-MOUSE) Explorer and Attenuated Total Reflection-Infrared Spectroscopy (ATR-FTIR) have been used to differentiate among gelatin, parchment and vegetable leather [28]. Mobile stray-field NMR has been used for analysis of stratigraphies in paintings and frescoes, as well as the assessment of material states changing under the impact of aging, conservation, and restoration [29]. External Reflection, Fourier Transform Infrared Spectroscopy (ER-FTIR) has been adopted for the identification of paint binders in works of art on parchment. In particular, gum Arabic (a complex mixture of glycoproteins and polysaccharides) could be discriminated from egg-based binders such as egg yolks and egg whites [30]. A mixed method, based on NMR (1H, 13C, COSY, HSQC, HMBC, INADEQUATE) coupled to HPLC-DAD-MS and GC–MS has been exploited to solve the molecular structure of the medieval blue watercolor known as folium (an extract of the plant Chrozophora tinctoria to produce colors for illuminated manuscripts) [31]. Albertin et al. [32] have developed X-Ray Computed Tomography (CT) in situ for Cultural Heritage investigations. Since medical CT scanners are too bulky to be carried around, they developed two instruments, one light and flexible for investigating medium-size objects with a resolution of a few tens of microns, and a second one designed for analyzing larger objects, up to 200 cm. Busse et al. [33] devised an NMR relaxometry method for monitoring oil paint binders. They observed nonlinear dependences of the relaxation times on the pigment concentration in a typical oil binder. However, estimating the age of a painting stored under unknown conditions from NMR relaxation data was deemed not feasible, since the cumulative effects of light irradiation, humidity, and biological degradation would obfuscate the chemical and physical impacts of aging on the relaxation times.
Author Contributions
Software and validation, G.Z. and R.Z.; Project administration, S.Z.; Methodology, U.M.; Writing—review and editing, P.G.R. All authors have read and agreed to the published version of the manuscript.
Funding
This research received no external funding.
Institutional Review Board Statement
No humans or animals were involved in this study.
Informed Consent Statement
Informed consent was not needed since humans or animals were not involved.
Data Availability Statement
Not applicable.
Acknowledgments
We are grateful to Andrea di Lorenzo, Curator, Poldi Pezzoli Museum in Milano, for useful comments and suggestions.
Conflicts of Interest
The authors declare no competing financial interests.
References
- Zilberstein, G.; Zilberstein, R.; Zilberstein, S.; Righetti, P.G. Radial distribution of figures in Leonardo’s and renaissance painting. Digit. Appl. Archaeol. Cult. Herit. 2021, 20, e00178. [Google Scholar]
- Pacioli, L. De Divina Proportione; Luca Paganinem de Paganinus de Brescia (Antonio Capella): Venice, Italy, 1509. [Google Scholar]
- Huntley, H.E. The Divine Proportion: A Study in Mathematical Beauty; Dover Publications: New York, NY, USA, 1970. [Google Scholar]
- Runion, G.E. The Golden Section; Dale Seymour Publications: Menlo Park, CA, USA, 1972. [Google Scholar]
- Herz-Fischler, R. A Mathematical History of Division in Extreme and Mean Ratio; Wilfrid Laurier University Press: Waterloo, ON, Canada, 1987. [Google Scholar]
- Herz-Fischler, R. A Mathematical History of the Golden Number; Dover Books on Mathematics: New York, NY, USA, 1987. [Google Scholar]
- Vajda, S. Fibonacci and Lucas Numbers and the Golden Section: Theory and Applications; Courier Corporation: North Chelmsford, MA, USA, 1989. [Google Scholar]
- Dunlap, R.A. The Golden Ratio and Fibonacci Numbers; World Scientific Publ. Co.: Singapore, 1997. [Google Scholar]
- Walser, H. The Golden Section; Mathematical Association of America: Washington, DC, USA, 2001. [Google Scholar]
- Livio, M. The Golden Ratio: The Story of Phi, the World’s Most Astonishing Number; Broadway Books: New York, NY, USA, 2002. [Google Scholar]
- Olsen, S.A. The Golden Section: Nature’s Greatest Secret; Bloomsbury: New York, NY, USA, 2006. [Google Scholar]
- Posamentier, A.S.; Lehmann, I. The Fabulous Fibonacci Numbers; Prometheus Books: Amherst, NY, USA, 2007. [Google Scholar]
- Hemenway, P. The Secret Code: The Mysterious Formula that Rules Art, Nature, and Science; Taschen GmbH: Cologne, Germany, 2008. [Google Scholar]
- Stakhov, A. The Mathematics of Harmony: From Euclid to Contemporary Mathematics and Computer Science; World Scientific Publ. Co.: Singapore, 2009. [Google Scholar]
- Posamentier, A.S.; Lehmann, I. The Glorious Golden Ratio; Prometheus Books: Amherst, NY, USA, 2011. [Google Scholar]
- Friedman, R.; Cross, M. The Golden Ratio & Fibonacci Sequence: Golden Keys to Your Genius, Health, Wealth & Excellence; Hoshin Media: New Canaan, CT, USA, 2013. [Google Scholar]
- Hauser, F.D. The Golden Ratio: The Facts and the Myths; Createspace Independent Publ.: Scotts Valley, CA, USA, 2015. [Google Scholar]
- Meisner, G. The Golden Ratio—The Divine Beauty of Mathematics; Race Point Publishing: New York, NY, USA, 2018. [Google Scholar]
- Markowsky, G. Misconceptions about the Golden Ratio. Coll. Math. J. 1992, 23, 2–19. [Google Scholar] [CrossRef]
- Höge, H. The Golden Section Hypothesis—Its Last Funeral. Empir. Stud. Arts 1997, 15, 233–255. [Google Scholar] [CrossRef]
- Maor, E. Symbol of Perfect Proportions. Science 2003, 299, 1016. [Google Scholar] [CrossRef]
- Šustić, S. Paint handling in Leonardo’s Mona Lisa guides to a reconstruction. CeROArt 2014. [Google Scholar] [CrossRef]
- Gambardella, A.A.; Cotte, M.; De Nolf, W.; Schnetz, K.; Erdmann, R.; Van Elsas, R.; Gonzalez, V.; Wallert, A.; Iedema, P.D.; Eveno, M.; et al. Sulfur K-edge micro- and full-field XANES identify marker for preparation method of ultramarine pigment from lapis lazuli in historical paints. Sci. Adv. 2020, 6, eaay8782. [Google Scholar] [CrossRef] [PubMed]
- Coccato, A.; Moens, L.; Vandenabeele, P. On the stability of mediaeval inorganic pigments: A literature review of the effect of climate, material selection, biological activity, analysis and conservation treatments. Herit. Sci. 2017, 5, 1–25. [Google Scholar] [CrossRef]
- Schnetz, K.; Gambardella, A.A.; van Elsas, R.; Rosier, J.; Steenwinkel, E.E.; Wallert, A.; Iedema, P.D.; Keune, K. Evidence for the catalytic properties of ultramarine pigment. J. Cult. Herit. 2020. [Google Scholar] [CrossRef]
- Barberis, E.; Manfredi, M.; Marengo, E.; Zilberstein, G.; Zilberstein, S.; Kossolapov, A.; Righetti, P.G. Leonardo’s Donna Nuda unveiled. J. Proteom. 2019, 207, 103450. [Google Scholar] [CrossRef] [PubMed]
- Dallongeville, S.; Garnier, N.; Rolando, C.; Tokarski, C. Proteins in art, archaeology, and paleontology: From detection to identification. Chem. Rev. 2016, 116, 2–79. [Google Scholar] [CrossRef] [PubMed]
- Sendrea, C.; Carsote, C.; Badea, E.; Adams, A.; Niculescu, M.; Iovu, H. Non-Invasive characterization of collagen based materials by NMR-MOUSE and ATR-FTIR. Sci. Bull. B Chem. Mater. Sci. UPB 2016, 78, 27–38. [Google Scholar]
- Rehorn, C.; Blgmich, B. Cultural Heritage Studies with Mobile NMR. Angew. Chem. Int. Ed. 2018, 57, 7304–7312. [Google Scholar] [CrossRef] [PubMed]
- Nodari, L.; Ricciardi, P. Non-invasive identification of paint binders in illuminated manuscripts by ER-FTIR spectroscopy: A systematic study of the influence of different pigments on the binders’ characteristic spectral features. Herit. Sci. 2019, 7, 1–13. [Google Scholar] [CrossRef]
- Nabais, P.; Oliveira, J.; Pina, F.; Teixeira, N.; de Freitas, V.; Brás, N.F.; Clemente, A.; Rangel, M.; Silva, A.M.S.; Melo, M.J. A 1000-year-old mystery solved: Unlocking the molecular structure for the medieval blue from Chrozophora tinctoria, also known as folium. Sci. Adv. 2020, 6, eaaz7772. [Google Scholar] [CrossRef] [PubMed]
- Albertin, F.; Bettuzzi, M.; Brancaccio, R.; Morigi, M.P.; Casali, F. X-ray Computed Tomography In Situ: An Opportunity for Museums and Restoration Laboratories. Heritage 2019, 2, 2028–2038. [Google Scholar] [CrossRef]
- Busse, F.; Rehorn, C.; Küppers, M.; Ruiz, N.; Stege, H.; Blümich, B. NMR relaxometry of oil paint binders. Magn. Reson. Chem. 2020. [Google Scholar] [CrossRef] [PubMed]
Publisher’s Note: MDPI stays neutral with regard to jurisdictional claims in published maps and institutional affiliations. |
© 2021 by the authors. Licensee MDPI, Basel, Switzerland. This article is an open access article distributed under the terms and conditions of the Creative Commons Attribution (CC BY) license (https://creativecommons.org/licenses/by/4.0/).