Abstract
Remote sensing techniques, such as LiDAR and photogrammetry, are used by researchers exploring the spatial distribution of weathering features in historic masonry. These well-established tools provide users with a perspective of the processes affecting the surface of masonry blocks; however, they cannot provide information on the alteration occurring subsurface. Geophysical tools are being explored as a potential approach to observe the variation in material properties beneath masonry block surfaces and to examine the patterns of deterioration across wall sections. Applying such techniques inform the development of conceptual models of weathering at the block to building wall scale. In this study, ground-penetrating radar (GPR) was selected to inspect the subsurface condition of the wall section of an historic church wall, where areas of granular disintegration and flaking can be observed. 3DGPR was selected for this task, as its use of regular grids during data collection make it better suited for detecting features within an area. Three high-frequency antennas, 1.2 Ghz, 1.6 Ghz and 2.3 Ghz, were run across the study area in a series of 80 cm by 80 cm grids. The data were collated within GIS, where observed features were annotated onto a schematic of the wall surface. The 3DGPR outputs identified anomalies within this structure that could not have been as easily interpreted using a 2DGPR transect. However, as 3DGPR relies upon interpolative techniques to estimate the returns between observation transects, the validity of features detected in these locations need to be tested. The results of this application of 3DGPR identified variable weathering response across the wall section, relative to elevation. These observations were used to develop a conceptual model linking these findings to seasonal variation in the capillary rise of groundwater, upward from the base of the church wall. Through these findings it is possible to see how GPR can assist in developing our understanding of the processes threatening heritage buildings.
1. Introduction
The operation of weathering processes upon sandstone building facades leads to deterioration of block integrity and the loss of material. These processes are spatially variable in response at both the wall and the masonry block scale, with environmental variables, material properties and surface morphology believed to influence the varying rates or deterioration [1]. However, often the distribution of visible weathering features can appear to be chaotic in nature [2]. For this reason, new tools need to be explored to establish links between the spatial variables within the stone decay system and the eventual response. To monitor weathering, a series of spatial tools, including GIS, terrestrial laser scanning and photogrammetry, have been integrated into studies of stone decay in historic buildings [3,4,5]. These approaches only provide information relating to surficial alteration and do not provide specialists with an understanding of the impact of weathering processes operating in the subsurface.
Past research exploring subsurface weathering response has applied both destructive and non-destructive testing approaches [4]. Where experimental exposure blocks and wall sections are in use, a mixture of these approaches is acceptable. However, given the national, cultural and religious significance of many heritage monuments, destructive techniques are nearly always excluded.
Given this restriction, non-destructive geophysical techniques have been explored as part of the arsenal of tools available to the weathering researcher within the urban environment. Ground-Penetrating Radar (GPR) has previously been applied to monitor the condition of stone artefacts and to explore the existence of void spaces and cracks within the built environment [4]. For example, it has been used to detect the presence of graves and damaged stonework in the floor sections of European churches [6,7]. However, referring to the technique as ‘ground’-penetrating radar is a misnomer, as the technique can successfully operate across stone surfaces along the vertical plane, or even ceiling sections.
This paper applies 3DGPR to explore the presence or irregularities in the subsurface of a roughly finished sandstone wall. There are examples of the application of GPR across the surface of smooth wall sections with the goal of detecting voids, either intentionally placed or resulting from deterioration [8,9]. This technique has also aided in the detection of metal objects within wall sections, such as pins and bracings, supporting the findings of desk studies during restoration works [10]. All these examples demonstrate the effectiveness of this technique: however, they overlook the issues associated with the application of GPR to irregularly finished stonework. In this scenario, the roughness of the surface can impede the movement of the antenna, creating a discontinuous output dataset. Recent work at this study site involved the use of three different GPR antennas (1.2, 1.6, 2.3 GHz) of a manufacturer-supplied plastic cover sheet, which smoothed the irregular surface of the wall. This paper aims to expand upon our earlier findings [11] that only used 2DGPR to explore the potential of using multiple radar frequencies on the smoothing sheet to aid in the application of 3DGPR.
The application of 3DGPR to inspect historical masonry is a technique workflow in development. The authors are aware of examples where the toolset has been successfully applied for investigations seeking void spaces in floors [12]. However, examples of the application of 3DGPR upon a vertical wall surface are not common within contemporary literature.
2. Methodology
2.1. Study Site
The chosen site for this work was Fitzroy Presbyterian Church in Belfast, Northern Ireland (Figure 1). Belfast has a maritime temperate climate, which has traditionally been associated with mild, wet winters and cooler, drier summers. This seasonality will have affected the time of wetness for blocks within the city’s masonry structures [13]. As moisture is a well-documented control on the weathering process, the deterioration of stonework will relate to this variable.
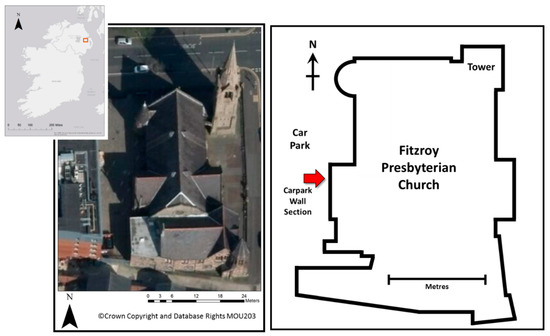
Figure 1.
Location of the study wall section on the Western face of Fitzroy Presbyterian Church, line map—author’s own work.
Belfast’s expansion during the 19th Century was rapid, driven by industrialization relating to the city’s position as a prominent port and shipyard. This church was constructed in 1874 as part of the expansion of the city’s residential housing to support these industries. For many of the historic buildings in the city, this led to exposure to high levels of pollutants and marine salts (Figure 2). In addition, the twentieth century saw high levels of anthropogenic pollutants, with sulphur dioxide (SO2) identified as the dominant pollutant influencing stone deterioration [14].
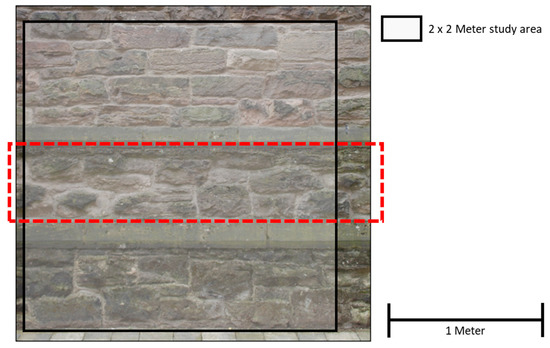
Figure 2.
The study area is a 2 by 2 meter area of the external wall of the church. This area crosses two sections of decorative string course which bound an area of observed surficial material loss and granular disintegration. The lower section of the wall is covered with moss and lichen, is visibly damp and is wet to the touch. The red-dashed box shows the area of interest (‘Middle Section’ on Figure 5, below), where stone disintegration is visibly stronger than above or below.
A 2 m by 2 m section of this wall was selected for this study due to concern related to observed areas of significant granular disintegration. This portion of the wall is subdivided by two lengths of decorative string course, inset using a secondary stone type. These horizontal string courses run through the area of interest at 60 cm and 130 cm from ground level and bound the area where the greatest granular disintegration is observed (red dashed box on Figure 1). The base of the wall section displays greening from mosses and algae growth. At the time of measurement, the wall section was also wet to the touch despite an extended period of dry weather. The wall section examined for this study is situated on the western façade of the building facing into a sheltered carpark. An issue with historic structures such as this location is that construction and repair records are not kept or available, resulting in many unknowns concerning the subsurface behind the visible building stones. At this site, discussions with the church warden suggests that the interior material is an irregular rubble fill of unsorted small masonry and gravel. This relates directly to our approach in using three high-frequency antennas, wherein the 2.3 GHz will likely image only the surface stones and thus be directly relatable to visual observation. If the comparability of the 2.3 GHz remains good with the 1.6 GHz and 1.2 GHz, then these two will be imaging the same stones: as comparison decreases with depth, so the lower frequencies will be penetrating whatever lies behind the surface stones.
2.2. DGPR
Despite the effective use of 2DGPR to detect anomalies within masonry objects, it can sometimes be difficult to interpret when considering the results in the context of a wider area. Using 3DGPR, it is possible to construct a clearer visualization of an object of interest through the interpolation of parallel 2DGPR lines to construct a continuous surface [15]. However, it must be noted that 3DGPR cannot identify features that may exist between the original 2DGPR observations, it can only interpolate using available information.
3DGPR is a virtual construct of radar data acquired with knowledge of the position of the antenna over the survey grid. Position can be obtained either using the information of the position across a known survey grid, as in this study, or from an integrated GPS [16]. Across each of the survey grid lines, 2DGPR data are acquired at a 10cm line-spacing, which are then interpolated into 3DGPR. The interpolation technique used for this study is a proprietary linear interpolation developed by the antenna manufacturers (Malå Geoscience (Sweden)): thus our observations of 3D features is dependent on the Mala software. An alternative approach would be to derive raw XYZ data and carry out independent interpolations within a GIS, which is not the aim of the study, but would be a useful further study.
2.3. Application
The survey was carried out on the 31 July 2017, after an extended period of dry weather. This was done to ensure that the stonework was dry to reduce the interference to the GPR signal from moisture. Prior to the survey, a reconnaissance inspection was carried out using a CEIA Systems compact metal detector. The aim of this sweep was to search for metal work imbedded within the wall such as pins, wires or braces, which could affect the results. Sweeps at high and low frequencies ensured that no metal was present in the near surface or deeper within the wall.
Three GPR antennas were used in this study, 1.2 GHz, 1.6 GHz and 2.3 GHz. Choice of the antenna frequency is important when designing survey strategies and was the topic of previous work at this site [11]. Based upon the scale and depth of the feature being examined, different antennas need to be selected. Lower-frequency antennas can assist in the detection of larger, deeper objects within the area of interest, whilst higher-frequency antennas detect smaller anomalies at shallow depths. For this reason, all three antennas have been deployed to detect the full range of features within the wall. GPR antennas were mounted on a wheel cart that controlled the data logging (Figure 3B).
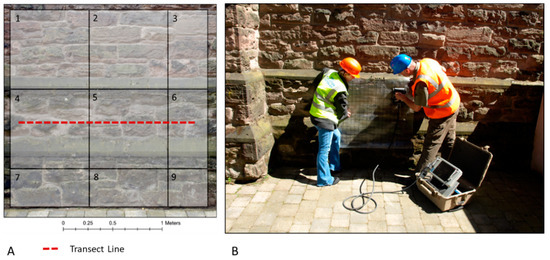
Figure 3.
A demarks the coverage of the study area using 80 cm by 80 cm squares defined by the extent of the plastic sheet. The application of the plastic sheet during data collection is illustrated in B.
Given the rough surface of the wall, the manufacturer supplied a plastic sheet, sized 80 cm x 80 cm, attached to the wall and the surveys were run over the top at a 10 cm line spacing. To completely cover the study area with the plastic sheeting data collection needs to take place in 9 sections (Figure 3B). Utilizing the cart and with the smoother surface created by the plastic sheeting, a continuous output was achievable. Repeat experimental lines were run, without the plastic sheet, to examine whether the 0.5–1 cm air gaps that were introduced by the sheet would have any effect on data quality [11]. As differences were negligible, the plastic sheet was deployed as this had the advantage of allowing both accurate positioning on the grid and continuous movement of the odometer wheel(s) on the three radar units.
2.4. Processing
The 2DGPR data were viewed as raw data and processed in Mala’s proprietary software Groundvision: Figure 6 has Automatic Gain Control, Background Removal applied. 3DGPR data were examined as migrated and unmigrated time-slices, unmigrated slices are shown in Figure 4.
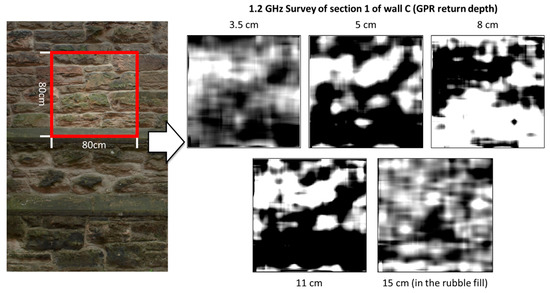
Figure 4.
Output surfaces created for each of the selected GPR return depths from one of the nine wall sections. The outputs from each of the sections were stitched together to create a continuous surface for analysis.
3. Results
Surfaces captured at interval GPR return depths of 3.5, 5, 8, 11 and 15 centimetres for each section (Figure 4). Between these depths, returns from features within the wall phased in and out of the output surfaces because of the reflection wave and time of return. This allows for the confirmation of returns from features, as points that remain consistent with depth are unlikely to be noise: a similar approach to the interpretation of GPR data in historic buildings was taken by Pieraccini et al. (2018: [9]) and Marchessini et al. (2015: [15]). At a depth of 15 cm, the returns reached the rubble fill and the anomalies become difficult to interpret due to the complexity of response from the unsorted mixture of rubble, gravel and small void spaces. As the focus of this work is the interior condition of the visible blocks of the wall this did not influence the outcome of the study. The results were georeferenced within a GIS to allow the operator to navigate through each of the signal depths and antenna frequencies in a spatial context. Using this approach, it was possible to annotate a plan of the wall with features identified with each of the three antennas (Figure 5). To validate the findings from this survey, a transect of the mid-section of the wall was recorded for comparison (Figure 6).
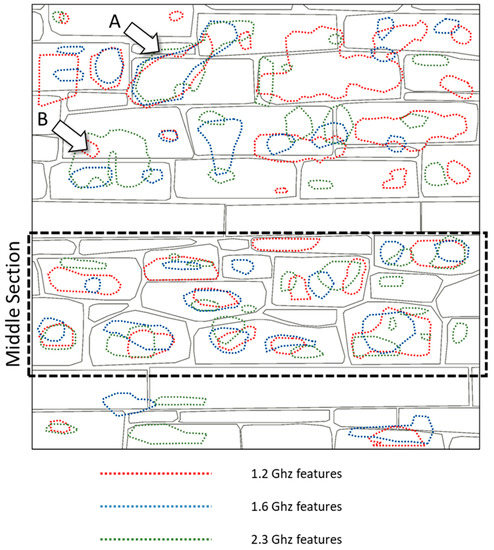
Figure 5.
Features identified across the wall section using the three GPR antennas. This approach identified a series of features that extend across multiple blocks (A and B) implying that there may be interaction between blocks at these locations.

Figure 6.
Conceptual model (schematic) of the seasonal variation in the limit of the capillary range, influencing the wetting and drying of masonry overtime. These patterns of moisture will influence the deterioration of stonework in the building, creating distinct spatial patterns. This vertical cross-section is taken through the GPR survey area. Vertical height = 2 metres.
For the upper section of the study wall, the map of returns shows a multitude of overlapping and contradictory anomalies, dependent upon the frequency of the antenna used. In some locations on the wall, all three of the antennas confirm the presence of a feature (see A on Figure 5). In this section of the wall, the results from the three antennas reveal the presence of a mixture of small-scale features and larger features that extend across multiple block boundaries (A and B in Figure 5).
Alternatively, across the base section of the wall, there are very few anomalies that can be identified in the outputs. This was unexpected as variability in materials and block conditions would have been expected given the age and construction of the wall.
The middle section of the wall shows multiple anomalies, identified by all three of the antenna frequencies, at the centre of the blocks. These cores have a different dielectric permittivity than the rest of the wall section. This is most commonly observed to correspond with a shift between mediums, such as the transition between stone and void or by crossing between materials of differing structural properties [8]. The implication is that a mechanism must be operating at this elevation of the wall to create this response.
The final point to draw from the results is that the areas of horizontal string courses could be identified in the output surfaces. However, across the length of both sections there existed only one identified anomaly, near the base of the lower section. This would imply that the string course remains in relatively good condition both externally and internally.
4. Discussion
The 3DGPR results (Figure 5) identify both anomalies and a spatial distribution of features that would not have been distinguishable using only 2DGPR transects, such as we used in a previous publication to this one [11]). 3DGPR has the advantage of detecting features across the entire area. This would suggest that the use of 3DGPR is better suited to the task of investigating subsurface distribution of weathering response. It is essential to reiterate that the collection of data using 2DGPR directly records the antenna observations, while 3DGPR is undertaking an interpolation of the returns to develop a continuous surface across the area of interest. As a result, the reported observations between the lines of the survey grid are estimates of the returns between the observed data. This means that any anomaly that exists between these survey lines may be detected by the survey, or be a vague response from out-of-plane reflections.
Multiple features have been recorded across the wall section, which may be associated with deterioration of the constituent blocks. These results suggest that the top, middle and base sections, as divided by the sections of string course, have each experienced a different weathering response.
In the top section of the wall, anomalies are identified at both the block scale and as features that extend beyond a single block. Many of the block scale features have been detected by only one of the three frequencies of antenna. This suggests that these are small-scale features that can only be detected using certain antennas, as could be expected with features found with the 2.3 GHz antenna. Alternatively, if there are variations in the survey line locations then different features could be observed, resulting in variation. Irrespectively, these features identify the location of points that may be of interest for further investigative works, such as resistivity and/or minimally intrusive sampling.
Anomalies that extend across multiple blocks in the top section of the wall have been observed. One interpretation of these is that deterioration has extended across multiple blocks, implying the development of interconnectivity. However, an alternative and more probable perspective is that the feature represents groups of blocks that have experienced less deterioration than the neighbouring material. These groups of ‘sound’ blocks appear as single objects, as the mortar joints between them are too thin (1–2 cm) to appear in the resolution of the 3D survey. This can also be seen for both sections of string course, which appear to be ‘sound’.
The base section shows little or no subsurface deterioration when examining the results of the 3DGPR survey. This is likely due to the constant wetness of the stonework obscuring the radar signal, despite the survey being carried out after an extended period of fine weather on a west-facing wall. It should also be noted that the blocks appear to be in good condition when visually inspected, though completely covered in moss. The suspected source for this moisture is capillary rise, which keeps the base of the wall wet all year round.
Finally, the deterioration of the blocks in the mid-section have left cores of less weathered material with different dielectric permittivity than the surrounding weathered material. These features have been identified in most blocks, with the expectation of smaller ‘pinning’ stones. The development of these ‘cores’ is likely the response to moisture ingress from all sides of the block, with the network of mortar being exploited as a pathway for moisture ingress. It is likely that the more weathered stones are more permeable, and thus contain more water, creating a dielectric change from other blocks and thus any anomaly seen.
These three distinct sections imply that there is a spatial factor influencing the weathering response across this wall. Likely, the cause of this spatial variation is the seasonal influence upon capillary rise, relating to evaporation rates. Acknowledging this, it is possible to develop a conceptual model for the processes taking place in the wall section.
Weathering Conceptual Model
Groundwater rise, or rising damp, is a common terminology for the slow migration of moisture up through a wall or other ground supported structure [17]. For many masonry structures, foundations run deep into the ground, placing them in contact with moisture-laden soils and foundations. Through capillary rise, moisture will migrate up through the wall section through surface evaporation above, by a process referred to as the ‘wick effect’, until it reaches the capillary range, which represents the maximum height of rise [18,19]. The height of this capillary range is mostly a factor of the properties of the building materials and the evaporative processes in operation. Evaporation processes restrict the height of moisture rise through capillary action. Capillary range will subsequently vary over the year, with a larger height of rise during the winter months when evaporative processes are less active [20]. The seasonal variability in height of rise has also been linked to deterioration. Hall et al. [21], in their study of wall sections in London, observed that zones which lie between the height of capillary rise in summer and winter (0.6–1.7 m) experience the most extreme deterioration. It is proposed that this section of the wall dries out in the summer months, facilitating evaporation of moisture and subsequent crystallisation of salts [17]. The lower section of the wall, beneath 0.6 m, remains saturated all year and, therefore, crystallisation and subsequent deterioration is reduced.
Using past work [11] and the findings from this study, it is possible to develop a conceptual model (Figure 6). Evaporative processes restrict the height of moisture rise, however the strength of evaporation varies over the year. In the winter months, evaporation is reduced due to cooler conditions and reduced direct sunlight hours. In the case of the study wall, this conceptual model proposes that the height of the capillary rise limit is between the two lengths of string course. During the summer months, the evaporative processes are stronger, resulting in a lower limit to the capillary range, in the case of this model, to below the string course section. The stonework that lies between the two bands of string course, subsequently dries out and salts in solution are deposited in the substrate. This drives the increased deterioration of masonry observed here.
Further evidence for this proposed model is that the bottom section of the wall remains wet to the touch all year round and biological growth was observed in the form of mosses. This would be the case if the wall section remained below the capillary range limit all year round. This could also explain the better condition of the base section compared to the mid-section, as the blocks remained saturated preventing the crystallisation of salts in solution. The model matches with the previously discussed case studies in London and Athens [21].
5. Conclusions
GPR has significant benefits as part of the toolset of weathering researchers, allowing the identification of subsurface features. In this study, 3DGPR at a range of frequencies has been observed to generate an output that is suited for interpretation of weathering responses. This has allowed the authors to identify three areas experiencing different weathering responses within this wall section.
- Top section, which shows a combination of block scale and pan block scale features in the wall subsurface. These features may be caused by weathering response or mark zones of ‘sound’ blocks, where deterioration has been less severe than experienced by the surrounding material.
- Middle section, where deterioration has been the greatest, shows cores of weathered material at the centre of each blocks. The observed deterioration is believed to be a result of the stress upon the block created by frequent wetting and drying.
- Base section covered in moss and is wet to the touch. However, displays less deterioration both on the surface and in the GPR results.
Based upon these observations and details within the literature, it is possible to develop a conceptual model of the processes at work in the wall section investigated. However, this model is simplistic as it ignores the network of mortar that could influence the migration of moisture within the structure. To develop a more complex model of the wall section, more data are required on the seasonal variability of moisture and how it relates to the construction techniques [22] used.
Author Contributions
Individual contributions. Conceptualization: B.J.J. and J.M. Methodology: A.R. Software (GIS): B.J.J. Validation: B.J.J. and J.M. Formal analysis: B.J.J. and A.R. Investigation: A.R. and B.J.J. Resources: A.R. Data curation: B.J.J. Writing—original draft preparation: B.J.J. Writing (review and editing): J.M. Visualization: B.J.J. Supervision: J.M., P.W. Project administration: B.J.J. and J.M. Funding acquisition: B.J.J.
Funding
This work was funded by the Soulby Research Prize 2017 awarded by Queen’s University Belfast.
Acknowledgments
The authors would like to thank the congregation of Fitzroy Presbyterian for allowing them unrestricted access to their place of worship. They would also like to thank Lisa Coyle-McClung for her assistance during fieldwork. Mike Langton of GuidelineGeo made useful comments on a draft of this work and facilitated supply of the 1.2 and 2.3 GHz antenna and equipment, for which we are grateful.
Conflicts of Interest
The authors declared no potential conflicts of interest with respect to the research, authorship, and/or publication of this article.
References
- Smith, B. Scale problems in the interpretation of urban stone decay. In Process of Urban Stone Decay; Smith, B., Warke, P., Eds.; Donhead: Aberdeen, UK, 1996; pp. 3–18. [Google Scholar]
- Viles, H. Can Stone Decay be Chaotic? In Stone Decay in the Architectural Environment: Geological Society of America Special Paper 390; Turkington, A., Ed.; GSA: Boulder, CO, USA, 2005; pp. 11–16. [Google Scholar]
- Inkpen, R.; Duane, B.; Burdett, J.; Yates, T. Assessing stone degradation using an integrated database and geographical information system (GIS). Environ. Geol. 2008, 56, 789–801. [Google Scholar] [CrossRef]
- Lindsay, C.; Smith, B.; Curran, J.; McKinley, J.; Meneely, J.; Ruffell, A.; Savage, J.; Stelfox, D. An Integrated Toolkit for the Conservation of Stone-Built Heritage. EGU Gen. Assem. Conf. Abs 2010, 12, 7299. [Google Scholar]
- Mol, L.; Clarke, L. Integrating Structure from motion photogrammetry into rock weathering field methodologies. Earth Surf. Process. Landf. 2019, 44, 2671–2684. [Google Scholar] [CrossRef]
- Pérez Gracia, V.; Canas, J.A.; Pujades, L.G.; Clapés, J.; Caselles, O.; Garciía, F. GPR Survey to confirm the location of ancient structures under the Valencian Catherdral (Spain). J. Appl. Geophys. 2000, 43, 167–174. [Google Scholar] [CrossRef]
- Barilaro, D.; Branca, C.; Gresta, S.; Imposa, S.; Leone, A.; Majolino, D. Ground penetrating radar (GPR) surveys applied to the research of crypts in San Sebastiano’s church in Catania (Sicily). J. Cult. Herit. 2007, 8, 73–76. [Google Scholar] [CrossRef]
- Kanli, A.I.; Taller, G.; Nagy, P.; Tildy, P.; Pronay, Z.; Toros, E. GPR survey for reinforcement of historical heritage construction at fire tower of Sopron. J. Appl. Geophys. 2015, 112, 79–90. [Google Scholar] [CrossRef]
- Pieraccini, M.; Miccinesi, L. No-contact GPR for investigating painted walls. In Proceedings of the 17th International Conference on Ground Penetrating Radar (GPR), Rapperswil, Switzerland, 18–21 June 2018. [Google Scholar]
- González-Drigo, R.; Pérez-Gracia, V.; Di Capua, D.; Pujades, L.G. GPR survey applied to Modernista buildings in Barcelona: The cultural heritage of the College of Industrial Engineering. J. Cult. Herit. 2008, 9, 196–202. [Google Scholar] [CrossRef]
- Johnston, B.; Ruffell, A.; McKinley, J.; Warke, P. Detecting Voids within a historical building façade: A comparative study of three high frequency GPR antenna. J. Cult. Herit. 2018, 32, 117–123. [Google Scholar] [CrossRef]
- Böniger, U.; Tronicke, J. Improving the interpretability of 3D GPR using target-specific attributes: Application to tomb detection. J. Archaeol. Sci. 2010, 37, 360–367. [Google Scholar] [CrossRef]
- Smith, B.J.; Warke, P.A.; Curran, J.M. Implications of climate change and increased ‘time-of-wetness’ for the soiling and decay of sandstone structures in Belfast, Northern Ireland. In Dimension Stone; Prikryl, R., Ed.; Taylor & Francis Group: London, UK, 2004; pp. 9–14. [Google Scholar]
- Cooke, R.U.; Gibbs, G.B. Crumbling heritage? Studies of stone weathering in polluted atmospheres. Atmos. Environ. 2004, 28, 1355–1356. [Google Scholar] [CrossRef]
- Marchesini, P.; Grasmueck, M. The impact of high-density spatial sampling versus antenna orientation on 3D GPR fracture imaging. Near Surf. Geophys. 2015, 13, 197–207. [Google Scholar]
- Sato, M.; Gaber, A.; Yokota, Y. 3dimensional GPR applied to archeological survey and mitigation of natural disasters. In Proceedings of the 2012 IEEE International Geoscience and Remote Sensing Symposium, Munich, Germany, 22–27 July 2012; pp. 3218–3221. [Google Scholar]
- Hall, C.; Hoff, W. Water Transport in Brick, Stone and Concrete; SponPress: Abingdon, UK, 2012. [Google Scholar]
- Goudie, A. Laboratory simulation of ‘the wick effect’ in salt weathering of rock. Earth Surf. Process. Landf. 1986, 11, 275–285. [Google Scholar] [CrossRef]
- Goudie, A.; Viles, H. Salt Weathering Hazards; Wiley: Chichester, UK, 1997. [Google Scholar]
- Rirsch, E.; Zhang, Z. Rising damp in masonry walls and the importance of mortar properties. Constr. Build. Mater. 2010, 24, 1815–1820. [Google Scholar] [CrossRef]
- Hall, C.; Hamilton, A.; Hoff, W.; Viles, H.; Eklund, J. Moisture dynamics in walls: Response to micro-environment and climate change. Proc. R. Soc. A Math. Phys. Eng. Sci. 2011, 467, 194–211. [Google Scholar] [CrossRef]
- Barone, P.M.; Graziano, F.; Pettinelli, E.; Ginanni Corradini, R. Ground-penetrating radar investigations into the construction techniques of the Concordia Temple (Agrigento, Sicily, Italy). Archaeol. Prospect. 2007, 14, 47–59. [Google Scholar] [CrossRef]


© 2019 by the authors. Licensee MDPI, Basel, Switzerland. This article is an open access article distributed under the terms and conditions of the Creative Commons Attribution (CC BY) license (http://creativecommons.org/licenses/by/4.0/).