Abstract
Circular dichroism (CD) (and synchrotron circular dichroism (SCD)) spectroscopy is a rapid, highly sensitive technique used to investigate structural conformational changes in biomolecules in response to interactions with ligands in solution and in film. It is a chiroptical method and at least one of the interacting molecules must possess optical activity (or chirality). In this review, we compare the capabilities of CD and SCD in the characterisation of celluloses and lignin polymers in archaeological wood. Cellulose produces a range of spectral characteristics dependent on environment and form; many of the reported transitions occur in the vacuum-ultraviolet region (< 180 nm) most conveniently delivered using a synchrotron source. The use of induced CD in which achiral dyes are bound to celluloses to give shifted spectra in the visible region is also discussed, together with its employment to identify the handedness of the chiral twists in nanocrystalline cellulose. Lignin is one target for the design of future consolidants that interact with archaeological wood to preserve it. It is reportedly achiral, but here we review several studies in which CD spectroscopy has successfully revealed lignin interactions with chiral enzymes, highlighting the potential usefulness of the technique in future research to identify new generation consolidants.
1. Introduction
Circular dichroism (CD) (and synchrotron circular dichroism (SCD)) spectroscopy is widely used to study chiral molecules, in particular biomolecules in solution and in thin amorphous dry films. It is often used to elucidate secondary structural composition and to investigate tertiary structural conformational changes in biological monomeric, oligomeric and polymeric molecules including proteins and peptides (e.g., [1,2,3,4,5,6,7,8,9,10]), nucleic acids (e.g., [4,5,6,11]), carbohydrates and polysaccharides (e.g., [4,12,13,14,15,16,17,18,19,20]). In the definition of CD, it is a chiroptical method that requires the molecule under study to possess optical activity (chirality). However, the absence of chirality in the molecule of interest is not necessarily prohibitive to at least some interrogation using CD spectroscopy, especially in interaction studies [21], as long as there is a chiral interacting molecule or ligand present that undergoes a CD-detectable conformational change upon interaction with the molecule of interest. Furthermore, chirality may also be induced; as described in this review, polysaccharides that give CD spectra in the more inaccessible vacuum ultra-violet (UV) region (which SCD can probe) may be complexed with achiral dyes to produce shifted CD signals in the more accessible and experimentally convenient visible range. Yet despite its widespread use for a wide range of biomolecules, to date there have been comparatively few studies employing CD spectroscopy to study polysaccharides found in archaeological wood nor polysaccharide interactions in archaeological wood. This is presumably due to the considerable insolubility of wood polysaccharides and in some cases their reported lack of chirality [22]. However, we suggest that careful and judicious choice of approaches allows the acquisition of reliable CD- and SCD-based data to illuminate knowledge of technically-challenging biomolecules such as archaeological wood and its interactions with candidate consolidant molecules. After all, CD is a highly sensitive method that is rapid to perform and is well suited to studies of conformational change in biomolecules in response to changing ligand and solvent conditions and to interaction studies in general, as long as solubility of such biomolecules can be achieved. In this regard, the solvent, buffer and additive conditions for carrying out CD studies is paramount. Indeed, it is more often solubility rather than a lack of chirality that is the limiting factor encountered during considerations of the suitability of using CD for some biological molecules (though not all; see for example [22]). In addition, the use of synchrotron CD, which allows investigations of polysaccharides such as cellulose esters and cello-oligosaccharides that have electronic transitions absorbing in the vacuum UV range not routinely accessible using most benchtop instruments, has become much more widely available to most laboratories in recent years. Therefore it is timely to review the progress that has been made in terms of advancement in CD- and SCD-based techniques available to address present and future challenges in the preservation of archaeological wood.
2. Principles of CD Spectroscopy
A CD signal is generated when a chromophore is chiral due to: (1) intrinsic chirality attributable to structure e.g., asymmetric carbon atoms with four different substituents; (2) covalent linkage to a chiral centre in the molecule; or (3) placement in an asymmetric environment due to the 3D molecular structure adopted [2]. For a long time now, CD and SCD spectroscopic analyses have been standard practices in structure determination of proteins and peptides, carbohydrates and polysaccharides and deoxyribonucleic acids.
CD is defined as the difference in absorption of left- and right-handed circularly polarized light by chiral molecules. It is a spectroscopic technique; the difference in absorption (ΔAλ) is proportional to the concentration of the sample in grams/ml (c), the pathlength in cm (l) and the difference in molar absorptivity (Δε) according to the Beer law (L and R refer to left-handed and right-handed circularly polarised light, respectively) [1]:
or, molar absorptivity, (Δε):
AL (λ) − AR (λ) = ΔA(λ) = {εL(λ) − εR(λ) } l c = Δε (λ) l c
Δε = εL − εR = ΔA/(c × l)
The units of molar differential absorptivity (also referred to as molar differential extinction coefficient) are M−1 cm−1.
CD data may also be measured as ellipticity, θ (degrees), which refers to the elliptical shape of the electric vector that occurs when differential light absorption takes place. Whether using ΔA or θ, CD data are normalised to molar concentrations of either the whole molecule or the repeating unit of a polymer [2]. For example, in the case of proteins measured in the far UV region, the repeating unit is the peptide bond and so data may be expressed as mean residue ellipticity:
where θλ is the observed ellipticity (in degrees) at a given wavelength λ and MRW is the mean residue weight of the biomolecule and l and c have the same meaning as above.
[θ]mrw,λ = MRW × θλ/10 × l × c
[θ]mrw and Δε are numerically related:
[θ]mrw = 3298 × Δε
Alternatively, if the molar concentration is known then molar ellipticity at a given wavelength ([θ]molar, λ) may be calculated:
where m is molar concentration and l has the same meaning as above.
[θ]molar,λ = 100 × θλ/m × l
The units of both molar ellipticity and mean residue ellipticity are deg. cm2 dmol−1. For a more detailed consideration of CD units see [2].
3. Synchrotron CD (SCD) Spectroscopy: Advantages over Conventional CD Spectroscopy
Instruments for synchrotron CD spectroscopy first emerged in 1980 [23,24] but it was not until 2000 and later that SCD spectroscopy was shown: (1) to successfully provide additional data for proteins in the VUV region; (2) to provide data that could be used for new applications in structural molecular biology; and (3) provided data that was readily accessible with modern beamlines (reviewed in [25]). Indeed, the advantages of using a synchrotron source of light in SCD over Xenon light sources typically used in conventional benchtop instruments has been highlighted and/or reviewed previously [9,25,26,27,28,29,30]. These reviews are summarised below:
- (1)
- At wavelengths below 190 nm, the light flux from a synchrotron source is much more intense than that typically available in benchtop instruments. This means that spectra may be obtained well into the vacuum UV range (to 125 nm) where electronic transitions of some carbohydrates and polysaccharides occur. It also permits more accurate determinations of secondary structural features in mixed protein samples and contributes to the distinction of polyproline helix from unordered protein structures [27]. It also provides more information about protein CD spectra; the ability to acquire more reliable spectral data down to 178 nm permits more reliable distinction between protein secondary structures and down to 168 nm permits resolution of further structures including distinctive folds and supersecondary structures [27].
- (2)
- The greater intensity of the synchrotron light source means that the signal-to-noise ratios are much greater than those of spectra measured on conventional benchtop instruments.
- (3)
- The availability of a highly collimated and small cross section beam of synchrotron light allows measurements using very small volume capacity cells of a wide range of pathlengths, from a few microns to 10 cm. This is potentially highly advantageous for facilitating analyses of very small amounts of precious samples.
4. The Composition of Archaeological Wood and Implications for CD Studies
The main chemical constituents of sound wood are carbohydrates cellulose and hemicellulose and the polyphenol lignin laid down within the plant cell wall (Figure 1 and Figure 2). The architecture of wood tissue and the ultrastructure of the wood cell wall have been reviewed extensively (e.g., [31,32,33]), and the reader is referred to these texts for further details. It is not our purpose to repeat these texts, but it is useful here to provide a short summary of wood cell wall structure (shown in Figure 1) in order to highlight the localisation of the three chemical constituents of wood, as this is informative for: (1) some isolation methods for obtaining pure chemical components for subsequent CD analysis; (2) understanding the nature and origins of the chirality required for CD studies of archaeological wood components, since crystalline and other forms of cellulose are chiral [32,34], whereas lignin (or at least some forms of lignin) are reported to lack chirality [22]; (3) reminding us that some general isolation and solubilisation methods may yield mixtures of all three components; and (4) contributing to our understanding of how breakdown proceeds architecturally during biotic and abiotic processes of degradation of archaeological wood, for example in anoxic waterlogged environments lignins are generally much more recalcitrant to degradative processes than the carbohydrate components. However, this can confound what is expected in terms of degradation, because an inaccessibility of the carbohydrate component for degradation can be caused by the physical block posed by the undegraded lignin present [33].
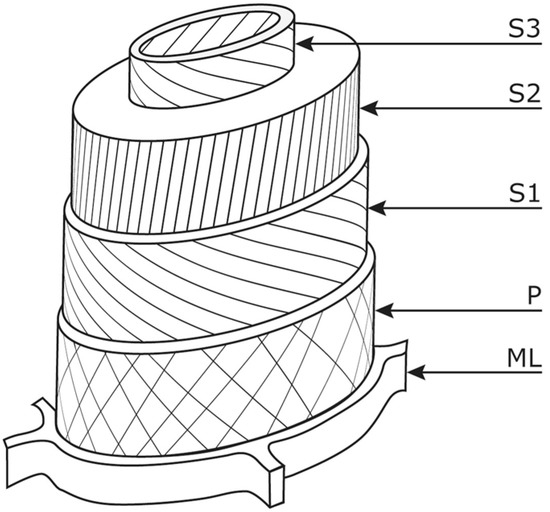
Figure 1.
Schematic representation of a wood cell. ML, middle lamella; P, primary wall; three secondary cell wall layers, S1, S2 and S3. The microfibril distribution and angles are shown. Reproduced from ref. [33] with permission from the Royal Society of Chemistry.
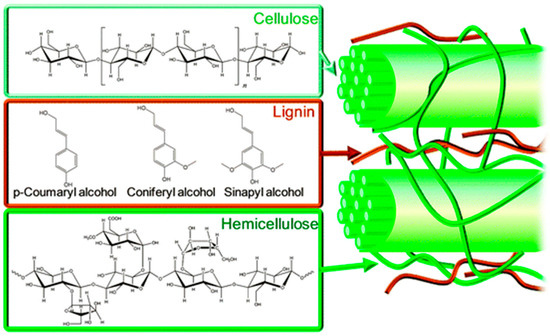
Figure 2.
Molecular structures (leftmost) and cellular location (rightmost) of cellulose, lignin and hemicellulose components of archaeological wood (leftmost) and architectural arrangement Reproduced from Alonso et al. [31] with permission from the Royal Society of Chemistry.
Wood cells are surrounded by a cell wall which is organised into primary and secondary layers surrounded by a middle lamella which holds wood cells together (Figure 1) [32,33]. The thin primary cell wall (P) located closest to the middle lamella is made up of cellulose fibrils that form thin crossing layers into which pectin is embedded. The middle lamella (ML) itself is comparatively lignin-rich comprising approximately 60% lignin, 20–30% hemicellulose and 10–15% cellulose. The thick secondary wall (S) is subdivided into three layers S1, S2 and S3 made up of 60% cellulose, 15% hemicellulose and 25% lignin; the S2 layer contains the main quantity of cellulose. As lignin is more resistant to degradation than cellulose and hemicellulose under anoxic conditions, totally decayed wood can be preserved as a fragile skeleton of mainly lignin-rich middle lamella, with loss of cellulose- and hemicellulose-rich wood cell wall structures within [33].
In nature, cellulose shows complex superstructures, chirality and chiral inversions [34]; indeed its chirality and biocompatibility are exploited in industrial applications including immobilisation of proteins, antibodies and heparin, for the separation of enantiomers and for the formation of cellulose composites [32]. It consists of repeating β-D-glucopyranose molecules covalently linked through acetal functions between equatorial C1 and C4 hydroxyl groups (Figure 2). It is an extensive linear chain molecule with each anhydroglucose possessing three hydroxyl groups, resulting in a hydroxy-rich molecule. In wood pulp, the chain length is typically 300–1700 anhydroglucose residues. Indeed the chain length, chain length distribution, distribution of functional groups on the repeating units and along the polymer length, cross-linking reactions and intermolecular interactions all contribute to the properties of the cellulose [32]. The hydroxyl groups contribute an extensive hydrogen bond network which in turn is responsible for the hierarchical structure of cellulose, including the multitude of partially crystalline fibre cellulose structures seen in solid cellulose. Importantly, the supermolecular structure of solid cellulose (including cellulose in its native form known as cellulose I) contains areas of high order crystalline cellulose as well as low order amorphous cellulose arranged in fibrils, microfibrils and microfibrillar bands. These hierarchical structures of solid-state cellulose have been intensively studied by X-ray diffraction, electron microscopy, high resolution 13C solid state NMR spectroscopy and neutron diffraction as described in [32].
5. CD and SCD Spectroscopy Studies of Cellulose, Cellulose Esters and Cello-Oligosaccharides
For studies using CD spectroscopy, cellulose must be in solution, gel or film; the technique is afterall a spectroscopic one. Cellulose forms helices in solution [1], and is an unsubstituted polysaccharide bearing no functionalities other than hydroxyls, ring oxygens and glycosidic oxygens (Figure 2). For most unsubstituted polysaccharides, these functional groups give rise to electronic transitions n → σ* (acetal oxygens at C-1 and C-5) and σ→ σ*, which give CD signals centred at 175 nm and 150 nm, respectively [1,14]. However, cellulose is a special case; Table 1 summarises the variety of spectral maxima measured for cello-oligosaccharides and cellulose acetate. The spectral characteristics vary depending on whether measured in solution or film, on the solvent type, on the degree of substitution and oligomer/polymer length (Table 1) [1,35]. In many cases (though not all) such transitions (and transitions of other polysaccharides in the <180 nm range) can only be directly investigated using vacuum-ultraviolet (UV) CD [13,36], most conveniently delivered using a synchrotron source (e.g., [23,24,26,30,31,32,33,34,35,36,37]). A unique strength of SCD spectroscopy is its higher photon flux and extended vacuum UV region down to a wavelength of 125 nm, the latter being particularly useful for obtaining spectral measurements of unstained sugars, oligosaccharides and complex polysaccharides such as cellulose. Figure 3 shows the vacuum-UV spectra of a series of cello-oligosaccharides; the characteristic feature in this study was the occurrence of one peak at 174 nm [30], as observed previously (Table 1, [12,26]).

Table 1.
UV and vacuum UV circular dichroism spectral characteristics of cello-oligosaccharides and cellulose acetate.
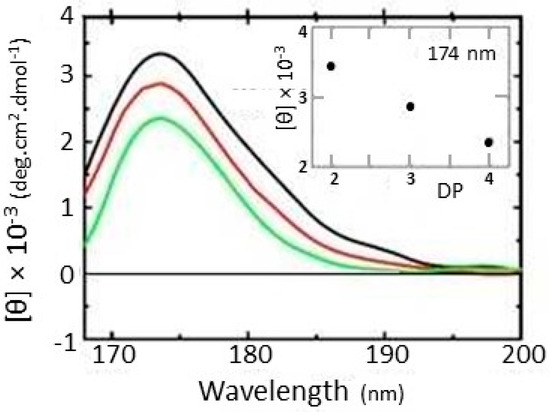
Figure 3.
Vacuum-UV synchrotron CD spectra of cellobiose (black), cellotriose (red) and cellotetraose (green) cello-oligosaccharide series. [θ], molar ellipticity; DP, degree of polymerisation. Reproduced from [30] with permission from IOS Press.
It is also possible to study cellulose oligosaccharides greater than cellopentaose [38] or cellotetraose [39] in solution or in nanocrystalline form in solution or film by induced CD using a benchtop instrument. Induced CD involves complexation of chiral oligosaccharides or nanocrystals with achiral dyes to shift their chromophore absorbances to wavelengths in the visible range which can then be measured in a conventional benchtop CD instrument [39,40]. The elegant study of a series of cello-oligosaccharides described in [39] determined the equilibrium constants for their association reactions with suitable dye molecules using CD measurements made in the more readily accessible visible range. Example spectra produced for cellohexaose with several suitable achiral dyes are shown in Figure 4, whilst Figure 5 and Figure 6 show the induced spectra using just one of the dyes (Congo red) with a range of cello-oligosaccharides of different lengths and concentrations [39]. The appearance of these induced CD spectra is attributable to the helical structure of the celluloses, an idea supported by the minimum cellulose length (equivalent to one helical turn) required to observe such induced spectra in cello-oligosaccharides [38]. The dyes that are able to bind to cellulose share structural similarities including the possession of three aromatic moieties arranged at ~1 nm distances along a rigid bis-diazo-pseudolinear structure centred around a biphenyl group [39]. It is suggested that rotational freedom afforded by the single bonds that link the biphenyl rings might be the important feature that permits the dyes to yield to the helical nature of the cellulose during binding [39]. In studies of Congo red binding, the dye appears to bind parallel to the chain axis [41,42,43] and molecular dynamics simulations have shown that the aromatic rings of the dye associate with the planes of the glucose rings [44]. Induced CD experiments were recently employed to identify and investigate the structural chirality of higher-order cellulose nanocrystals in which helices are contributed by twists along the crystal axes [43,45]. Such twisting had proved difficult to confirm by direct imaging techniques previously (except when larger cellulose nanocrystals were used), and computational modelling had predicted a possible twist (see [43]). Induced CD experiments using Congo red staining of cellulose nanocrystals obtained from wood pulp (~160 nm length × ~16 nm width) together with time-dependent density functional theory calculations revealed that interactions occurred solely with twisted (not flat) cellulose and resulted in preferential binding by one of the four propeller-shaped enantiomeric conformers of the dye (Congo red being a racemic mixture of four rotational isomers, two enantiomeric mirror images of syn and anti conformations) (Figure 7). Cellulose nanocrystal suspensions from wood sources induced a positive Cotton effect as the dye absorbed onto the crystal surface (the Cotton effect is referred to as positive if the optical rotation first increases as wavelength decreases and negative if the rotation first decreases) (Figure 7 and Figure 8), consistent with a right-handed twist and calculated to be 800 nm per half-twist [43].
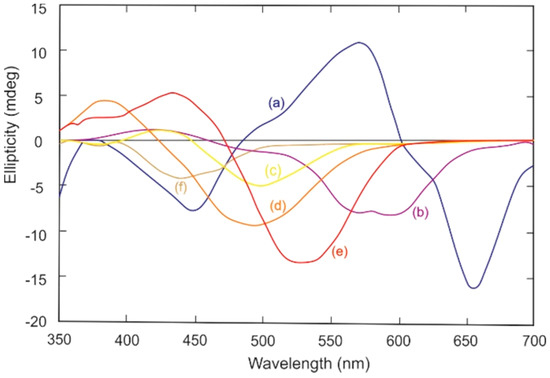
Figure 4.
Induced CD spectra for complexes of cellohexaose and achiral dyes: (a) Trypan Blue; (b) Direct Violet No 1; (c) Direct Yellow No 1; (d) Direct Orange No 8; (e) Congo Red; and (f) Titan Yellow, at equimolar concentrations in aqueous phosphate buffer, pH 7.0. Reproduced and redrawn drawn with spectral smoothing from ref [39] with permission from Elsevier Press.
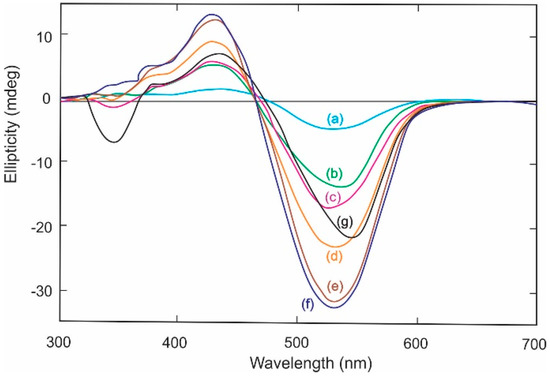
Figure 5.
Induced CD spectra for complexes between Congo Red and: (a) cellotetraose; (b) methyl cellulose; (c) cellopentaose; (d) cellooctaose; (e) cellohexaose; (f) celloheptaose; and (g) hydroxypropylcellulose in phosphate buffer pH 7.0. Reproduced and redrawn with spectral smoothing from ref [39] with permission from Elsevier Press.
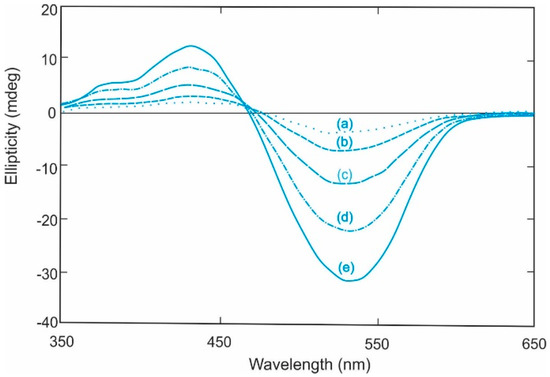
Figure 6.
Induced CD spectra for solutions of Congo Red and cellohexaose as a function of cellohexaose concentration: (a) 0.17 mM; (b) 0.34 mM; (c) 1.37 mM; (d) 2.75 mM; and (e) 6.87 mM in phosphate buffer pH 7.0. Reproduced and redrawn with spectral smoothing from ref [39] with permission from Elsevier Press.
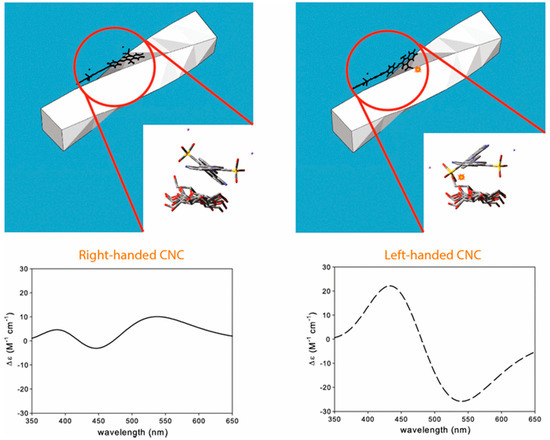
Figure 7.
Induced CD of Congo red dye on helical twisted cellulose nanocrystals. The two upper panels indicate two Congo red enantiomers interacting with the nanocrystal surfaces differently. The favourable interaction in this example is by the leftmost upper panel in which the enantiomer is preferentially bound by the right-handed nanocrystal. The lower panels depict the positive (leftmost) and negative (rightmost) Cotton effects induced by right- and left-handed nanocrystals, respectively. Reproduced from ref [43] with permission from Springer Nature.
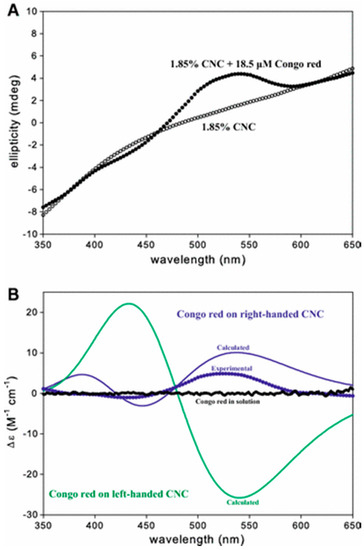
Figure 8.
Induced CD of Congo red by cellulose nanocrystals (a) isotropic cellulose nanocrystal suspensions with (filled circles) and without (unfilled circles) Congo red; and (b) calculated induced CD of Congo red bound by right- or left-handed cellulose nanocrystals with a half-twist of 200 nm. Reproduced from ref [43] with permission from Springer Nature.
The approach of induced CD spectroscopy in the studies described in [39,43,45] lends itself very well to distinguishing handedness in cellulose nanocrystal twists via preferential dye enantiomer binding; it is a technique that has been much used for distinguishing enantiomers during (for example) enantiomer separation from racemate mixtures. It is worth mentioning that cellulose-dye interactions and subsequent induced CD occurs with both solid cellulose (nanocrystals and higher forms of crystalline cellulose [39,43,45]), as well as with soluble cello-oligomers in solution [39]. In future investigations of degradation of archaeological wood, induced CD may potentially prove a useful tool because cellulose nanocrystals (at least within certain size ranges described above) possess a right-handed twist on their surfaces and a left-handed twist amongst inner chains [43,45].
Finally, of relevance to cellulose degradation studies, the study of Engle et al. [39] also highlighted the structural similarity between the achiral aromatic dyes used in induced CD and the cellulose binding domain of the cellulose-degrading enzyme cellobiohydrolase of the wood-destroying fungus Trichoderma reesei. The binding domain possesses a similar coplanar arrangement of three aromatic residues with benzene rings arranged approx. 10.4 Å apart, very similar to the arrangements found in the dyes that bound to the cello-oligomers [39]. The association constants were reasonably consistent too. Therefore, knowledge gained from studies of dye-cellulose interactions described above may well be informative about possible mechanisms of biological enzyme interactions with cellulose (in this case, that similar hydrophobic interactions may be occurring) and this may also prove useful in parallel future studies to identify interacting consolidants.
6. CD Studies of Lignin
Waterlogged archaeological wood requires preservation strategies that inhibit or minimise the effects of structural instability on drying, biological degradation including microbial attack and chemical degradation due to Fe3+-catalysed production of acid which erodes the structural integrity of the wood. Over the past 20 years or so, wood artefacts such as the warships Mary Rose and Swedish Vasa have been treated with aqueous polyethylene glycol containing a broad spectrum biocide with the aim of supporting the remaining wood cell walls (a significant proportion of which is likely to be lignin due to its well documented recalcitrance to microbial and chemical decay) and inhibiting biological growth ([46,47] and reviewed in [48,49]). Similarly, from the mid-1800’s until the 1950s, concentrated solutions of alum salts (KAl(SO4)2·12H2O, aluminium potassium sulphate dodecahydrate) at 90 °C were used for strengthening wooden artefacts and maintaining their shape [50,51,52,53]. The alum salt replaced the remaining water in the wood cells and recrystallized immediately upon removal from the heat treatment, thereby rapidly preserving the shape of the wooden artefacts. However, there is increasing recognition that new and/or additional strategies are required for conservation of such waterlogged wooden artefacts and a variety of approaches are being investigated [53,54,55,56,57,58], including those involving the use of new consolidants that specifically interact with the longer-surviving lignin content of archaeological wood [59,60].
What contribution could CD and SCD spectroscopy make to investigations of the lignin-interaction strategies described above? They may seem unlikely to be of any use, given that lignin has been reported to be optically inactive (achiral) [22] and is a water-insoluble molecule. However, lignins extracted from plants are readily soluble in acetonitrile/water mixes suitable for CD studies; furthermore they can be derivatized and cleaved reductively to produce dimers which are separable into constituent enantiomers which are clearly chiral as shown by strong spectra obtained in near-UV CD spectroscopy experiments [22]. The lignin samples themselves isolated from pine, maize and kenaf were optically inactive overall, though this is likely due to the contributions from the various units of the complex lignin molecule making opposing (+ or −) contributions to the CD spectra, cancelling each other out [22]. Therefore, CD may be more usefully applied to isolated chiral units of lignin rather than to whole purified lignin. Indeed, it has been successfully employed in studies of lignin interactions previously. Optically-inactive (CD-transparent) lignin has been successfully used in CD experiments to demonstrate interactions between lignin (in the form of black liquor) and optically-active xylanase in which it is the change in the xylanase spectrum which confirms the interaction (Figure 9) [61]. In another lignin interaction study, CD spectroscopy was successfully employed to demonstrate the formation of peroxidase intermediates in response to lignin addition in a peroxidase-hydrogen peroxide system being investigated as a possible model for lignolytic enzyme action (Figure 10) [62]. Although there is a possibility that any lignin interactions observed in analytical CD experiments employing specific solvents and wood derivatization methods may not occur in the real operative condition of archaeological wood treatments, nonetheless, these two examples provide promise for the use of analytical CD and SCD spectroscopy for the screening of potential interactions by candidate consolidants in the future.
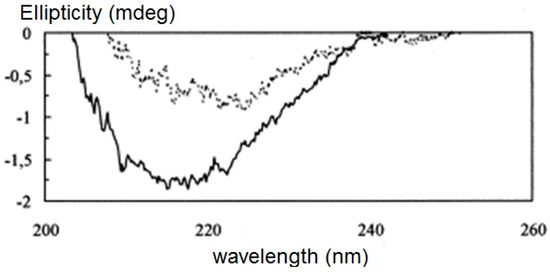
Figure 9.
CD spectra of 0.6 mg/ml xylanase (solid line) and 0.6 mg/ml xylanase interacted with 0.1 volume % black liquor (lignin) (dashed line). Reproduced from ref [61] with permission from Elsevier Press.
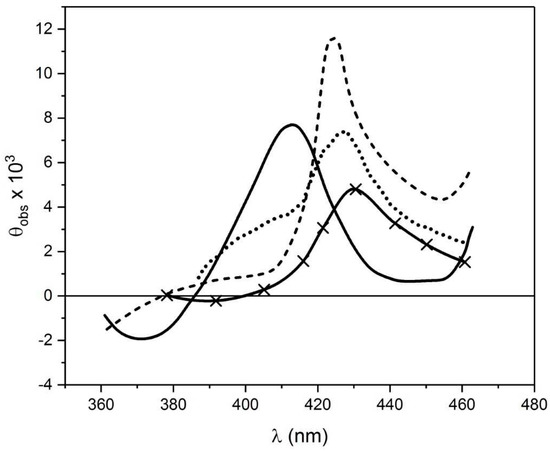
Figure 10.
CD spectra of horse radish peroxidase before (—) and after (—x—) addition of H2O2 (to give intermediate HRP-1), followed by lignin (to give HRP-II) (……); HRP-III formed by horse radish peroxidase plus excess H2O2 is shown (-------). Reproduced from ref [62] with permission from Elsevier Press.
7. Conclusions
In the development of next generation consolidants for preserving archaeological wood, one potential strategy is to design molecules that actually interact with the remaining wood cells, thereby fixing new materials into the gaps left following microbial and/or chemical degradation. CD spectroscopy is a biophysical tool that reports on interactions between biomolecules when at least one of the interacting molecules is chiral (either the wood component or the interacting consolidant) and when the conformational changes that occur upon ligand/consolidant binding are detectable using CD (i.e. the structural conformational change affects the environments of CD-sensitive chromophores). Future studies of cellulose interactions are promising; cellulose is a chiral molecule and CD spectra in the vacuum-ultra violet region (most conveniently obtained using SCD) and ultra violet regions have been reported previously. In addition, cellulose conformational changes can be investigated in the visible ultraviolet region using benchtop CD, through the use of achiral dyes which interact with right-handed and left-handed twisted cellulose in an enantiomerically-dependent manner to give distinguishable spectra in the visible ultraviolet region. Lignin, which is more recalcitrant to decay and therefore often more abundant in ancient wood, is reported to be achiral. However, previous studies have successfully employed CD spectroscopy to investigate lignin interactions with chiral enzymes and indeed there are small units of lignin which exhibit chirality by themselves, thereby opening up the possibility of using CD spectroscopy to investigate interactions of lignin, as well as cellulose, with next generation consolidants.
Author Contributions
Conceptualization, M.P.-J. and S.E.H.; writing—original draft preparation, M.P.-J; writing—review and editing, M.P.-J. and S.E.H.; visualization, M.P.-J.
Funding
This work was carried out as part of the Saving Oseberg Project jointly funded by the Norwegian Ministry of Education and Research and the University of Oslo.
Conflicts of Interest
The authors declare no conflict of interest. The funders had no role in the design of the study; in the collection, analyses, or interpretation of data; in the writing of the manuscript, or in the decision to publish the results.
References
- McReynolds, K.D.; Gervay-Hague, J. Examining the secondary structures of unnatural peptides and carbohydrate-based compounds utilizing circular dichroism. Tetrahed. Asymm. 2000, 11, 337–362. [Google Scholar] [CrossRef]
- Kelly, S.M.; Jess, T.J.; Price, N.C. How to study proteins by circular dichroism. Biochim. Biophys. Acta 2005, 1751, 119–139. [Google Scholar] [CrossRef]
- Zhou, L.; Poh, R.P.C.; Marks, T.S.; Chowdhry, B.Z.; Smith, A.R.W. Structure and denaturation of 4-chlorobenzoyl coenzyme A dehalogenase from Arthrobacter sp. Strain TM1. Biodegradation 2008, 19, 65–75. [Google Scholar] [CrossRef]
- Serdyuk, I.N.; Zaccai, N.R.; Zaccai, J. Optical activity. In Methods in Molecular Biophysics: Structure, Dynamics & Function; Cambridge University Press: Cambridge, UK, 2007; Chapter E4; pp. 601–624. [Google Scholar]
- Ranjbar, B.; Gill, P. Circular dichroism techniques: Biomolecular and nanostructural analyses—A review. Chem. Biol. Drug Des. 2009, 74, 101–120. [Google Scholar] [CrossRef]
- Norden, B.; Rodger, A.; Dafforn, T. Circular dichroism of biomolecules. In Linear Dichroism & Circular Dichroism; Royal Society for Chemistry: Cambridge, UK, 2010; Chapter 2; pp. 15–32. [Google Scholar]
- Patching, S.G.; Edara, S.; Ma, P.; Nakayama, J.; Hussain, R.; Siligardi, G.; Phillips-Jones, M.K. Interactions of the intact FsrC membrane histidine kinase with its pheromone ligand GBAP revealed through synchrotron radiation circular dichroism. Biochim. Biophys. Acta 2012, 1818, 1595–1602. [Google Scholar] [CrossRef]
- Phillips-Jones, M.K.; Patching, S.G.; Edara, S.; Nakayama, J.; Hussain, R.; Siligardi, G. Interactions of the intact FsrC membrane histidine kinase with the tricyclic peptide inhibitor siamycin I revealed through synchrotron radiation circular dichroism. Phys. Chem. Chem. Phys. 2013, 15, 444–447. [Google Scholar] [CrossRef]
- Siligardi, G.; Hussain, R.; Patching, S.G.; Phillips-Jones, M.K. Ligand- and drug-binding studies of membrane proteins revealed through circular dichroism spectroscopy. Biochim. Biophys. Acta 2014, 1838, 34–42. [Google Scholar] [CrossRef]
- Phillips-Jones, M.K.; Channell, G.; Kelsall, C.J.; Hughes, C.S.; Ashcroft, A.E.; Patching, S.G.; Dinu, V.; Gillis, R.B.; Adams, G.G.; Harding, S.E. Hydrodynamics of the VanA-type VanS histidine kinase: An extended solution conformation and first evidence for interactions with vancomycin. Sci. Rep. 2017, 7, 46180. [Google Scholar] [CrossRef]
- Rodger, A.; Ismail, M.A. Introduction to circular dichroism. In Spectrometry and Spectrofluorimetry: A Practical Approach; Gore, M., Ed.; Oxford University Press: Oxford, UK, 2000; Chapter 4; pp. 99–139. [Google Scholar]
- Lewis, D.G.; Johnson, W.C., Jr. Optical properties of sugars. VI. Circular dichroism of amylose and glucose oligomers. Biopolymers 1978, 17, 1439–1449. [Google Scholar] [CrossRef]
- Stipanovic, A.J.; Stevens, E.S. Vacuum UV circular dichroism of d-glucans. In Solution Properties of Polysaccharides; Brant, D.A., Ed.; American Chemical Society Symposium Series; ACS Publications: Washington, DC, USA, 1981; Chapter 21; Volume 150, pp. 303–315. [Google Scholar]
- Johnson, W.C., Jr. The circular dichroism of carbohydrates. Adv. Carbohydr. Chem. Biochem. 1987, 45, 73–124. [Google Scholar]
- Wulff, G.; Kubik, S. Circular dichroism and ultraviolet spectroscopy of complexes of amylose. Carbohydr. Res. 1982, 237, 1–10. [Google Scholar] [CrossRef]
- Taniguchi, T.; Monde, K. Chiroptical analysis of glycoconjugates by vibrational circular dichroism (VCD). Trends Glycosci. Glycotechnol. 2007, 19, 147–164. [Google Scholar] [CrossRef]
- Desplanques, S.; Grisel, M.; Malhiac, C.; Renou, F. Stabilizing effect of acacia gum on the xanthan helical conformation in aqueous solution. Food Hydrocol. 2014, 35, 181–188. [Google Scholar] [CrossRef]
- Zhang, W.; Huang, J.; Wang, W.; Li, Q.; Feng, W.; Zheng, D.; Zhao, T.; Mao, G.; Yang, L.; Wu, X. Extraction, purification, characterization and antioxidant activities of polysaccharides from Cistanche tubulosa. Int. J. Biol. Macromol. 2016, 93, 448–458. [Google Scholar] [CrossRef]
- Wang, J.; Yang, W.; Tang, Y.; Xu, Q.; Huang, S.; Yao, J.; Zhang, J.; Lei, Z. Regioselective sulfation of Artemisia sphaerocephala polysaccharide: Solution conformation and antioxidant activities in vitro. Carbohydr. Polym. 2016, 136, 527–536. [Google Scholar] [CrossRef]
- Shekarforoush, E.; Faralli, A.; Ndoni, S.; Mendes, A.C.; Chronakis, I.S. Electrospinning of xanthan polysaccharide. Macromol. Mater. Eng. 2017, 302, 1700067. [Google Scholar] [CrossRef]
- Drake, A.F. Circular dichroism. In Protein–Ligand Interactions: Structure and Spectroscopy A Practical Approach; Harding, S.E., Chowdhry, B.Z., Eds.; Oxford University Press: Oxford, UK, 2001; pp. 123–168. [Google Scholar]
- Ralph, J.; Peng, J.; Lu, F.; Hatfield, R.D.; Helm, R.F. Are lignins optically active? J. Agric. Food Chem. 1999, 47, 2991–2996. [Google Scholar] [CrossRef]
- Sutherland, J.C.; Desmond, E.J.; Takacs, P.Z. Versatile spectrometer for experiments using synchrotron radiation at wavelengths greater than 100 nm. Nucl. Instrum. Meth. 1980, 172, 195–199. [Google Scholar] [CrossRef]
- Snyder, P.A.; Rowe, E.M. The first use of synchrotron radiation for vacuum ultraviolet circular dichroism measurements. Nucl. Instrum. Meth. 1980, 172, 345–349. [Google Scholar] [CrossRef]
- Wallace, B.A. Shining new light on protein structure and function through synchrotron radiation circular dichroism (SRCD) spectroscopy. Aust. Biochem. 2005, 36, 47–50. [Google Scholar]
- Matsuo, K.; Gekko, K. Vacuum-ultraviolet circular dichroism study of saccharides by synchrotron radiation spectrophotometry. Carbohydr. Res. 2004, 339, 591–597. [Google Scholar] [CrossRef]
- Miles, A.J.; Wallace, B.A. Synchrotron radiation circular dichroism spectroscopy of proteins and applications in structural and functional genomics. Chem. Soc. Rev. 2006, 35, 39–51. [Google Scholar] [CrossRef]
- Wu, P.; Yu, Y.; McGhee, C.E.; Tan, L.-H.; Lu, Y. Applications of synchrotron-based spectroscopic techniques in studying nucleic acids and nucleic acid-functionalized nanomaterials. Adv. Mater. 2014, 26, 7849–7872. [Google Scholar] [CrossRef]
- Miles, A.J.; Wallace, B.A. Circular dichroism spectroscopy of membrane proteins. Chem. Soc. Rev. 2016, 45, 4859–4872. [Google Scholar] [CrossRef]
- Matsuo, K. Vacuum-ultraviolet circular dichroism study of oligosaccharides using a synchrotron-radiation spectrophotometer. Biomed. Spectrosc. Imaging 2017, 6, 111–121. [Google Scholar] [CrossRef]
- Alonso, D.M.; Wettstein, S.G.; Dumesic, J.A. Bimetallic catalysts for upgrading of biomass to fuels and chemicals. Chem. Soc. Rev. 2012, 41, 8075–8098. [Google Scholar] [CrossRef]
- Klemm, D.; Heublein, B.; Fink, H.-P.; Bohn, A. Cellulose: Fascinating biopolymer and sustainable raw material. Angew. Chem. Int. Ed. 2005, 44, 3358–3393. [Google Scholar] [CrossRef]
- Pedersen, N.B.; Björdal, C.G.; Felby, C. Bacterial degradation of archaeological wood in anoxic waterlogged environments. In Stability of Complex Carbohydrate Structures—Biofuel, Foods, Vaccines and Shipwrecks; Harding, S.E., Ed.; Royal Society of Chemistry: Cambridge, UK, 2012; pp. 160–187. [Google Scholar]
- Usov, I.; Nyström, G.; Adamcik, J.; Handschin, S.; Schütz, C.; Fall, A.; Bergström, L.; Mezzenga, R. Understanding nanocellulose chirality and structure–properties relationship at the single fibril level. Nat. Commun. 2015, 6, 7564. [Google Scholar] [CrossRef]
- Meissner, D.; Einfeldt, J.; Schareina, T. New results concerning the behaviour of cellulose acetate in solutions and films by means of CD measurements. Biopolymers 1999, 50, 163–166. [Google Scholar] [CrossRef]
- Johnson, W.C., Jr. A circular dichroism spectrometer for the vacuum ultraviolet. Rev. Sci. Instrum. 1971, 42, 1283–1286. [Google Scholar] [CrossRef]
- Stevens, E.S.; Morris, E.R.; Rees, D.A.; Sutherland, J.C. Synchrotron light source applied to measuring the vacuum ultraviolet circular dichroism of heparin. J. Am. Chem. Soc. 1985, 107, 2982–2983. [Google Scholar] [CrossRef]
- Ritcey, A.M.; Gray, D.G. Induced CD provides evidence for helical solution conformation in cellulosic chains. Biopolymers 1988, 27, 479–491. [Google Scholar] [CrossRef]
- Engle, A.R.; Purdie, N.; Hyatt, J.A. Induced circular dichroism study of the aqueous solution complexation of cello-oligosaccharides and related polysaccharides with aromatic dyes. Carbohydr. Res. 1994, 265, 181–195. [Google Scholar] [CrossRef]
- Dong, X.M.; Gray, D.G. Induced circular dichroism of isotropic and magnetically-oriented chiral nematic suspensions of cellulose crystallites. Langmuir 1997, 13, 3029–3034. [Google Scholar] [CrossRef]
- Woodcock, S.; Henrissat, B.; Sugiyama, J. Docking of Congo red to the surface of crystalline cellulose using molecular mechanics. Biopolymers 1995, 36, 201–210. [Google Scholar] [CrossRef]
- Mazeau, K.; Wyszomirski, M. Modelling of Congo red adsorption on the hydrophobic surface of cellulose using molecular dynamics. Cellulose 2012, 19, 1495–1506. [Google Scholar] [CrossRef]
- Conley, K.; Whitehead, M.A.; van de Ven, T.G.M. Probing the structural chirality of crystalline cellulose with induced circular dichroism. Cellulose 2017, 24, 479–486. [Google Scholar] [CrossRef]
- Miyamoto, H.; Yuguchi, Y.; Rein, D.M.; Cohen, Y.; Ueda, K.; Yamane, C. Structure of cellulose/direct dye complex regenerated from supercritical water. Cellulose 2016, 23, 2099–2115. [Google Scholar] [CrossRef]
- Conley, K.M.; Godbout, L.; Whitehead, M.A.; van de Ven, T.G.M. Reversing the structural chirality of cellulosic nanomaterials. Cellulose 2017, 24, 5455–5462. [Google Scholar] [CrossRef]
- Mortensen, M.N.; Egsgaard, H.; Hvilsted, S.; Shashoua, Y.; Glastrup, J. Characterisation of the polyethylene glycol impregnation of the Swedish warship Vasa and one of the Danish Skuldelev Viking ships. J. Archaeol. Sci. 2007, 34, 1211–1218. [Google Scholar] [CrossRef]
- Hocker, E.; Almkvist, G.; Sahlstedt, M. The Vasa experience with polyethylene glycol: A conservator’s perspective. J. Cult. Herit. 2012, 13, S175–S182. [Google Scholar] [CrossRef]
- Schofield, E.J. Illuminating the past: X-ray analysis of our cultural heritage. Nat. Rev. Mater. 2018, 3, 285–287. [Google Scholar] [CrossRef]
- McHale, E. Development of Lignin-Like Oligomers for the Consolidation of Waterlogged Archaeological Wood. Ph.D. Thesis, University of Oslo, Oslo, Norway, 2018. [Google Scholar]
- Braovac, S.; Kutzke, H. The presence of sulfuric acid in alumconserved wood—Origin and consequences. J. Cult. Herit. 2012, 13, S203–S208. [Google Scholar] [CrossRef]
- Braovac, S. Alum-Treated Wood, Material Characterisation, a Case Study of the Oseberg Finds; The Royal Danish Academy of Fine Arts: Copenhagen, Denmark, 2015. [Google Scholar]
- Andriulo, F.; Braovac, S.; Kutzke, H.; Giorgi, R.; Baglioni, P. Nanotechnologies for the restoration of alum-treated archaeological wood. Appl. Phys. A 2016, 122, 322. [Google Scholar] [CrossRef]
- Wakefield, J.M.K.; Gillis, R.B.; Adams, G.G.; McQueen, C.M.A.; Harding, S.E. Controlled depolymerisation assessed by analytical ultracentrifugation of low molecular weight chitosan for use in archaeological conservation. Eur. Biophys. J. 2018, 47, 769–775. [Google Scholar] [CrossRef]
- Walsh, Z.; Janeček, E.-R.; Hodgkinson, J.T.; Sedlmair, J.; Koutsioubas, A.; Spring, D.R.; Welch, M.; Hirschmugl, C.J.; Toprakcioglu, C.; Nitschke, J.R.; et al. Multifunctional supramolecular polymer networks as next-generation consolidants for archaeological wood conservation. Proc. Natl. Acad. Sci. USA 2014, 111, 17743–17748. [Google Scholar] [CrossRef]
- Schofield, E.J.; Delaveris, C.; Sarangi, R. Alkaline earth carbonates for the treatment of problematic sulfur associated with marine archaeological wood. J. Archaeol. Sci. 2015, 4, 427–433. [Google Scholar]
- Schofield, E.J.; Sarangi, R.; Mehta, A.; Jones, A.M.; Smith, A.; Mosselmans, J.F.W.; Chadwick, A.V. Strontium carbonate nanoparticles for the surface treatment of problematic sulfur and iron in waterlogged archaeological wood. J. Cult. Herit. 2016, 18, 306–312. [Google Scholar] [CrossRef]
- Christensen, M.; Larnøy, E.; Kutzke, H.; Hansen, F.K. Treatment of waterlogged archaeological wood using chitosan- and modifed chitosan solutions. Part 1: Chemical compatibility and microstructure. J. Am. Inst. Conserv. 2015, 54, 3–13. [Google Scholar] [CrossRef]
- Walsh, Z.; Janeček, E.-R.; Jones, M.; Scherman, O.A. Natural polymers as alternative consolidants for the preservation of waterlogged archaeological wood. Stud. Conserv. 2017, 62, 173–183. [Google Scholar] [CrossRef]
- McHale, E.; Braovac, S.; Steindal, C.C.; Gillis, R.B.; Adams, G.G.; Harding, S.E.; Benneche, T.; Kutzke, H. Synthesis and characterization of lignin-like oligomers as a bio-inspired consolidant for waterlogged archaeological wood. Pure Appl. Chem. 2016, 88, 969–977. [Google Scholar] [CrossRef]
- McHale, E.; Steindal, C.C.; Kutzke, H.; Benneche, T.; Harding, S.E. In situ polymerization of isoeugenol as a green consolidation method for waterlogged archaeological wood. Sci. Rep. 2017, 7, 46481. [Google Scholar] [CrossRef] [PubMed]
- Kaya, F.; Heitmann, J.A.; Joyce, T.W. Influence of lignin and its degradation products on enzymatic hydrolysis of xylan. J. Biotechnol. 2000, 80, 241–247. [Google Scholar] [CrossRef]
- Durán, N.; Mansilla, H.; Leite, L.C.C.; Faljoni-Alario, A. Peroxidase-hydrogen peroxide system acting on lignin. J. Inorg. Biochem. 1988, 34, 105–115. [Google Scholar] [CrossRef]


© 2019 by the authors. Licensee MDPI, Basel, Switzerland. This article is an open access article distributed under the terms and conditions of the Creative Commons Attribution (CC BY) license (http://creativecommons.org/licenses/by/4.0/).