1. Introduction
Over the past few decades, the global disease burden has shifted significantly from communicable to non-communicable diseases (NCDs), with cardiovascular diseases (CVDs), cancer, diabetes, and chronic respiratory illnesses now accounting for the vast majority of premature deaths worldwide. In 2019, 17.8% of the global population aged 30–70 faced the risk of premature death due to NCDs, and this risk was greater for men than for women [
1]. According to the same source, Serbia is above the global average (22% for both sexes), with males (28.3%) being at greater risk than females (15.9%), similar to the pattern observed at the global level. Official national data from 2022 [
2] show that CVDs, cancer, and chronic respiratory conditions collectively accounted for 71.8% of annual deaths in Serbia.
Recognizing the significant impact of NCDs on global health, SDG Target 3.4 aims to reduce premature mortality from NCDs through prevention and treatment by one-third by the year 2030 relative to 2015 levels [
3]. While numerous SDG initiatives have been undertaken, Singh Thakur et al. [
4] consider progress to be slow. The same authors state that data from various countries indicate that only two out of the ten NCDs progress indicators are being achieved by at least half of the 176 countries that endorsed the SDGs. According to other assessments, most countries have very little possibility of reaching this target. Thus, a study carried out by a team of researchers [
5] employed cause-specific mortality data to evaluate the risk and patterns of mortality related to NCDs worldwide and to identify strategies for achieving SDG Target 3.4. A decline in premature mortality from NCDs was recorded in many countries, but the rate of progress was insufficient to meet SDG Target 3.4. Pathway analyses indicate that every country has viable options for reaching this target. This study also highlights the importance of multifaceted interventions, including tobacco and alcohol control, hypertension and diabetes treatment, CVD prevention, asthma and chronic obstructive pulmonary disease management, and cancer screening and treatment. Moreover, Piñeiro et al. [
6] emphasized the critical need for an accelerated global reduction in CVD mortality to attain the SDG. The COVID-19 pandemic has compromised numerous countries’ ability to attain the SDGs, including target 3.4; the situation has worsened particularly in low- and middle-income countries [
7]. As Leal Filho et al. [
8] have noted, the failure to achieve the SDGs is expected to have far-reaching consequences, including widespread harm to livelihoods, rising poverty, and increased disease burdens, with particularly severe impacts on vulnerable populations in developing countries.
In Serbia, CVDs account for over half of total mortality, representing a major obstacle to achieving SDG 3.4. Addressing cardiovascular mortality (CVM) is therefore not only a clinical challenge but also a core development issue. The Progress report on the Republic of Serbia’s implementation of the SDG by 2030 assessed the likelihood of achieving the set targets over a four-year period (2015–2019) [
9]. It found only a marginal decline in the share of deaths attributable to CVDs, cancer, diabetes, and chronic respiratory disease, from 21.2% to 20.7% for the entire population. The Report also highlights pronounced gender disparities, noting that despite declining rates, mortality levels remain consistently higher among males than females. According to the Sustainable Development Report 2024 [
10], Serbia’s age-standardized death rate due to CVDs, cancer, diabetes, or chronic respiratory disease in adults aged 30–70 years was 22%, aligning with the global average for that year. Despite this alignment, Serbia faces significant challenges in this area, with the overall trend remaining largely stagnant.
Eurostat data [
11] position Serbia among the top-ranking countries in Europe, placing it third position with 884.4 deaths from CVDs per 100,000 inhabitants in 2021. The highest rate was recorded in neighboring Bulgaria, ranking first with 1211 deaths per 100,000 inhabitants, followed by Romania in second place with 1005.4 deaths per 100,000 inhabitants. By comparison, France recorded the lowest rate, with only 169.9 deaths per 100,000 inhabitants. High values are often associated with a high proportion of older population groups, particularly those aged 65 and over [
12]. In this regard, Serbia is characterized by an advanced stage of demographic aging. Marinković & Anđelković [
13] state that according to the 2022 Census, individuals aged 65 and over accounted for 22.1% of the total population. A more detailed municipal-level analysis revealed that 88.7% of municipalities are in the fourth, most advanced stage of demographic aging [
14]. Previous studies indicate that spatial differences in CVD mortality in Serbia are associated with variations in air pollution levels [
15] as well as with demographic and socioeconomic characteristics of the population, including ageing, marital status, educational attainment, gender, income, self-assessed health, and health-related attitudes and risk factors [
16,
17].
The application of spatial and spatio-temporal analyses over the past few decades has provided researchers and policymakers with opportunities to examine the patterns of CVD mortality across space and time at lower territorial levels. Mena and his colleagues [
18] provided an extensive review of the literature concerning the utilization of spatial analysis in examining CVDs. They underscored the crucial nature of research incorporating spatial and spatio-temporal analyses, noting that such approaches are essential for prioritizing, allocating resources, and implementing policies effectively, given their ability to offer insight into the factors involved in the disease across both temporal and spatial dimensions. In a study carried out across Mexican municipalities, Baptista [
19] initially examined spatial patterns of CVM. In the subsequent phase, the temporal dimension was incorporated, highlighting the significance of the space-time continuum in CVM research. Almendra and Santana [
20] analyzed the changes in the spatial distribution of CVD-related deaths from 1991 to 2017 in the 278 municipalities of Continental Portugal. They identified high-risk areas and assessed variations using retrospective spatio-temporal cluster analysis and analyses of spatial variation in temporal trends. Some researchers employ spatial analysis, particularly Geographically Weighted Regression GWR, to identify the impact of factors associated with CVM, quantify their effects, and assess the spatial variability of these relationships [
21,
22]. Lović Obradović et al. [
23] explored the spatial clustering of CVM as one of four predictors of population vulnerability to the COVID-19 pandemic in Serbia, alongside the share of the population aged 65 and over, the number of deaths from respiratory diseases, and the number of cancer deaths, using spatial analytical techniques. Their findings revealed clusters of elevated CVM values, including a pronounced cluster in Eastern Serbia, indicating high-risk areas. Despite these efforts, spatial analysis of CVM in Serbia remains underutilized.
In this context, the use of forecasting models becomes essential for evaluating future trajectories in CVD mortality and assessing whether municipalities are progressing toward, or diverging from, the targets outlined in SDG 3.4. The utilization of national mortality data, especially at lower territorial levels (settlement and municipality) may facilitate the identification of potential directions and consequent implications for local units and their corresponding healthcare sectors [
24,
25,
26,
27]. Previous research offers predictive results at the national or regional level. The strengths of these findings include data stratification by sex [
28] or age [
29]. Findings of Kornus et al. [
30] indicate a forecasted slight increase in overall CVM in Sumy region (Ukraine) by 2025, driven primarily by a rise in certain cardiovascular pathologies despite a decrease in cerebrovascular disease mortality. The limitation of mentioned studies lies in using the same model for all territorial units without considering their differences. Spatial analyses are based on location-specific information and provide the opportunity to forecast trends and quantify changes at the local level, with an individual approach to each territorial unit.
While previous research has demonstrated the value of predictive modelling and GIS-based approaches in analyzing health outcomes, most studies predominantly operate at the national or regional scale and often overlook intra-national disparities. Although several papers have explored CVD mortality trends or assessed spatial patterns in health, few have combined temporal forecasting with spatial disaggregation at the municipal level. Moreover, the integration of such approaches within the SDG monitoring and implementation framework remains limited, particularly in Central and Eastern Europe.
This study addresses these gaps by applying a multi-model spatiotemporal forecasting approach to CVD mortality counts across municipalities in Serbia. Rather than introducing new algorithms, the methodological contribution lies in the way existing spatio-temporal forecasting models are combined, validated, and applied at a fine spatial scale to support SDG monitoring and place-based public health planning. This approach demonstrates how location-specific model selection within a spatial forecasting framework can reveal heterogeneity that would remain hidden under a single-model national forecasting strategy. Specifically, the contribution of the paper lies in (1) the application of a multi-model forecasting framework (Curve Fit, Exponential Smoothing, and Forest-based models) at a fine spatial scale, (2) the use of municipality-specific model selection based on localized forecast validation rather than a single uniform model, and (3) the integration of spatially explicit forecasts into the assessment of progress toward SDG Target 3.4. To the best of our knowledge, this is the first study to produce municipality-level forecasts of CVD-related mortality in Serbia using a spatially disaggregated, model-comparative approach, thereby advancing evidence-based and place-sensitive public health planning.
Building on the outlined methodological contributions, the primary objective of this study is to evaluate whether Serbia is on a trajectory to achieve SDG Target 3.4 by forecasting deaths from CVDs at the municipal level using spatio-temporal analytical models. Although SDG 3.4 encompasses a wider set of non-communicable diseases, including cancers, chronic respiratory diseases, and diabetes, the analytical focus is placed on CVDs as the dominant cause of mortality in Serbia, responsible for roughly half of all recorded deaths over an extended period. According to the 2022 Census, Serbia’s population stands at approximately 6.6 million [
31], with CVD-related deaths averaging around 50,000 annually in recent years [
2,
32]. Drawing on time-series data for Local Administrative Units (LAU 1) from 2005 to 2022, the study generates municipality-level mortality forecasts through a spatio-temporal modeling framework. All modelling procedures were implemented using the standardized algorithms available in the ArcGIS (Version 3.1) Pro Space Time Pattern Mining toolbox, and identical forecasting horizons and validation settings were applied across municipalities, while model parameters were optimized internally by the algorithms to ensure methodological consistency and comparability of results. By relying on localized model validation to identify the most suitable forecasting approach for each municipality, the analysis enables a granular assessment of future mortality dynamics. This, in turn, allows for the identification of municipalities where CVD-related deaths are forecasted to increase and for the quantification of these changes in relative terms, thereby revealing spatial divergences from the SDG 3.4 target and highlighting areas where targeted and place-specific public health interventions may be most urgently needed.
The remainder of the paper is structured as follows.
Section 2 outlines the data sources and the spatio-temporal forecasting methodology, including model specification and validation procedures.
Section 3 presents the empirical results, encompassing historical trend analysis, model performance assessment, and municipal-level forecasts of CVD-related mortality.
Section 4 discusses the findings in relation to spatial disparities, demographic dynamics, and progress toward SDG Target 3.4. Finally,
Section 5 summarizes the main conclusions and highlights key policy implications for territorially differentiated public health planning.
2. Materials and Methods
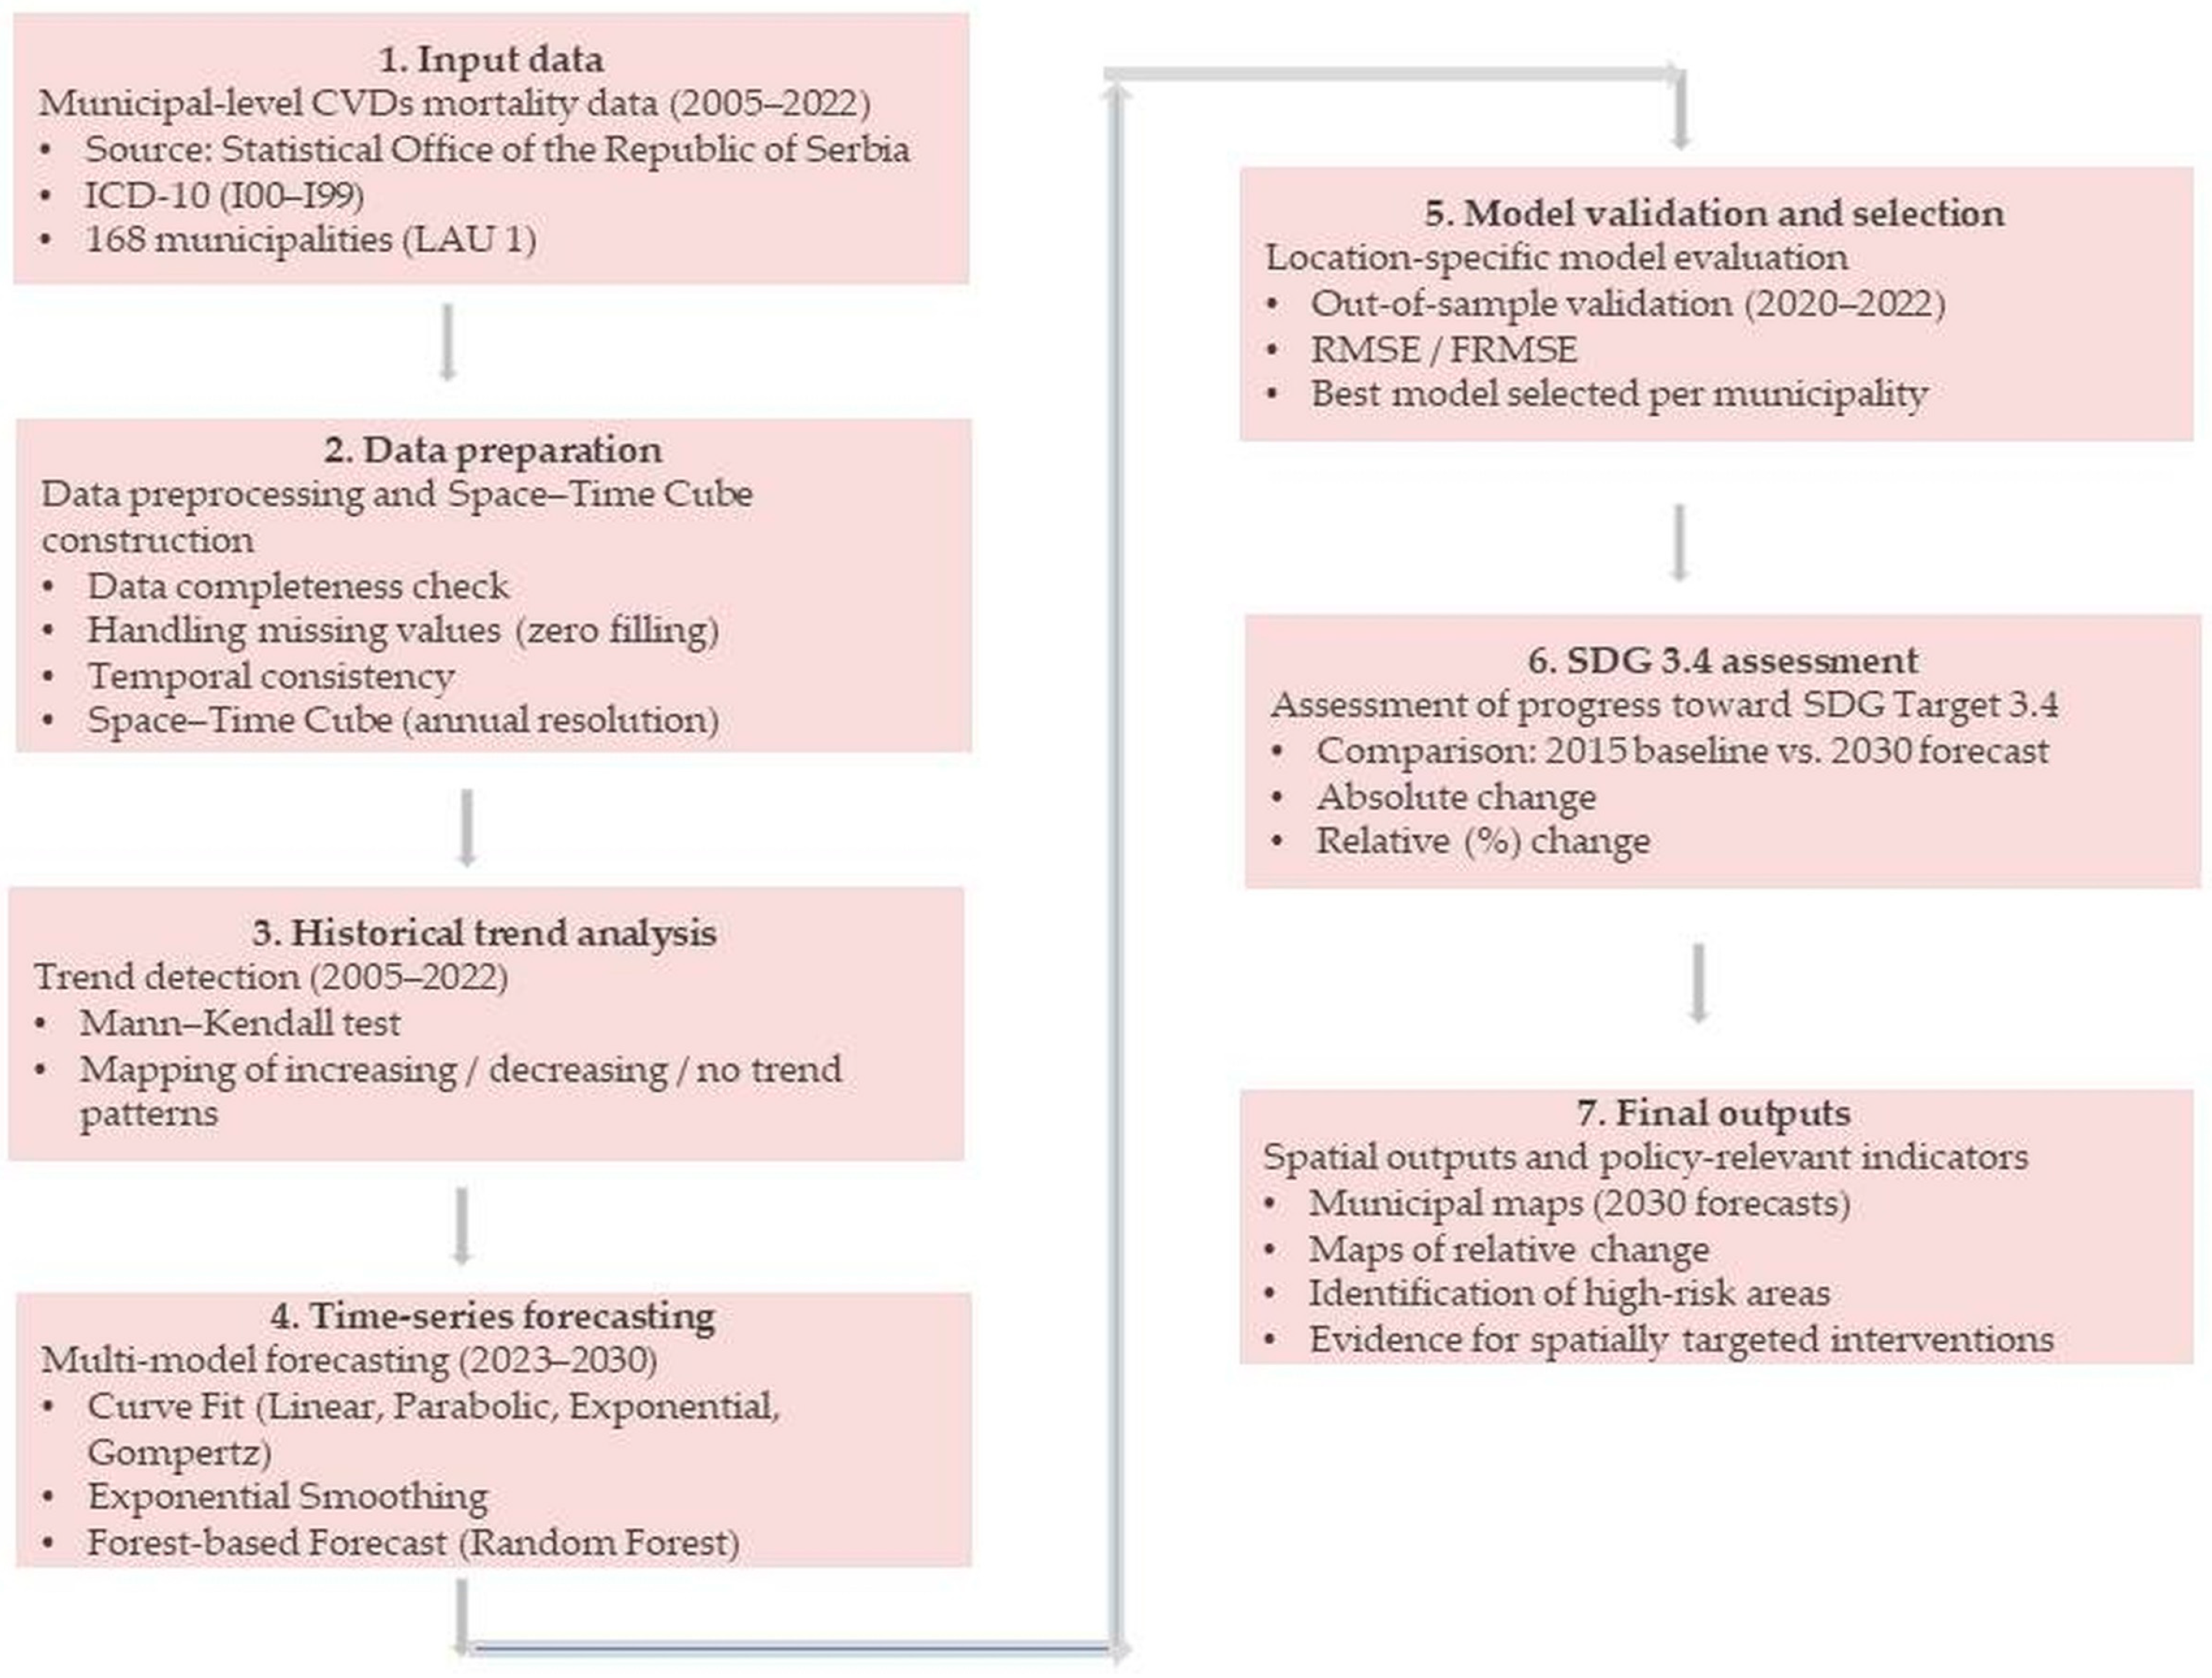
This study employs a multi-step spatio-temporal analytical framework to forecast municipal-level CVD mortality in Serbia and to assess progress toward SDG Target 3.4. The methodology consists of seven stages: (1) data input and (2) data preparation, including the construction of a space–time cube based on annual municipal CVD mortality data (2005–2022); (3) historical trend analysis using the Mann–Kendall test; (4) multi-model time-series forecasting using three established approaches (Curve Fit, Exponential Smoothing, and Forest-based forecasting); (5) location-specific model validation and selection based on forecast accuracy; (6) spatial analysis of forecasted changes relative to the 2015 SDG baseline; and (7) the quantification and cartographic presentation of final outputs in both absolute and relative terms. Each stage is described in detail in the following paragraphs. The overall methodological workflow is summarized in
Figure 1.
Prior to analysis, municipal-level CVD mortality data were examined for completeness, temporal consistency, and extreme values. Missing annual observations were identified for a small number of municipalities, primarily those with very small populations or those affected by administrative changes. Considering that the Space–Time Cube framework in ArcGIS requires a complete time-series for each spatial unit, missing observations were coded as zeros. This approach does not imply that no deaths occurred in those years but rather reflects the absence of recorded data in the source dataset. Although this procedure may reduce short-term variability in affected locations, the number of missing observations was limited relative to the full dataset (168 municipalities over an 18-year period), and forecast reliability was subsequently evaluated using model-specific validation metrics.
For the purposes of this research, data on the number of deaths from CVDs at the municipal level for the period 2005–2022 were obtained from the Statistical Office of the Republic of Serbia [
2]. The dataset relies on the CVDs (IC-10 codes I00–I99) as the primary cause of mortality. The coding of the data followed the guidelines of the International Classification of Diseases, tenth revision (ICD-10) [
33]. The analysis is based on annual CVD mortality counts rather than age-standardized or population-adjusted rates. This approach was adopted because the forecasting framework implemented in the ArcGIS Pro Space Time Pattern Mining toolbox operates on absolute time-series values and is designed to model count-based observations for each spatial location (municipality). As a result, the models capture changes in CVD mortality counts within municipalities over time. The aim of the analysis is therefore to examine the spatiotemporal dynamics of mortality counts across municipalities rather than to compare epidemiological risk levels across populations of different sizes and age structures. The municipalities within the Autonomous Province of Kosovo and Metohija were excluded from the analysis, as the territory is administered under United Nations mandate in accordance with United Nations Security Council Resolution 1244 (1999) [
34]. This decision was necessitated by the lack of recent data (the most recent official data date back to 1998). The focus is therefore on municipalities (168 spatial units), corresponding to Local Administrative Units level 1 (LAU 1), allowing for a more precise interpretation of local differences in future mortality trends.
To forecast the number of CVD-related deaths within each municipality, the analysis followed a structured sequence of steps. All forecasts were generated using the Space Time Pattern Mining toolbox [
35,
36] in ArcGIS Pro (Version 3.1), which implements standardized versions of Curve Fit, Exponential Smoothing, and Forest-based forecasting algorithms. To ensure comparability across models and locations, identical forecasting horizons and validation settings were applied to all municipalities. For each municipality, annual CVD mortality counts from 2005–2022 were used as input. The final three time steps (2020–2022) were used for out-of-sample validation, while the remaining observations were used for model fitting. Forecast uncertainty was evaluated through out-of-sample validation using the Root Mean Squared Error (RMSE), and, where available, model-generated confidence intervals. These measures were used to assess forecast reliability and to guide the selection of the most appropriate model for each municipality. The overall trends in the number of deaths from CVDs from 2005 to 2022, determined using the Mann–Kendall statistics [
37,
38], were mapped, allowing for a comprehensive understanding of the temporal evolution derived from the historical time-series data. In addition to the observed data for 2005–2022, the space–time cube also included forecasted values for the period 2023–2030, serving as essential inputs for subsequent analyses.
To forecast the number of deaths from CVDs for each municipality from 2023 to 2030, the analysis applied three established forecasting approaches designed for time-series data [
39]. The Curve Fit Forecast model estimates future values by fitting mathematical functions to historical time-series data and selecting the best-fitting function based on goodness-of-fit criteria. This approach involves curve fitting, employing four distinct types of parametric curves: linear, parabolic, exponential, and Gompertz (S-shaped) [
40]. For each municipality, the optimal curve specification was determined empirically by selecting the model that achieved the lowest validation RMSE, ensuring the best fit to observed data [
41].
Second, the Exponential Smoothing Forecast is a widely used time-series forecasting technique that assigns exponentially decreasing weights to older observations while giving greater importance to more recent values. Model parameters are automatically optimized using in-sample error minimization. This approach is appropriate for municipal CVD mortality series, which typically exhibit a combination of underlying trend and gradual temporal dynamics, allowing it to capture moderate short-term fluctuations around longer-term dynamics. Smoothing parameters were optimized internally by minimizing forecast error, and 90% confidence intervals were generated for each forecasted value [
42,
43].
Finally, the Forest-based Forecast model represents a machine-learning ensemble method that combines predictions from multiple decision trees to improve predictive accuracy and reduce overfitting [
44]. This data-driven approach is particularly suitable for municipalities exhibiting irregular or non-linear patterns where conventional parametric models fail to provide robust forecasts. Model parameters followed the default configuration implemented in ArcGIS Pro, including the automated selection of the number and depth of trees, an approach recommended for short-to-moderate-length time series. To enable a valid comparison across methods and locations, the same forecasting horizon and validation window were applied consistently to all three models. The software allows the mapping of forecasted values for each year spanning 2023 to 2030. Additional technical details regarding model implementation are summarized in
Table 1, including the key parameters and algorithmic characteristics of each forecasting approach as implemented in the ArcGIS Pro Space Time Pattern Mining toolbox.
Subsequently, model comparison and evaluation were conducted using Evaluating Forecasts by Location [
45]. The assessment was based on the forecasted results for each time step, with the evaluation aiming to identify the model offering the most accurate forecasts of CVD-related deaths within each municipality. The minimum Forecast Root Mean Squared Error (FRMSE) indicates the overall fit of the forecast model. This approach allowed for the clear identification of the most suitable forecast model for each municipality, consistent with observed trends. The forecasted number of deaths from CVDs for 2030, representing the final time step, was thereby obtained based on the model deemed the best-performing predictor for each municipality. These values constitute the final output of the analysis.
Thereafter, the absolute and relative (percentage) differences between the forecasted values for 2030 (the final forecast year) and the data for 2015, the baseline year for evaluating progress, were calculated. This approach to measuring change, particularly the use of relative differences, provides clearer insight into variations in the number of CVD deaths, as analyses based solely on absolute counts can obscure real patterns due to differences in municipal population sizes. Following this calculation, cartographic representations were generated to visually depict these values, facilitating an assessment of the likelihood of individual municipalities achieving SDG Target 3.4.
3. Results
The Results Section presents both intermediate analytical outputs (trend classification, model validation metrics, and model selection) and final forecasted outcomes in order to ensure transparency and reproducibility. During the observed eighteen-year period (2005–2022), a total of nearly one million deaths (994,483) were attributed to CVDs, averaging 55,249 deaths per year. The highest absolute number of deaths occurred at the beginning of the period (60,684), while the lowest was recorded in the final year of the study period (51,624). After adjusting for changes in population size over the years, the highest CVD mortality rate was recorded in 2021, with 833 deaths per 100,000 population, whereas the lowest rate was observed in 2016, with 740 deaths per 100,000 population.
3.1. Trend Analysis of the Number of Deaths from CVDs Based on Historical Data (2005–2022), by Municipality
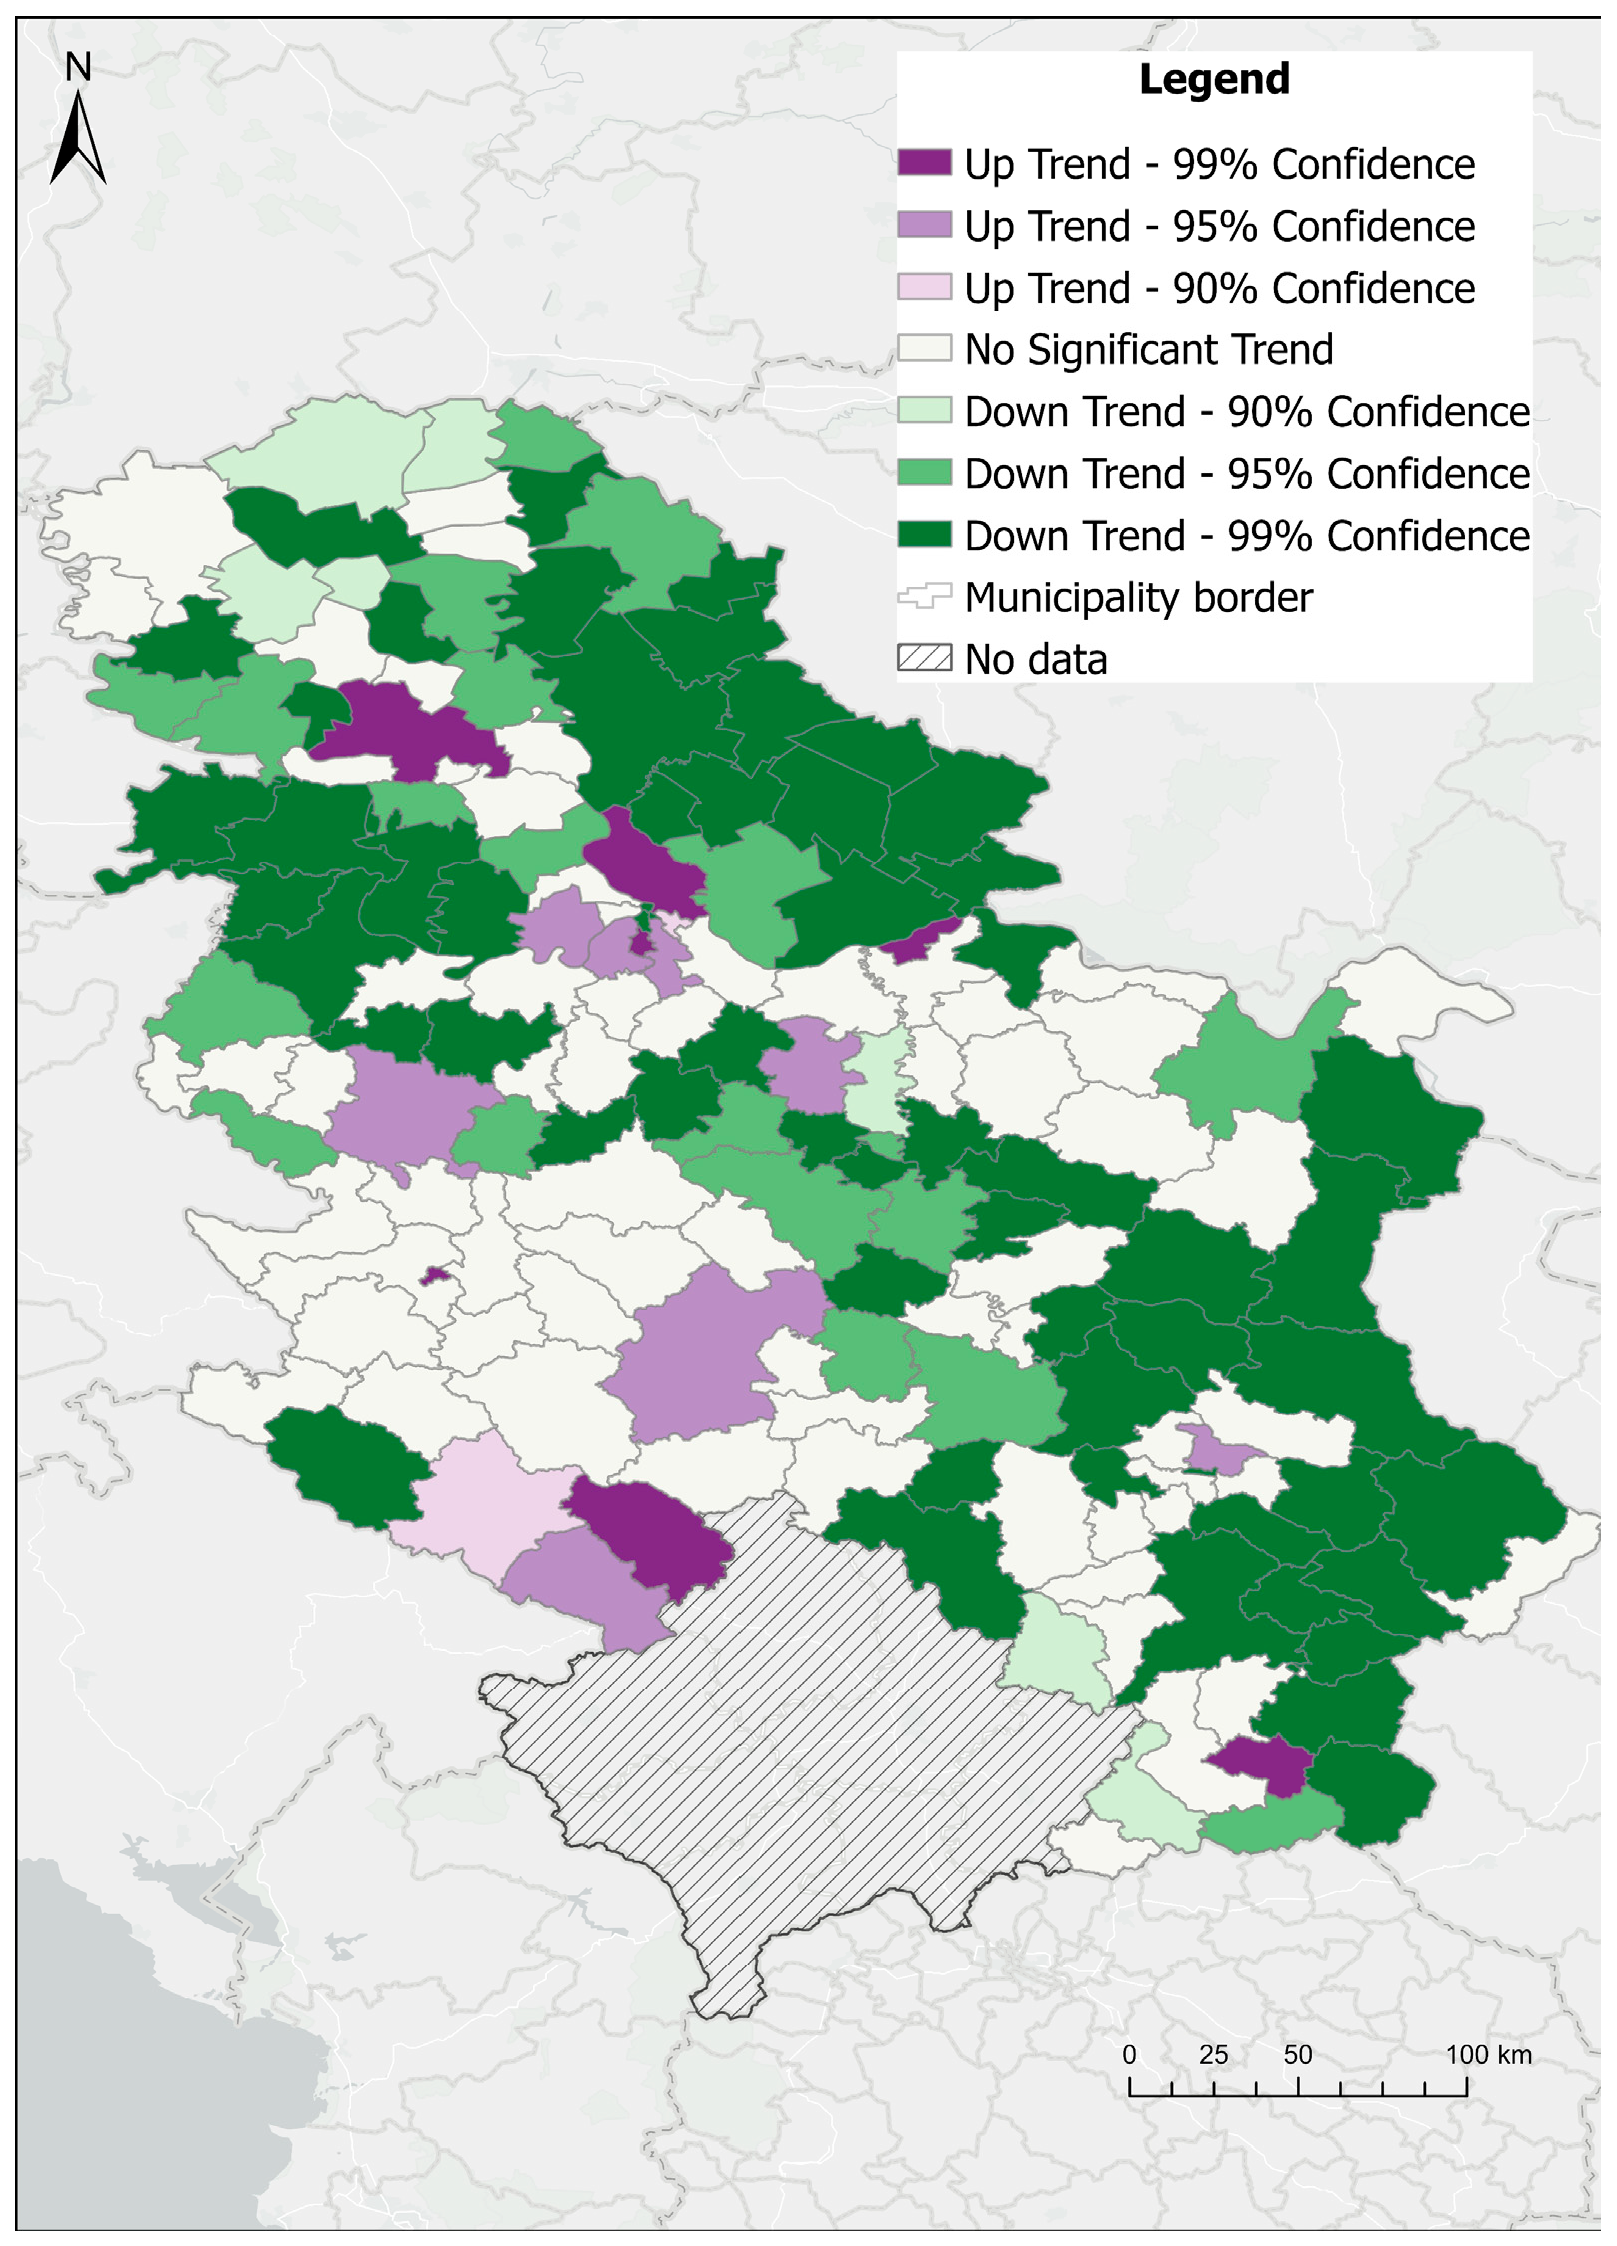
Historical data on the number of deaths from CVDs in the time series spanning 2005–2022, shown in
Figure 2, indicate a predominant declining trend. This trend was observed in 85 municipalities (50.6%). In 59 municipalities, the trend was significant at a 99% confidence level, in 18 municipalities at a 95% confidence level, and in eight municipalities at a 90% confidence level. These municipalities exhibiting a declining trend are also characterized by decades-long population decline, which is expected to continue in the future. Consequently, the absolute number of CVD deaths is decreasing. From a geographical perspective, these municipalities are clustered in several spatial groups located in the northeastern, northwestern, and central-southeastern parts of the country.
In contrast, a rising trend was observed in only 19 municipalities (11.3%) (seven at the 99% confidence level, eight at the 95% confidence level, and two at the 90% confidence level). In 64 municipalities (38.1%), no statistically significant trend was recorded. This indicates that these municipalities exhibit noticeable fluctuations between increasing and decreasing values of CVD-related deaths during the observed period.
3.2. Forecast of the Number of Deaths from CVDs in 2030 Using Three Forecasting Models at the National Level
To assess Serbia’s progress toward SDG Target 3.4, the forecasted number of deaths from CVDs in 2030 was compared with the baseline year 2015. Forecasts from all three models indicate a reduction in CVD-related deaths by 2030. At the national level, the largest difference is observed between the 2015 baseline (54,376 deaths) and the highest forecasted value obtained using the Curve Fit Forecast model (50,019 deaths). This model forecasts that the number of deaths from CVDs will decrease by 8.7% at the national level. The results obtained using the Exponential Smoothing model indicate a forecasted decrease of 7.8% by 2030 compared with 2015, corresponding to 50,421 deaths. According to the Forest-based model, the smallest reduction is forecasted, amounting to 692 fewer deaths (a decrease of 6.8%), resulting in 50,932 deaths.
The maximum reduction in the number of deaths from CVDs at the national level by 2030 compared to 2015 is 8.7%, suggesting that Serbia is unlikely to achieve SDG Target 3.4. When compared with the most recent year of observed data (2022), all models also forecast a modest decline; however, this comparison is less informative because 2022 recorded the lowest mortality values within the observed period.
3.3. The Most Reliable Model for Forecasting the Number of Deaths from CVDs at the Municipal Level
Before selecting the final forecasting model for each municipality, forecast accuracy was evaluated using FRMSE values derived from out-of-sample validation.
Table 2 summarizes the distribution of minimum, maximum, mean, median, and standard deviation RMSE values across models, illustrating differences in performance and variability. This evaluation step ensured that model selection was based on empirical accuracy rather than a priori assumptions. Lower RMSE values indicate that, on average, the model’s forecasts in certain municipalities closely match the observed values, implying high forecasting accuracy. Conversely, higher RMSE values indicate that the model’s forecasts deviate substantially from observed values, suggesting poorer predictive performance. The standard deviation reflects the variability in forecast errors, indicating that model performance varies across municipalities.
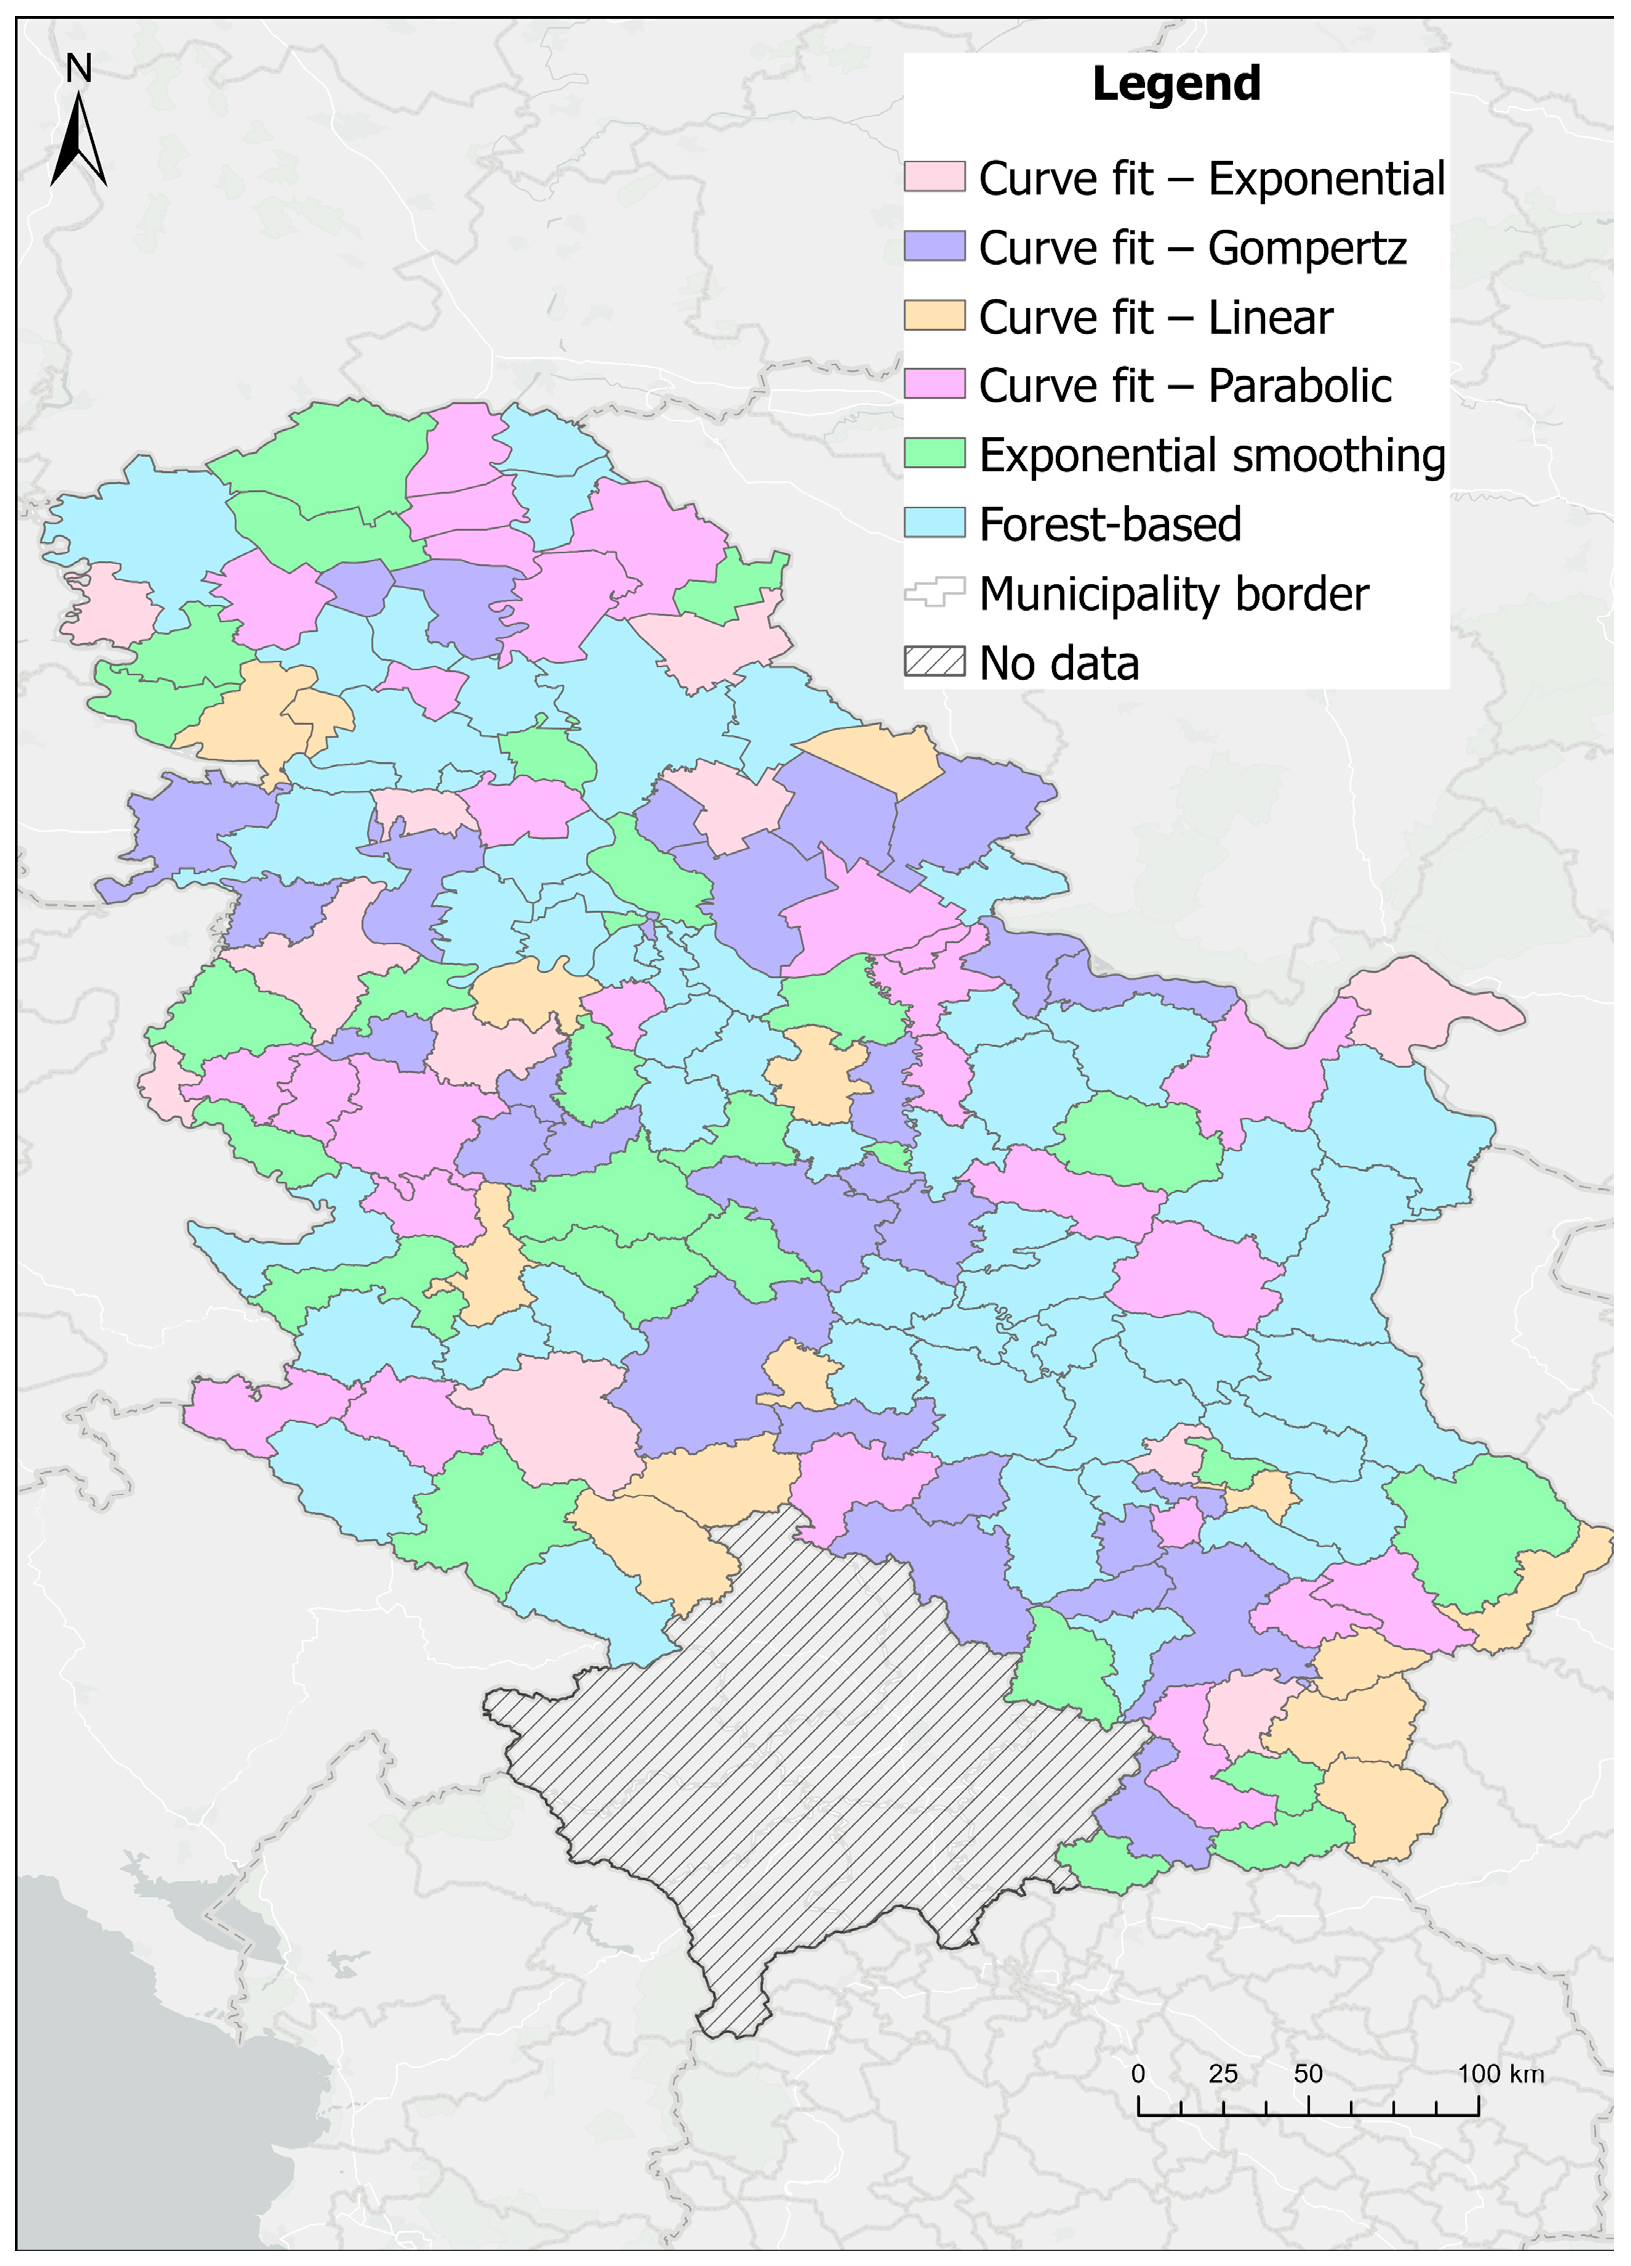
The model that most accurately forecasts the number of deaths caused by CVDs for each municipality is presented in
Figure 3 and
Table 3. The accuracy of the forecast models was assessed using both statistical validation metrics and spatial analysis.
Overall, in most municipalities, the number of deaths from CVDs is best forecasted using the Curve Fit model (84 or 50%). Among these, 17.8% follow a Gompertz-type curve, indicating that the rate of change is slowest at the beginning and end of the time series. In 16.7% of municipalities, the Curve Fit Parabolic model was selected as the most suitable model. This model is generally used when an increase is expected; however, in this study it also adequately captures declining trajectories.
A linear trend in the number of deaths from CVDs is expected in 9.5% of municipalities. In the smallest number of cases (6.5%), the rate of change is expected to accelerate over time, for which the Curve Fit Exponential model provides the best fit.
In 16.7% of municipalities, the most accurate model for forecasting the number of deaths from CVDs is Exponential Smoothing, indicating moderate temporal trends and relatively stable dynamics in the upcoming years.
When evaluating forecast accuracy across all models, the Forest-based model is identified as the best-performing model in approximately one-third of municipalities, suggesting more complex or irregular temporal dynamics in CVD mortality patterns. This model is particularly suitable for data exhibiting nonlinear or unstable temporal changes.
During the first two years of the COVID-19 pandemic, an increase in CVD-related deaths compared to previous years was observed, returning to levels similar to those recorded during 2009–2011. Consequently, the decline observed between 2005 and 2015 (with minor fluctuations in some years) was temporarily interrupted by the pandemic, followed by another decline in the final year of the study period. This complex temporal pattern partly explains the relatively large share of municipalities for which the Forest-based model provides the best forecasting performance. Interestingly, spatial clusters of municipalities can also be observed where this model consistently performs best.
3.4. Forecasted Number of Deaths from CVDs for 2030 Based on the Chosen Municipal-Level Model
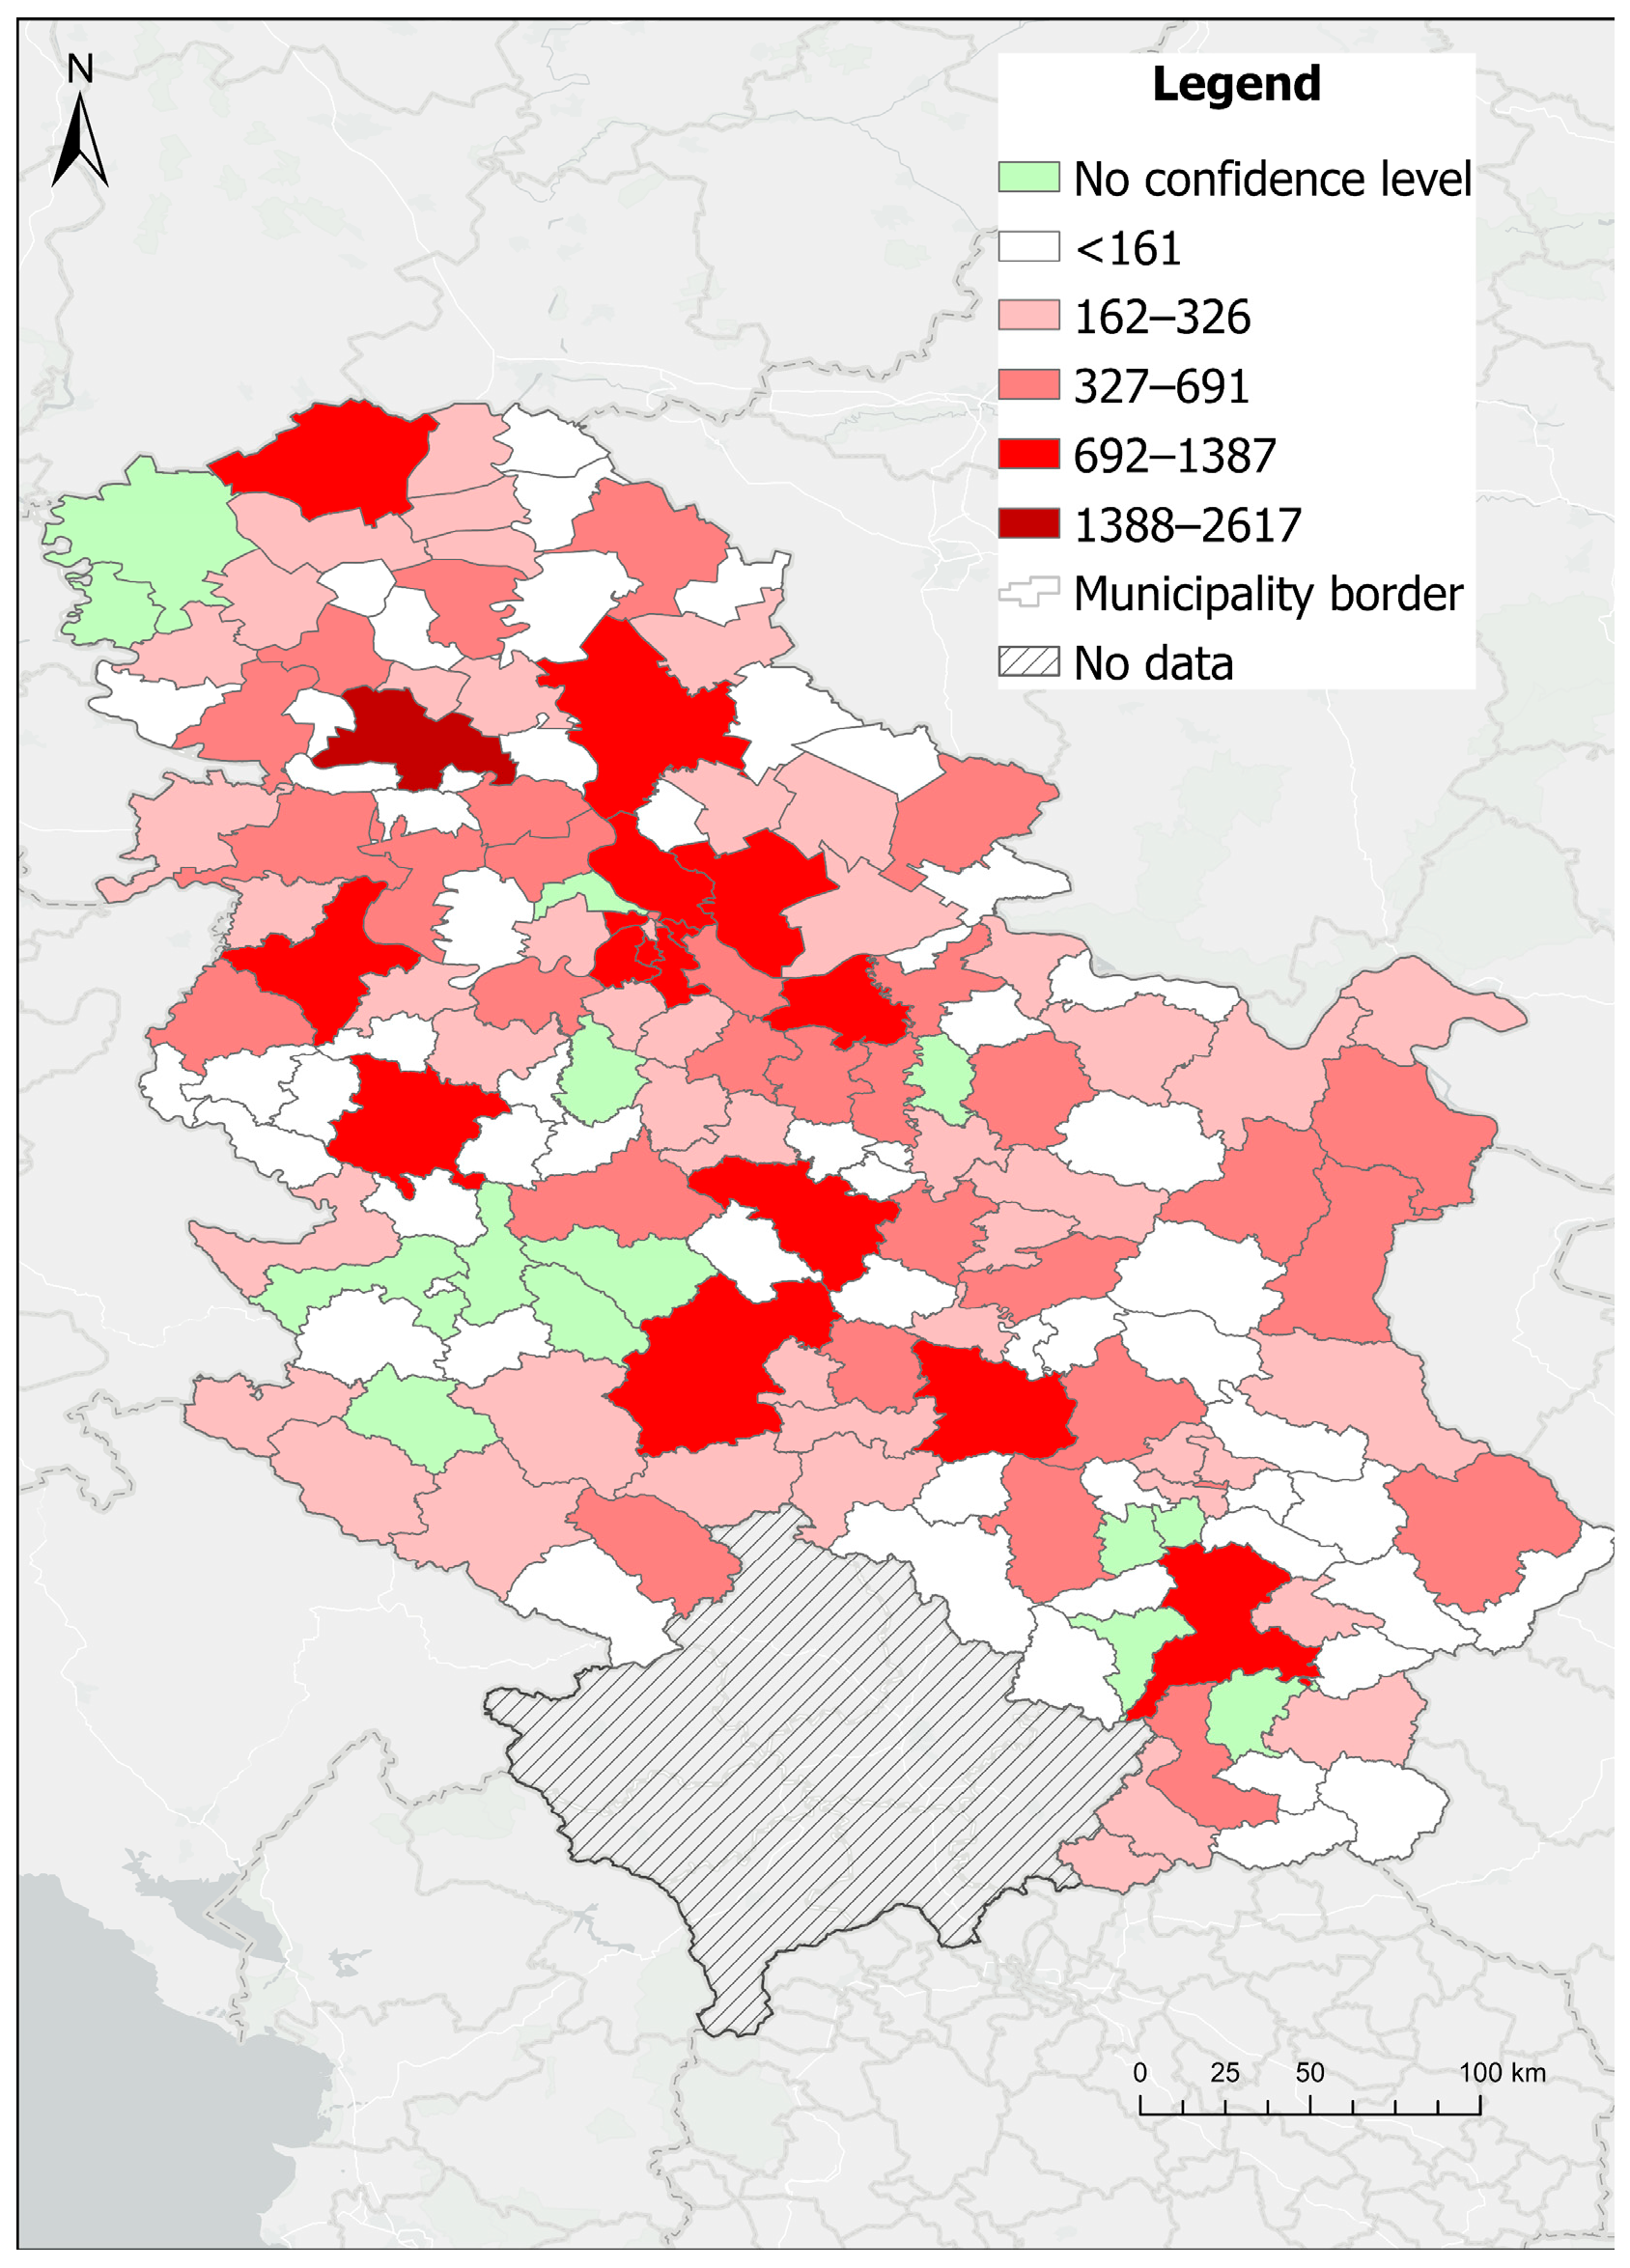
Following the determination of the best-fitting model, the final forecast values for the year 2030 were cartographically represented for each municipality (
Figure 4). The absolute values of forecasted CVD deaths were depicted using a colour gradient ranging from lighter to darker shades, corresponding to lower and higher values.
Based on population size, the largest number of deaths was forecasted in the most populous municipalities, which largely reflects the underlying population distribution and is therefore expected. However, forecasts could not be generated for 14 municipalities due to insufficient confidence levels or the absence of statistically significant historical trends. These municipalities exhibited the highest FRMSE values during model evaluation, and no statistically significant trend was detected in their historical data (2005–2022), indicating that reliable forecasts could not be produced using the available time series. These municipalities were therefore excluded from further interpretation to avoid drawing conclusions from unstable forecasts. As a result, the total number of deaths from CVDs at the national level cannot be reconstructed through direct aggregation of municipal forecasts.
3.5. Absolute and Relative Municipal-Level Changes in Forecasted CVD Mortality (2030 vs. 2015)
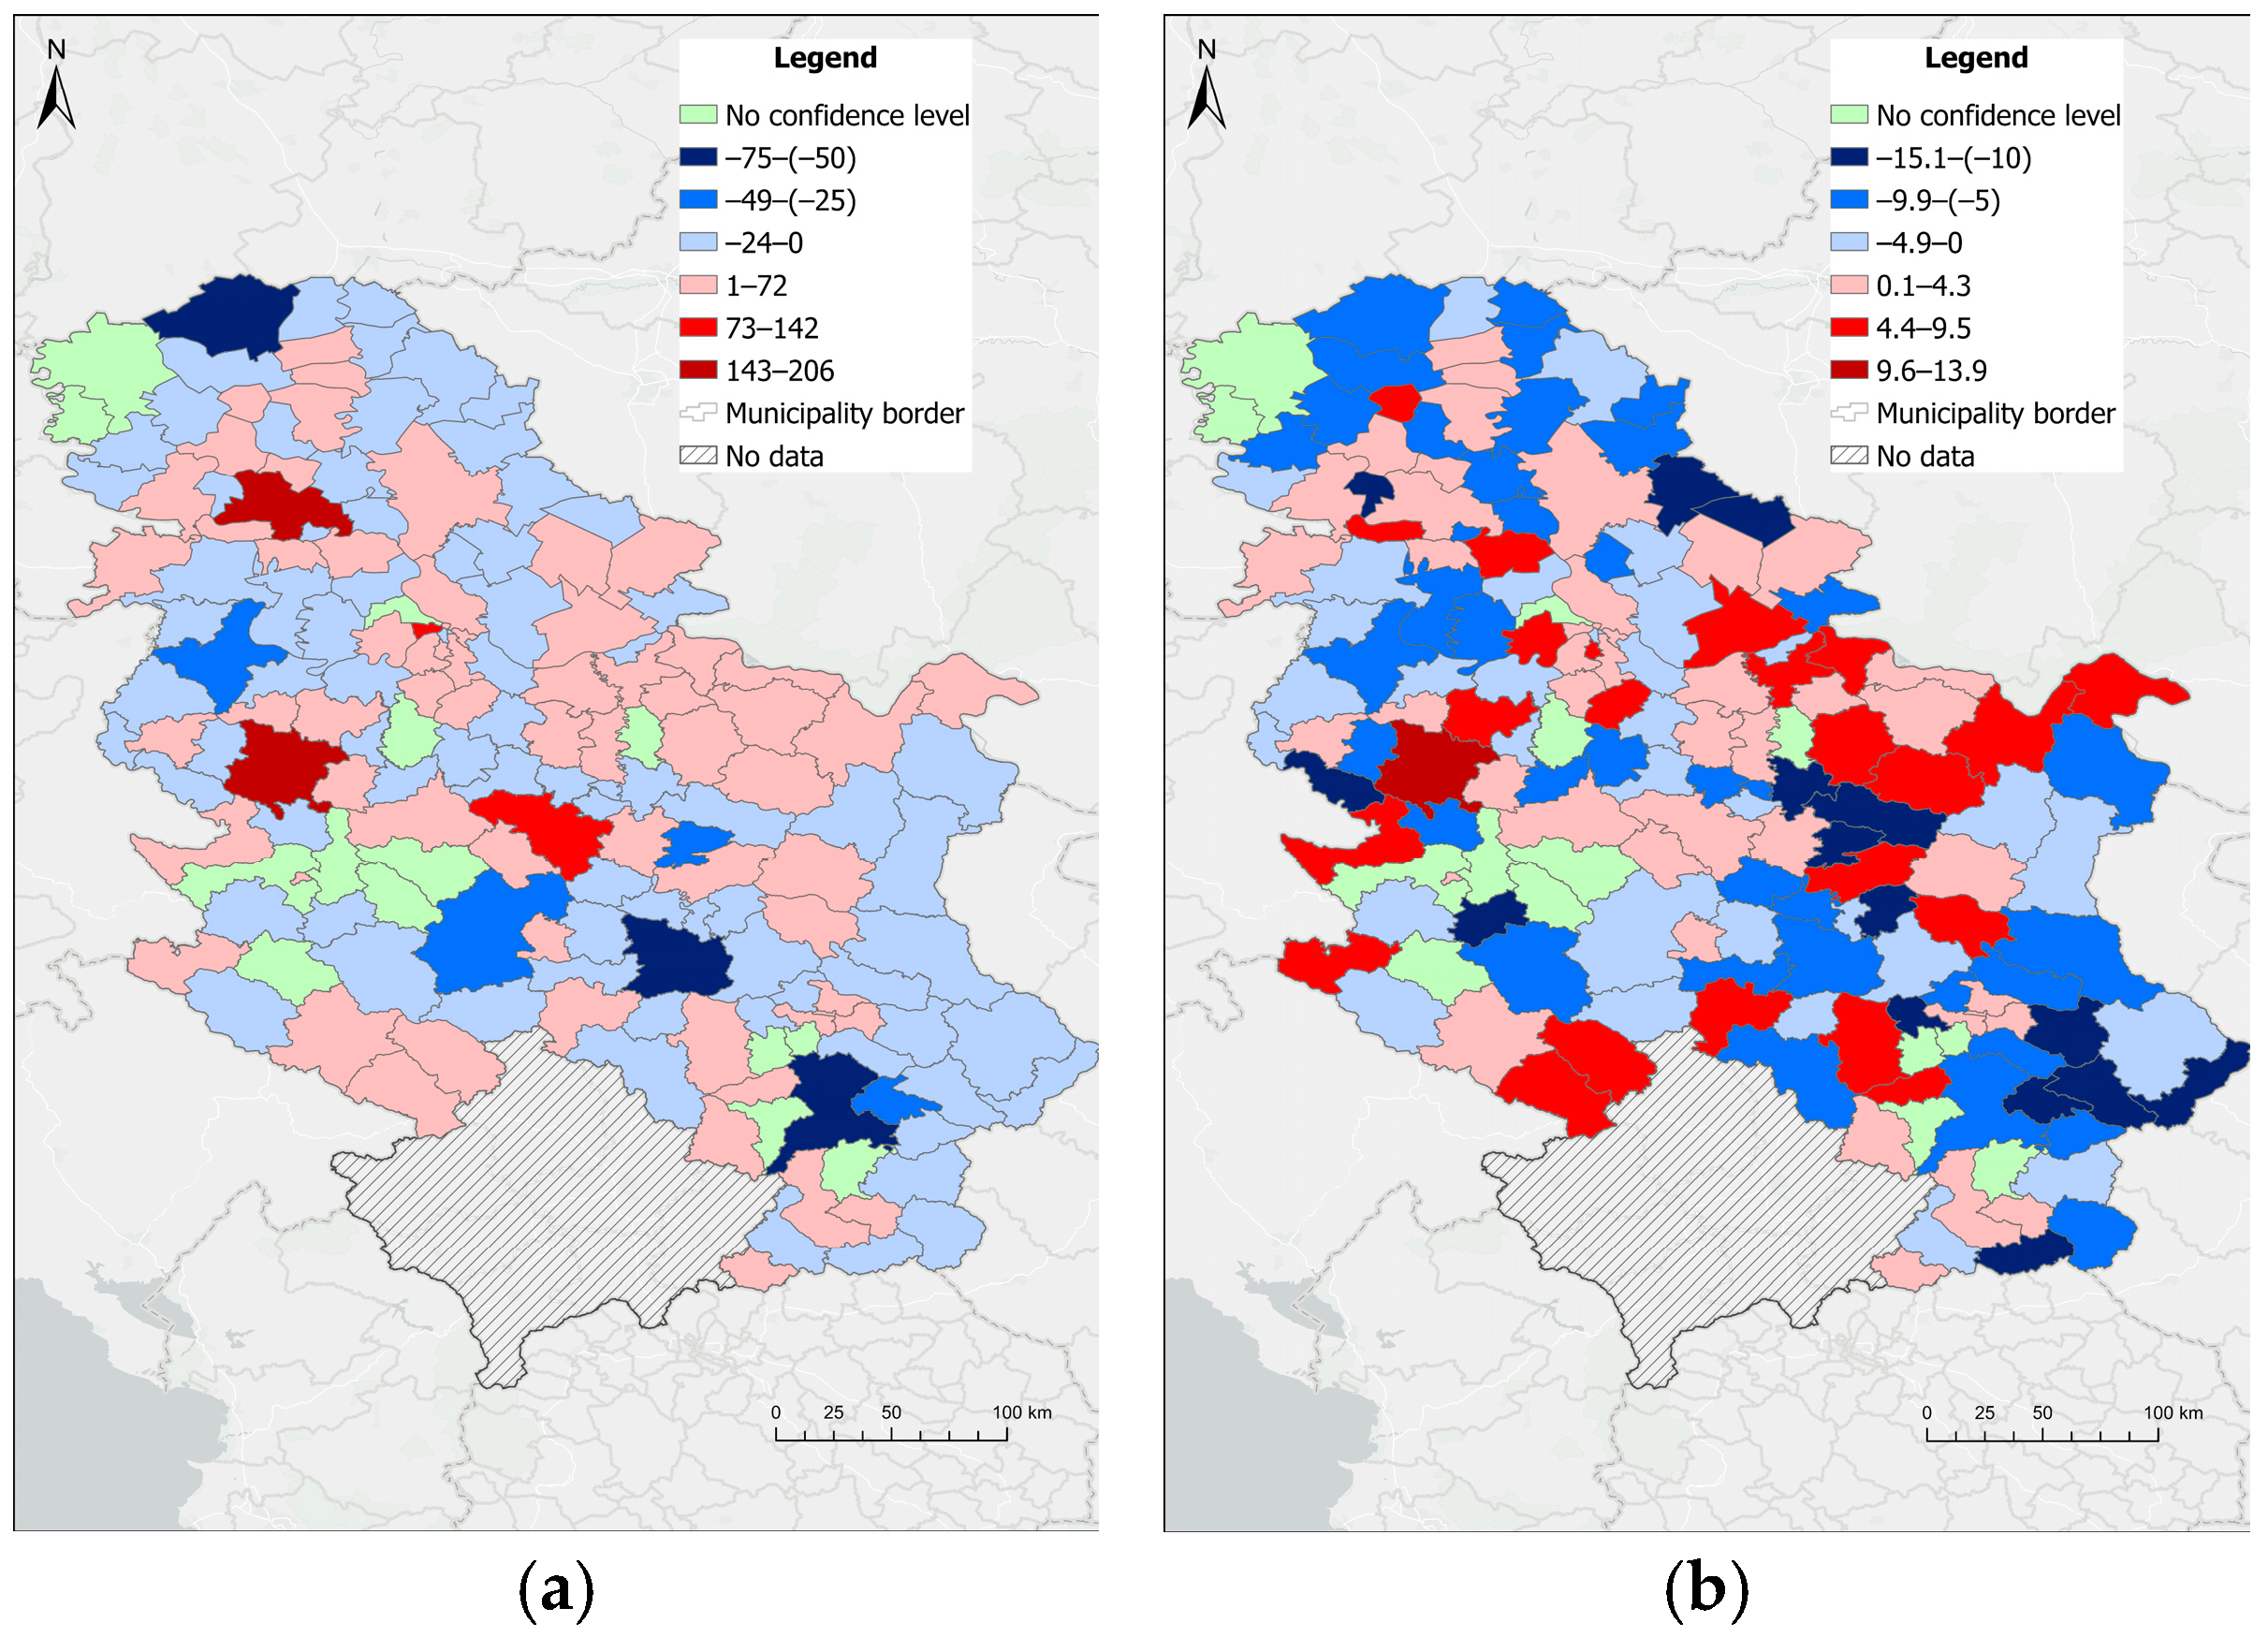
Based on the differences between the forecasted number of deaths from CVDs in 2030 and the data from 2015, six categories were delineated and presented in
Figure 5a. Municipalities showing a decrease are highlighted in shades of blue, while those with an increase are highlighted in shades of red. The seventh category, represented separately, includes municipalities with insufficient confidence levels for reliable forecasting. The most significant absolute decrease over the fifteen-year period is forecasted in three municipalities: Subotica (−75), Leskovac (−54), and Kruševac (−51). Conversely, the highest absolute increase in deaths from CVDs by 2030 compared to 2015 is forecasted for the municipality of Novi Sad (+206), followed by the municipality of Valjevo (+143), and the Belgrade municipality of Novi Beograd (+74).
Since absolute values of differences may not accurately reflect changes and can be biased by population differences among municipalities, relative percentage changes were also calculated and mapped (
Figure 5b). According to these calculations, 33 municipalities (19.6%) are expected to record the smallest decrease (up to 4.9%). An estimated 38 municipalities (22.6%) are forecasted to experience a decrease between 5% and 9.9%. The largest forecasted relative decrease (10–15.1%) is expected in 15 municipalities (8.9%). Notably, the municipality of Bački Petrovac is forecasted to exhibit the most substantial decrease, with a 15.1% reduction in CVD deaths by 2030 compared to 2015.
Furthermore, 44 municipalities (26.2%) fall into the category where the number of CVD deaths in 2030 is expected to increase by up to 4.3% compared with 2015. In 23 municipalities (13.7%), an increase ranging from 4% to 9.5% is anticipated, while only one municipality is forecasted to experience the highest percentage increase. Finally, the data highlight the municipality of Valjevo in Western Serbia is expected to record the largest increase, with a 13.9% rise in the number of CVD deaths in 2030 compared to 2015.
It is also particularly important to focus on municipalities where a reversal in CVD-related mortality trends is forecasted from 2023 to 2030, in contrast to the patterns observed between 2005 and 2022. Among the 22 municipalities with a historically declining trend, an increase in the number of CVDs deaths is anticipated in the future. Conversely, two municipalities with historically increasing trends are forecasted to experience a decrease in deaths. Changes are also noted across municipalities where no statistically significant historical trend was detected. The analysis indicates that 31 municipalities will experience an increase, while 20 are expected to record a decrease in CVD deaths. Municipalities expected to transition from declining to increasing mortality trends require focused policy attention to enhance public health strategies, especially at the local level. For other municipalities, no significant change in trend is expected. Although a shift from a decreasing or non-significant trend to an increasing trend is forecasted for a larger number of municipalities based on 2030 forecasts, all three models consistently forecast an overall national decline in CVD-related deaths. The overall trend reflects a net reduction, as forecasted increases in some municipalities are outweighed by more widespread decreases.
4. Discussion
This study offers a comprehensive overview of the spatiotemporal patterns and predictive trends in the number of deaths from CVDs in Serbia, with a particular focus on the municipal level and the potential for achieving one component of SDG Target 3.4, which aims to reduce premature mortality from NCDs by one-third by 2030. By employing a combination of methodological approaches (including time-series analysis, spatial clustering, predictive modeling, and model accuracy assessment), this research identifies key patterns and trends that illuminate both historical dynamics and future trajectories. To date, this is the first study in Serbia to integrate spatial analysis, time-series data, and multiple predictive models to estimate the future number of deaths from CVDs at the municipal level within the broader context of sustainable development. As this study is based on an ecological design using aggregated municipal-level data, the results should be interpreted as spatial associations rather than as evidence of causal relationships at the individual level.
Beyond the empirical findings for Serbia, the study also demonstrates the analytical value of applying a model-comparative spatial forecasting framework to small-area health data. By evaluating several forecasting models and selecting the most accurate approach for each spatial unit, the analysis reveals heterogeneity in temporal dynamics that would remain hidden under a single-model national forecasting strategy. This approach illustrates how existing forecasting techniques can be operationalized within a spatial decision-support context to identify local trajectories, prioritize high-risk areas, and support territorially differentiated policy responses. As many countries face similar challenges in monitoring progress toward SDG Target 3.4 at subnational levels, the framework presented here offers a transferable methodological template for small-area public health forecasting.
It is important to note that the forecasting framework applied in this study is primarily trend-based and does not explicitly incorporate explanatory covariates. Consequently, the results should not be interpreted as identifying causal determinants of CVM. Instead, the forecasts reflect the continuation of historical temporal patterns observed in municipal CVD mortality counts. Nevertheless, spatial differences in the forecasted trajectories are likely shaped by a combination of well-documented structural determinants of CVDs, including demographic ageing, internal migration dynamics, socioeconomic inequalities, environmental exposures such as air pollution, and differences in healthcare accessibility. Although these factors were not directly included in the forecasting models due to the lack of consistent long-term municipal-level datasets, the spatial patterns identified in this study are consistent with previous research highlighting their role in shaping CVD mortality patterns.
Between 2005 and 2022, nearly one million CVD-related deaths were recorded in Serbia. While the overall number of deaths has declined, this trend can be linked with ongoing population decline and the demographic aging process, characterized by a shrinking base and an expanding top of the population pyramid. Additionally, Lović Obradović et al. [
46] found that the declining share of CVDs deaths in the second decade of the 21st century has been accompanied by a slight increase in mortality from neoplasms and respiratory diseases.
Considering that the forecasting models are based on mortality counts rather than population-adjusted rates, the observed and forecasted trends should be interpreted in conjunction with demographic changes. Across municipalities experiencing rapid depopulation or pronounced population ageing, reductions in absolute mortality counts may partly reflect shrinking population size rather than improvements in cardiovascular health outcomes. Conversely, increases in urban municipalities may reflect population growth or migration inflows. This reinforces the importance of interpreting municipal mortality forecasts within their broader demographic context.
Despite the overall national decline in the number of deaths from CVDs, a more detailed analysis reveals substantial regional disparities closely tied to demographic trends. Similar regional disparities in CVD mortality have also been documented in other countries. For example, substantial differences have been observed across regions in the Czech Republic and other Central and Eastern European countries [
47,
48]. Municipalities with declining CVD mortality in Serbia are predominantly located along border regions, particularly in the southeast—an area historically characterized by depopulation, economic marginalization [
49,
50], and a relatively high share of the population aged 65 and over [
13]. These demographic patterns imply growing pressure on local health systems, particularly regarding the availability and accessibility of healthcare services for ageing populations, as emphasized by Benassi et al. [
51]. Furthermore, this area contains numerous settlements with fewer than 20 inhabitants [
52], and long-term population decline in these areas has likely contributed to the reduction in absolute mortality figures. Conversely, approximately one in ten municipalities recorded an increasing trend in number of CVDs deaths, and these are typically urban or urbanizing centers such as the municipalities of Kraljevo, Novi Pazar, Palilula (within the City of Belgrade administrative area), and the City of Novi Sad. According to the 2022 Census, all of the aforementioned municipalities have populations exceeding 100,000 [
31], and some of them have experienced sustained population growth over the past two decades. This trend continued even during the COVID-19 pandemic, largely due to a positive net balance of internal migration [
53]. For example, the City of Novi Sad stands out with a 35% population increase, driven by both natural growth and positive migration balances [
54]. In these cases, the rise in CVD-related deaths appears to be linked more to demographic components than to worsening public health. These changes demonstrate that mortality counts must be contextualized within demographic trends.
Forecasts for the year 2030, generated using three different models (Curve Fit, Exponential Smoothing, and Forest-based), reveal that the maximum expected reduction in deaths attributed to CVDs is up to 8.7% compared to the baseline year of 2015, the reference point for SDG 3.4. These forecasts gain additional relevance when viewed in the context of Serbia’s ongoing demographic transformation, primarily characterized by population decline and emigration. Serbia has been experiencing long-term depopulation, a process expected to continue in the coming decades given the current demographic structure [
35]. In many municipalities, declining population size and sustained out-migration can be linked with reductions in the absolute number of recorded deaths from CVDs.
This finding indicates that Serbia is unlikely to achieve the SDG 3.4 target of a one-third reduction in premature mortality from NCDs by 2030. Furthermore, given the gradual rise in mortality from neoplasms and respiratory diseases over the past decade, progress not only remains insufficient but may also be reversing.
Similar trends are observed in other countries. Bennett et al. [
5] emphasize that no country can reach SDG 3.4 by targeting a single disease. Instead, progress depends on simultaneous reductions across multiple leading causes of death, requiring most countries to improve outcomes in at least five to seven NCD categories to match the performance of top-ranking nations. Freihat et al. [
55] also highlight the rapidly growing burden of non-communicable diseases (NCDs) and the persistence of significant inequalities in their distribution, emphasizing the need for equity-oriented prevention strategies targeting metabolic risks, gender disparities, and regional inequalities to support progress toward SDG target 3.4. Similarly, Watkins et al. [
56] argue that while specific clinical strategies must be adapted to national contexts, most countries could significantly reduce NCD mortality by implementing a core package of interventions. These include addressing behavioral risks such as tobacco use, alcohol abuse, and high sodium intake, with cardiovascular disease prevention yielding the greatest potential impact.
One of the key strengths of this research conducted is in its ability to generate precise, locally tailored forecasts by identifying the most reliable predictive model for each municipality individually. More broadly, the results illustrate how spatially disaggregated forecasting can complement traditional national-level analyses by revealing local deviations from aggregate trends, thereby providing additional evidence for targeted intervention planning. Given Serbia’s shared post-socialist background with many Central and Eastern European (CEE) countries, it faces similar structural determinants of elevated and spatially uneven number of CVD deaths. These include persistent socioeconomic inequalities [
57] or disparities in healthcare access, particularly in rural and remote areas, as documented in Romania [
58] and Poland [
59]. Collectively, these challenges contribute to the region’s distinction as having the world’s highest burden of CVDs [
60].
However, despite well-documented structural weaknesses in healthcare systems across many CEE countries, several recent initiatives demonstrate promising shifts. Examples include Slovenia’s hospital modernization, Czechia’s decentralized management of regional health services, Poland’s strategic investments in hospital infrastructure, Hungary’s internationally recognized clinical excellence, and Romania’s large-scale hospital construction projects, all of which exemplify targeted efforts to strengthen public health systems [
58].
Unlike most studies that rely on a single forecasting method, this research employed a multi-model approach, allowing for a more sophisticated evaluation of future temporal trends across varying contexts. Curve Fit models proved most accurate in approximately half of the municipalities, while in about one-third, the Forest-based model outperformed others, particularly in environments characterized by complex or irregular trends. This variation underscores the necessity of context-sensitive approaches to public health planning, as one-size-fits-all solutions may not be effective across heterogeneous local settings. The COVID-19 pandemic notably disrupted previous trends in the number of deaths from CVDs [
61], with anomalies observed in 2020 and 2021 interrupting the prior decline. These discontinuities are captured by the Forest-based model, which is more capable of capturing non-linear patterns. The dominance of the Forest-based model in demographically larger or socioeconomically heterogeneous municipalities suggests its ability to better capture complex patterns. Recent research has highlighted the potential of machine learning models such as random forests not only for accurate CVD forecasting, but also for supporting timely interventions when used alongside appropriate clinical strategies [
62]. Conversely, Curve Fit models proved effective in smaller or demographically stable areas, reflecting more predictable trends. These findings highlight the importance of ongoing surveillance systems and adaptive forecasting capacities.
A particularly important finding is the identification of 22 municipalities in which the historical downward trend reversed, with forecasts indicating an increase in the number of deaths from CVDs by 2030. Many of these municipalities, despite previous reductions, are now facing increased vulnerability due to shifting contextual dynamics. The pandemic has further compounded these risks by disrupting health services and worsening CVD burdens [
63].
Finally, changes in the forecasted number of deaths from CVDs between 2015 (the SDG 3.4 baseline year) and 2030, assessed both in absolute and relative terms, allow for the precise identification of priority municipalities. While the municipality of Subotica is expected to achieve the greatest absolute decrease, the City of Novi Sad is expected to experience the highest absolute increase, partly attributable to its population growth and size. Considering the relative values of change, the municipality of Bački Petrovac is anticipated to have the highest percentage decrease. In contrast, the municipality of Valjevo is expected to see the most pronounced percentage increase. The highest average daily concentrations of PM10 particles (μg/m
3) during the period 2011–2020 were registered in this municipality [
64]. Previous studies have demonstrated that even a few hours of exposure to air pollution, particularly to PM10 particles, can significantly elevate the risk of CVD mortality [
65,
66], suggesting a potential association that is consistent with epidemiological evidence linking air pollution exposure to increased CVD mortality. These findings are broadly consistent with previous research linking environmental and demographic factors to CVD mortality; however, causal relationships cannot be inferred from the present ecological analysis. Stanojević and Malinović-Milićević [
64] also noted that, when observed by month, the highest recorded concentrations of PM10 occur in January, followed by December and February. This seasonal pattern aligns with international evidence indicating an increased number of CVD-related deaths during the winter months [
67,
68], commonly associated with low temperatures and elevated pollution levels.
These findings underscore the need for territorially differentiated health interventions and targeted prevention strategies, for example, mobile health units, improved access to early screening, or awareness programs for local populations. Such measures could help mitigate anticipated increases in CVD-related mortality. By ranking municipalities based on the percentage difference between forecasted 2030 values and the 2015 baseline, this study identifies priority areas in need of focused public health intervention. The municipalities identified in this analysis may represent areas where additional monitoring or targeted public health assessments could be prioritized. These spatially differentiated findings offer direct support for designing tailored, territory-specific policies and allocating resources to the municipalities most at risk. The uneven spatial distribution of forecasted CVD mortality also raises questions of health equity. Failure to address these disparities risks deepening existing social and territorial regional inequalities.
Several limitations of this study should be acknowledged. First, the forecasting framework relies on CVD mortality counts rather than age-standardized or population-adjusted mortality rates. While this approach allows consistent spatial forecasting at the municipal level, it may partly reflect demographic dynamics such as depopulation or ageing. Future research could address this limitation by integrating population-adjusted indicators or age-standardized mortality rates where consistent small-area demographic data become available. Second, for a small number of municipalities, annual data were missing for specific years. When constructing the space–time cube, these missing observations were filled with zeros, following the technical requirements of the ArcGIS Pro Space Time Pattern Mining framework. While this procedure ensures computational consistency across municipalities and enables the application of the forecasting algorithms, it may introduce bias by artificially reducing temporal variability in affected locations. Across municipalities with small populations or irregular reporting, this approach may slightly dampen short-term fluctuations in CVD mortality counts and could potentially influence trend detection or model selection. However, the number of missing observations was limited relative to the full dataset (168 municipalities over an 18-year period), and model performance was subsequently evaluated using validation metrics (RMSE) to ensure that forecast reliability remained acceptable. Consequently, the overall influence of this procedure on national patterns and broader municipal-level conclusions is expected to be limited. Future research could address this issue by applying model-based imputation approaches or sensitivity analyses to evaluate how different treatments of missing data affect small-area mortality forecasts. Third, the forecasting models rely exclusively on historical mortality counts and do not incorporate explanatory variables such as air pollution exposure, socioeconomic status, healthcare accessibility, or behavioral risk factors. These determinants are known to influence CVM and may vary substantially across municipalities. As a result, the forecasts primarily reflect historical trends and demographic dynamics rather than causal mechanisms underlying spatial differences in mortality. Finally, the absence of spatially and temporally harmonized data on risk factors and healthcare accessibility at the municipal level constrained the integration of explanatory variables into the forecasting framework. Future research could address this limitation by combining spatial forecasting with multivariate or hybrid models that incorporate environmental indicators, health behavior surveys, and healthcare infrastructure data, thereby improving both explanatory power and policy relevance. Taking into account all the above limitations, the results presented in this study should be interpreted as indicative trend forecasts rather than precise predictions, particularly across municipalities with weaker historical signals or more irregular mortality patterns. Consequently, the municipal-level forecasts should be interpreted primarily as indicators of spatial variation and local trajectories rather than as components of a fully aggregable national forecasting framework
Future research could further expand this framework by integrating multivariate or hybrid forecasting approaches that combine mortality trends with environmental, behavioral, and healthcare indicators, thereby enhancing both explanatory power and policy relevance. Since the reduction in the number of deaths from CVDs is just one component of assessing progress toward SDG Target 3.4, future research will also examine the second and third leading causes of death in Serbia, namely neoplasms and respiratory diseases. If data availability permits, additional analyses will include the fourth major category of chronic NCDs, diabetes. Furthermore, incorporating advanced machine learning (ML) approaches into national-level public health surveillance systems could improve early warning capabilities and localized planning. This integrated approach will provide a comprehensive assessment of Serbia’s progress toward achieving SDG Target 3.4 and help identify areas requiring targeted policy attention.