Article

Newcomb–Benford’s Law in Neuromuscular Transmission: Validation in Hyperkalemic Conditions

1
Centro de Formação em Ciências Agroflorestais, Universidade Federal do Sul da Bahia, Itabuna 45613-204, BA, Brazil
2
Colegiado de Engenharia Civil, Universidade Federal do Vale do São Francisco, Juazeiro 48902-300, BA, Brazil
3
Departamento de Fisiologia e Farmacologia, Faculdade de Medicina, Universidade Federal do Ceará, Fortaleza 60430-270, CE, Brazil
*
Author to whom correspondence should be addressed.
Stats 2023, 6(4), 1053-1071; https://doi.org/10.3390/stats6040066
Submission received: 4 September 2023 / Revised: 28 September 2023 / Accepted: 1 October 2023 / Published: 9 October 2023
(This article belongs to the Section Time Series Analysis)

Abstract

:
Recently, we demonstrated the validity of the anomalous numbers law, known as Newcomb–Benford’s law, in mammalian neuromuscular transmission, considering different extracellular calcium. The present work continues to examine how changes in extracellular physiological artificial solution can modulate the first digit law in the context of spontaneous acetylcholine release at the neuromuscular junction. Using intracellular measurements, we investigated if the intervals of miniature potentials collected at the neuromuscular junction obey the law in a hyperkalemic environment. When bathed in standard Ringer’s solution, the experiments provided 22,582 intervals extracted from 14 recordings. On the other hand, 690,385 intervals were obtained from 12 experiments in a modified Ringer’s solution containing a high potassium concentration. The analysis showed that the intervals, harvested from recordings at high potassium, satisfactorily obeyed Newcomb–Benford’s law. Furthermore, our data allowed us to uncover a conformity fluctuation as a function of the number of intervals of the miniature potentials. Finally, we discuss the biophysical implications of the present findings.

1. Introduction

The neuromuscular junction (NMJ) is a specialized region that establishes communication between nerve and muscle. The language of this communication is chemical, in which acetylcholine molecules, packed inside organelles called vesicles, are released after their fusion into the synaptic cleft. Next, diffusion occurs within the synaptic cleft, where acetylcholine binds to cholinergic receptors in the motor end-plate, promoting a muscular response [1]. Thanks to the extensive work of Katz and collaborators, his group systematically carried out rigorous characterization work from the 1950s onwards. In conjunction with these investigations, the discovery of miniature end-plate potentials (MEPPs) by Katz and Fatt represented a new perspective for understanding the biophysical nature of neurotransmission [2]. Is there a way to quantify the spontaneous release of acetylcholine? According to the vesicular hypothesis proposed later by Katz, the release takes place discreetly in the terminal, where there would be a direct correspondence between the fusion of a single vesicle and the generation of a MEPP [3]. Therefore, based on these studies, Katz and Del Castillo offered a statistical pillar consistent with the physiological substrate. According to this proposal, the release occurs within a random regime, statistically governed by a Poisson regime.
The technological improvement allowed the development of electrophysiological instrumentation, raising the quality of the records. In conjunction with these empirical advances, sophisticated statistical models were also proposed, enabling the test of the validity of the Poissonian premises. Within this perspective, several studies have emerged showing a divergent scheme concerning the assumptions based on the randomness of the neurotransmission phenomenon. Especially from the 1970s onwards, several authors showed that neurotransmission could also obey other statistical models [4,5,6,7,8,9].
Numerical patterns are identified in many phenomena of nature. Like so many other discoveries in the history of science, Newcomb–Benford’s law (NBL) was obtained in a completely unexpected manner. It was the result of an accurate examination of logarithm tables. Using them, Simon Newcomb discovered a curious numerical pattern in 1881 [10]. Nevertheless, only after decades, Frank Benford independently rediscovered Newcomb’s findings, analyzing a large amount of data extracted from various sources, such as physical constants, molecular weights, and the height of the American population. By studying them, Benford reached the same conclusions previously pointed out by Newcomb [11]. The NBL is classified among the several power or scaling laws in many physical systems. In recent years, it has emerged as a valuable tool for identifying patterns embedded in data from different data sources [12]. Therefore, the NBL remained a curious mathematical observation until a rigorous treatment explained why it works so well for different phenomena. Despite the functional simplicity of the law, researchers still need to understand why the NBL works so well [13]. In the middle of the 1990s, Hill [14,15,16] offered a formal understanding of two remarkable characteristics of the law: scale and basis invariance.
Various experimental data have been accumulated in many fields of knowledge, attesting to the compliance with the NBL [17,18,19,20,21]. In particular, spatial invariance can have profound morphological implications in physiology, and it is well documented in the heart, lung, and brain [22]. In this framework, it is plausible to hypothesize that, if a given data collection obeys the NBL, then it should exhibit base invariance behavior. Therefore, it is unsurprising that the NBL has been confirmed in several biological systems. Studies carried out on electrocardiogram and electroencephalogram recordings have revealed the following of the NBL at the physiological level [23,24]. Moreover, in in vitro studies, using the NMJ of mouse diaphragms, Silva et al. performed a detailed electrophysiological investigation into the validity of the law at different extracellular calcium levels [25]. According to these authors, the intervals between MEPPs obey the NBL, no matter the calcium concentration, indicating robust conformity of their data with the law. Motivated by this work, it is suitable to delve into investigations varying the extracellular content of other ionic species.
The potassium ion ( K + ) is a univalent cation commonly found in corporal fluids, resting within 3.5–5 mM, being crucial for several physiological functions [26]. For example, changes in the [ K + ] o gradient represent a potential risk for cardiac functions, and it is also known to establish the K + -equilibrium potential, which is vital for several cell functions. Beyond that, the membrane potential depolarization due to high [ K + ] o implies a dramatic increase in MEPP frequency. The K + traffic is mediated by several channels at the NMJ membrane terminal [27]. Thus, beyond the health issues, modifications in K + content in the extracellular milieu represent fertile soil for mathematical modeling of the ionic impact on the electrical activity of the nervous system. In this framework, the NMJ emerges as a classical, but still essential preparation to identify numerical patterns in a biological scope. Deviations from [ K + ] o could eventually represent an opportunity for uncovering specific numerical patterns associated with the determined pathological regimes playing a role in neurotransmission.
In summary, the present work is based on the manipulation of high extracellular potassium ( [ K + ] o ) because it approximately mimics a physiological stimulation [28]. Furthermore, the impacts exerted by the manipulation of extracellular and intracellular [ K + ] over the membrane potential in muscle preparations are well characterized [29]. Next, [ K + ] o triggers a strong membrane depolarization, followed by a dramatic acceleration of the MEPP rate [30]. Third, several studies have correlated morphological cellular modifications evoked by the accumulation of [ K + ] o [31]. With this justification, the present work aimed to expand our previous study, evaluating whether the intervals between MEPPs still obey the law in conditions of hyperkalemia. It is well accepted that the increase in extracellular potassium concentration increases the frequency of MEPPs. Therefore, this exacerbated electrophysiological activity allows rigorous verification of the law’s validity for a large amount of data, and the conformity level may be studied in more detail.

2. Mathematical Formulation of NBL

Hill introduced the probabilities for occurrences, inferred from the general equation expressed as follows:
P ( D 1 = d 1 , , D k = d k ) = log 1 + 1 i = 1 k d i × 10 k 1 .
In the equation given above, k represents all integers. It can be particularized to analyze only the frequency of the first digits. In this case, the equation is then written as:
P ( D 1 = d 1 ) = log 1 + 1 d 1 , d 1 1 , 2 , , 9 .
It is worth highlighting that second digit analysis is often performed in the NBL applications. For example, Diekmann documented that articles published in the American Journal of Sociology are well described by taking the second digit [32]. Thus, the probabilities for the appearance of a second digit are given by the expression:
P ( D 2 = d 2 ) = d 1 = 1 9 log 1 + 1 d 1 d 2 , d 2 0 , 1 , , 9 .
Nigrini claims that, regardless of the usual analysis of the first or second digits, providing important information about the compliance of the analyzed data, it is vital to consider the analysis of the first–two digits [33]. According to this researcher, investigating the conformity of the first–two digits makes it possible to extract a more detailed scenario of how the phenomena obey the law. This case is written in the following functional form:
P ( D 1 D 2 = d 1 d 2 ) = log 1 + 1 d 1 d 2 , d 1 d 2 10 , 11 , , 99 .
The expected frequencies for the first and second digit are resumed in Table 1.
Several authors have reported that fluctuations in the empirical first digit values can also occur, despite the typically asymmetric distribution of digits. This observation implies deviations between the data and the frequency values predicted by the NBL. Evidence corroborating these observations comes from seismic activity and cognition experiments [34,35]. This issue has motivated several authors to propose a generalization of the NBL. In this framework, for instance, one may highlight the theoretical description introduced by Pietronero et al. [36]. According to this author, assuming a probability distribution P α ( d ) (where d is the digit(s), D represents arbitrary digits, and α is a constant exponent related to the scale proportion), one may write:
P α ( d ) = d d + 1 D α d D ,
or, by the differential equation:
d P α ( D ) d D = D α .
Solving Equation (6) results in an α -logarithm:
P α ( d ) = 1 1 α d + 1 ( 1 α ) d ( 1 α )
= d ( 1 α ) ln α d + 1 d .
According to Equation (8), defined as the generalized NBL (gNBL), when there is more frequent first digits than expected by the NBL implies α > 1 , while α < 1 means a first digit frequency below the predicted percentage. As expected, when α = 1 , the classical NBL expression is recovered. Taking n = d 1 , Equation (8) is rewritten as:
P α ( d 1 ) = d 1 1 α ln α d 1 + 1 d 1 .
From the approach developed by Pietronero et al. [36], it is also possible to obtain expressions for the second digit:
P α ( d 2 ) = d 1 = 1 9 ( d 1 d 2 ) 1 α ln α d 1 d 2 + 1 d 1 d 2 .
Finally, the generalized probability for the first–two digits is presented as:
P α ( d 1 d 2 ) = d 1 d 2 + 1 1 α d 1 d 2 1 α 1 α , d 1 d 2 { 10 , 11 , 12 , , 99 } ,
normalized for each α exponent value.

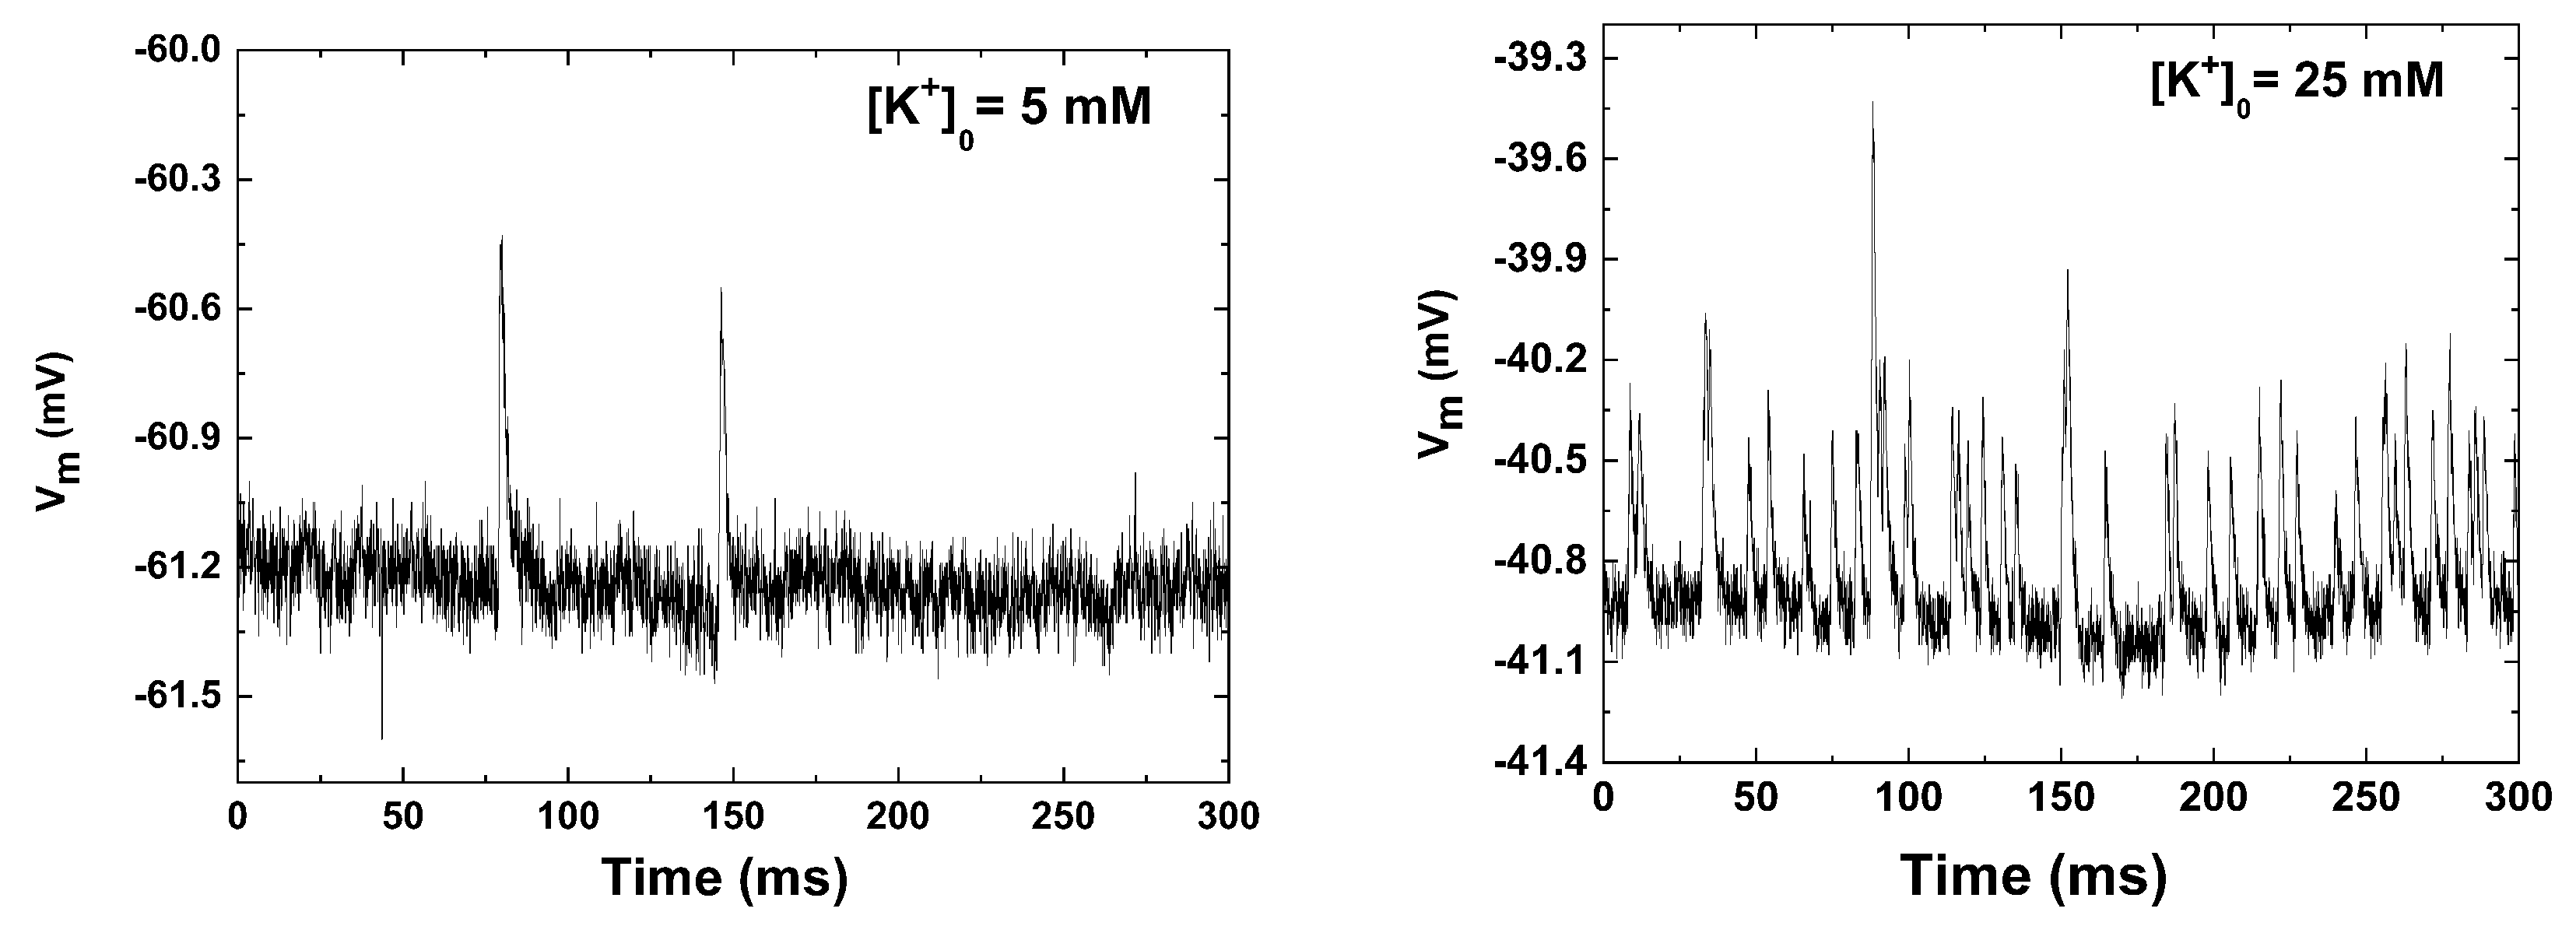
3. Electrophysiological Recordings

The hemidiaphragm is a muscle that separates the thoracic from the abdominal cavity and presents several empirical advantages. One can highlight the easy identification and dissection, which facilitates muscle extraction. Another remarkable advantage is the stereotypical spontaneous electrophysiological activity. The experimental paradigm in the present work followed the same procedure used in our previous works [25,37,38]. Wild-type adult mice were euthanized by cervical dislocation, followed by diaphragm extraction, which was quickly inserted into a physiological Ringer solution containing (in mM): N a C l (137), N a H C O 3 (26), K C l (5), N a H 2 P O 4 (1.2), glucose (10), C a C l 2 (2.4), and M g C l 2 (1.3). The pH was adjusted to 7.4 after gassing with 95% O 2 and 5% C O 2 .
In the experiments with high [ K + ] o , the sodium concentration was adjusted to maintain the osmotic equilibrium. The muscles were maintained in solution at least 30 min before the beginning of the electrophysiological recordings, allowing recovery from the mechanical trauma of their extraction. Next, the tissues were transferred to a recording chamber continuously irrigated with fresh fluid at 2–3 mL/min at room temperature ( T = 24 ± 1 °C). A standard intracellular recording technique was used to monitor the frequency of spontaneous MEPPs by inserting a micropipette at the chosen muscle fiber. Borosilicate glass microelectrodes had resistances of 8–15 M Ω when filled with K C l solution (3 M). A single pipette was inserted into the fiber near the end-plate region as guided by the presence of MEPPs with rise times <1 ms. The control experiments provided 22,582 MEPP intervals extracted from 14 recordings, whereas 690,385 intervals were collected from 12 experiments for [ K + ] o = 25 mM. Thus, our experimental paradigm afforded an enormous data quantity, allowing rigorous analysis. Electrophysiology software (https://spider.science.strath.ac.uk/sipbs/software_ses.htm, John Dempster, University of Strathclyde, Glasgow, UK), the R Language, Origin (https://www.originlab.com, OriginLab, Northampton, MA, USA), and MATLAB (https://ww2.mathworks.cn/products/matlab.html, The MathWorks, Inc., Natick, MA, USA) were employed for electrophysiological acquisition and data analysis. Figure 1 illustrates two portions of electrophysiological recordings, considering the both [ K + ] o concentrations, in which one can notice the exacerbated increase in the frequency of MEPPs when [ K + ] o = 25 mM is used.

4. Conformity Analysis
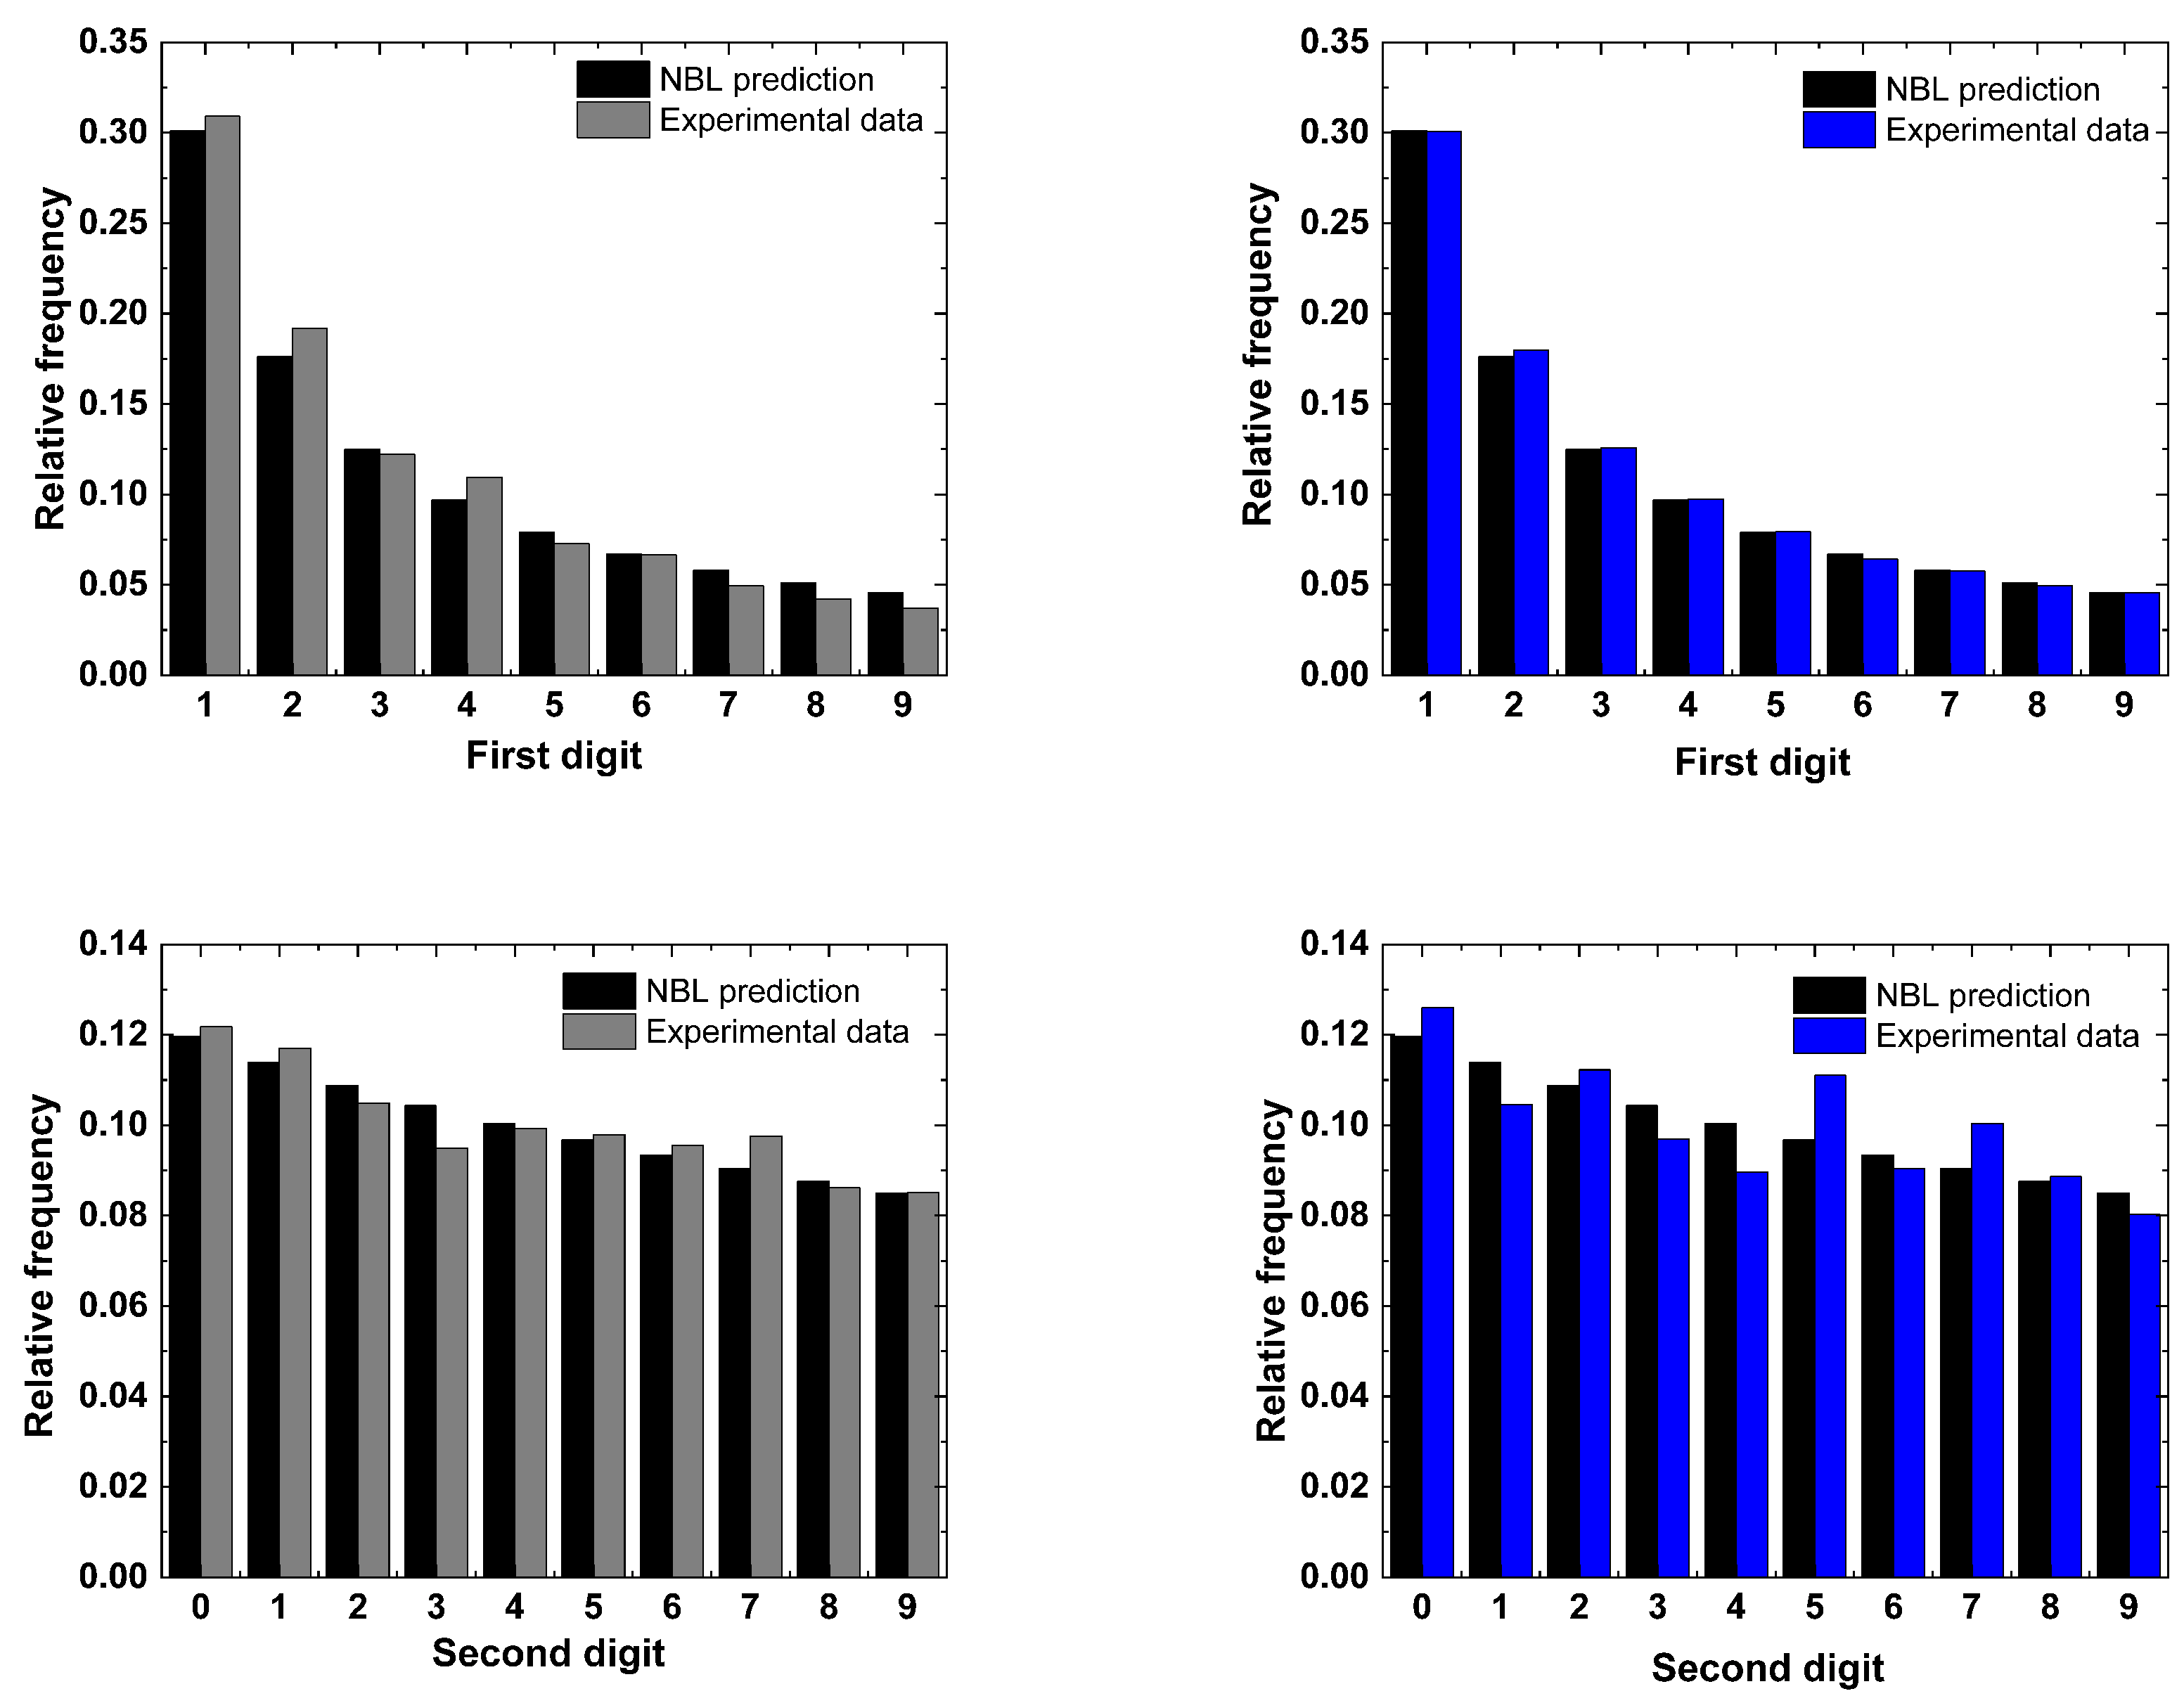
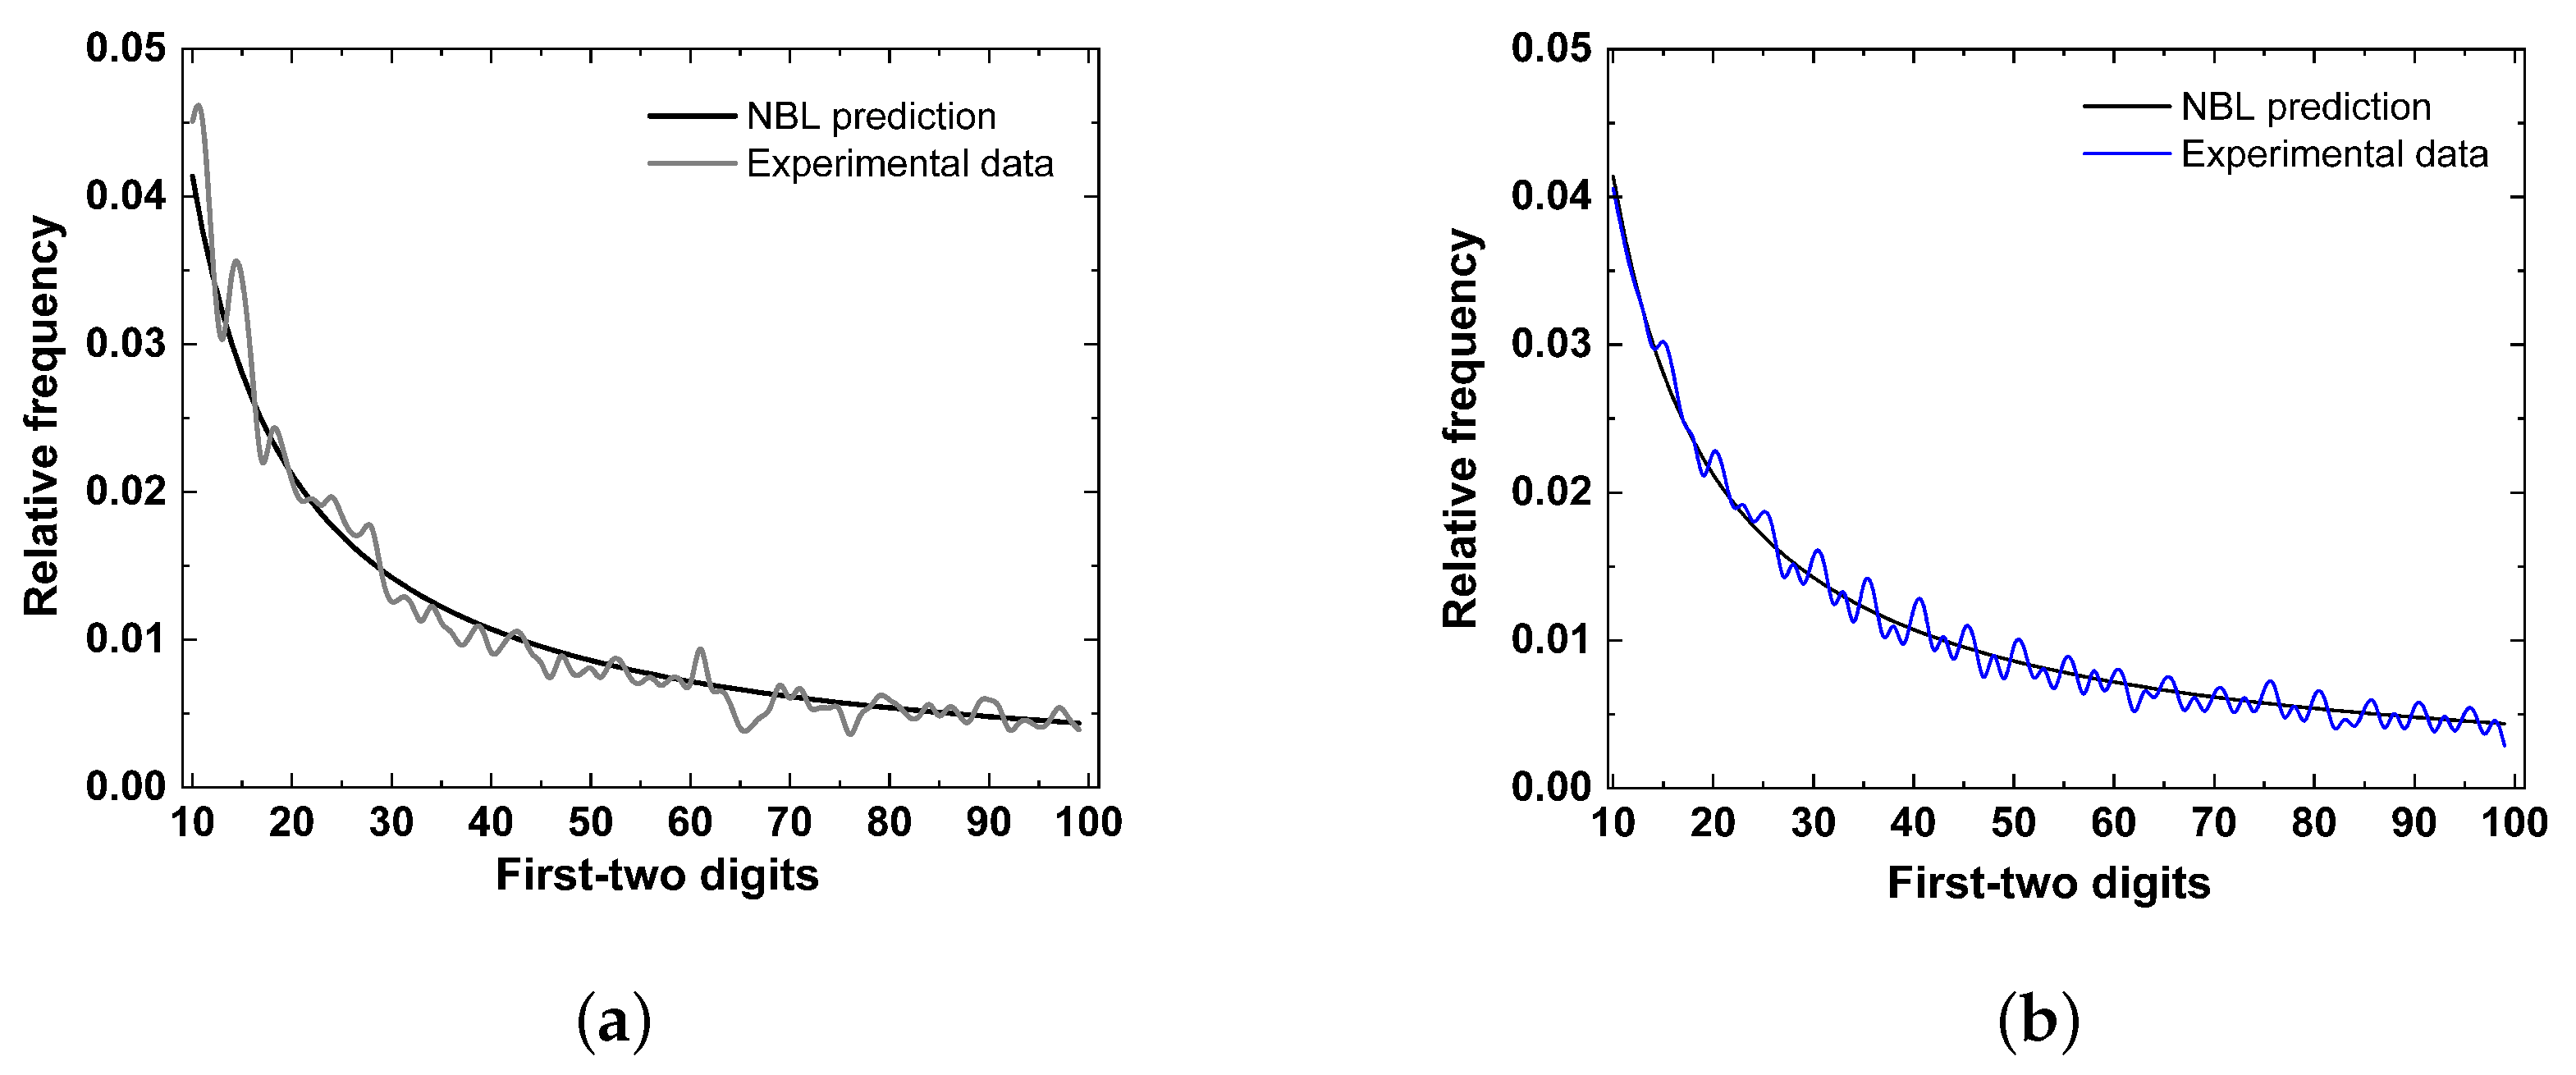
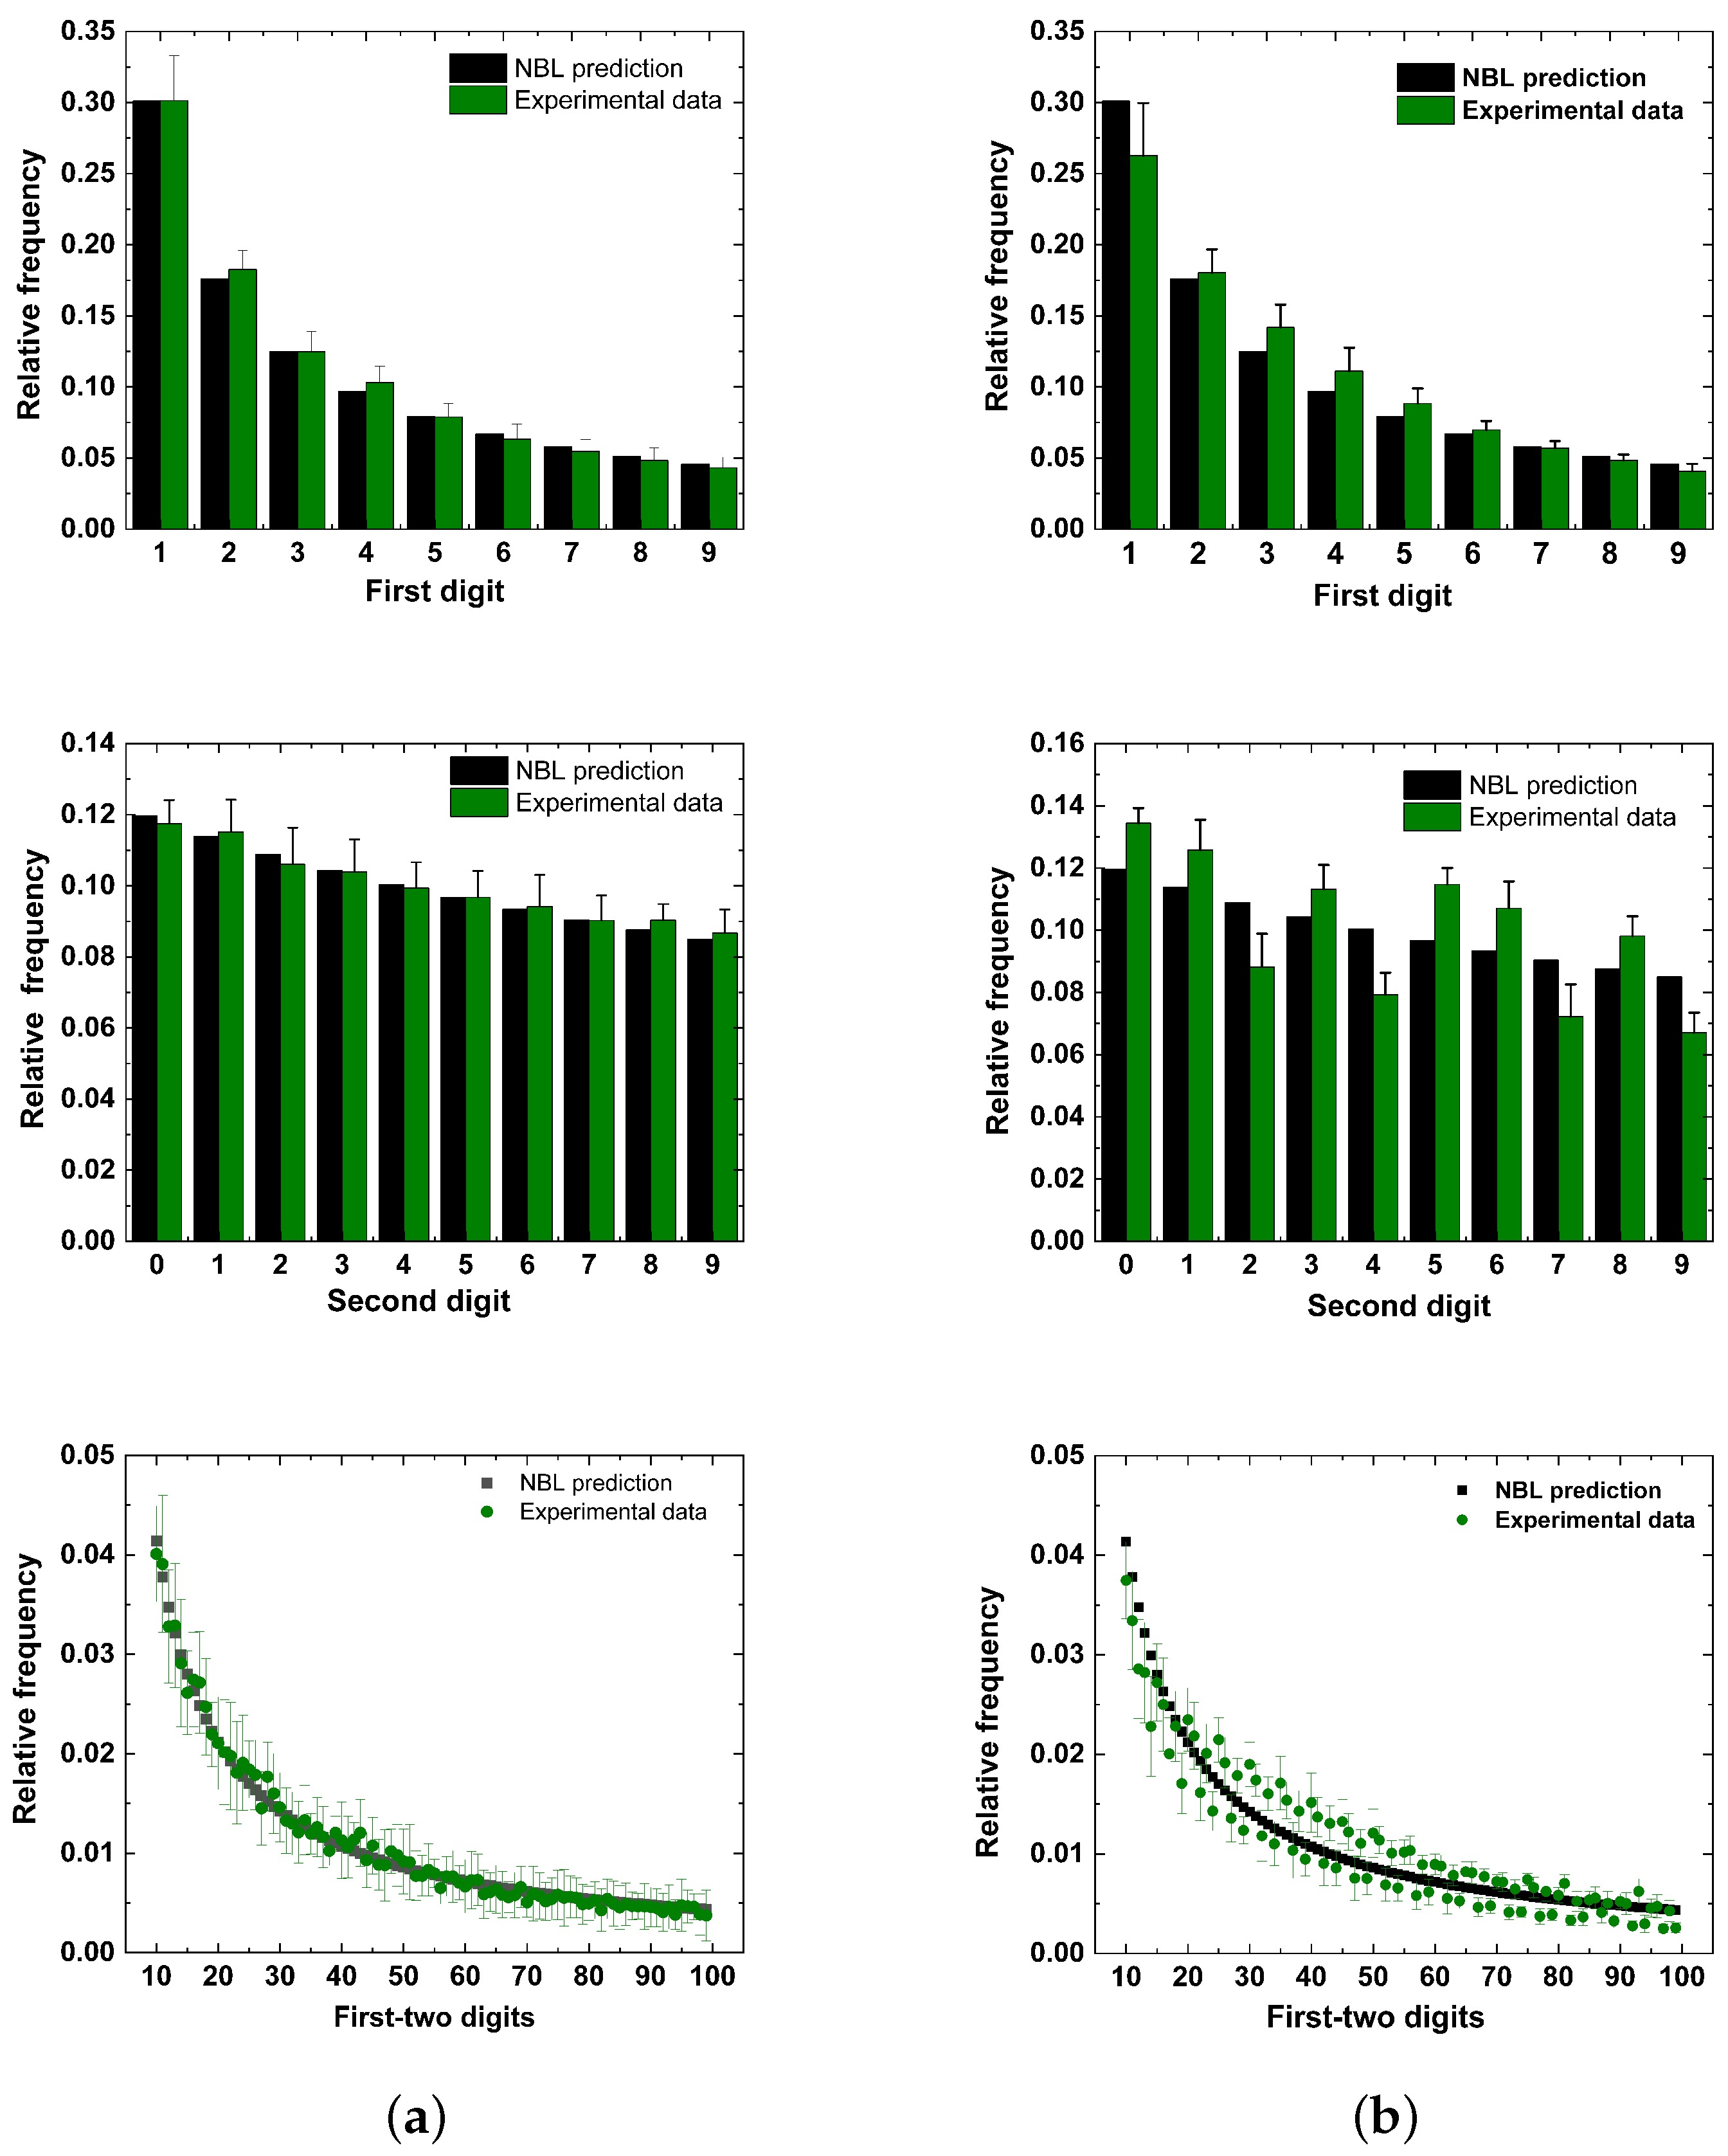
There is an intense debate about NBL compliance testing. Several procedures are available, but the validity of many of these methods has been questioned. For instance, many investigators perform tests that manifest the “excess of power” problem, yielding in the literature an accumulation of results with false claims of conformity. Adopting such tests is still questionable when dealing with large data. In this sense, the “excess power” emerges because the tests consider the sample size in their mathematical formulation. On the other hand, while the sample size certainly confers a fundamental parameter in statistical analysis, the tests that do not consider the sample size can be interpreted as the distance of the data with those frequencies predicted by the NBL. Within this scheme, proposals for methods arose in which the sample size was ignored, avoiding the “excess power” problem. To address this issue, Nigrini and Kossovsky suggested the mean absolute deviation (MAD) and the sum of squared difference (SSD), respectively [12,33]. The authors suggested that, despite the importance of MAD in calculating conformity in certain situations, the SSD is a superior test compared to the MAD. The main reason is that the SSD test does not involve absolute value, a concept directly inspired by regression theory, which uses the sum of squared errors. Notwithstanding the conceptual differences, the MAD and SSD are routinely applied in different investigations. In mathematical form, the MAD is presented as:
M A D = i = 1 n | A P i E P i | n ,
where A P and E P are the actual and expected proportion, respectively. Additionally, the SSD is calculated with the following equation:
S S D = i = 1 n A P i E P i 2 × 10 4 .
Once again, the A P and E P are the actual and expected proportion, respectively. Table 2 presents the conformance range for the MAD and SSD analysis.
Recent studies showed that even the MAD has inaccuracies, which will consequently reflect the actual compliance level. Investigating the foundations of this method, Lupi and Cerqueti addressed the inconsistencies in the premises of the MAD, allowing these researchers to give an alternative formulation about extracting the conformance level [39,40]. These authors presented a test, still based on the MAD, but considered the severity principle as applicable to make adjustments to the MAD values. The excess MAD test is presented as follows. Let us consider the following:
n | A P i E P i | E P i ( 1 E P i ) d N 2 π , 1 2 π ,
where N is a normal distribution. Furthermore, the MAD is given by:
n M A D d N 2 π k 2 ι D ι , 1 k 2 ι D R D ι .
The symbol represent the transpose; ι is a k-vector of 1s; D is a diagonal matrix formed by D = d i a g ( E P i ( 1 E P i ) ) ; R is the covariance matrix, defined as:
R = r 11 r 12 r 1 k r 21 r 22 r 2 k r k 1 r k 2 r k k ,
where
r i j = 2 π ρ i j a r c s i n ( ρ i j ) + 1 ( ρ i j ) 2 1 ,
with
ρ i j = E P i E P j ( 1 E P i ) ( 1 E P j ) f o r i j 1 f o r i = j .
For Equation (15), the MAD depends on n and k, a fact reinforced by the notation M A D n , k , which allows measuring the discrepancy of the usual MAD with respect to its mean. This observation represents the essence of the excess MAD, which is written in mathematical terms as follow below:
δ n , k = M A D n , k E ( M A D n , k ) .
Therefore, the MAD method, given by (12), is not independent of n, but rather, it depends on O ( n 1 / 2 ) [39,40]. Thus, we will not include the excess MAD for the gNBL because it has only been demonstrated that the MAD, under the null of conformity with the NBL, is approximately distributed as shown in (15) [39,40]. In this sense, for the gNBL, we will probably obtain another expression considering the α exponent values. Within this scope, subsequent investigations is necessary to delve into this problem in order to obtain a generalization of the MAD for the gNBL, providing a MAD as a function of α , k and n ( M A D α , k , n ), making possible to analyze its excess MAD as δ α , k , n .

5. Results

The conformity analysis summarized in Table 3 showed that, at normal [ K + ] o , the experimental MEPP intervals followed the NBL satisfactorily, considering the first and second digits, as much as the first–two digits. All data achieved at least marginal conformity. Moreover, it is essential to highlight that the excess MAD calculation adjusted the compliance levels, especially for the first–two digits, improving conformity in all cases. The excess MAD possibly attenuated the “excess power”, while the nonconformities obtained even with the excess MAD may suggest that the NBL in its classic format is inadequate to describe the MEPP intervals. This observation is also reinforced by examining Figure 2, where representative results extracted from two electrophysiological recordings can be observed, considering both physiological-level and high [ K + ] o . For the first digit, a visual inspection enables one to observe the excellent agreement of the experimental data and predicted values. However, taking all results given in Table 3 and Table 4, the conformity pattern revealed an exciting scenario, as different levels of compliance were observed regardless of the test used. Figure 3 brings the statistical summary of all databases for both potassium contents, where, in general, it is possible to observe a significant deviation of the data taken at high [ K + ] o . Despite this deviation, one may note, except for the second digit for high [ K + ] o , the characteristic asymmetric digits’ distribution predicted by the NBL.
The conformity levels obtained at high [ K + ] o highlighted that, although using the NBL gave more-frequent nonconformities, the overall results suggested that the law was mostly obeyed. Despite these results, we decided to give our attention to these deviations from the NBL proportions, especially for high [ K + ] o recordings, where we verified whether the NBL generalization might be more appropriate in the data adjustments. In this scheme, the results in Table 5 show for [ K + ] o = 5 mM that the gNBL is followed, which generally implies conformity improvement. This observation is readily confirmed by comparing the SSD results of Table 3 and Table 5. The conformity analysis for [ K + ] o = 25 mM, summarized in Table 4 and Table 6, also suggested a better adherence of the gNBL to the data as compared to the NBL calculations. In fact, according to these results, the compliance level improved in several cases.
The high number of intervals obtained in some electrophysiological recordings at high [ K + ] o offered the possibility of investigating how the level of compliance could be regulated as a function of the number of MEPP intervals. To address this issue, we performed an analysis based on the data cumulative frequency. This procedure divided the experimental data into equal portions within the time series. Next, we successively calculated the conformance level for each data portion. Figure 4 illustrates an analysis made of 112,330 intervals, which gives the conformity behavior considering the adopted tests. In general, for both [ K + ] o , the tests revealed fluctuations given by the presence of local conformities and nonconformities until achieving the last interval value, giving the final compliance level. The data studied with the NBL gradually improved the first digit compliance level. This behavior was analogously observed when using the gNBL, where conformity also improved despite the pronounced oscillations. For the second digit, there was a tendency for the level of compliance to be more unstable when the MEPP intervals quantity increased. On the other hand, the results for the first–two digits presented a slight conformity variation, suggesting an attenuated sensitivity concerning the data size.
Figure 4 revealed that the α exponent also exhibited an interesting oscillatory behavior, especially for the second digit compared to the first and first–two digits. Regarding the tests used to verify the conformity of the experimental data with the gNBL, a significant variation in the results of the second digit can be noticed, confirming the tendency observed in the NBL analysis. In addition, adopting the gNBL improved the compliance level. It is worth mentioning that this fluctuation was noted in all electrophysiological recordings, being evidently more pronounced in those obtained at high [ K + ] o . In summary, these results strongly suggest that, at least for MEPP intervals recorded at mammalian NMJ, the conformity level may be modulated by the MEPP frequency and time series length.
As stated above, the more pronounced deviations from NBL, observed at high [ K + ] o in the Figure 3 and Table 4, motivated us to verify the data disposition considering the gNBL. Figure 5 provides the statistical summary comparing the distribution of all digits of the experiments carried out at high [ K + ] o , in which one can verify a satisfactory enhancement of the gNBL with the experimental data. This observation may be visually confirmed by inspecting the first and first–two digits adjustments. The gNBL relevance was also highlighted by examining the α exponent, in which values close to 1, taken at physiological [ K + ] o , indicate that the NBL was sufficiently satisfactory to describe the MEPP intervals (Figure 6). Moreover, based on α exponent, one may indicate the importance of the gNBL in modeling data extracted from high [ K + ] o .

6. Discussion

The present study expanded our previous investigation on how changes in the ionic concentration of artificial physiological solution can modulate the level of compliance of intervals between MEPPs. In this framework, this report confirmed the validity of the NBL in a hyperkalemic environment. As already expected, the analysis initially showed that the intervals of MEPPs, recorded at normal [ K + ] o , agreed with the first, second, and first–two digits frequencies. We achieved this conclusion by assuming three different conformity tests. In [ K + ] o = 5 mM, the excess MAD test enabled improved conformity for both the first and second digits results. At the same time, for the first–two digits of data, all nonconformities were converted into conformities. These findings suggest how “excess power” may influence the results and data interpretation.
According to our analysis, at [ K + ] o = 25 mM, a heterogeneous conformity scenario emerged, in which nonconformity abundantly appeared as compared to the results for a physiological solution. Besides this observation, the SSD generally pointed out that the distribution of the digits obeyed the NBL. In most cases, the level of compliance predicted by this test relied on an acceptable and marginal level. On the other hand, the results obtained from the MAD and excess MAD calculations provided several nonconformities, showing the necessity of adopting a generalized NBL version to understand the applicability and limitations for [ K + ] o = 25 mM. Furthermore, the strong depolarization, promoted by the high [ K + ] o , resulted in the loss of conformity. In this framework, the gNBL assumption brought the MEPP interval to adhere to the law, especially when quantified by the SSD test. In addition, the α exponent values emerged as a helpful parameter for verifying if the data were better described by the gNBL or NBL. When the gNBL was used, the results for [ K + ] o within the physiological content showed that the median α exponent was close to 1. In contrast, at high [ K + ] o , they deviated more significantly from α = 1 , highlighting the importance of the gNBL to data harvested for higher concentrations. It is worth mentioning that a relevant issue concerns expanding the excess MAD used here to include analyses involving the gNBL. Consequently, within this scheme, it would be possible to more adequately assess the compliance levels using the MAD test in the generalized NBL version.
Based on the present findings, one may formulate the following questions: What neural substrate might be associated with law validation at high [ K + ] o ? Is there a relationship between morphological modifications and the rate of discharge of MEPPs? Therefore, is the gNBL, given by its α exponent, a possible indicator of the structural changes in the NMJ? Previous research suggested that a high [ K + ] o is related to morphological alterations as observed in a series of pathologies. Although our approach to tackle this question was indirect, focusing only on the electrical response, further combinations of morphological and electrophysiological studies are required to investigate how changes in the NMJ morphology can be associated with the α exponent. Yet, within this scope, it would also be essential to investigate the validity of the law in situations of injury, in which it is well accepted that the NMJ terminal undergoes morphological restructuring as well. Examining these issues may confirm the utility of the gNBL in quantifying numerical patterns in pathologies known to modify the NMJ architecture. If such a correspondence could be finally confirmed, the gNBL would arise as a suitable form for detecting the presence of an anomalous regime beyond those associated with hyperkalemia diseases.
In this work, the experiments were performed considering the ambient temperature. Besides the [ K + ] o increment, the increase in the thermal level is another critical parameter that promotes MEPPs frequency modulations. It is evident that thermal fluctuations modify the resting potential of the nerve terminal, depolarizing and hyperpolarizing as the biological membrane temperature is raised and lowered, respectively [41]. Consequently, although temperature changes and [ K + ] o have different synaptic mechanisms, a rising temperature similarly reflects an increment of the MEPP frequency [42,43]. Thus, one may hypothesize that, at higher temperatures, such as observed for the hyperkalemic environment, the gNBL would emerge as the most-appropriate formulation to study the first digit phenomenon at mammalian physiological temperature. In that case, the resting potential might be governed by physiological mechanisms ruled by a generalized formalism. This conjecture is based on the following arguments. Firstly, Procopio and Fornés, inspired by the fluctuation–dissipation theorem, showed how voltage fluctuations impose a mechanism responsible for regulating the gating channel behavior [44]. Secondly, influenced by generalized thermodynamics statistics (GTS), Chame and Mello generalized the fluctuation–dissipation theorem [45]. Thirdly, a direct mathematical relation between the NBL and GTS was deduced by Shao and Ma [46]. Finally, studies of the mammalian NMJ performed by da Silva et al. showed that synaptic transmission statistics are best understood within an approach inspired by the GTS [37,47]. Altogether, these arguments form a theoretical pillar to hypothesize about the existence of a relation between the gNBL within a generalized resting potential, likely valid at mammalian temperatures. In this scheme, α 1 would imply a resting potential regulated by the GTS formalism and its famous q-index. Therefore, the discussion given above offers a thermodynamic scenario for explaining the decrement or even conformity failures, computed for the first digits at high [ K + ] o . However, future investigations are required to comprehend a possible relationship between the temperature, the gNBL, and the GTS theory in the neurotransmission context.
Finally, it is essential to mention that large amounts of data, like those extracted at high [ K + ] o , represent an excellent way to assess how compliance can be changed as a function of the size of the data. This observation became significant for the second and first–two digits. Such a discussion allowed us to elaborate on these final profound questions: Will the validity of the law reported here in in vitro conditions still be verified at the systemic level, where the junction is intact and attached to the animal? Does the validity of the NBL change throughout the rodent’s life? Although taken using an artificial hyperkalemic physiological solution, our results showed local variations in the conformity level. Is this compliance behavior sensitive to the sampling rate or the size of the time series? Our results showed that, at least at the NMJ, the conformity level has a very dynamic behavior. Could our findings be equally extrapolated to the human NMJ? This last question remains a conundrum within many application possibilities of the NBL in neurophysiology. Further experimental investigations are welcome to assess these intriguing questions.

7. Conclusions

In this work, we examined MEEP time series to confirm the validity of the NBL in hyperkalemic conditions. This strategy validated the NBL in a scenario characterized by a high release rate of neurotransmitters, induced by manipulating an artificial physiological solution. In this framework, our work highlighted the usefulness of adopting a generalized NBL version. In addition, these results reinforced our previous findings, pointing to a possible ubiquity of the law at the NMJ, at least in electrophysiological signals collected from in vitro experiments. In fact, the assumption of a high potassium concentration allowed us to assess the robustness of the law for a large amount of data. We also observed an interesting pattern of fluctuation in the level of conformity as a function of the size of the number of intervals.
In the future, we hope to use the same experimental protocols to investigate the validity of this law in electrical signals collected from synapses in the brain. Moreover, it is tempting to suggest that the gNBL may be employed to detect and quantify numerical patterns associated with abnormal physiological situations. We emphasize the importance of considering further electrophysiological recordings at different temperatures, allowing them to be combined with theoretical studies investigating a possible connection between the gNBL and generalized statistical mechanics. If successful, this study could show more precisely the relationship between the level of membrane potential fluctuation and the gNBL.

Author Contributions

Conceptualization, A.S.; methodology, A.S. and R.L; software, S.F.; validation, A.S., S.F. and R.L.; formal analysis, A.S. and S.F.; data curation, A.S. and S.F.; interpretation, A.S.; writing—original draft preparation, A.S. and S.F.; writing—review and editing, A.S. and S.F.; supervision, A.S.; project administration, A.S. All authors have read and agreed to the published version of the manuscript.

Funding

This research received no external funding.

Institutional Review Board Statement

The animal study protocol was approved by the Ethics Committee of CETEA–UFMG (protocol code 073/03).

Informed Consent Statement

Not applicable.

Data Availability Statement

The dataset is not publicly available.

Acknowledgments

One of the authors (A.J. da Silva) would like to dedicate this article to the memory of Maria Pinheiro da Silva and Jolinda Pinheiro da Silva for their support and encouragement in his academic career. We are indebted to the valuable help and suggestions of Alex Ely Kossovsky, Claudio Lupi and Danielle C. Santos.

Conflicts of Interest

The authors declare no conflict of interest.

References

  1. Van der Kloot, W. The regulation of quantal size. Prog. Neurobiol. 1991, 36, 93–130. [Google Scholar] [CrossRef]
  2. Katz, B. Quantal mechanism of neural transmitter release. Science 1971, 173, 123–126. [Google Scholar] [CrossRef]
  3. Bennett, M.R.; Kearns, J.L. Statistics of transmitter release at nerve terminals. Prog. Neurobiol. 2000, 60, 545–606. [Google Scholar] [CrossRef] [PubMed]
  4. Robinson, J. Estimation of parameters for a model of transmitter release at synapses. Biometrics 1976, 32, 61–68. [Google Scholar] [CrossRef]
  5. Washio, H.M.; Inouye, S.T. The statistical analysis of spontaneous transmitter release at individual junctions on cockroach muscle. J. Exp. Biol. 1980, 87, 195–201. [Google Scholar] [CrossRef]
  6. Cohen, I.; Kita, H.; Van der Kloot, W. Miniature end-plate potentials: Evidence that the intervals are not fit by a Poisson distribution. Brain Res. 1973, 54, 318–323. [Google Scholar] [CrossRef]
  7. Lowen, S.B.; Cash, S.S.; Poo, M.; Teich, M.C. Quantal neurotransmitter secretion rate exhibits fractal behavior. J. Neurosci. 1997, 17, 5666–5677. [Google Scholar] [CrossRef] [PubMed]
  8. Takeda, T.; Sakata, A.; Matsuoka, T. Fractal dimensions in the occurrence of miniature end-plate potential in a vertebrate neuromuscular junction. Prog. Neuropsychopharmacol. Biol. Psychiatry. 1999, 23, 1157–1169. [Google Scholar] [CrossRef]
  9. da Silva, A.J.; Lima, R.F.; Moret, M.A. Nonextensivity and self-affinity in the mammalian neuromuscular junction. Phys. Rev. E 2011, 84, 041925. [Google Scholar] [CrossRef]
  10. Newcomb, S. Note on the Frequency of Use of the Different Digits in Natural Numbers. Am. J. Math. 1881, 4, 39–40. [Google Scholar] [CrossRef]
  11. Benford, F. The Law of Anomalous Numbers. Benford. Proc. Am. Philos. Soc. 1938, 78, 551–572. Available online: https://www.jstor.org/stable/984802 (accessed on 4 September 2023).
  12. Kossovsky, A.E. Benford’s Law: Theory, the General Law of Relative Quantities, and Forensic Fraud Detection Applications; World Scientific: Singapore, 2014. [Google Scholar]
  13. Berger, A.; Hill, T. An Introduction to Benford’s Law; Princeton University Press: Princeton, NJ, USA, 2015. [Google Scholar]
  14. Hill, T.P. A Statistical Derivation of the Significant-Digit Law. Stat. Sci. 1995, 10, 354–363. Available online: https://www.jstor.org/stable/2246134 (accessed on 4 September 2023). [CrossRef]
  15. Hill, T.P. The Significant-Digit Phenomenon. Am. Math. Mon. 1995, 102, 322–327. [Google Scholar] [CrossRef]
  16. Hill, T.P. Base-Invariance Implies Benford’s Law. Proc. Am. Math. Soc. 1995, 123, 887–895. Available online: https://www.ams.org/journals/proc/1995-123-03/S0002-9939-1995-1233974-8/ (accessed on 4 September 2023).
  17. Burgos, A.; Santos, A. The Newcomb–Benford law: Scale invariance and a simple Markov process based on it. Am. J. Phys. 2021, 89, 851–861. [Google Scholar] [CrossRef]
  18. Morag, S.; Salmon-Divon, M. Characterizing Human Cell Types and Tissue Origin Using the Benford Law. Cells 2019, 8, 1004. [Google Scholar] [CrossRef] [PubMed]
  19. Crocetti, E.; Randi, G. Using the Benford’s Law as a First Step to Assess the Quality of the Cancer Registry Data. Front. Public Health 2016, 13, 225. [Google Scholar] [CrossRef]
  20. Yan, X.; Yang, S.; Kim, B.J.; Minnhagen, P. Benford’s law and first letter of words. Phys. A Stat. Mech. Appl. 2018, 512, 305–315. [Google Scholar] [CrossRef]
  21. Toledo, P.A.; Riquelme, S.R.; Campos, J.A. Earthquake source parameters that display the first digit phenomenon. Nonlin. Process. Geophys. 2015, 22, 625–632. [Google Scholar] [CrossRef]
  22. Bassingthwaighte, J.B.; Leibovitch, L.S.; West, B.J. Fractal Physiology; Oxford University Press: New York, NY, USA, 1994. [Google Scholar]
  23. Seenivasan, P.; Easwaran., S.; Sridhar, S.; Sinha, S. Using Skewness and the First-Digit Phenomenon to Identify Dynamical Transitions in Cardiac Models. Front. Physiol. 2015, 6, 390. [Google Scholar] [CrossRef]
  24. Tirunagari, S.; Abasolo, D.; Iorliam, A.; Ho, A.T.S.; Poh, N. Using Benford’s law to detect anomalies in electroencephalogram: An application to detecting Alzheimer’s disease. In Proceedings of the IEEE Conference on Computational Intelligence in Bioinformatics and Computational Biology, Manchester, UK, 23–25 August 2017; pp. 1–6. [Google Scholar] [CrossRef]
  25. Silva, A.J.; Floquet, S.; Santos, D.O.C.; Lima, R.F. On the validation of Newcomb–Benford law and Weibull distribution in neuromuscular transmission. Phys. A Stat. Mech. Appl. 2020, 553, 124606. [Google Scholar] [CrossRef]
  26. Lindinger, M.I.; Cairns, S.P. Regulation of muscle potassium: Exercise performance, fatigue and health implications. Eur. J. Appl. Physiol. 2021, 121, 721–748. [Google Scholar] [CrossRef]
  27. Maljevic, S.; Lerche, H. Potassium channels: A review of broadening therapeutic possibilities for neurological diseases. J. Neurol. 2013, 260, 2201–2211. [Google Scholar] [CrossRef]
  28. Grohovaz, F.; Fesce, R.; Haimann, C. Dual effect of potassium on transmitter exocytosis. Cell Biol. Int. Rep. 1989, 12, 1085–1095. [Google Scholar] [CrossRef]
  29. Adrian, R.H. The effect of internal and external potassium concentration on the membrane potential of frog muscle. J. Physiol. 1956, 133, 631–658. [Google Scholar] [CrossRef]
  30. Ceccarelli, B.; Fesce, R.; Grohovaz, F.; Haimann, C. The effect of potassium on exocytosis of transmitter at the frog neuromuscular junction. J. Physiol. 1988, 401, 163–183. [Google Scholar] [CrossRef] [PubMed]
  31. Syková, E.; Nicholson, C. Diffusion in brain extracellular space. Physiol. Rev. 2008, 88, 1277–1340. [Google Scholar] [CrossRef]
  32. Diekmann, A. Not the First Digit! Using Benford’s Law to Detect Fraudulent Scientific Data. J. Appl. Stat. 2007, 34, 321–329. [Google Scholar] [CrossRef]
  33. Nigrini, M.J. Benford’s Law: Applications for Forensic Accounting, Auditing, and Fraud Detection; John Wiley & Sons: Hoboken, NJ, USA, 2012. [Google Scholar]
  34. Díaz, J.; Gallart, J.; Ruiz, M. On the Ability of the Benford’s Law to Detect Earthquakes and Discriminate Seismic Signals. Seismol. Res. Lett. 2014, 86, 192–201. [Google Scholar] [CrossRef]
  35. Gauvrit, N.G.; Houillon, J.C.; Delahaye, J.P. Generalized Benford’s Law as a Lie Detector. Adv. Cogn. Psychol. 2017, 13, 121–127. [Google Scholar] [CrossRef] [PubMed]
  36. Pietronero, L.; Tosatti, E.; Tosatti, V.; Vespignani, A. Explaining the uneven distribution of numbers in nature: The laws of Benford and Zipf. Phys. A 2001, 293, 297–304. [Google Scholar] [CrossRef]
  37. Silva, A.J.; Trindade, M.A.; Santos, D.O.; Lima, R.F. Maximum-likelihood q-estimator uncovers the role of potassium at neuromuscular junctions. Biol. Cybern. 2016, 110, 31–40. [Google Scholar] [CrossRef]
  38. Lima, R.F.; Prado, V.F.; Prado, M.A.; Kushmerick, C. Quantal release of acetylcholine in mice with reduced levels of the vesicular acetylcholine transporter. J. Neurochem. 2010, 113, 943–951. [Google Scholar] [CrossRef] [PubMed]
  39. Cerqueti, R.; Maggi, M. Data validity and statistical conformity with Benford’s Law. Chaos Solit. Fract. 2021, 144, 110740. [Google Scholar] [CrossRef]
  40. Cerqueti, R.; Lupi, C. Severe testing of Benford’s law. Test 2023, 32, 677–694. [Google Scholar] [CrossRef]
  41. Nakanishi, T.; Norris, F.H. Effect of local temperature on resting membrane potential in rat muscle. Electroencephalogr. Clin. Neurophysiol. 1969, 718, 633–636. [Google Scholar] [CrossRef]
  42. Ward, D.; Crowley, W.J.; Johns, T.R. Effects of temperature at the neuromuscular junction. Am. J. Physiol. 1972, 222, 216–219. [Google Scholar] [CrossRef] [PubMed]
  43. White, R. Effects of high temperature and low calcium on neuromuscular transmission in frog. J. Therm. Biol. 1976, 1, 227–232. [Google Scholar] [CrossRef]
  44. Procopio, J.; Fornés, J.A. Fluctuation-dissipation theorem imposes high-voltage fluctuations in biological ionic channels. Phys. Rev. E. 1995, 51, 829–831. [Google Scholar] [CrossRef]
  45. Chame, A.; Mello, E.V.L. The fluctuation-dissipation theorem in the framework of the Tsallis statistics J. Phys. A Math. Gen. 1994, 27, 3663–3670. [Google Scholar] [CrossRef]
  46. Shao, L.; Ma, B.Q. First-digit law in nonextensive statistics. Phys. Rev. E 2010, 82, 041110. [Google Scholar] [CrossRef] [PubMed]
  47. Silva, A.J.; Floquet, S.; Santos, D.O.C. Statistical crossover and nonextensive behavior of neuronal short-term depression. J. Biol. Phys. 2018, 44, 37–50. [Google Scholar] [CrossRef] [PubMed]
Figure 1. Representative electrophysiological portions collected from two experiments carried out at physiological (left) and high [ K + ] o (right).
Stats 06 00066 g001
Figure 2. Representative examples from two recording taken for both [ K + ] o = 5 mM (a) and [ K + ] o = 25 mM (b), showing a satisfactory conformity between the NBL and the experimental data. To enhance the clarity, the first–two digits graphs are represented as lines.
Stats 06 00066 g002aStats 06 00066 g002b
Figure 3. Statistical summary for [ K + ] o = 5 mM (n = 14) (a) and [ K + ] o = 25 mM (n = 12) (b), using the NBL. Note that, on average, all experimental data collected for [ K + ] o = 5 mM adhere satisfactorily to the NBL, in the three situations examined, while for [ K + ] o = 25 mM, the adjustments become poorer, indicating the possibility of using a general version of the NBL. To enhance the clarity, the first–two digits graphs are represented as lines. Values are expressed as the mean ± standard deviation.
Stats 06 00066 g003
Figure 4. Analysis carried out on a specific recording (Data 5), during [ K + ] o = 25 mM administration, studied with NBL (a) and gNBL (b). The results highlight a heterogeneous profile in the conformity level as well as an unexpected oscillation α exponent values.
Stats 06 00066 g004
Figure 5. Statistical summary for recordings (n = 12) taken with [ K + ] o = 25 mM, using the gNBL. On average, compared to the NBL results, the experimental data adhered more satisfactorily to the gNBL for the three situations examined. To enhance the clarity, the first–two digits graphs are represented as lines. Values are expressed as the mean ± standard deviation.
Stats 06 00066 g005
Figure 6. Statistical summary for the α exponent for the experiments considering [ K + ] o = 5 mM (n = 14) (a) and [ K + ] o = 25 mM (n = 12) (b). The pronounced deviation of the α exponent from the median of 1 underscores the usefulness of the gNBL for adjustments of the hyperkalemic conditions.
Stats 06 00066 g006
Table 1. Frequencies for the first and second digit of the NBL.
Digit0123456789
1st-0.301030.176090.124940.096910.079180.066950.057990.051150.04576
2nd0.119680.113890.108820.104330.100310.096680.093370.090350.087570.08500
Table 2. Levels of conformity for the first, second, and first–two digits.
First DigitSecond DigitFirst–Two Digits
RangeConformityRangeConformityRangeConformity
MAD0.000 to 0.006Close0.000 to 0.008Close0.0000 to 0.0012Close
0.006 to 0.012Acceptable0.008 to 0.010Acceptable0.0012 to 0.0018Acceptable
0.012 to 0.015Marginal0.010 to 0.012Marginal0.0018 to 0.0022Marginal
Above 0.015NonconformityAbove 0.012NonconformityAbove 0.0022Nonconformity
SSD0 to 2Close0 to 2Close0 to 2Close
2 to 25Acceptable2 to 10Acceptable2 to 10Acceptable
25 to 100Marginal10 to 50Marginal10 to 50Marginal
Above 100NonconformityAbove 50NonconformityAbove 50Nonconformity
Table 3. Summary of the NBL tests for [ K + ] o = 5 mM.
First Digit
DatanMADExcess MADSSD
17300.00837−0.0003212.28475
28690.019950.0119886.45288
321810.009890.0048616.56178
49280.008580.0008710.08629
529730.013050.0087421.54770
66420.009860.000609.91123
713490.008870.0024810.38188
811620.012700.0058118.13111
916850.008450.0027311.65409
1010090.011370.0039816.06490
1120480.008070.002887.53752
1230600.007220.002988.61009
1315100.011920.0058827.89886
1424360.009160.004409.96616
Second Digit
DatanMADExcess MADSSD
17300.00683−0.002028.19079
28690.009500.0013912.32210
321810.005440.000334.28136
49280.008510.0006712.11295
529730.00318−0.001201.80299
66420.00558−0.003854.44022
713490.00466−0.001843.15052
811620.007850.000848.96622
916850.006920.001107.73984
1010090.00494−0.002583.72527
1120480.00525−0.000033.96622
1230600.004950.000633.65075
1315100.00612−0.000035.18546
1424360.005290.000454.44622
First-Two Digits
DatanMADExcess MADSSD
17300.00253−0.0004010.83412
28690.003660.0009721.72249
321810.002320.000628.81407
49280.002760.0001612.93240
529730.001770.000315.02102
66420.00268−0.000459.19816
713490.002250.000097.40826
811620.002440.000128.78088
916850.002250.000318.69891
1010090.00240−0.000107.84890
1120480.00169−0.000064.39289
1230600.00141−0.000024.12983
1315100.002630.0005910.24864
1424360.001670.000074.34060
Table 4. Summary of the NBL tests for [ K + ] o = 25 mM.
First Digit
DatanMADExcess MADSSD
156,8530.026870.02589117.77678
240,9510.023830.02267102.72734
372,5190.018270.0174069.91262
451,2070.009100.0080711.41064
5112,3300.013750.0130536.17818
6107,8010.019520.0188152.04470
736,3300.006190.004964.52025
837,7580.00117−0.000040.25865
937,7030.007320.006117.98955
1072,7870.020640.0197792.09016
1134,8330.010540.0092819.34788
1229,3130.003180.001801.77512
Second Digit
DatanMADExcess MADSSD
156,8530.009950.0089516.15754
240,9510.007050.005866.48468
372,5190.020880.0200046.27171
451,2070.015890.0148426.70868
5112,3300.016010.0153029.43487
6107,8010.022130.0214052.58192
736,3300.015760.0145026.28400
837,7580.014410.0131821.98806
937,7030.012530.0113016.74141
1072,7870.024090.0232061.55550
1134,8330.018540.0172637.01945
1229,3130.018970.0175738.09396
First-Two Digits
DatanMADExcess MADSSD
156,8530.003010.0026815.60049
240,9510.002490.0020912.89166
372,5190.003080.0027813.89474
451,2070.001810.001464.98217
5112,3300.002310.002078.19403
6107,8010.003180.0029414.78929
736,3300.001920.001503.94064
837,7580.001630.001222.85762
937,7030.001600.001193.65519
1072,7870.003490.0032017.89426
1134,8330.002430.002006.71510
1229,3130.002170.001715.13421
Table 5. Summary of gNBL tests for [ K + ] o = 5 mM.
First Digit
DatanAlphaMADSSD
17301.097340.006365.35810
28691.305360.0106516.90700
321810.857830.003491.97250
49280.986980.008289.96370
529730.873380.008519.87620
66421.071800.007135.96820
713490.969040.008449.65490
811621.087730.0100812.10020
916850.932510.007288.23990
1010090.895520.008248.04460
1120481.051460.006615.51620
1230601.094660.003681.97250
1315100.867050.0114914.54340
1424361.061650.007947.02810
Second Digit
DatanAlphaMADSSD
17300.883150.007037.88420
28691.202070.0097711.27090
321810.762990.004803.19950
49280.567410.006998.74690
529730.969400.003281.78210
66420.820570.005653.79340
713490.833570.004312.57830
811621.142570.007948.44120
916851.149750.006537.19650
1010091.042170.004853.68420
1120480.826210.004653.33970
1230601.080130.005313.49580
1315100.618210.004252.57810
1424360.985190.005384.44090
First-Two Digits
DatanAlphaMADSSD
17301.117850.002419.63330
28691.244520.0032916.11180
321810.863270.002147.27660
49280.977340.0027612.88900
529730.873170.001573.66930
66421.064330.002598.82400
713490.942170.002197.11010
811621.072380.002368.29090
916850.918080.002238.10760
1010090.903270.002307.05690
1120481.051250.001664.15790
1230601.098100.001293.28490
1315100.844430.002488.13420
1424361.033070.001654.23940
Table 6. Summary of gNBL tests for [ K + ] o = 25 mM.
First Digit
DatanAlphaMADSSD
156,8530.686160.0198245.09730
240,9510.734110.0209347.66000
372,5190.753050.0148723.73950
451,2071.105010.004273.05230
5112,3300.831260.0115214.63950
6107,8010.876030.0186039.84270
736,3300.927000.002280.68170
837,7581.004370.001230.24450
937,7031.028160.007127.37960
1072,7870.701650.0154025.51630
1134,8330.849720.004752.89430
1229,3130.966200.002650.92750
Second Digit
DatanAlphaMADSSD
156,8531.269130.0092814.27730
240,9510.958270.007096.44590
372,5191.263040.0196544.44780
451,2071.306220.0144424.16300
5112,3301.283740.0146827.29740
6107,8011.320200.0206149.80040
736,3301.296370.0143623.90470
837,7581.275430.0131219.94300
937,7031.212470.0115515.56480
1072,7871.295320.0226959.22550
1134,8331.388290.0166632.80310
1229,3131.311140.0174935.45490
First-Two Digits
DatanAlphaMADSSD
156,8530.718680.002499.14370
240,9510.737050.002206.82500
372,5190.767790.002729.27860
451,2071.087790.001834.27770
5112,3300.845410.002156.12730
6107,8010.874790.0031413.35130
736,3300.959090.001893.80170
837,7581.004990.001642.85540
937,7031.006830.001603.65090
1072,7870.726060.0030911.62400
1134,8330.887600.002245.66890
1229,3130.974530.002145.07780
Disclaimer/Publisher’s Note: The statements, opinions and data contained in all publications are solely those of the individual author(s) and contributor(s) and not of MDPI and/or the editor(s). MDPI and/or the editor(s) disclaim responsibility for any injury to people or property resulting from any ideas, methods, instructions or products referred to in the content.

