You are currently viewing a new version of our website. To view the old version click .
J
  • Article
  • Open Access

27 June 2024

Enhancing Obscured Regions in Thermal Imaging: A Novel GAN-Based Approach for Efficient Occlusion Inpainting

,
,
and
Department of Electrical and Computer Engineering, Herff College of Engineering, University of Memphis, 3817 Central Ave, Memphis, TN 38111, USA
*
Author to whom correspondence should be addressed.
This article belongs to the Section Computer Science & Mathematics

Abstract

This research paper presents a novel approach for occlusion inpainting in thermal images to efficiently segment and enhance obscured regions within these images. The increasing reliance on thermal imaging in fields like surveillance, security, and defense necessitates the accurate detection of obscurants such as smoke and fog. Traditional methods often struggle with these complexities, leading to the need for more advanced solutions. Our proposed methodology uses a Generative Adversarial Network (GAN) to fill occluded areas in thermal images. This process begins with an obscured region segmentation, followed by a GAN-based pixel replacement in these areas. The methodology encompasses building, training, evaluating, and optimizing the model to ensure swift real-time performance. One of the key challenges in thermal imaging is identifying effective strategies to mitigate critical information loss due to atmospheric interference. Our approach addresses this by employing sophisticated deep-learning techniques. These techniques segment, classify and inpaint these obscured regions in a patch-wise manner, allowing for more precise and accurate image restoration. We propose utilizing architectures similar to Pix2Pix and UNet networks for generative and segmentation tasks. These networks are known for their effectiveness in image-to-image translation and segmentation tasks. Our method enhances the segmentation and inpainting process by leveraging their architectural similarities. To validate our approach, we provide a quantitative analysis and performance comparison. We include a quantitative comparison between (Pix2Pix and UNet) and our combined architecture. The comparison focuses on how well each model performs in terms of accuracy and speed, highlighting the advantages of our integrated approach. This research contributes to advancing thermal imaging techniques, offering a more robust solution for dealing with obscured regions. The integration of advanced deep learning models holds the potential to significantly improve image analysis in critical applications like surveillance and security.

1. Introduction

Obscurants are substances that obscure or hide objects or areas in thermal images. Obscurants can be physical objects, such as smoke or fog, or materials explicitly designed to scatter or absorb thermal radiation. Obscurants can cause significant challenges in the processing of thermal images, as they can significantly affect the quality of the photos and reduce their usefulness for a variety of applications [1].
The most common obscurants in thermal images are smoke, fog, and clouds. Smoke can scatter and absorb thermal radiation, causing significant reductions in the visibility of objects in thermal images [2]. Fog can also scatter thermal radiation, leading to similar reductions in visibility [3]. Clouds can absorb thermal radiation and cause significant reductions in the contrast and detail of thermal images.
Several approaches have been proposed to mitigate the effects of obscurants in thermal images. One approach is to use mathematical models to correct for the scattering and absorption of thermal radiation by obscurants [1]. These models can compensate for the effects of obscurants in thermal images and restore their quality. Another approach is to use image processing techniques, such as image enhancement and restoration, to improve the quality of thermal images in the presence of obscurants [3].
The use of deep learning methods, such as Convolutional Neural Networks (CNNs) and Generative Adversarial Networks (GANs), has also been proposed for obscurant correction in thermal images [2]. These methods have been trained on large datasets to learn the underlying structure of thermal images and to restore the quality of thermal images in the presence of obscurants. With the increasing utility of thermal imaging in various domains, the challenges posed by obscurants in the atmosphere have become more evident. This paper proposes applying image segmentation to localize the occluded regions; later, we use GANs to inpaint the occluded segments.
This paper is organized as follows: In the next section, we provide a detailed examination of the methodology, focusing on the recent developments and techniques in the field of image segmentation and image inpainting. Section 2 outlines our methodology, including data collection strategies and the two-stage occlusion removal model architecture, which comprises mask generation using U-Net and image inpainting using Pix2Pix, followed by a discussion on training and validation. Section 3 presents our experimental results, detailing evaluation metrics such as the F1 Score and Intersection Over Union (IoU) for segmentation, Structural Similarity (SSIM), Peak Signal Noise Ratio (PSNR), and Mean Average Precision (mAP) for inpainting, along with both qualitative and quantitative results. The paper then proceeds to discussions in Section 4, future work in Section 5, and concludes with Section 6.

3. Methodology

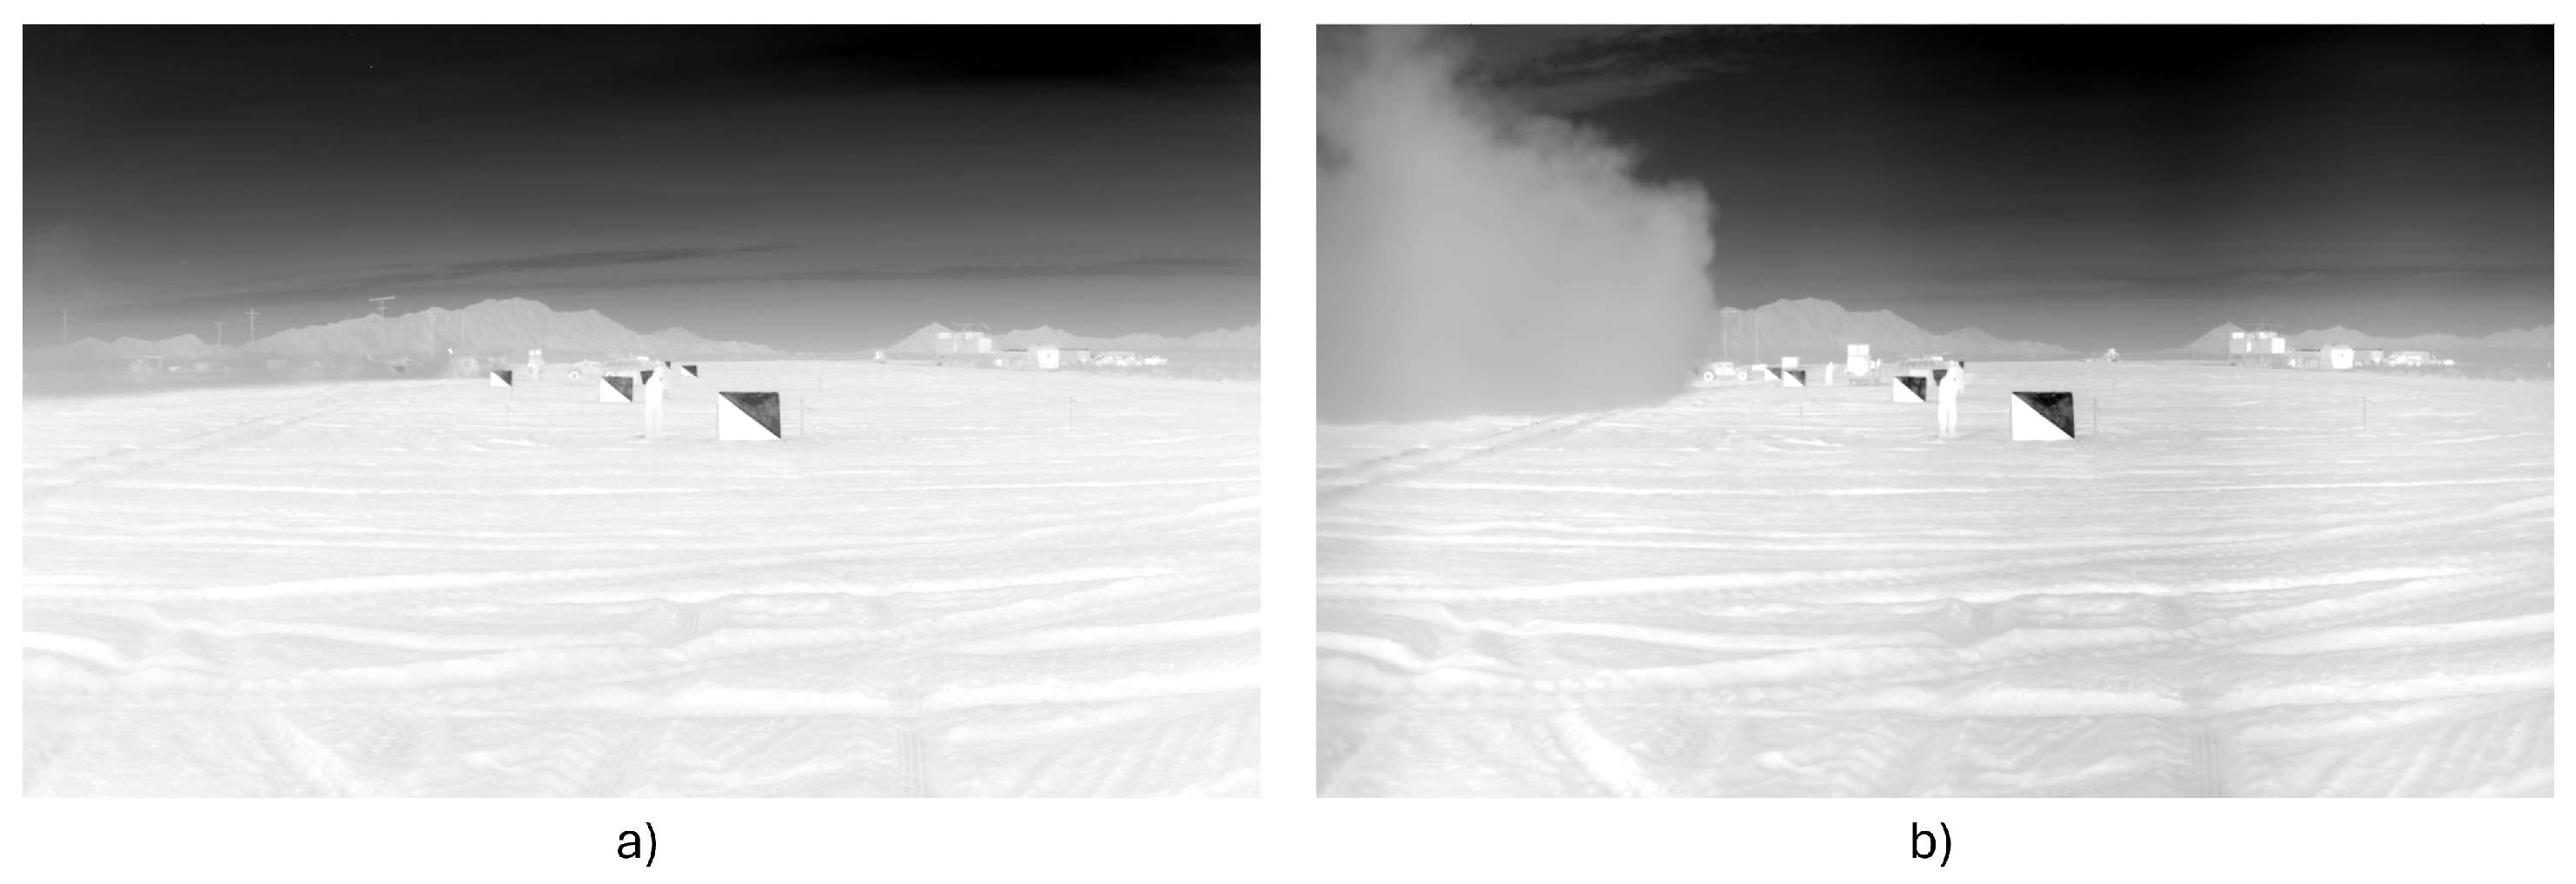
3.1. Data Collection

The data collected for this study are split into two parts: the first is the occlusion part, and the second is the urban imagery mask used to train the generator. The masks applied to the images used in training the GAN are generated in the first step and explained next.

3.1.1. Occlusion Classification

The occlusion data were collected by capturing images of a pickup truck driving on a gravel road. The truck’s velocity was sufficient to kick up enough obscurants to form a dust cloud. The images were then cropped into smaller patches of size 128×128 pixels. A filter was applied to every patch where the severity of the occlusion is determined by taking the Nth derivative of the path and then subtracting the Nth derivative from the first. The severity of the occlusion is proportional to the magnitude of the difference, and the optimal value of N is determined empirically. Larger magnitudes indicate more image detail, indicating lighter image occlusion. In other words, the occlusion level is inversely related to the derivative difference. This approach is similar to the difference of Gaussian approach used to extract high-frequency information from images.
Given the Gaussian function:
G ( x , y , σ ) = 1 2 π σ 2 e x 2 + y 2 2 σ 2
The magnitude of the difference between the Nth Gaussian and the first Gaussian is:
| G ( x , y , σ N ) G ( x , y , σ 1 ) |
We distinguished between heavily occluded regions and uniform objects by calculating the average pixel value of the clear but uniform regions. For example, A clear sky has low average pixel values compared to dust clouds, and therefore, they were automatically discarded. White walls, a good example of uniform surfaces, have slightly higher temperatures; therefore, they look brighter in the image and are discarded.
We train a simple image classifier to distinguish cloudy patches from clear ones using Gray-Level Co-Occurrence Matrix (GLCM) texture analysis. More details are mentioned in [32].
We collected videos with a static camera to validate the generator on similar data. The collected images, both moving and static, have a resolution of 1920 × 1200 .
The approximate number of images captured by moving cameras is 3500, while the number of images captured by static cameras is 1000.

3.1.2. KAIST Thermal Suburban Dataset

The KAIST Multispectral Pedestrian Dataset, initially developed for pedestrian detection tasks, has also found utility in suburban image segmentation. Suburban regions, characterized by a mix of residential areas, green spaces, and infrastructure, present unique challenges in image segmentation due to varied textures, patterns, and lighting conditions. Combining high-resolution color and thermal images in the KAIST dataset offers an innovative approach to address these complexities. Thermal imaging, in particular, can highlight nuances in suburban landscapes that are otherwise subtle or invisible in RGB images, such as heat footprints of buildings or vegetation. Utilizing the KAIST dataset for suburban segmentation allows researchers and practitioners to leverage multispectral data’s complementary strengths, yielding more accurate and detailed segmentation results in suburban environments [33]. The benefit of choosing the dataset over other thermal datasets is the pairing of RGB and thermal images, which will be our way of evaluating the generative model. By running inferences with a high-performing object detection model on both the RGB and the inpainted thermal image, the accuracy will then be compared to determine the quality of the regenerated portion.

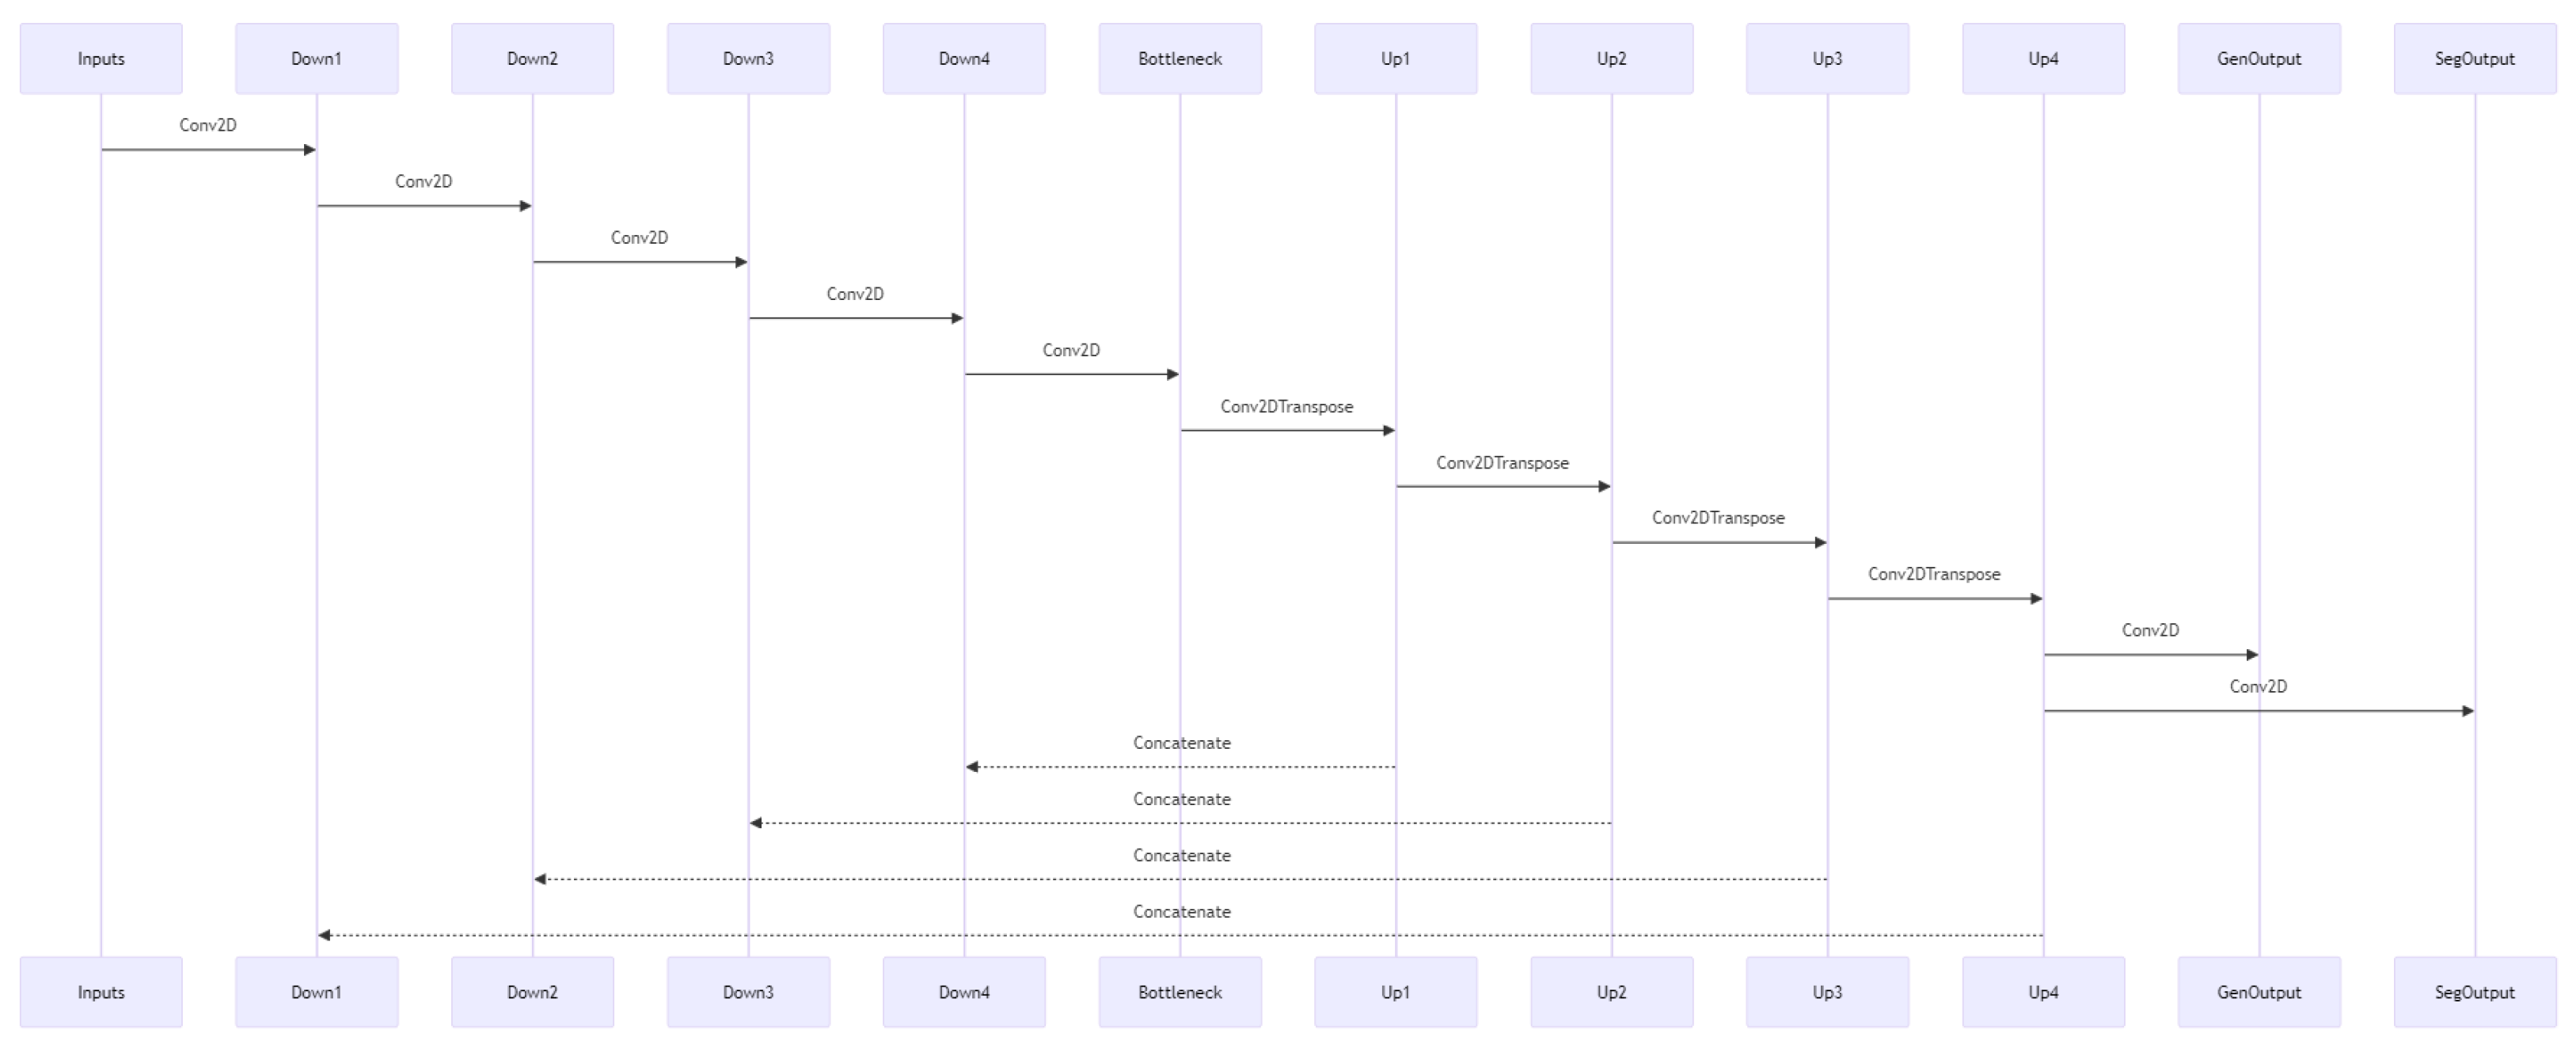
3.2. Occlusion Two-Stage Removal Model Architecture

The Occlusion Removal process consists of two parts as shown in Figure 1, starting with a segmentation model that segments the obscured parts of the image, adding a mask on those areas, and an image inpainting model that fills in the missing pixels in the image.
Figure 1. Flow chart for the two-stage proposed method.

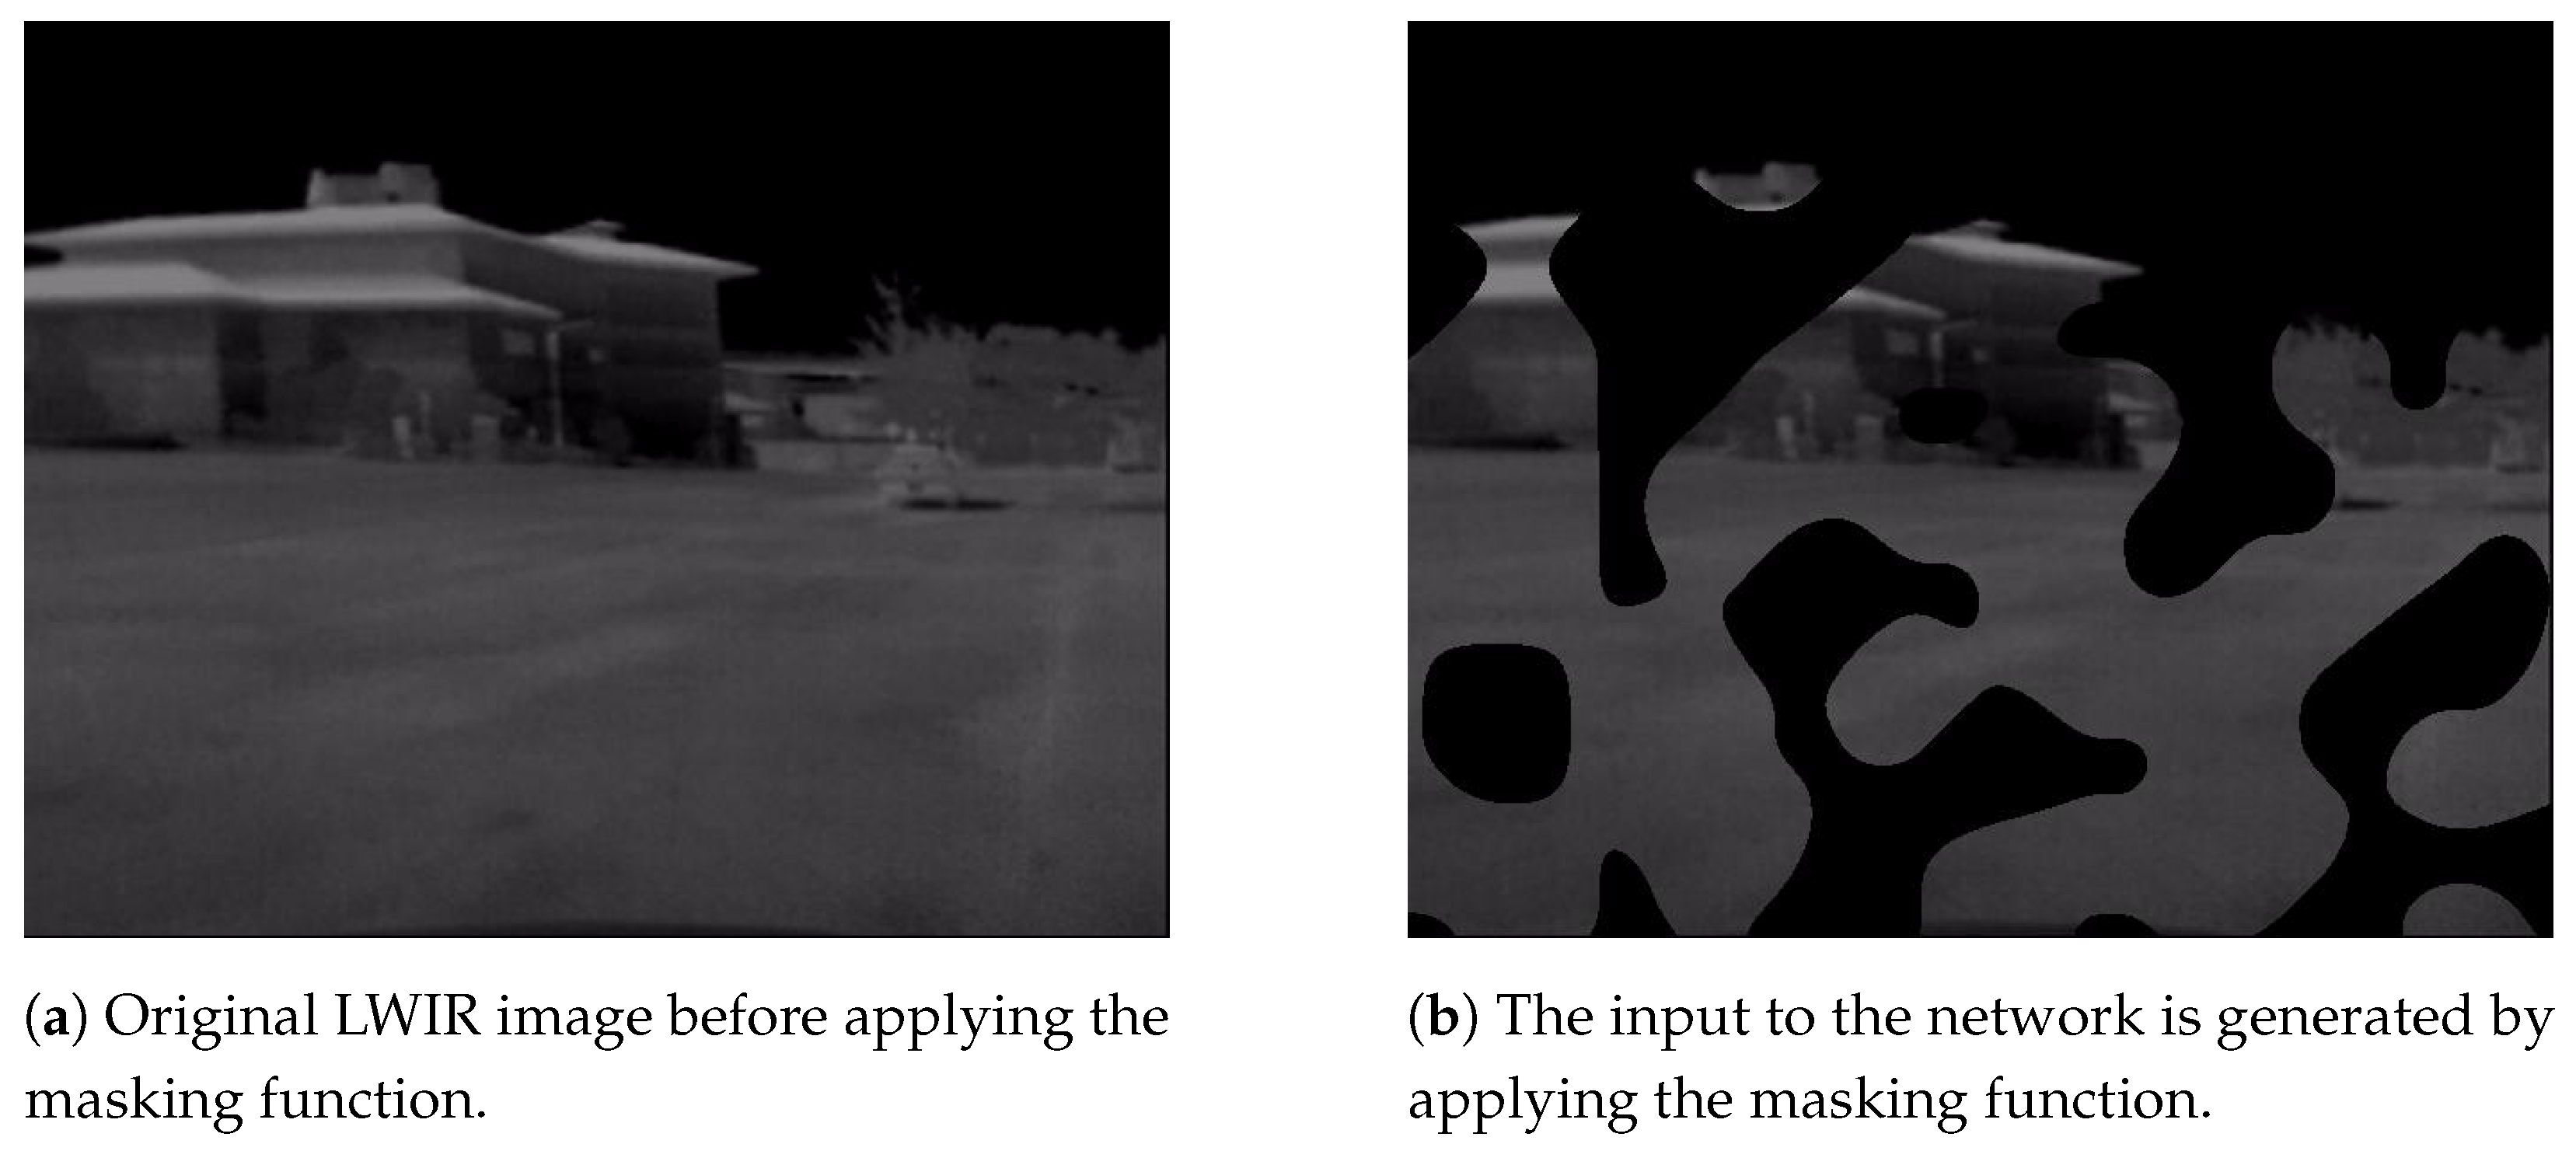
3.2.1. Mask Generation Using U-Net

A modified U-Net-based architecture for thermal images is trained for segmentation. The base architecture is a U-Net network. The difference is in the number of filters per layer and the optimizer function. Our variation of U-Net has significantly fewer filters and a total of 485 thousand trainable parameters compared to 40.4 million parameters in the standard U-Net. In addition, we noticed a significant increase in the performance when using root mean square propagation as the optimizer compared to the Adam optimizer. We attribute the enhanced performance to some characteristics of thermal images, such as having different noise characteristics and textures compared to RGB images. RMSprop can handle noisy gradients better as it adjusts the learning rate for each weight based on the recent history of the gradients. If a feature in the image produces a noisy gradient, then RMSprop can adaptively reduce the learning rate for such features. In addition, RMSprop’s adaptive learning rate proves significantly more effective than a fixed rate. This flexibility allows it to navigate discrepancies in contrast arising from different sensors and ensures the model learns efficiently and generalizes well across diverse inputs. Moreover, some features in thermal images may be critical but less frequent than in regular RGB images because of the nature of heat signatures. RMSprop can handle the sparsity in essential features since it can adaptively tune the learning rates for these features based on their historical gradient values. Finally, there might be specific domain challenges when it comes to thermal images, such as handling absolute vs. relative temperature differences or the emissivity of a material. If the model struggles because of those challenges, the adaptive learning rate can improve the learning process.

3.2.2. Image Inpainting Using Pix2Pix

The generator in pix2pix is a U-Net-based architecture, an encoder–decoder with skip connections. The encoder progressively downsamples the input image, capturing contextual information, while the decoder upsamples the feature maps, reconstructing the image. The skip connections help preserve spatial information lost during downsampling, which is crucial for tasks like semantic segmentation.
The discriminator in pix2pix is a convolutional PatchGAN classifier. It operates on image patches, classifying each as real or fake. This design allows the discriminator to focus on high-frequency structures, effectively capturing texture and style discrepancies between generated and natural images. This local approach enables pix2pix to produce high-quality, detailed images by ensuring local realism without assessing the entire image simultaneously.
This architecture utilizes a conditional GAN framework. The generator is conditioned on an input image to produce a corresponding output image, and the discriminator is trained to distinguish between the real and generated (fake) image pairs. The training involves backpropagating the discriminator’s assessment to improve the generator iteratively.
The data are formatted as pairs of images and labels, where images result from the segmentation model and the label is the ground truth. The input data are generated by applying a mask to the ground truth. We apply a random mask, resembling a cloud formation, to obtain images with cropped-out regions similar to the image segmentation outputs. Figure 2 demonstrates the pair formation of the network.
Figure 2. The data used in training the generative model.
The masking function, as proposed, is a computational procedure designed to apply a selective masking technique to a given image. It accepts three parameters: an image, which is the input image to be processed; a scale factor, which modulates the granularity of the generated noise pattern; and a sparsity factor, which is a control parameter determining the extent of masking applied to the image.
The scale factor parameter is instrumental in generating a cloud-like mask using Perlin noise, a technique commonly used in graphics for producing natural-appearing textures [34]. Adjusting this factor alters the scale of noise features, thereby influencing the texture of the resulting mask. A higher scale factor leads to larger, more pronounced features, whereas a lower value yields a finer, more detailed noise pattern.
On the other hand, the sparsity factor quantifies the proportion of the image to undergo the masking operation, with its values typically ranging between 0 and 1. This factor directly influences the threshold in converting the normalized noise mask into a binary deletion mask. The percentile of the noise distribution determines the threshold, corresponding to the sparsity factor multiplied by 100. Consequently, a larger sparsity factor results in a greater proportion of the image being masked, whereas a smaller value reduces the extent of masking.
In the final stage of the process, the binary deletion mask is applied to the original image. This operation effectively retains the pixel values from the original image where the deletion mask is 1 (i.e., above the threshold) and sets the pixel values to zero where the mask is 0 (below the threshold). The output is an image selectively masked according to the generated pattern, which can benefit applications such as data augmentation in machine learning, where varying input data can enhance model robustness [35].
Figure 3 represents the overall process for training Pix2Pix to inpaint the missing portions in the image.
Figure 3. Flow chart depicting the process we followed to train Pix2Pix inpainting model.

3.3. Training and Validation

The training was conducted in two stages: The first stage was training the U-Net model to segment clouds using the previously generated data, with the RMSprop as the optimizer, a learning rate of 0.001, weight decay of 0.0001, and binary cross entropy as the loss function. The second step is to simulate cropped regions as mentioned in Section 3.2.2. The model was initially trained on small deletion percentages, where only a tiny portion of the image was deleted. The deletion percentage gradually increased when performance reached a plateau. The deletion percentage ranges from 10% to 70%. The validation for both stages was conducted with data not from the training group.

3.4. Evaluation Metrics

In this section, we discuss the metrics utilized to evaluate the performance of segmentation and Generative Adversarial Network (GAN) models. These metrics are pivotal in assessing the accuracy and effectiveness of the proposed model to generate realistic images and how precisely segmented the occluded regions are.

3.4.1. Segmentation Evaluation Metrics

F1 Score
Evaluation metrics such as the F1 score [36] are commonly employed to assess classification performance, a harmonic mean of precision and recall. By striking a balance between precision (the ability to identify positives correctly) and recall (the avoidance of missing true positives), the F1 score provides a comprehensive understanding of model efficacy.
The equations for precision and recall are shown below:
P r e c i s i o n = T P T P + F P
R e c a l l = T P T P + F N
where TP denotes the actual positives that were predicted as positive points, and FP denotes the actual negatives that were predicted as positive points. FN denotes the actual positives that were predicted as negative points.
F 1 _ s c o r e = 2 P r e c i s i o n R e c a l l P r e c i s i o n + R e c a l l
Intersection over Union (IoU)
Intersection over union is an evaluation metric used to evaluate the tasks of object detection and image segmentation. IoU can determine an output image by measuring the similarity between the ground truth and the predicted region for an object in the image. The IoU is the ratio between the intersection between the predicted image and the ground truth, divided by their union. The IoU can also be represented using the following equation:
I o U = T P F P + T P + F N
The authors of [37] proposed directly optimizing IoU in the deep neural network for segmentation tasks, outperforming similar architectures that utilized the softmax loss function.

3.4.2. Inpainting Evaluation Metrics

Structural Similarity (SSIM)
The structural Similarity Index is commonly used to measure the similarity between two images. It is used as a metric to assess the quality of images in the context of compression, reconstruction, and denoising. The calculation of SSIM requires the original image and the reconstructed or denoised output image. SSIM considers the luminance, contrast, and structure in the comparison. SSIM is calculated as the following:
S S I M ( x , y ) = ( 2 μ x μ y + C 1 ) ( 2 σ x y + C 2 ) ( μ x 2 + μ y 2 + C 1 ) ( σ x 2 + σ y 2 + C 2 )
where:
  • x and y are the two images being compared.
  • μ x and μ y are the average pixel values of images x and y, respectively.
  • σ x and σ y are the standard deviations of pixel values of images x and y, respectively.
  • σ x y is the covariance of pixel values of images x and y.
  • C 1 and C 2 are constants used to stabilize the division with a weak denominator, defined as C 1 = ( k 1 L ) 2 and C 2 = ( k 2 L ) 2 , where L is the dynamic range of pixel values, which in our case is 2 7 , and k 1 = 0.01 and k 2 = 0.03 are default values.
SSIM values range from decimal −1 to 1, where 1 means identical image and lower SSIM means the data diverge from an identical set.
Peak Signal to Noise Ratio (PSNR)
Like SSIM, PSNR is a standard metric for evaluating image reconstruction quality in image compression applications. The formula for calculating PSNR is given as the following:
P S N R = 10 · log 10 M A X I 2 M S E
where:
  • M A X I is the maximum possible pixel value of the image. For instance, if the image has 8 bits per pixel, M A X I is 255.
  • M S E stands for Mean Squared Error, which is calculated as:
M S E = 1 m n i = 0 m 1 j = 0 n 1 [ I ( i , j ) K ( i , j ) ] 2
where:
  • I ( i , j ) is the original image.
  • K ( i , j ) is the reconstructed (compressed or distorted) image.
  • m and n are the dimensions of the images (height and width).
Figure 4 shows a sample from the evaluation set for our approach. The input and reference image pairs were used to fine-tune the model on this data for one epoch since the data size is small. Using the metrics above, we used a reference image to compare against the inpainted image.
Figure 4. Sample from evaluation set where the camera is static and the source of the cloud is moving. (a) Is the reference image, and (b) is the input image.

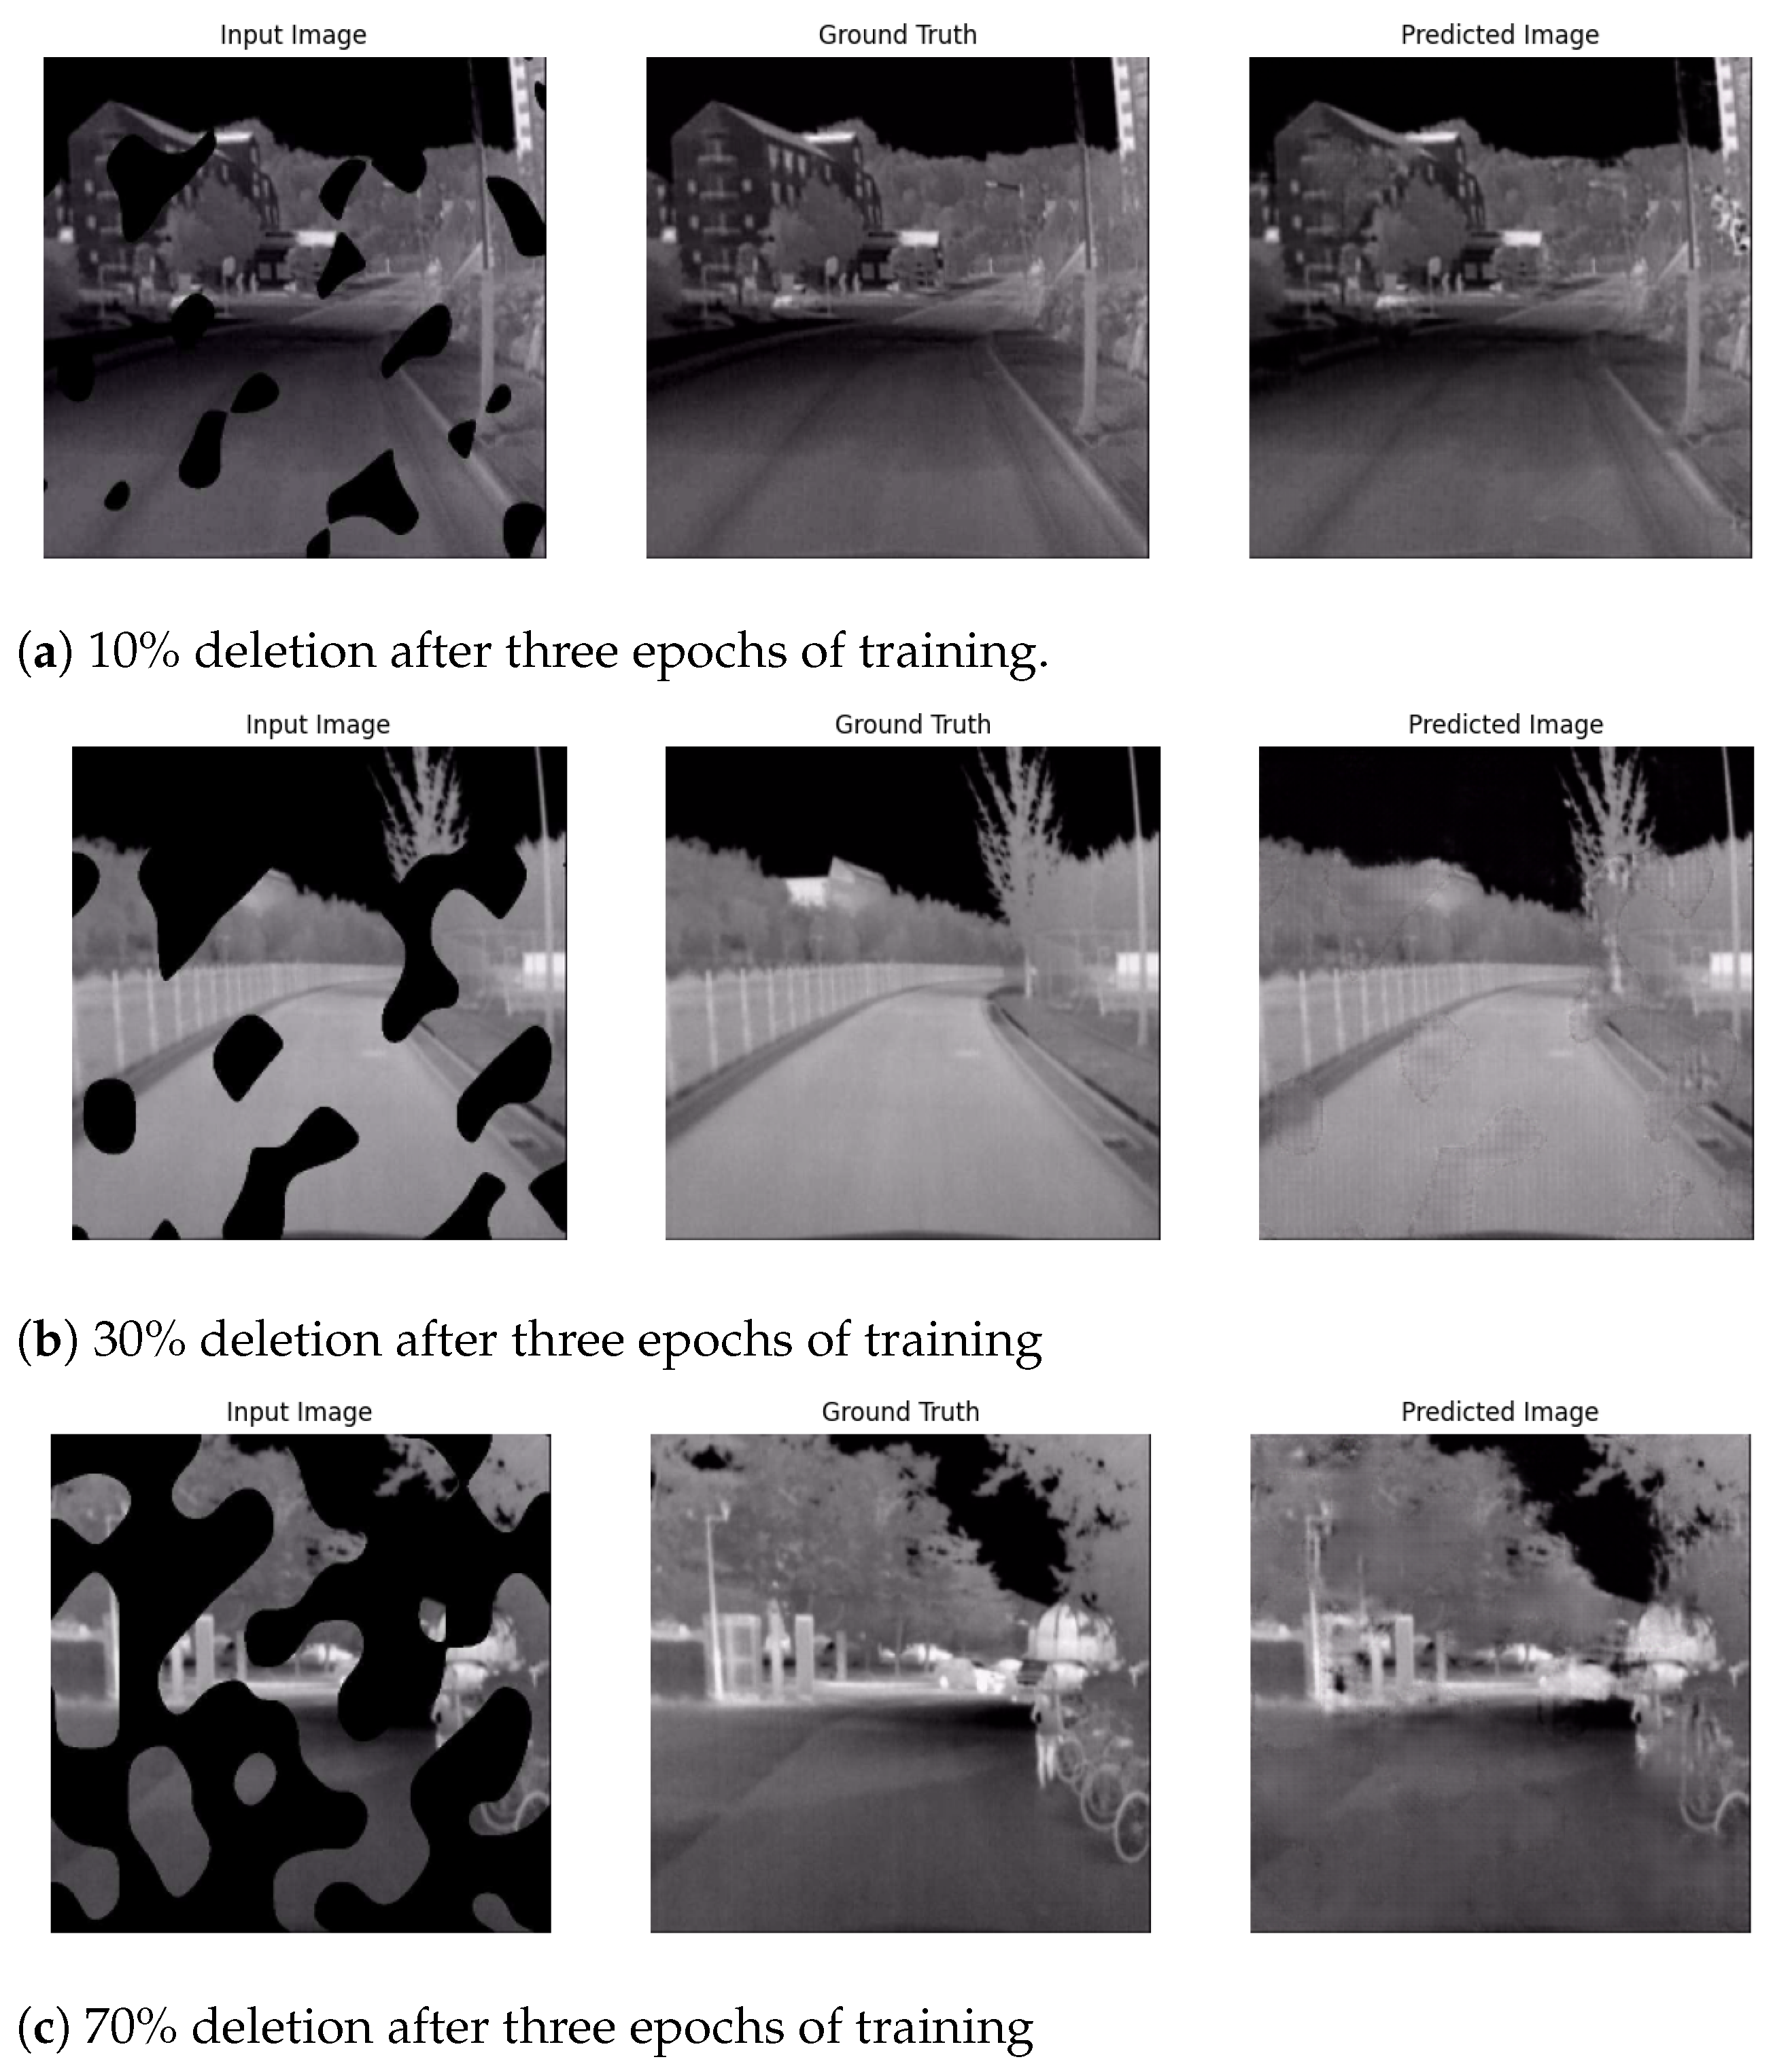
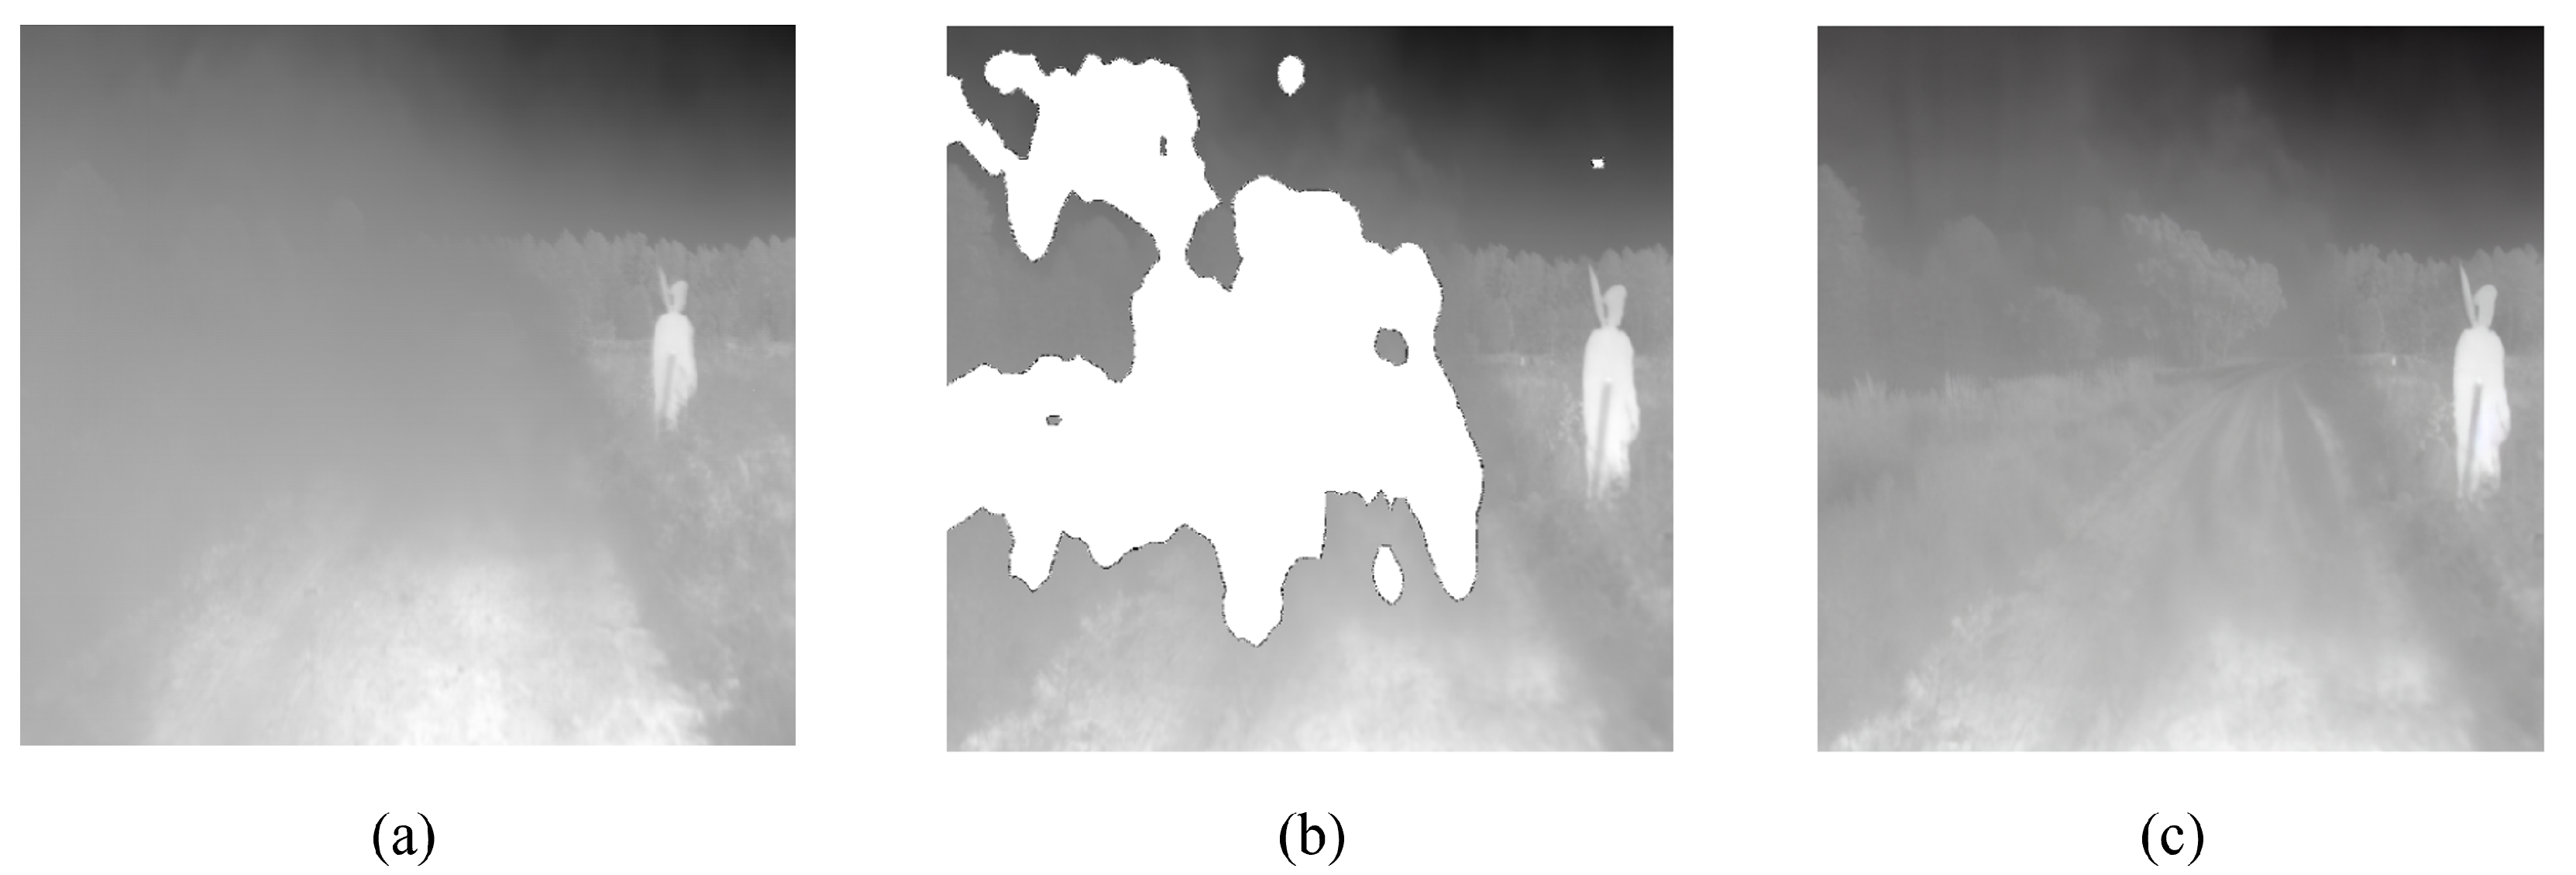
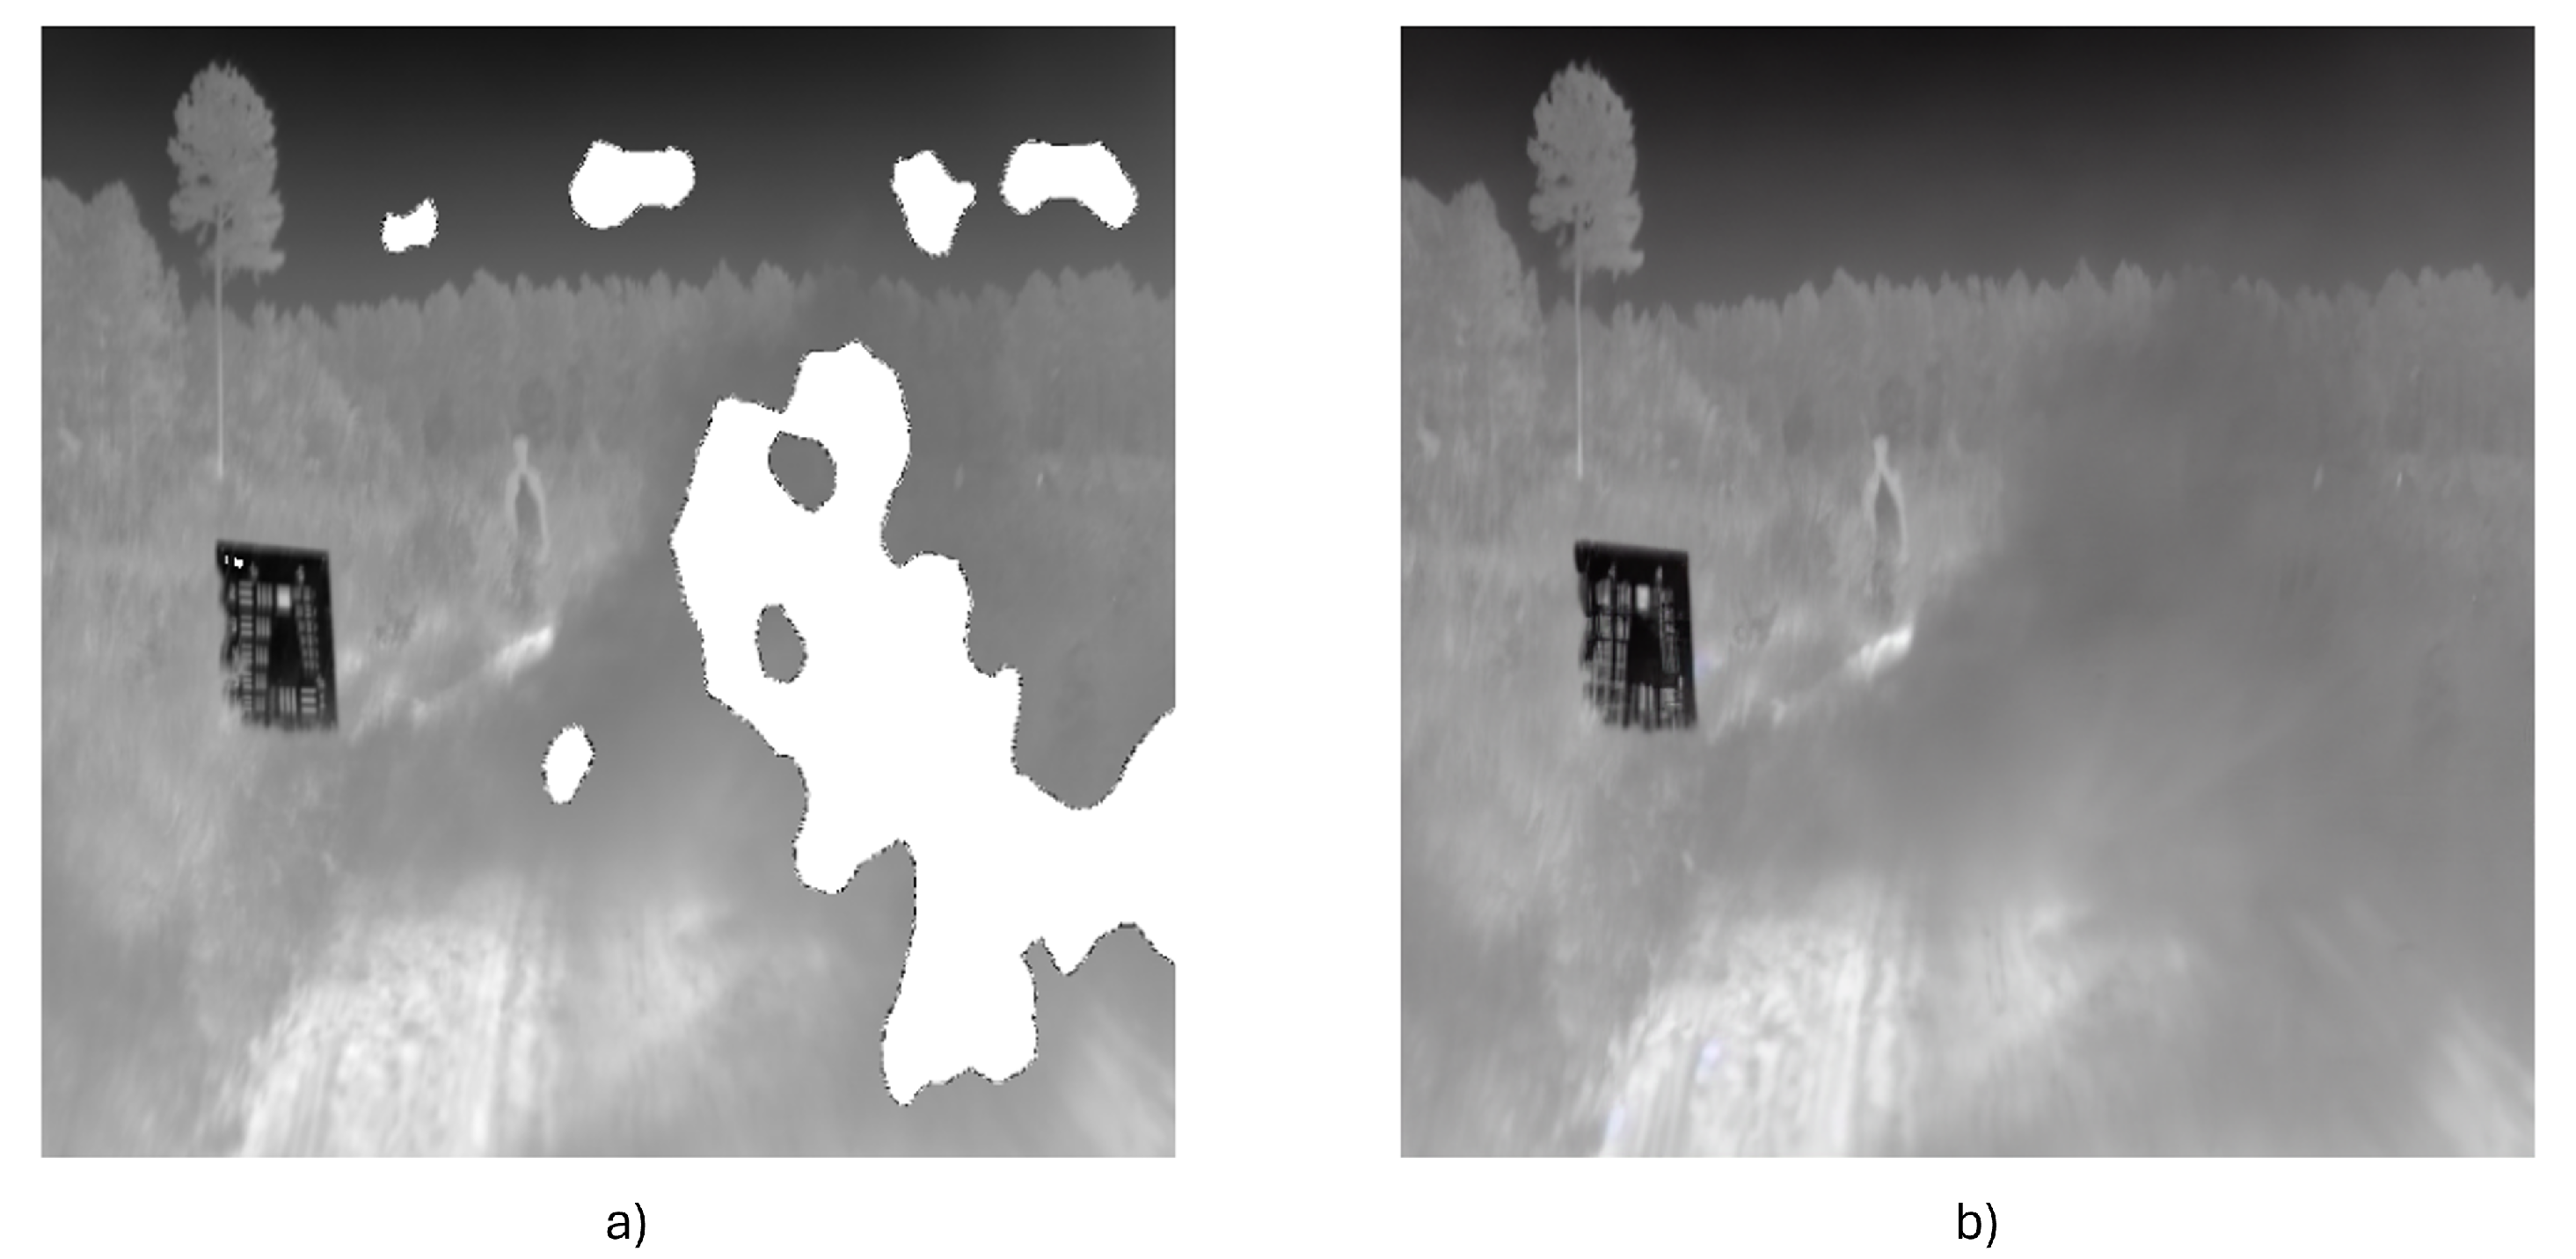
4. Experimental Results

This section comprehensively evaluates the segmentation and GAN models employed in this study. This evaluation is structured into distinct subsections encompassing qualitative and quantitative analyses. The ‘Qualitative Results’ and ‘Quantitative Results’ subsections provide an in-depth analysis of the models’ outputs from subjective and objective standpoints.

4.1. Qualitative

In this section, we visually inspect segmented images to corroborate these findings. The images reveal clear distinctions between occluded and non-occluded areas with minimal miss-classification. This level of segmentation accuracy is particularly noteworthy, considering the inherent challenges in thermal image processing. The results undeniably showcase the efficacy of our model in accurately segmenting obscured regions, which is a critical step towards effective inpainting and enhanced image clarity in thermal imaging applications.
Figure 5a shows a sample result of the segmentation model applied to new test data taken using a different camera and in a new environment. This is a demonstration of how generalized the model is. The predicted mask corresponds to the regions where the model cannot find pixels with meaningful information, which is the region blocked by the dust cloud, which is the reason the model tends to mistake the areas with uniform intensity as a cloud if the area of the uniform surface is vast. This deficiency is shown in Figure 5b; in the regions with light occlusion with the sky as the background, the model will still confuse that region for an occluded region. It is worth noting that this confusion mostly happens in corner cases and not in the middle of the frame. We can enhance the performance in this aspect by using a larger dataset and fine-tuning the model to fit a better and more generalized model.
Figure 5. Segmentation results for the model. (a) The model distinguished the slightly visible target in the forefront of the field, (b) regions where the slightly occluded regions were misclassified with uniform background.
Figure 6a–c shows the results from the model trained for three epochs for every masking level. Given the very short training period, the model showed promising results, even for substantial deleted portions.
Figure 6. Pix2Pix predictions using synthetically generated masks with varying mask area over the input image.
We used the inversion of the masks generated from the segmentation model similar to what was shown previously and fed them as input to the generator (Figure 7).
Figure 7. Pix2Pix inpainted results. (a) Original input image, (b) generated mask, and (c) inpainted output image.
As shown in Figure 7, the model can ‘see’ the edges of the dirt road and inpaint a more visible version of the road. As expected, the model fails to predict hidden objects behind the cloud without any visible information. Therefore, the resultant inpainted image does depict reality. In the future work section, we will discuss how to improve the overall performance of both models and the entire process.

4.2. Quantitative

In Table 1, we compare the results from performing cloud segmentation using the standalone reduced version of UNet with the results from using the base for the Pix2Pix generator. Predictably, the Pix2Pix generator base performance for segmentation is significantly better than the reduced version of UNet. This is due to the significant difference in the number of parameters between the two models. Pix2Pix has notably more layers, larger input sizes, and more parameters than the standalone architecture. The improved performance comes at the cost of runtime, where the reduced version takes approximately 25 ms for a single frame, and Pix2Pix takes six times as long. This is our motivation for training the reduced version for segmentation only.
Table 1. Comparison in segmentation performance for UNet and Pix2Pix-base.
In Table 2, we evaluate our approach in three stages: First, we evaluate Pix2Pix to inpaint images from the KAIST dataset with synthetic masks applied to the images. Then, we re-evaluate Pix2Pix to inpaint images from our dataset by applying random masks on clear images. Finally, we evaluate the performance when we use the same base to perform the segmentation and the inpainting. We evaluate BM3D and BM4D as a reference point of comparison.
Table 2. Table comparing the performance of our approach with common denoising and de-hazing algorithms. BM3D and BM4d are commonly used to denoise images using a stack of patches from the image and a temporal set of images. Dark Channel Prior is used to remove haze from RGB images. Transmission Map Refinement improves the estimation of the amount of light that reaches the camera without scattering, enhancing the visibility of objects in images.
We selected BM3D, BM4D, Atmospheric Light Estimation, and Transmission Map Refinement, as these are the most commonly used methods in dehazing and denoising applications. In our evaluation, the standalone Pix2Pix model achieved the highest PSNR performance on the KAIST dataset due to its specialization in inpainting tasks. However, its performance decreased when applied to our dataset in both cases: the random masks and the segmented occlusion. The decrease in performance is due to the segmentation side of the model not classifying all hazy pixels of the image as occluded. Therefore, the image will have some hazy parts, which will cause a drop in the generated image PSNR. Despite this drop, Pix2Pix still slightly outperformed our approach because our model is designed for segmentation and inpainting. This expected accuracy degradation in the generalized model is typical. The generalized model will experience a degradation in accuracy, as expected. Similar expectations are for the runtime of these models, as the larger models will take longer to run compared to smaller ones, given the same accuracy. As shown in Table 2, the performance of our method can be run on the edge while not compromising the quality of the results compared to other methods. This satisfies the initial assumption made in the early stages of the study. The approaches compared in the table are expected to show promising results when dealing with slight noise or small occlusions, where, as expected, the proposed approach exceeds all five methods in denoising and inpainting.
In our evaluation of the three-stage approach, as described in Table 2, we tested its performance on frames where the camera is static and the source of the dust cloud is moving. Our model showed decreased performance, compared to the model trained on KAIST, due to the higher resolution of the testing images, which were 1920 × 1200 , as opposed to the KIAST images of resolution 640 × 512 . Instead of downsizing the images by a factor of seven, we split the input images into 640 × 400 and resized the patches to 256 × 256 . We split the image into sections to maintain some finer spatial details, which can be useful in the recognition stage. Using the higher resolution, in this case, caused the decrease in PSNR since the model was trained on images with lower resolution.
When training Pix2Pix on our dataset, the performance decreased to 35.7 dB compared to its performance when trained on the KAIST dataset. This drop in performance was caused by the smaller size of the dataset used for training. Regardless of the deterioration in performance compared to Pix2Pix, our model shows significant advancements in the other classical approaches regarding accuracy and run time.

5. Discussions and Future Work

The model’s notable strength is its ability to effectively address occlusion challenges in a two-stage process. This ability provides a comprehensive solution for obscured regions within thermal images. The model showcases a nuanced understanding of complex scenes by systematically segmenting and then inpainting, contributing to more accurate and visually coherent results.
However, it is essential to acknowledge potential limitations. One possible limitation to consider is the computational scalability of the occlusion two-stage method. Scalability is crucial when dealing with large datasets or real-time applications. Assessing the model’s performance across varying scales and computational resources will provide insights into its practical applicability.
Another limitation we faced while evaluating the model, the occlusion two-stage method, is that it struggles with complex occlusions, such as large dense clouds, as shown in Figure 8; when large portions of the frame are occluded, it becomes crucial to explore enhancements. The method often fails in large occluded areas needing more spatial context, resorting to unreliable guesswork. To mitigate this, integrating diffusion models trained with weighted contextual inputs could offer a more robust framework, leveraging their proficiency in generating quality images from noisy data. Developing advanced context-aware algorithms that adjust the influence of surrounding pixels based on occlusion complexity and employing hybrid techniques combining traditional patch-based methods with generative models could significantly enhance performance. Expanding training datasets to include more complex occlusion scenarios and utilizing semantic segmentation to inform the inpainting process are also viable strategies. These enhancements are expected to improve inpainted areas’ structural and textural accuracy and extend the practical applicability of inpainting technologies in high-precision fields.
Figure 8. Example where the model fails when applied on dense clouds, and it generates results that resemble the input image where (a) is the input image and (b) is the prediction.
Adaptability is another critical aspect under discussion. While the occlusion two-stage method effectively addresses obscured regions, its adaptability to diverse thermal imaging scenarios and environmental conditions is essential. The discussions explore how well the model generalizes across different contexts and whether further adaptations or fine-tuning may be necessary for optimal performance in varied real-world scenarios. Furthermore, the evaluation extends to the real-world utility of the model. Beyond its performance in controlled environments, the discussions consider the feasibility of deploying the occlusion two-stage method in practical applications such as surveillance, security, and defense. Understanding its efficacy in real-world scenarios, including detecting obscured regions under dynamic and unpredictable conditions, adds a critical layer to the model’s overall assessment.
Another potential avenue of improvement is integrating the occlusion two-stage method with real-time surveillance systems. This extension could involve optimizing the model for swift deployment and efficient processing in dynamic surveillance environments. Exploring real-time applications would contribute to the model’s practical utility and open avenues for promptly addressing obscured regions in security and surveillance settings. Expanding the dataset to include a broader range of obscurants is another promising direction. Diversifying the dataset to encompass various atmospheric interference, such as smoke, fog, or haze, would enhance the model’s robustness and generalization capabilities. This expansion would provide a more comprehensive understanding of the model’s performance under diverse environmental conditions, contributing to its adaptability across a broader spectrum of real-world scenarios.

6. Conclusions

This paper introduces a novel way to address the challenges associated with occlusion inpainting in thermal imaging, a critical requirement in the surveillance, security, and defense domains. Our approach integrates advanced Generative Adversarial Network (GAN) techniques, specifically architectures similar to Pix2Pix and UNet, to segment and enhance obscured areas in thermal images. Our method outperforms traditional approaches that struggle under atmospheric interference. The innovative use of patch-wise segmentation and inpainting techniques through deep learning enables more accurate and efficient image restoration. Based on our quantitative analysis, we have found that our combined architecture outperforms individual Pix2Pix and UNet models in terms of both accuracy and processing speed. This research presents a reliable solution to address obscured regions in thermal images, thereby paving the way for future advancements in image analysis. The potential implications of this work extend beyond immediate applications, suggesting a broader scope for deploying advanced deep-learning techniques in image processing. Ultimately, this study contributes significantly to the evolution of thermal imaging technology, marking a substantial step forward in enhancing security and surveillance capabilities.

Author Contributions

Conceptualization, M.A. and I.A.; methodology, M.A.; software, M.A.; validation, M.A., M.Y. and A.L.R.; formal analysis, I.A.; investigation, M.A.; resources, A.L.R.; data curation, M.A.; writing—original draft preparation, M.A.; writing—review and editing, M.A.; visualization, M.A.; supervision, A.L.R.; project administration, A.L.R.; funding acquisition, M.A. All authors have read and agreed to the published version of the manuscript.

Funding

This research received no external funding.

Institutional Review Board Statement

Not applicable.

Data Availability Statement

Data is unavailable due to privacy or ethical restrictions.

Conflicts of Interest

The authors declare no conflict of interest.

References

  1. Liu, X.; Zhou, Y.; Zhang, Y.; Zhang, L. Thermal image enhancement in foggy scenes. J. Vis. Commun. Image Represent. 2018, 68, 33–44. [Google Scholar]
  2. Ma, J.; Chen, Y.; Liu, Y. An efficient algorithm for thermal image restoration in foggy weather. J. Vis. Commun. Image Represent. 2014, 29, 356–364. [Google Scholar]
  3. Wang, Z.; Han, Z.; Fan, J.; Zhang, L. An improved thermal image dehazing method based on guided filtering. Infrared Phys. Technol. 2017, 89, 39–46. [Google Scholar]
  4. Long, J.; Shelhamer, E.; Darrell, T. Fully Convolutional Networks for Semantic Segmentation. In Proceedings of the IEEE Conference on Computer Vision and Pattern Recognition, Boston, MA, USA, 7–12 June 2015. [Google Scholar]
  5. Ronneberger, O.; Fischer, P.; Brox, T. U-Net: Convolutional Networks for Biomedical Image Segmentation. In Proceedings of the Medical Image Computing and Computer-Assisted Intervention—MICCAI 2015: 18th International Conference, Munich, Germany, 5–9 October 2015. [Google Scholar]
  6. Badrinarayanan, V.; Kendall, A.; Cipolla, R. SegNet: A Deep Convolutional Encoder-Decoder Architecture for Image Segmentation. IEEE Trans. Pattern Anal. Mach. Intell. 2017, 39, 2481–2495. [Google Scholar] [CrossRef]
  7. Oktay, O.; Schlemper, J.; Folgoc, L.L.; Lee, M.C.; Heinrich, M.; Misawa, K.; Mori, K.; McDonagh, S.; Hammerla, N.Y.; Kainz, B.; et al. Attention U-Net: Learning Where to Look for the Pancreas. arXiv 2018, arXiv:1804.03999. [Google Scholar]
  8. Yang, M.; Yu, K.; Zhang, C.; Li, Z.; Yang, K. DenseASPP for Semantic Segmentation in Street Scenes. In Proceedings of the IEEE Conference on Computer Vision and Pattern Recognition, Salt Lake City, UT, USA, 18–23 June 2018. [Google Scholar]
  9. Chen, L.C.; Zhu, Y.; Papandreou, G.; Schroff, F.; Adam, H. Encoder-Decoder with Atrous Separable Convolution for Semantic Image Segmentation. In Proceedings of the European Conference on Computer Vision, Munich, Germany, 8–14 September 2018. [Google Scholar]
  10. Wang, K.; Liew, J.H.; Zou, Y.; Zhou, D. PANet: Few-Shot Image Semantic Segmentation with Prototype Alignment. In Proceedings of the IEEE International Conference on Computer Vision, Seoul, Republic of Korea, 27 October–2 November 2019. [Google Scholar]
  11. Nandhakumar, N.; Aggarwal, J.K. Integrated analysis of thermal and visual images for scene interpretation. IEEE Trans. Pattern Anal. Mach. Intell. 1988, 10, 469–481. [Google Scholar] [CrossRef]
  12. Almadani, I.; Abuhussein, M.; Robinson, A.L. Sow Localization in Thermal Images Using Gabor Filters. In Proceedings of the FICC2022, San Francisco, CA, USA, 3–4 March 2021. [Google Scholar]
  13. Hung, W.C.; Tsai, Y.H.; Liou, Y.T.; Lin, Y.Y.; Yang, M.H. Adversarial learning for semi-supervised semantic segmentation. arXiv 2018, arXiv:1802.07934. [Google Scholar]
  14. Niu, R.; Sun, X.; Tian, Y.; Diao, W.; Chen, K.; Fu, K. Hybrid multiple attention network for semantic segmentation in aerial images. IEEE Trans. Geosci. Remote Sens. 2021, 60, 1–18. [Google Scholar]
  15. Zhang, B.; Tian, Z.; Tang, Q.; Chu, X.; Wei, X.; Shen, C.; Liu, Y. SegViT: Semantic Segmentation with Plain Vision Transformers. Comput. Vis. Pattern Recognit. 2022, 35, 4971–4982. [Google Scholar]
  16. Xie, E.; Sun, K.; Song, X.; Wang, R.; Li, Z.; Song, S.; Luo, P. SegFormer: Simple and Efficient Design for Semantic Segmentation with Transformers. Adv. Neural Inf. Process. Syst. 2021, 34, 12077–12090. [Google Scholar]
  17. Kirillov, A.; Wu, Y.; He, K.; Girshick, R. PointRend: Image Segmentation as Rendering. In Proceedings of the CVPR, Seattle, WA, USA, 13–19 June 2020. [Google Scholar]
  18. Zhang, H.; Li, C.; Liu, Y.; Ji, R. CascadePSP: A Cascade of Global-Local-Global Pathways for Semantic Segmentation. In Proceedings of the AAAI, Online, 2–9 February 2021. [Google Scholar]
  19. Chen, Z.; He, T.; Zhang, X. Swin-Unet: Unet-like Pure Transformer Architecture for Medical Image Segmentation; Springer: Berlin/Heidelberg, Germany, 2022. [Google Scholar]
  20. Barnes, C.; Shechtman, E.; Finkelstein, A.; Goldman, D.B. Patch-Based Synthesis Method for Image Inpainting. ACM Trans. Graph. (Tog) 2009, 13, 1–48. [Google Scholar] [CrossRef]
  21. Bertalmío, M.; Sapiro, G.; Caselles, V.; Ballester, C. Image Inpainting. In Proceedings of the 27th Annual Conference on Computer Graphics and Interactive Techniques, New Orleans, LA, USA, 23–28 July 2000. [Google Scholar]
  22. Wang, J.; Agrawal, A.; Chen, M.; Konolige, K. Scale-Invariant Feature Transform for Image Inpainting. In Proceedings of the IEEE International Conference on Computer Vision, Kyoto, Japan, 29 September–2 October 2009. [Google Scholar]
  23. Pathak, D.; Krahenbuhl, P.; Donahue, J.; Darrell, T.; Efros, A.A. Context Encoders: Feature Learning by Inpainting. In Proceedings of the IEEE Conference on Computer Vision and Pattern Recognition, Las Vegas, NV, USA, 27–30 June 2016. [Google Scholar]
  24. Yu, J.; Lin, Z.; Yang, J.; Shen, X.; Lu, X.; Huang, T.S. Generative Image Inpainting with Contextual Attention. In Proceedings of the IEEE Conference on Computer Vision and Pattern Recognition, Salt Lake City, UT, USA, 18–23 June 2018. [Google Scholar]
  25. Iizuka, S.; Simo-Serra, E.; Ishikawa, H. Image Inpainting with Deep Generative Models. In Proceedings of the IEEE Conference on Computer Vision and Pattern Recognition, Las Vegas, NV, USA, 27–30 June 2016. [Google Scholar]
  26. Sauber-Cole, R.; Khoshgoftaar, T.M. The use of generative adversarial networks to alleviate class imbalance in tabular data: A survey. J. Big Data 2023, 9, 98. [Google Scholar]
  27. Blanchard, A.E.; Stanley, C.; Bhowmik, D. Using GANs with adaptive training data to search for new molecules. J. Cheminform. 2023, 13, 1–8. [Google Scholar]
  28. Havugimana, F.; Moinudin, K.A.; Yeasin, M. Deep Learning Framework for Modeling Cognitive Load from Small and Noisy EEG data. IEEE Trans. Cogn. Dev. Syst. 2023, 16, 1006–1015. [Google Scholar] [CrossRef]
  29. Isola, P.; Zhu, J.Y.; Zhou, T.; Efros, A.A. Image-to-image translation with conditional adversarial networks. In Proceedings of the IEEE Conference on Computer Vision and Pattern Recognition, Honolulu, HI, USA, 21–26 July 2017; pp. 1125–1134. [Google Scholar]
  30. Zhu, J.Y.; Park, T.; Isola, P.; Efros, A.A. Unpaired image-to-image translation using cycle-consistent adversarial networks. In Proceedings of the IEEE International Conference on Computer Vision, Venice, Italy, 22–29 October 2017; pp. 2223–2232. [Google Scholar]
  31. Wang, T.C.; Liu, M.Y.; Zhu, J.Y.; Tao, A.; Kautz, J.; Catanzaro, B. High-Resolution Image Synthesis and Semantic Manipulation with Conditional GANs. In Proceedings of the IEEE Conference on Computer Vision and Pattern Recognition, Salt Lake City, UT, USA, 18–23 June 2018. [Google Scholar]
  32. Abuhussein, M.; Robinson, A. Obscurant Segmentation in Long Wave Infrared Images Using GLCM Textures. J. Imaging 2022, 8, 266. [Google Scholar] [CrossRef] [PubMed]
  33. Choi, Y.; Kim, N.; Hwang, S.; Park, K.; Yoon, J.S.; An, K.; Kweon, I.S. KAIST multi-spectral day/night data set for autonomous and assisted driving. IEEE Trans. Intell. Transp. Syst. 2018, 19, 934–948. [Google Scholar] [CrossRef]
  34. Perlin, K. An image synthesizer. Siggraph Comput. Graph. 1985, 19, 287–296. [Google Scholar] [CrossRef]
  35. Shorten, C.; Khoshgoftaar, T.M. A survey on Image Data Augmentation for Deep Learning. J. Big Data 2019, 6, 1–48. [Google Scholar] [CrossRef]
  36. Chinchor, N. MUC-4 Evaluation Metrics. In Proceedings of the 4th Conference on Message Understanding, McLean, VA, USA, 16–18 June 1992; MUC4 ’92. pp. 22–29. [Google Scholar] [CrossRef]
  37. Rahman, M.A.; Wang, Y. Optimizing intersection-over-union in deep neural networks for image segmentation. In Proceedings of the International Symposium on Visual Computing, Las Vegas, NV, USA, 12–14 December 2016; Springer: Berlin/Heidelberg, Germany, 2016; pp. 234–244. [Google Scholar]
Disclaimer/Publisher’s Note: The statements, opinions and data contained in all publications are solely those of the individual author(s) and contributor(s) and not of MDPI and/or the editor(s). MDPI and/or the editor(s) disclaim responsibility for any injury to people or property resulting from any ideas, methods, instructions or products referred to in the content.

Article Metrics

Citations

Article Access Statistics

Multiple requests from the same IP address are counted as one view.