Abstract
In the controlled source radiomagnetotelluric (CSRMT) sounding method, a horizontal magnetic dipole, HMD (vertical loop) or a horizontal electric dipole, and HED (grounded line) are used as sources. When working with HMD, the source is usually tuned to resonance to increase the current in the loop. However, the disadvantage of this approach is the narrow frequency range realized in the CSRMT method (1–12 kHz) and the short operating distance from the source (600–800 m). The need to tune the source to resonance at each selected frequency reduces the efficiency of the survey. In the case of using HED for sounding, measurements are performed in a wider frequency range of 1 to 1000 kHz, and along with the signal of the base frequency, its subharmonics are measured. In this case, emitted signal measurements are possible at a distance of up to 3–4 km from the source. At the same time, the disadvantage of using HED is that it requires grounding, the arrangement of which requires additional time when working on frozen ground or dry stony soil. We consider the possibilities of generation and registration of signals of subharmonics of base frequencies when applying the CSRMT method with loop sources—HMD and VMD (horizontal loop). A matching unit (MU) based on a step-up transformer was developed, which increases the output voltage of the CSRMT transmitter. In a field test with base frequencies of 20, 40, and 80 kHz, the signal amplitudes increased by a factor of two to four for subharmonics at frequencies of 60–200 kHz and by up to 10–13 times for subharmonics at frequencies of 200–500 kHz due to transformation of signal spectrum provided by MU. The possibility of using odd subharmonics of base frequencies for inversion has been demonstrated in the results of field experiments with different sources (HED, HMD, and VMD). This expands the frequency range of the method when working with loop sources and increases the survey’s effectiveness. The use of loop sources in the CSRMT method is especially advantageous for winter work in Arctic regions.
1. Introduction
The radiomagnetotelluric (RMT) sounding method is based on the registration of signals from remote radio transmitters in the frequency range from 10 to 250–1000 kHz [1]. Electromagnetic fields of radio transmitters penetrate the conductive ground and induce electric currents, which, in turn, produce secondary electromagnetic fields that carry information about the distribution of electric properties with depth. On the ground surface, the sum of the initial and secondary fields is measured.
Values of the complex surface impedance (Z) are determined by measuring horizontal and mutually perpendicular components of the electric (Ex) and magnetic (Hy) fields:
Z = Ex/Hy.
Z is then transformed into the apparent resistivity
where ω = 2πf, f is the frequency in Hz, μ0 = 4π·10−7 H/m is the magnetic constant, and the impedance phase (phase difference between Ex and Hy components) is written as follows:
ρa = (1/ωμ0)·|Z|2,
φZ = φEx − φHy.
The sounding curves are frequency dependences of ρa and φZ; inversion of the latter yields the resistivity section at the observation point. At a distance of several kilometers from a radio transmitter, the measured impedance coincides with the impedance of the vertically incident plane wave, which depends only on the structure and properties of the underlying half-space. For the plane-wave model, interpretation methods have been developed in detail to ensure reliable sounding results [2,3].
A significant disadvantage of the RMT method is the limited number of radio transmitters whose signals can be recorded in remote areas. This limits the possibilities of the method. In addition, the lack of radio transmitters operating at frequencies below 10 kHz limits the depth of the study to 30–50 m. To overcome these problems, an additional (controlled) source of the electromagnetic field is used. M. Bastani developed the controlled source radiomagnetotelluric (CSRMT) method [4] using a horizontal magnetic dipole, HMD (vertical loop), as a source. By expanding the frequency range of the Enviro-MT equipment down to 1 kHz, the investigation depth of the method was increased to 100–150 m. Experience has been gained in the application of the CSRMT method with the HMD source for solving various problems such as geological mapping [5], searching for ore [6] and groundwater resources [7,8], and studying landslides [9]. Offshore test measurements in summer and winter conditions have been performed [10,11,12].
Working with HMD sources has a number of advantages: convenience of use due to the compactness and easy installation, simple implementation of tensor measurements with two mutually perpendicular HMDs, and absence of grounding. The disadvantage of this source, used in the Enviro-MT equipment with a low-power transmitter powered by car batteries, is a relatively short operation range (600–800 m), which requires moving the source frequently. The need to tune the source to resonance at each selected frequency in the Enviro-MT equipment reduces the speed of operation. In this case, the frequency range of the CSRMT method is limited to 1–12 kHz due to the influence of the complex input impedance of the load. The possibility of using subharmonics of base frequencies in the Enviro-MT equipment has not been previously studied.
St. Petersburg State University, Russia and the University of Cologne, Germany, jointly with small enterprises of St. Petersburg and with the Russian Institute for Powerful Radio Engineering, have developed the CSRMT equipment. It includes a five-channel recorder RMT-5 and a transmitter GTS-1 that allows the operation of the CSRMT method in an extended frequency range of 1 kHz–1 MHz [13]. The frequency range of the CSRMT equipment was extended by using as a source a transmitter line of several hundred meters long grounded at the ends. This source has a wider working area than an HMD source, and measurements are possible at a distance of up to 3–4 km. An increase in the source moment and operating distance is achieved by increasing the cable length and the current. The capabilities of HMD in this regard are limited because operation with a large vertical loop is difficult. When using HED, the signals of the subharmonics are measured along with the signals of the base frequency, increasing the productivity of the survey. At the same time, the disadvantage of using HED is that it requires grounding, which is a time-consuming operation, especially when working on frozen ground or dry stony soil.
First, surveys using the CSRMT method with an HED source were carried out using the scalar variant. Significant experience has been gained in studying the construction routes of a gas pipeline and a railway [13,14], mapping faults [15], studying industrial waste landfills [16], and searching for kimberlite pipes [17].
In recent years, the tensor variant of the CSRMT method, using two mutually perpendicular HEDs as electromagnetic field sources, has been developed jointly by the University of Cologne and St. Petersburg State University. New possibilities of the tensor technology have been demonstrated in studies of rock anisotropy [18,19,20] and of objects in permafrost areas [21,22]. To implement the tensor variant with two HED sources, approaches have been developed to create a rotating electromagnetic field [23]. Along with the soundings in the far-field zone, the techniques and software tools were elaborated to use the HED source in the transition zone. Examples of the bimodal inversion of field data using the tensor variant of the CSRMT method in the transition zone have been reported in articles [19,24].
Measurements of the three components of the magnetic field in the CSRMT survey implement the determination of a tipper. The secondary vertical magnetic field originates from lateral inhomogeneities of the conductivity; therefore, the tipper can be used in the study of two-dimensional and three-dimensional structures [2,25], extending the possibilities of the CSRMT method.
In addition to using HMD and HED, electromagnetic soundings with a vertical magnetic dipole (VMD) are also realized in near-surface studies [26,27,28,29]. This source can also be applied in the CSRMT method. An advantage of VMD (horizontal loop) is the possibility of carrying out winter work on snow and ice without groundings. Unlike HMD, there are no restrictions for VMD in increasing the size of the loop, which makes it possible to increase its operating distance. However, one should keep in mind that in the far field zone of VMD, the horizontal components of the electric and magnetic fields decrease in proportion to the fourth power of the distance and the vertical component of the magnetic field to the fifth power of the distance [30]. For HED and HMD, the components of the electric and magnetic fields decrease more slowly. The horizontal components are proportional to the third power of the distance, and the vertical component of the magnetic field to the fourth power of the distance [26]. Additionally, it is impossible to implement tensor measurements with VMD.
Each type of source (HED, HMD, VMD) has its own advantages and disadvantages. In the field of HED, both galvanic and inductive components are non-zero, and the data obtained contain information about both high-resistive and conductive objects. Induction sources (HMD, VMD) are less sensitive to high-resistive objects since they have only the eddy field component [31]. The use of sources of different types can be useful for increasing the reliability of the obtained resistivity models as well as for estimating the anisotropy of resistivity. The results of studies of rock anisotropy using the CSRMT method with HED were considered in our previous papers [18,19,20,32].
Because using loop sources that do not require grounding is promising in the winter work, especially in Arctic regions, we upgraded the GTS-1 transmitter and performed a number of field experiments to study the possibility of measuring signals of base frequency subharmonics when operating with HMD and VMD. The use of subharmonics makes it possible to extend the operating frequency range and increase the effectiveness of surveying with loop sources.
This article analyzes the results of experiments in comparison with the measurements using HED, which we traditionally employ as part of the CSRMT equipment. To check the possibilities of using subharmonic signals of loop sources, the results of the inversion of sounding curves obtained with various sources (HMD, VMD, and HED) are presented.
2. Field Tests of Different Sources
In the experiments, we used a GTS-1 transmitter, operating in a wide frequency range and providing output power of up to 1 kW [13]. Ensuring stable tuning of the output circuit to resonance for each selected frequency in a wide frequency range, from kHz to hundreds of kHz, presents a rather difficult task. Field surveys performed in this mode would take too long a time, so a different approach has been chosen. It is based on the use of a matching unit (MU) with a transformer that increases the maximal output voltage of the GTS-1 transmitter from 200–288 V to 560–700 V. The schematic diagram of the MU is shown in Figure 1.
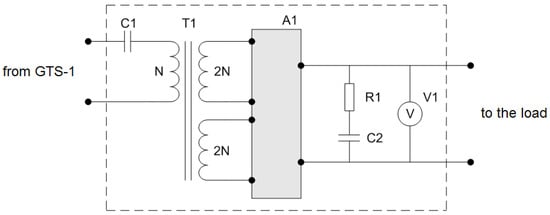
Figure 1.
The schematic diagram of the matching unit with a step-up transformer. C1—blocking capacitor, T1—transformer, A1—winding switching device, R1-C2—low-pass filter, V1—output voltmeter. N is the number of turns in the input winding (N = 20).
The voltage gain (G) is equal to 4 with a series connection of the output windings of the transformer T1; with a parallel connection of the output windings, G is equal to 2. Experiments with a step-up transformer were carried out at four frequencies in the frequency range of 10–80 kHz. The MU test showed that at frequencies of 10 and 20 kHz, it is more optimal to use G = 2, whereas at frequencies of 40 and 80 kHz: G = 4.
Field tests with MU were carried out in two stages. In the first stage, the possibility of increasing the output voltage in the frequency range of 10–80 kHz was tested with a loop source as a load. In this case, a vertical 5-turn pentagonal loop (Figure 2) with an equivalent area of 148.5 m2 was used, approximating an HMD. The loop inductance was 1.6 mH, and the DC resistance was 2.1 Ω. Since the GTS-1 transmitter is designed to operate with high load resistance values (tens of Ω), a ballast resistance of 23 Ω was included in the circuit to prevent the transmitter overload. Measurements of the input impedance spectrum of the loop were carried out, and the values of the absolute impedance value proved to be quite high in the operating frequency range, about 20 Ω at a frequency of 10 kHz and about 120 Ω at a frequency of 80 kHz (Figure 3). This means that, in principle, it is possible to operate without ballast resistance.

Figure 2.
(a) sketch of a pentagonal loop used for realizing HMD; (b) view of the HMD layout during the field experiment. The loop is highlighted with a black dashed line.
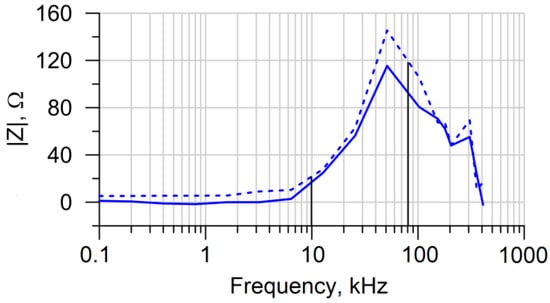
Figure 3.
Frequency dependence of the modulus of the input impedance of the used vertical loop, measured at two sites with different resistivity of the ground (solid line: about 1000 Ω∙m and dashed line: about 100 Ω∙m). The boundary operating frequencies 10 and 80 kHz are marked with black vertical lines.
The results of testing a loop source with MU are shown in Table 1. At a frequency of 10 kHz, the use of the MU did not significantly increase the output voltage. However, at this frequency, the transmitter provides a sufficiently large current of 5.9 A even without MU. The same results were obtained at lower frequencies, in the range of 1–10 kHz. Therefore, it is possible to work with the GTS-1 transmitter without MU at frequencies from 1 to 10–15 kHz, as the transmitter is in the optimal mode and does not require matching with a used loop source.

Table 1.
Loop source test results. f: the operating frequency of the transmitter; UN: the nominal voltage of the GTS-1 transmitter; UT, IT: the voltage and the current at the transmitter output without using MU; G: the transformer gain; UT (MU): the voltage at the transmitter output when MU is connected; UMU: the voltage at the output of MU; Kef: the effective voltage increase factor when MU is connected, Kef = UMU/UT; IMU: the estimated value of the current in the loop, calculated by dividing UMU by the absolute value of the loop impedance at the frequency used.
For higher frequencies, the use of MU is necessary. The effective voltage increases by a factor of about 2 at 20 kHz and by about 3 at 40 and 80 kHz. The output voltage of the transmitter is increased from 200–288 V to 560–700 V. MU ensures a sufficiently large current in a loop at high frequencies, 6.8 A at 20 kHz and 4.3 A at 80 kHz.
In the second stage, the electromagnetic fields of HMD (vertical loop) and HED (grounded line) were measured at a distance of 100 m from the sources to assess the possibility of recording signals of subharmonics of the base frequency. Taking into account the results obtained at the first stage, the frequencies of 20, 40, and 80 kHz were chosen for measurements. The measurement point was located broadside of the HMD and in line with the HED (Figure 4). With this orientation of the moments of the sources, their fields are equivalent.
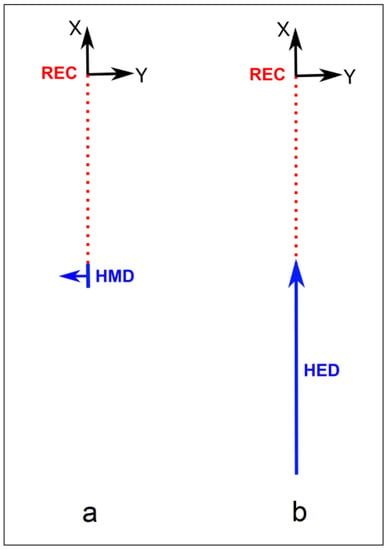
Figure 4.
Measurement schemes: (a) with a horizontal magnetic dipole (HMD); (b) with a horizontal electric dipole (HED). The source moments are marked with blue arrows. The measurement point marked with the REC symbol is at a distance of about 100 m (the directions of the coordinate axes are also indicated).
Measurements with each source were performed sequentially: (1) without the use of MU; (2) with the use of MU adjusted according to the test results obtained at the first stage. The measurements have demonstrated that the use of MU significantly increases the HMD field components at frequencies of 20, 40, and 80 kHz and their subharmonics. For the chosen direction of the HMD moment and the position of the measurement point, the components Ex of the electric field and Hy of the magnetic field have maximal amplitudes, and their behavior is similar. The autospectra of the Hy component, measured when GTS-1 operated together with MU at the three frequencies indicated above, are shown in Figure 5a–c. The upper parts of the figures show plots of the mutual coherence of the Ex and Hy components.
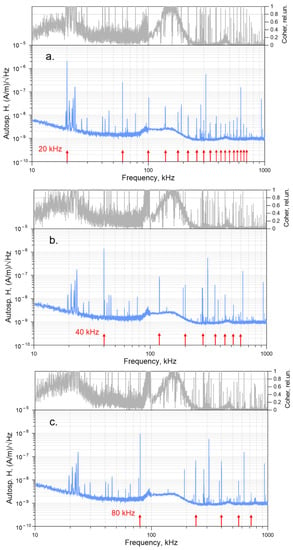
Figure 5.
Autospectra of the Hy component of HMD electromagnetic field and the coherence plots for base excitation frequencies of 20 kHz (a), 40 kHz (b), and 80 kHz (c). Subharmonics for which the coherence exceeds 0.8 (grey horizontal line) are denoted with red arrows.
The signals of the base frequencies 20, 40, and 80 kHz and their odd subharmonics can be seen in the spectra. They also contain signals from remote radio transmitters. Note that the odd subharmonics of the base frequencies, indicated with red arrows, significantly exceed the noise level. Their coherence is quite high (above 0.8) up to 600–700 kHz. These signals can be used for the deriving of the sounding curves and the subsequent inversion.
The amplitudes of the HMD signals for the base frequencies of 20, 40, and 80 kHz and their odd subharmonics measured at a distance of 100 m with and without using MU, as well as normalized signals, are shown in Figure 6. When using MU, the signal amplitudes are increased by two to four times for subharmonics at low frequencies (60–200 kHz) and up to 10–13 times for subharmonics at higher frequencies (200–500 kHz). However, the subharmonics amplitudes are decreased at higher frequencies in the 600–1000 kHz range. The values of the amplification factor (AF) of the Ex and Hy components at different odd subharmonics of the base frequencies of 20, 40, and 80 kHz are given in Table 2. AF is defined as the ratio of the signal measured with the use of MU, normalized to the signal measured without using MU.
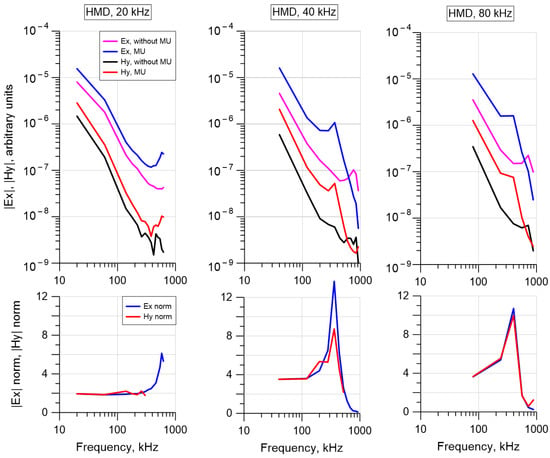
Figure 6.
Top row—the spectra of the HMD electromagnetic field components at three frequencies (arbitrary units). G = 2 for 20 kHz, G = 4 for 40 and 80 kHz. Bottom row: the spectra measured with the use of MU, normalized to the spectra without using MU.

Table 2.
Values of AF for sub-harmonics of base frequencies 20, 40 and 80 kHz.
The possibility of working with a loop source at low frequencies without using a MU is illustrated in Figure 7. It is seen that the amplitude of odd subharmonics of the signal with the base frequency of 0.5 kHz measured at the same distance of 100 m exceeds the noise level more than one order of magnitude, and the coherence of the Ex and Hy components of subharmonics is close to one in the frequency range 1–10 kHz.
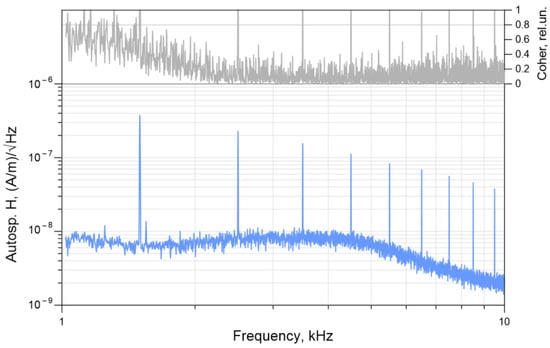
Figure 7.
Autospectrum of the Hy component of the HMD electromagnetic field and the coherence plot for the base excitation frequency of 0.5 kHz obtained without MU in the range 1–10 kHz. The coherence exceeds 0.8 (grey horizontal line) for all odd subharmonics (starting from the 3rd: 1.5 kHz).
The developed MU was also used to test the operation of HED (grounded transmitter line). The maximal voltage at the output of MU was 650 V in this case. The autospectra of the Hy component measured with switched-on MU (G = 2) at three frequencies of 20, 40, and 80 kHz are shown in Figure 8. In the upper parts of the figures, plots of the mutual coherence of the Ex and Hy signals are shown. When using HED, the coherence of all odd subharmonics in the frequency range up to 1000 kHz exceeded the threshold level of 0.8.
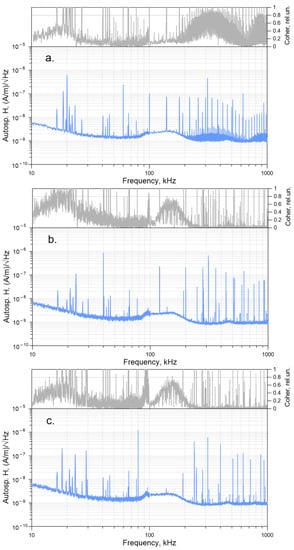
Figure 8.
Autospectra of the Hy component of HED electromagnetic field and the coherence plots for base excitation frequencies of 20 kHz (a), 40 kHz (b) and 80 kHz (c).
The amplitudes of the HED signals for the base frequencies of 20, 40, and 80 kHz and their odd subharmonics without MU and with MU switched on, as well as normalized signals at Us = 288 V and G = 2, are shown in Figure 9. The measurement results show that the use of MU with HED provides an increase in the amplitudes of the base frequency subharmonics in accordance with the used gain in the entire operating frequency range.
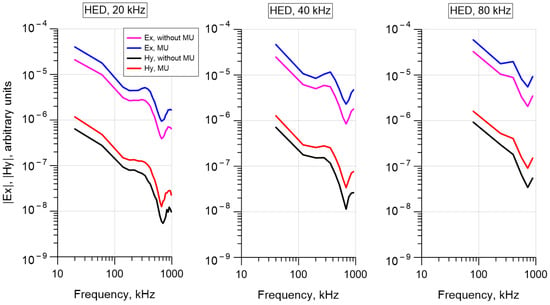
Figure 9.
The spectra of the HED electromagnetic field components at three frequencies (arbitrary units). G = 2 for all frequencies.
3. Comparison of Sounding Results with Different Sources
The next test of using subharmonics of the base frequencies for sounding with all considered sources was carried out at the Yablonovka geophysical test site on the Karelian Isthmus, Leningrad Region. The geological section in the depth range from 40–60 m down to 200 m is represented by Vendian mudstones and sandstones and Riphean carbonate-terrigenous rocks. They are overlaid by Quaternary sediments with a thickness of several tens of meters [33]. The rather heterogeneous structure of the Quaternary sediments with the presence of gravel-pebble layers having an increased resistivity was revealed in this area based on the results of previous work by the CSRMT method.
The field experiment at the test site included measurements with the HED along with the use of HMD and VMD. Since only scalar measurements are possible with VMD, the surveys with HMD and HED were also performed in the scalar mode in order to compare the results obtained with different sources. In this case, the moments of HED (grounded line) and HMD (vertical loop) were directed mutually perpendicular to obtain the same polarization of their electromagnetic fields.
Figure 10 shows the positions of the sources and the observation profile Pr-2. The length of the transmitter line (HED) was 640 m. The length of the side of the single-turn square horizontal loop (VMD) was 125 m. The geometry of the vertical loop (HMD) is shown above in Figure 2a. The distance between the sounding stations along Pr-2 was 20 m.
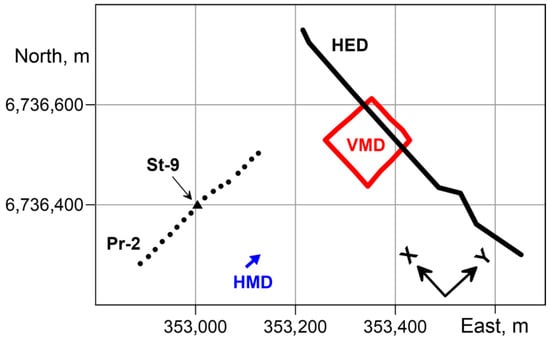
Figure 10.
Location of sources, observation profile Pr-2, and measurement station St-9 at the Yablonovka test site. Labels in the axes are coordinates in the UTM projection.
Examples of sounding curves obtained with different sources at one of the profile stations (St-9) are shown in Figure 11. Signals of base frequencies of 0.5, 5, and 50 kHz and their odd subharmonics were used for drawing the curves. The apparent resistivity curves agree well with each other. The phase curves diverge at low frequencies, which is due to different boundaries of the transition zone for the considered sources.
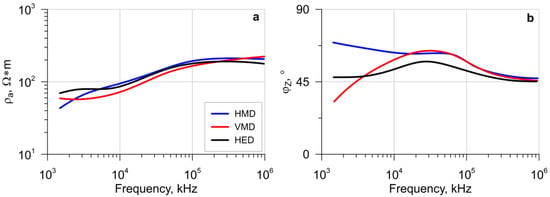
Figure 11.
Sounding curves obtained with different sources at the station St-9. (a) apparent resistivity, (b) impedance phase.
Figure 12 and Figure 13 show the results of 1D and 2D inversions of sounding data with different sources. One-dimensional inversion of sounding curves has been performed for each type of source using CS1D software, taking into account the influence of the transition zone [32]. In each case, the start model was a homogeneous half-space with a resistivity of 150 Ω∙m. For the grounded transmitter line (HED) and the horizontal loop (VMD), their real size and shape were taken into account.
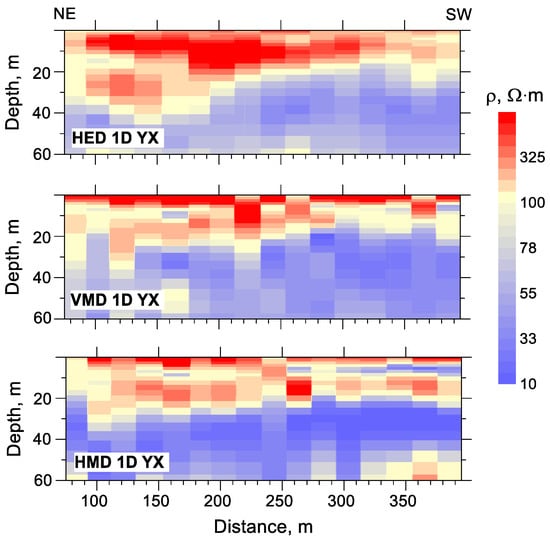
Figure 12.
The 1D CSRMT resistivity sections for Pr-2. The types of sources are indicated in the respective plots.
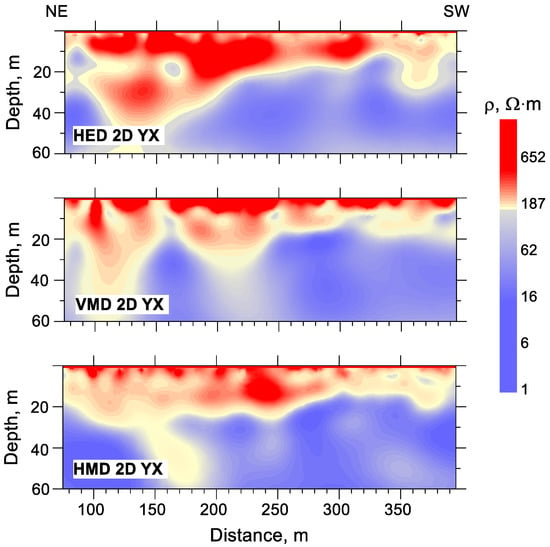
Figure 13.
The 2D CSRMT resistivity sections for Pr-2. The types of sources are indicated in the respective plots.
Two-dimensional inversion taking into account the transition zone, has been performed using MARE2DEM software [34] with a modification for the impedance inversion of the field of the controlled source [11]. In this case, the real size of the grounded transmitter line (linear approximation) has been taken into account. For a horizontal loop, an approximation by a point dipole placed in the center of the loop was used. Sounding curves in the stations near the loop may have some distortions due to this simplification; nevertheless, they did not significantly affect the data obtained.
The resistivity sections recovered from the 1D and 2D inversions of the data obtained from different sources look quite similar. The following features of the sections can be distinguished. In the near-surface sediments of Quarternary age, the gravel-pebble layers with increased resistivity are present. The thicknesses of these layers increase to the northeast. They are most prominent in the results of 1D and 2D inversions of sounding curves obtained with HED. This is due to the influence of the galvanic mode sensitive to high-resistive layers in the transition zone of this source.
The underlying strata are represented by the more conductive Quarternary sandy-clay sediments that manifest themselves in the resistivity sections in approximately the same way. The sections obtained from 1D and 2D inversions of VMD and HMD data are characterized by relatively low resistivity values compared with the inversion results of HED data since the induction mode is less sensitive to high-resistive layers dominates in the fields of VMD and HMD.
The presented results show that the measurements of subharmonics of base frequencies when working with loop sources in the CSRMT method allow us to expand the used frequency range and obtain reliable and geologically meaningful resistivity sections of the studied area.
4. Conclusions
The possibility of recording signals of base frequencies subharmonics in the CSRMT method with loop sources is considered. Using MU based on a step-up transformer increases the output voltage of the GTS-1 transmitter of the CSRMT equipment. The output voltage of the transmitter increased by a factor of 2–3, from 200–288 V to 560–700 V, and the current in the loop source (HMD) was 7 A at a frequency of 20 kHz and 4.5 A at a frequency of 80 kHz.
As a result, the signals of the selected base frequencies of 20, 40 and 80 kHz and their odd subharmonics were reliably measured. The signal amplitudes increased by a factor of 2–4 for subharmonics at low frequencies (60–200 kHz) and up to 10–13 times for subharmonics at higher frequencies (200–500 kHz). At the same time, the amplitudes of the subharmonics of the signals in the range of 600–1000 kHz were decreased. When working with loop sources and the GTS-1 transmitter at frequencies from 1 to 10–15 kHz, there is no need to use MU to ensure reliable measurements of the subharmonic signals.
The combination of GTS-1 and MU has also been tested with HED (grounded line) as a source, which we traditionally use as a part of the CSRMT equipment. The amplitudes of the base frequency subharmonics increased in the entire operating range of the equipment up to 1000 kHz in accordance with the used gain of MU.
The results of the field experiment at the Yablonovka test site with different sources (HED, HMD, and VMD) demonstrated that the curves of apparent resistivity and impedance phase derived from signals of base frequencies and their subharmonics have a similar shape for three types of sources. Some discrepancies at low frequencies are associated with the different influences of the transition zone in the fields of these sources. In this case, more noticeable differences are seen in the phase curves.
To compare the results obtained with different sources, the surveys with HMD and HED were carried out in the scalar mode since only scalar measurements are possible with VMD. 1D and 2D inversions of sounding data were performed, taking into account the influence of the transition zone. On the whole, obtained resistivity sections look quite similar. In the upper part of the section (Quaternary sediments), the increased values of resistivity characteristic for the gravel-pebble layers are observed. These layers appear more pronounced in the resistivity sections obtained with HED, which is explained by the significant influence of the galvanic mode in the transition zone of this source. The underlying sandy-clay sediments are characterized by relatively low resistivity values. They are better seen in the sections obtained with VMD and HMD. This is explained by a more noticeable influence of the induction mode in the fields of these sources.
The presented results show that the use of the base frequency subharmonics for HMD and VMD sources in the CSRMT method is possible and allows us to increase the efficiency of measurements because only three base frequencies can be used to cover three decades of frequency from 1 to 1000 kHz. The use of loop sources in the CSRMT method would be particularly advantageous when conducting winter work in Arctic regions, where the use of HED is difficult.
Author Contributions
Conceptualization, A.K.S.; methodology, A.K.S.; software, A.A.S.; validation, A.A.S. and N.Y.B.; formal analysis, A.A.S. and N.Y.B.; investigation, A.K.S., A.A.S. and N.Y.B.; resources, A.K.S. and A.A.S.; data curation, A.A.S. and N.Y.B.; writing—original draft preparation, A.K.S.; writing review and editing, N.Y.B.; visualization, A.A.S. and N.Y.B.; supervision, A.K.S.; project administration, A.K.S. and N.Y.B.; funding acquisition, A.K.S. All authors have read and agreed to the published version of the manuscript.
Funding
This research was funded by the Russian Science Foundation, project No. 21-47-04401.
Institutional Review Board Statement
Not applicable.
Informed Consent Statement
Not applicable.
Data Availability Statement
The datasets generated and analyzed in the current study are available from the corresponding author upon reasonable request.
Acknowledgments
The presented results were obtained with the support of the Research Park of St. Petersburg State University Center for Geo-Environmental Research and Modeling (GEOMODEL).
Conflicts of Interest
The authors declare no conflict of interest.
References
- Tezkan, B. Radiomagnetotellurics. In Groundwater Geophysics: A Tool for Hydrogeology; Kirsch, R., Ed.; Springer: Berlin/Heidelberg, Germany, 2008; pp. 295–318. [Google Scholar] [CrossRef]
- Berdichevsky, M.N.; Dmitriev, V.I. Models and Methods of Magnetotellurics; Springer: Berlin/Heidelberg, Germany, 2008; 563p. [Google Scholar] [CrossRef]
- Chave, A.D.; Jones, A.G. (Eds.) The Magnetotelluric Method: Theory and Practice; Cambridge University Press: Cambridge, UK, 2012; 570p. [Google Scholar] [CrossRef]
- Bastani, M. Enviro-MT—A New Controlled Source/Radio Magnetotelluric System. Ph.D. Thesis, Acta Universitatis Upsaliensis, Uppsala, Sweden, 2001; 181p. [Google Scholar]
- Bastani, M.; Savvaidis, A.; Pedersen, L.B.; Kalscheuer, T. CSRMT measurements in the frequency range of 1–250 kHz to map a normal fault in the Volvi basin, Greece. J. Appl. Geophys. 2011, 75, 180–195. [Google Scholar] [CrossRef]
- Bastani, M.; Malehmir, A.; Ismail, N.; Pedersen, L.B.; Hedjazi, F. Delineating hydrothermal stockwork copper deposits using controlled-source and radio-magnetotelluric methods: A case study from northeast Iran. Geophysics 2009, 45, B167–B181. [Google Scholar] [CrossRef]
- Pedersen, L.B.; Bastani, M.; Dynesius, L. Groundwater exploration using combined controlled-source and radiomagnetotelluric techniques. Geophysics 2005, 70, G8–G15. [Google Scholar] [CrossRef]
- Ismail, N.; Schwarz, G.; Pedersen, L.B. Investigation of groundwater resources using controlled-source radiomagnetotellurics (CSRMT) in glacial deposits in Heby, Sweden. J. Appl. Geophys. 2011, 73, 74–83. [Google Scholar] [CrossRef]
- Shan, C.; Bastani, M.; Malehmir, A.; Persson, L.; Lundberg, E. Integration of controlled-source and radio magnetotellurics, electric resistivity tomography, and reflection seismics to delineate 3D structures of a quick-clay landslide site in southwest of Sweden. Geophysics 2016, 81, B13–B29. [Google Scholar] [CrossRef]
- Mehta, S.; Bastani, M.; Malehmir, A.; Pedersen, L.B. CSRMT Survey on Frozen Lake a New Technique with an Example from the Stockholm Bypass Tunnel. In Proceedings of the Near Surface Geoscience Conference and Exhibition, Malmö, Sweden, 3–7 September 2017; pp. 1–4. [Google Scholar] [CrossRef]
- Wang, S.; Bastani, M.; Constale, S.; Kalscheuer, T.; Malehmir, A. Boat-towed radiomagnetotelluric and controlled source audio-magnetotelluric study to resolve fracture zones at Äspö Hard Rock Laboratory site, Sweden. Geophys. J. Int. 2019, 218, 1008–1031. [Google Scholar] [CrossRef]
- Bastani, M.; Wang, S.; Malehmir, A.; Mehta, S. Radiomagnetotelluric and controlled-source magnetotelluric surveys on a frozen lake: Opportunities for urban applications in Nordic countries. Near Surf. Geophys. 2022, 20, 30–45. [Google Scholar] [CrossRef]
- Saraev, A.; Simakov, A.; Shlykov, A.; Tezkan, B. Controlled source radiomagnetotellurics: A tool for near surface investigations in remote regions. J. Appl. Geophys. 2017, 146, 228–237. [Google Scholar] [CrossRef]
- Shlykov, A.; Saraev, A.; Tezkan, B. Study of a permafrost area in the northern part of Siberia using controlled source radiomagnetotellurics. Pure Appl. Geophys. 2020, 177, 5845–5859. [Google Scholar] [CrossRef]
- Tezkan, B.; Muttaqien, I.; Saraev, A. Mapping of buried faults using the 2D modelling of far-field controlled source radiomagnetotelluric data. Pure Appl. Geophys. 2019, 176, 751–766. [Google Scholar] [CrossRef]
- Saraev, A.; Simakov, A.; Tezkan, B.; Tokarev, I.; Shlykov, A. On the study of industrial waste sites on the Karelian Isthmus/Russia using the RMT and CSRMT methods. J. Appl. Geophys. 2020, 175, 1–9. [Google Scholar] [CrossRef]
- Saraev, A.K.; Shlykov, A.A.; Tezkan, B. Application of the Controlled Source Radiomagnetotellurics (CSRMT) in the Study of Rocks Overlying Kimberlite Pipes in Yakutia/Siberia. Geosciences 2022, 12, 34. [Google Scholar] [CrossRef]
- Shlykov, A.; Saraev, A.; Agrahari, S. Study of the anisotropy of horizontally layered section using data of the controlled source radiomagnetotelluric. Geophysica 2019, 54, 3–21. [Google Scholar]
- Shlykov, A.; Saraev, A.; Agrahari, S.; Tezkan, B.; Singh, A. One-dimensional laterally constrained joint anisotropic inversion of CSRMT and ERT data. J. Environ. Eng. Geophys. 2021, 26, 35–48. [Google Scholar] [CrossRef]
- Shlykov, A.; Saraev, A.; Tezkan, B. Interpretation of CSRMT Data in the Study of Anisotropic Media. In Proceedings of the Second EAGE Workshop on Near-Surface and Mineral Exploration in Latin America, Bogotá, Colombia, 3–4 November 2022. [Google Scholar] [CrossRef]
- Bobrov, N.; Shlykov, A.; Saraev, A.; Tezkan, B. Prospects of tensor CSRMT soundings for the delineation of hydrogenic taliks in permafrost areas. In Proceedings of the NSG2021 27th European Meeting of Environmental and Engineering Geophysics, Bordeaux, France, 29 August–2 September 2021; Volume 2021, pp. 1–5. [Google Scholar] [CrossRef]
- Saraev, A.K.; Shlykov, A.A.; Bobrov, N.Y. Tensor CSRMT System with Horizontal Electrical Dipole Sources and Prospects of Its Application in Arctic Permafrost Regions. Eng 2023, 4, 569–580. [Google Scholar] [CrossRef]
- Shlykov, A.A.; Saraev, A.K. Polarization of a High-Frequency Electromagnetic Field in the Tensor CSRMT Method. Izv. Phys. Solid Earth 2022, 58, 733–742. [Google Scholar] [CrossRef]
- Smirnova, M.; Shlykov, A.; Asghari, S.F.; Tezkan, B.; Saraev, A.; Yogeshwar, P.; Smirnov, M. 3D controlled-source electromagnetic inversion in the radio-frequency band. Geophysics 2023, 88, E1–E12. [Google Scholar] [CrossRef]
- Simpson, F.; Bahr, K. Practical Magnetotellurics; Cambridge University Press: Cambridge, UK, 2005; 254p. [Google Scholar] [CrossRef]
- Veshev, A.V. DC and AC Electrical Profiling, 2nd ed.; Nedra: Leningrad, Russia, 1980; 391p. (In Russian) [Google Scholar]
- Molochnov, G.V.; Radionov, M.V. Frequency Electromagnetic Soundings with a Vertical Magnetic Dipole; Leningrad University: Leningrad, Russia, 1982; 216p. (In Russian) [Google Scholar]
- Manshtein, A.K.; Panin, G.L.; Tikunov, S.Y. A device for shallow frequency-domain electromagnetic induction sounding. Russ. Geol. Geophys. 2008, 49, 430–436. [Google Scholar] [CrossRef]
- Auken, E.; Pellerin, L.; Christensen, N.B.; Sørensen, K. A survey of current trends in near-surface electrical and electromagnetic methods. Geophysics 2006, 71, G249–G260. [Google Scholar] [CrossRef]
- Zonge, K.L.; Hughes, L.J. Controlled-source audio-frequency magnetotellurics. In Electromagnetic Methods in Applied Geophysics; Nabighian, M.N., Ed.; Society of Exploration Geophysicists: Houston, TX, USA, 1991; Volume 2, pp. 713–809. [Google Scholar] [CrossRef]
- Streich, R. Controlled-Source Electromagnetic Approaches for Hydrocarbon Exploration and Monitoring on Land. Surv. Geophys. 2016, 37, 47–80. [Google Scholar] [CrossRef]
- Shlykov, A.A.; Saraev, A.K. Estimation of macroanisotropy of a horizontally layered section from controlled-source radiomagnetotelluric soundings. Izv. Phys. Solid Earth 2015, 51, 583–601. [Google Scholar] [CrossRef]
- Afanasov, M.N.; Nikolaev, V.A. Prospects for the diamond content of the Karelian Isthmus. Reg. Geol. Metallog. 2003, 18, 116–121. (In Russian) [Google Scholar]
- Key, K. MARE2DEM: A 2-D inversion code for controlled-source electromagnetic and magnetotelluric data. Geophys. J. Int. 2016, 207, 571–588. [Google Scholar] [CrossRef]
Disclaimer/Publisher’s Note: The statements, opinions and data contained in all publications are solely those of the individual author(s) and contributor(s) and not of MDPI and/or the editor(s). MDPI and/or the editor(s) disclaim responsibility for any injury to people or property resulting from any ideas, methods, instructions or products referred to in the content. |
© 2023 by the authors. Licensee MDPI, Basel, Switzerland. This article is an open access article distributed under the terms and conditions of the Creative Commons Attribution (CC BY) license (https://creativecommons.org/licenses/by/4.0/).