Article

Reducing the Immunogenicity of Pulchellin A-Chain, Ribosome-Inactivating Protein Type 2, by Computational Protein Engineering for Potential New Immunotoxins

by
Reza Maleki
1,
Libing Fu
2,
Ricardo Sobhie Diaz
3,
Francisco Eduardo Gontijo Guimarães
4,
Otávio Cabral-Marques
5,6,7,8,9,10,
Gustavo Cabral-Miranda
5,*,† and
Mohammad Sadraeian
2,*,†
1
Adelaide Medical School, University of Adelaide, Adelaide 5005, Australia
2
Institute for Biomedical Materials and Devices (IBMD), Faculty of Science, University of Technology Sydney, Sydney 2007, Australia
3
Laboratório de Retrovirologia, Escola Paulista de Medicina, Universidade Federal de São Paulo, São Paulo 04039-032, Brazil
4
Instituto de Física de São Carlos, Universidade de São Paulo, Caixa Postal 369, São Carlos 13560-970, Brazil
5
Department of Immunology, Institute of Biomedical Sciences, University of São Paulo (ICB/USP), São Paulo 05508-000, Brazil
6
Department of Clinical and Toxicological Analyses, School of Pharmaceutical Sciences, University of São Paulo, São Paulo 05508-000, Brazil
7
Department of Medicine, Division of Molecular Medicine, School of Medicine, University of São Paulo, São Paulo 05508-000, Brazil
8
Laboratory of Medical Investigation 29, School of Medicine, University of São Paulo, São Paulo 01246-903, Brazil
9
Interunit Postgraduate Program on Bioinformatics, Institute of Mathematics and Statistics (IME), University of Sao Paulo, Sao Paulo 05508-090, Brazil
10
Department of Pharmacy and Postgraduate Program of Health and Science, Federal University of Rio Grande do Norte, Natal 59078-970, Brazil
*
Authors to whom correspondence should be addressed.
These authors contributed equally to this work.
J 2023, 6(1), 85-101; https://doi.org/10.3390/j6010006
Submission received: 29 November 2022 / Revised: 6 January 2023 / Accepted: 10 January 2023 / Published: 16 January 2023
(This article belongs to the Special Issue Feature Paper of J in 2022)

Abstract

:
Pulchellin is a plant biotoxin categorized as a type 2 ribosome-inactivating protein (RIPs) which potentially kills cells at very low concentrations. Biotoxins serve as targeting immunotoxins (IT), consisting of antibodies conjugated to toxins. ITs have two independent protein components, a human antibody and a toxin with a bacterial or plant source; therefore, they pose unique setbacks in immunogenicity. To overcome this issue, the engineering of epitopes is one of the beneficial methods to elicit an immunological response. Here, we predicted the tertiary structure of the pulchellin A-chain (PAC) using five common powerful servers and adopted the best model after refining. Then, predicted structure using four distinct computational approaches identified conformational B-cell epitopes. This approach identified some amino acids as a potential for lowering immunogenicity by point mutation. All mutations were then applied to generate a model of pulchellin containing all mutations (so-called PAM). Mutants’ immunogenicity was assessed and compared to the wild type as well as other mutant characteristics, including stability and compactness, were computationally examined in addition to immunogenicity. The findings revealed a reduction in immunogenicity in all mutants and significantly in N146V and R149A. Furthermore, all mutants demonstrated remarkable stability and validity in Molecular Dynamic (MD) simulations. During docking and simulations, the most homologous toxin to pulchellin, Abrin-A was applied as a control. In addition, the toxin candidate containing all mutations (PAM) disclosed a high level of stability, making it a potential model for experimental deployment. In conclusion, by eliminating B-cell epitopes, our computational approach provides a potential less immunogenic IT based on PAC.

1. Introduction

Ribosome-inactivating proteins (RIPs) are poisonous N-glycosylase enzymes that depurinate eukaryotic and prokaryotic rRNAs, resulting in inactivating ribosome’s catalytic activity. RIPs have been discovered in various organisms, such as plants, fungi, and bacteria. Type 1, type 2, and type 3 are the three primary RIPs found in plants, based on their related genes and structural features [1]. Plants produce a wide range of poisonous molecules, including type 2 ribosome-inactivating proteins (RIP-2) like abrin toxin, which have highly selective rRNA N-glycosylase activity [2]. Although toxins are hazardous and possibly fatal, they are utilized as therapeutics, compounding immunotoxins (ITs), which are fusion proteins with quite selective targeting properties [3]. Pulchellin, extracted from Abrus pulchellus tenuiflorus plant seeds, is a type 2 RIP that is a potent plant toxin, akin to abrin and ricin. Pulchellin consists of a RIP-active polypeptide (A-chain) and a galactose-binding lectin (B-chain) connected by a disulfide bond [4]. The B-chain, a nontoxic carbohydrate-binding component, is critical for mediating A-chain endocytosis and could be employed as a medication delivery mechanism [5,6]. Having N-glycosylase function, the A-chain is the catalytic element breaking a particular adenine residue from a conserved loop of the significant rRNA subunit [7]. The catalytic residues in the pulchellin A-chain are maintained in locations identical to those in the A-chains of ricin and abrin. There are four isoforms of pulchellin, and the isoform II is the most potent one having LD50 toxicity of 15 µg/kg in mice [8]. ITs are hybrid antibodies combining a toxin with a binding element. A fragment antigen-binding (Fab) region of an antibody that targets a specific antigen on desired cells performs as the binding element for the toxin part, which significantly hinders protein synthesis and leads to cell death [9,10]. Various toxins are used for producing ITs from a bacterial source up to plants [11,12]. ITs could highlight underlying immunogenicity since they include two macromolecular components identified as foreign molecules by the immune system due to the presence of epitopes [13]. As a result, the clinical implication of ITs might be restricted, particularly in frequent therapies. To address this issue, several strategies have been employed, including immunosuppressive drugs, which could bring about undesirable outcomes [14].
Protein engineering has recently been a favored method for reducing the immunogenicity of potential epitopes to implement these chimeric antibodies more efficiently [9,15]. The immune response can be inhibited by removing epitopes participating in immunogenicity [16,17]. B-cell epitopes are frequently present at a few distinct locations on the protein’s surface, and the most prevalent kind of neutralizing B-cell epitope is found in Discontinuous portions [18]. Point mutation using computational tools is an efficient way of lowering the immunogenicity of non-self proteins [19].
We employed multiple 3D modeling to generate a reliable 3D structure in the current work because the crystallographic structure of pulchellin has not been disclosed. Potential epitopes were identified using four servers, each with a specific algorithm. After, the final model was modeled and refined. To reduce the immunogenicity of the toxin, immunogenic B-cell epitopes were altered to non-polar and short side chain amino acids. Afterward, the immunogenicity of mutants was determined, a toxin candidate containing all mutations (PAM) was successfully predicted, and validation features were evaluated. Ultimately, molecular dynamic simulation was used to assess specific key characteristics such as stability, compactness, and solvent-accessible surface area.

2. Materials and Methods

2.1. Retrieval of Protein Sequences

The National Center of Biotechnology Information (NCBI) (https://www.ncbi.nlm.nih.gov/, accessed on 23 March 2022) and UniProt (http://www.uniprot.org, accessed on 23 March 2022) databases were used to obtain the A-chain sequence of prepropulchellin II in FASTA format. NCBI accession number ABW23504 and UniProt ID B1NQC0 matched and were selected for further analysis.

2.2. Modeling of Three-Dimensional Structure

Five Automated homology-modeling of protein structure servers were used to predict Tertiary structure of PAC. Employing template-based modeling, these online servers produce high-grade 3D protein structure using amino acid sequences: GalaxyTBM (http://galaxy.seoklab.org/cgi-bin/submit.cgi?type=TBM, accessed on 28 March 2022) [20], I-TASSER (https://zhanglab.ccmb.med.umich.edu/ITASSER/, accessed on 28 March 2022) [21], PHYRE2 (http://www.sbg.bio.ic.ac.uk/phyre2/html/page.cgi?id=index, accessed on 28 March 2022) [22], Raptor X (http://raptorx.uchicago.edu/StructurePrediction/predict, accessed on 28 March 2022) [23], and SWISS-MODEL (https://swissmodel.expasy.org, accessed on 28 March 2022) [24].

2.3. Three-Dimensional Structure Validation

Available web applications were utilized in order to choose the optimal model including Verify 3D (http://services.mbi.ucla.edu/Verify3D, accessed on 3 April 2022), ERRAT (http://services.mbi.ucla.edu/ERRAT, accessed on 3 April 2022), PROCHECK (https://servicesn.mbi.ucla.edu/PROCHECK, accessed on 3 April 2022), and ProSA-web (https://prosa.services.came.sbg.ac.at/prosa.php, accessed on 3 April 2022). By defining a structural class depending on its position and surroundings (alpha, beta, loop, polar, and nonpolar), the Verify 3D determines the compatibility of an atomic model (3D) with its sequence of amino acids. It examines the outputs and compares them to qualified structures [25]. ERRAT program is used to validate bad contacts of the protein structure. The error function is founded on nonbonded atom-atom interactions, represented in the structure [26]. The ProSA software takes advantage of the benefits of interactive web-based programs to present scores and energy graphs that identify possible issues in protein structures. The z-score evaluates the variation of the total energy of the structure from an energy distribution calculated from random conformations and reflects the ultimate quality of the model [27]. PROCHECK analyzes the total and residue-by-residue geometry of a protein structure, providing a Ramachandran plot that shows (φ) and (ψ) bond angles. In the plot, the amino acids are split into four sections (favored, additionally allowed, generously allowed, and disallowed) [28]. According to the validation results, the most favorable model was chosen for refinement.

2.4. Selected Model Refinement

GalaxyRefine2 was used to refine the chosen model (http://galaxy.seoklab.org/cgi-bin/submit.cgi?type=REFINE2, accessed on 5 April 2022). This server exploits molecular dynamics simulation to achieve repetitive structure perturbation and subsequent structural relaxation. As opposed to GalaxyRefine, GalaxyRefine2 protocol is said to be more precise, offering ten refinement models and only up to 300 amino acids are allowed for refinement submission [29]. Validation servers (Verify 3D, ERRAT, PROCHECK, and ProSA-web) assessed the refinement models’ validity, and ultimately, the top refined model was selected for subsequent steps.

2.5. Predicting Conformational B-Cell Epitopes

The final pulchellin A-Chain (PAC) model was exploited to identify possible B-cell epitopes in the form of discontinued structure. Various web servers (described below) were employed to achieve this goal. Each residue’s score was calculated using the servers listed below. Several residues were determined as possible epitopes based on servers’ scores. Ultimately, in common residues were marked as immunogenic spots. EPSVR (Antigenic Epitopes Prediction with Support Vector Regression) is a discontinuous information-based predictor of B-cell antigenic epitopes on protein surfaces (http://sysbio.unl.edu/EPSVR, accessed on 8 April 2022). There are six distinct characteristics employed by the EPSVR server: residue epitope propensity, conservation score, side chain energy score, contact number, surface planarity score, and secondary structure composition. There is no such issue as a threshold for this server [30]. DiscoTope 2.0 is a new version of the DiscoTope method that includes a new spatial neighborhood definition and a half-sphere exposure as a surface measure (https://services.healthtech.dtu.dk/service.php?DiscoTope-2.0, accessed on 8 April 2022). Amino acid statistics, spatial information, and surface accessibility are the features on which this server is based. The default threshold (−3.7) was set for prediction [31]. Geometrical characteristics of protein structure is a method that the Ellipro server exploits to predict conformational B-cell epitopes (http://tools.iedb.org/ellipro, accessed on 8 April 2022). This server uses three algorithms: ellipsoid prediction of the protein structure, The residue protrusion index (PI) measuring, and employing PI values to cluster the adjacent residues. Ellipro utilizes two features to define a threshold: minimum residue score and maximum distance (Å). These parameters were set at 0.5 and 6 respectively (default values) [32]. SEPPA creates a triangular unit patch by combining exposed and nearby residual features (http://www.badd-cao.net/seppa3/index.html, accessed on 8 April 2022). SEPPA 3.0 is the most recent version. It has improved performance on common protein antigens by updating the training dataset and incorporating new characteristics that allow for reliable prediction of N-linked glycoprotein antigens. The prediction threshold was the default value (Threshold: 0.089) [33]. The AUC (Area under the ROC Curve) is a number that varies from 0 to 1 and represents the method’s total performance. The AUC of a model whose predictions are 100%incorrect is 0.0, whereas the AUC of a model whose predictions are 100%accurate is 1.0 [34]. For EPSVR, DiscoTope 2.0, Ellipro, and SEPPA 3.0, the AUC scores were 0.597, 0.727, 0.732, and 0.740, respectively.

2.6. Establishment of Mutants

Initially, the 3D structure of PAC was exposed to the ConSurf server (https://consurf.tau.ac.il/, accessed on 10 April 2022) to determine whether candidate immunogenic residues are classified as highly conserved and functional residues or not. This server examines the evolutionary pattern of the macromolecule’s amino acids and nucleic acids to identify sections crucial for structure and function [35]. After showing that proposed immunogenic residues do not have a particular role, three non-polar amino acids having a short side chain (A, V, L) were chosen for point mutations.

2.7. Obtaining the 3D Structure of Mutants and Evaluating Their Initial Properties

To create mutant models and assess their stability, the SDM2 server was employed (http://marid.bioc.cam.ac.uk/sdm2, accessed on 12 April 2022). This free web tool calculates a stability score using a statistical potential energy function and provides The PDB (Protein Data Bank) file format for mutants [36]. The validity of the 3D structure of each mutant supplied from the SDM2 server was subjected to validation servers (similarly performed in Section 2.3).

2.8. Analyzing Immunogenicity of Mutants

The immunogenicity of each mutant was investigated using the servers indicated before (EPSVR, DiscoTope 2.0, ElliPro, and SEPPA 3.0). Score changes of antigenic spots were scrutinized at the location of mutations. Supportive analysis was performed by SDM2 and Discovery Studio 4.5 software. SDM2 provides structural environment data like side chain solvent accessibility, residue depth, and packing density [36]. Furthermore, sidechain accessibility and hydrophobicity of mutants were assessed by Discovery Studio 4.5 software.

2.9. Building Pulchellin Containing All Mutations Model

After establishing point mutation, the pulchellin containing all mutations (PAM), including T82A, T100A, D101V, Q121A, N146V, D147A, and R149A, was predicted and refined by GalaxyTBM and GalaxyRefine2, respectively. The validity of 3D structure of PAM was measured by validation servers similar to the previous step in Section 2.3. The immunogenicity of the final model of PAM was then examined by the servers mentioned previously (EPSVR, DiscoTope 2.0, ElliPro, and SEPPA 3.0).

2.10. Molecular Docking

The molecular docking was accomplished by AutoDock Vina version 4.2 [37]. PAC wildtype and mutant models were employed as receptors, and the active sites of PAC were identified using homology to other RIP-2 families like Ricin [8]. Using residues C13 through G18 from the RNA sequence (5′GGGUGCUCAGUACGAGAGGAACCGCACCC3′), the structure of the ligand was retrieved from the 29-mer Sarcin-Ricin loop (PDB ID 1SCL) [38]. The underlined characters represented the ligand sequence and ‘‘A’’ bold font shows the target adenine (Figure 1). The grid box size was set at 20 × 22 × 22 Å for x, y, and z, respectively, with 1 Å spacing between the grid points. The grid center of x, y, and z, was set to 68, 10, and 37, respectively. To acquire specific control on the docking process of mutants, docking of Abrin-A with CGAGAG was performed simultaneously. For this purpose, the x, y, and z grid centers were set at 67, 7, and 37, respectively without changing other parameters. Each docking was carried out 100 runs utilizing the Lamarckian Genetic Algorithm (LGA). The graphics of interaction quality was plotted by AutoDockTools-1.5.6.

2.11. Molecular Dynamics Simulation

MD (Molecular dynamics) simulations could be a valuable technique for studying stability and structural change of macromolecules under physiological circumstances. GROMACS and the CHARMM 27 all-atom force field were used to perform MD simulations of all docking Protein-ligand complexes (Abrin-A, PAC mutants and wild type with CGAGAG) [39]. The topology files of the receptor were generated by GROMACS but the topology of ligands was prepared by SwissParam [40], since GROMACS is not able to produce ligand topology autonomously. A dodecahedron box of 48 × 60 × 48 Å TIP3P water molecules was applied to solvate the complex, with a spacing of 10 Å between the complex and the solvated box’s edge. After applying sodium ions to neutralize the solvated system, the systems were energy minimized using the steepest descent technique. The “genrestr” module was used to restrain the ligand position and temperature coupling groups were set at Protein_LIG water_and_ions. The system was equilibrated with velocity-rescale thermostat at 300 K (reference temperature) for 100 ps using NVT (constant Number of particles, Volume, and Temperature). Then, NPT with Berendsen pressure coupling at one atmosphere (reference pressure) (constant Number of particles, Pressure, and Temperature) for another 100 ps. The long-range electrostatic interactions were estimated using Particle Mesh Ewald (PME), and for covalent bond constraints, the Linear Constraint Solver (LINCS) algorithm was deployed [41]. Following this, the MD simulation of the equilibrated system was run for 100 ns. The assessment of RMSD (root mean square deviation), RMSF (root mean square fluctuation), the radius of gyration (Rg), solvent accessible surface area (SASA), and hydrogen bonding (H-bonds) was performed using GORMACS MD simulation trajectories. Additionally, binding energy between mutants and CGAGAG were estimated using MM/PBSA (Molecular Mechanics Poisson-Boltzmann Surface Area) tool based on MMPBSA.py of AmberTools20 [42].

3. Results and Discussion

Exploiting plants to synthesize toxins like pulchellin, might promote the production of recombinant immunotoxins (antibody–toxin fusion proteins) [43]. The use of toxic enzymes to make ITs is a vital field. The main limits to the clinical use of heterologous proteins derive from their immunogenicity and, to a lesser extent, from their systemic toxicity. The creation of macromolecules with lower immunogenicity could be accomplished effectively by theoretical protein engineering [44]. In this regard, the immunogenic zones of pulchellin were discovered by an in silico analysis of conformational B-cell epitopes, and then, point mutations were employed to obtain the least immunogenic mutants without influencing the stability and functional features of the wild type model.

3.1. Toxin Selection and Structural Prediction

Four isoforms for pulchellin have been discovered (P I, P II, P III, P IV). Isoforms P I and P II have been indicated to have similar toxicities, and both are more poisonous than P III and P IV [8]. Among all isoforms, it has been established that isoform II has the highest level of toxicity and the corresponding recombinant protein has also been created. [4]. Moreover, in another study, this isoform was used to produce immunotoxin against HIV envelope [10], which appeared to be an important compound according to its ability to specific cell targeting. This led to the selection of isoform P II for examination in this study. Because the crystal structure of pulchellin has not been determined, the first stage in the study was to make a reliable prediction of the tertiary structure of pulchellin isoform II. Using various online servers, I-TASSER, GalaxyWEB, Phyre2, RaptorX, and SWISS-MODEL, the tertiary structure of the PAC was created. Based on template modeling, all servers predict just one final model except GalaxyWEB, which indicated five last models. As a template, this server supplied two crystal structures of the Abrin-A A chain (PDB ID 1ABR and 5Z37). The identity of PAC and Abrin-A A chain was determined 78% when using NCBI blast. The similarities between the Abrin-A PAC and the A-chain were investigated using pairwise alignment. The total identity values were discovered to be about 78%, and the catalytic residues of PAC were found to be identical to Abrin-A [8]. To choose the most suitable model, all produced models were checked using PROCHECK, Verify 3D, ERRAT, and ProSA-web. The outputs of validation are represented in Supplementary Table S1.
Among Galaxy predicted models, model 4 was chosen for subsequent development based on the validation results in Supplementary Table S2. After subjecting this model to GalaxyRefine2 and assessing the validation scores of refined models, the refined model 2 (PAC) was ultimately selected for the immunogenicity survey. Figure 2 depicts the validation graphs for the final model.
According to Verify 3D results, 98.01% of modeled PAC residues had an average 3D–1D greater than or Equal to 0.2. Overall Quality Factor of 97.51 was received from ERRAT server. Obtaining a −7.74 Z-score from ProSA-web represented that PAC comes within the normal range of scores for natural proteins with comparable size. Rama-chandran plot revealed that 93.4%, 6.1%, 0.0% and 0.4% of residues were positioned in favored, additionally allowed, generously allowed, and disallowed, respectively. In fact, there is only one residue (R31) in the disallowed region. This amino acid is located in β-sheet and is not involved in an immunogenic domain or an active site, therefore its presence in the disallowed zone does not contradict with the present project (Table 1).

3.2. Immunogenic Epitopes Prediction and Making Mutants

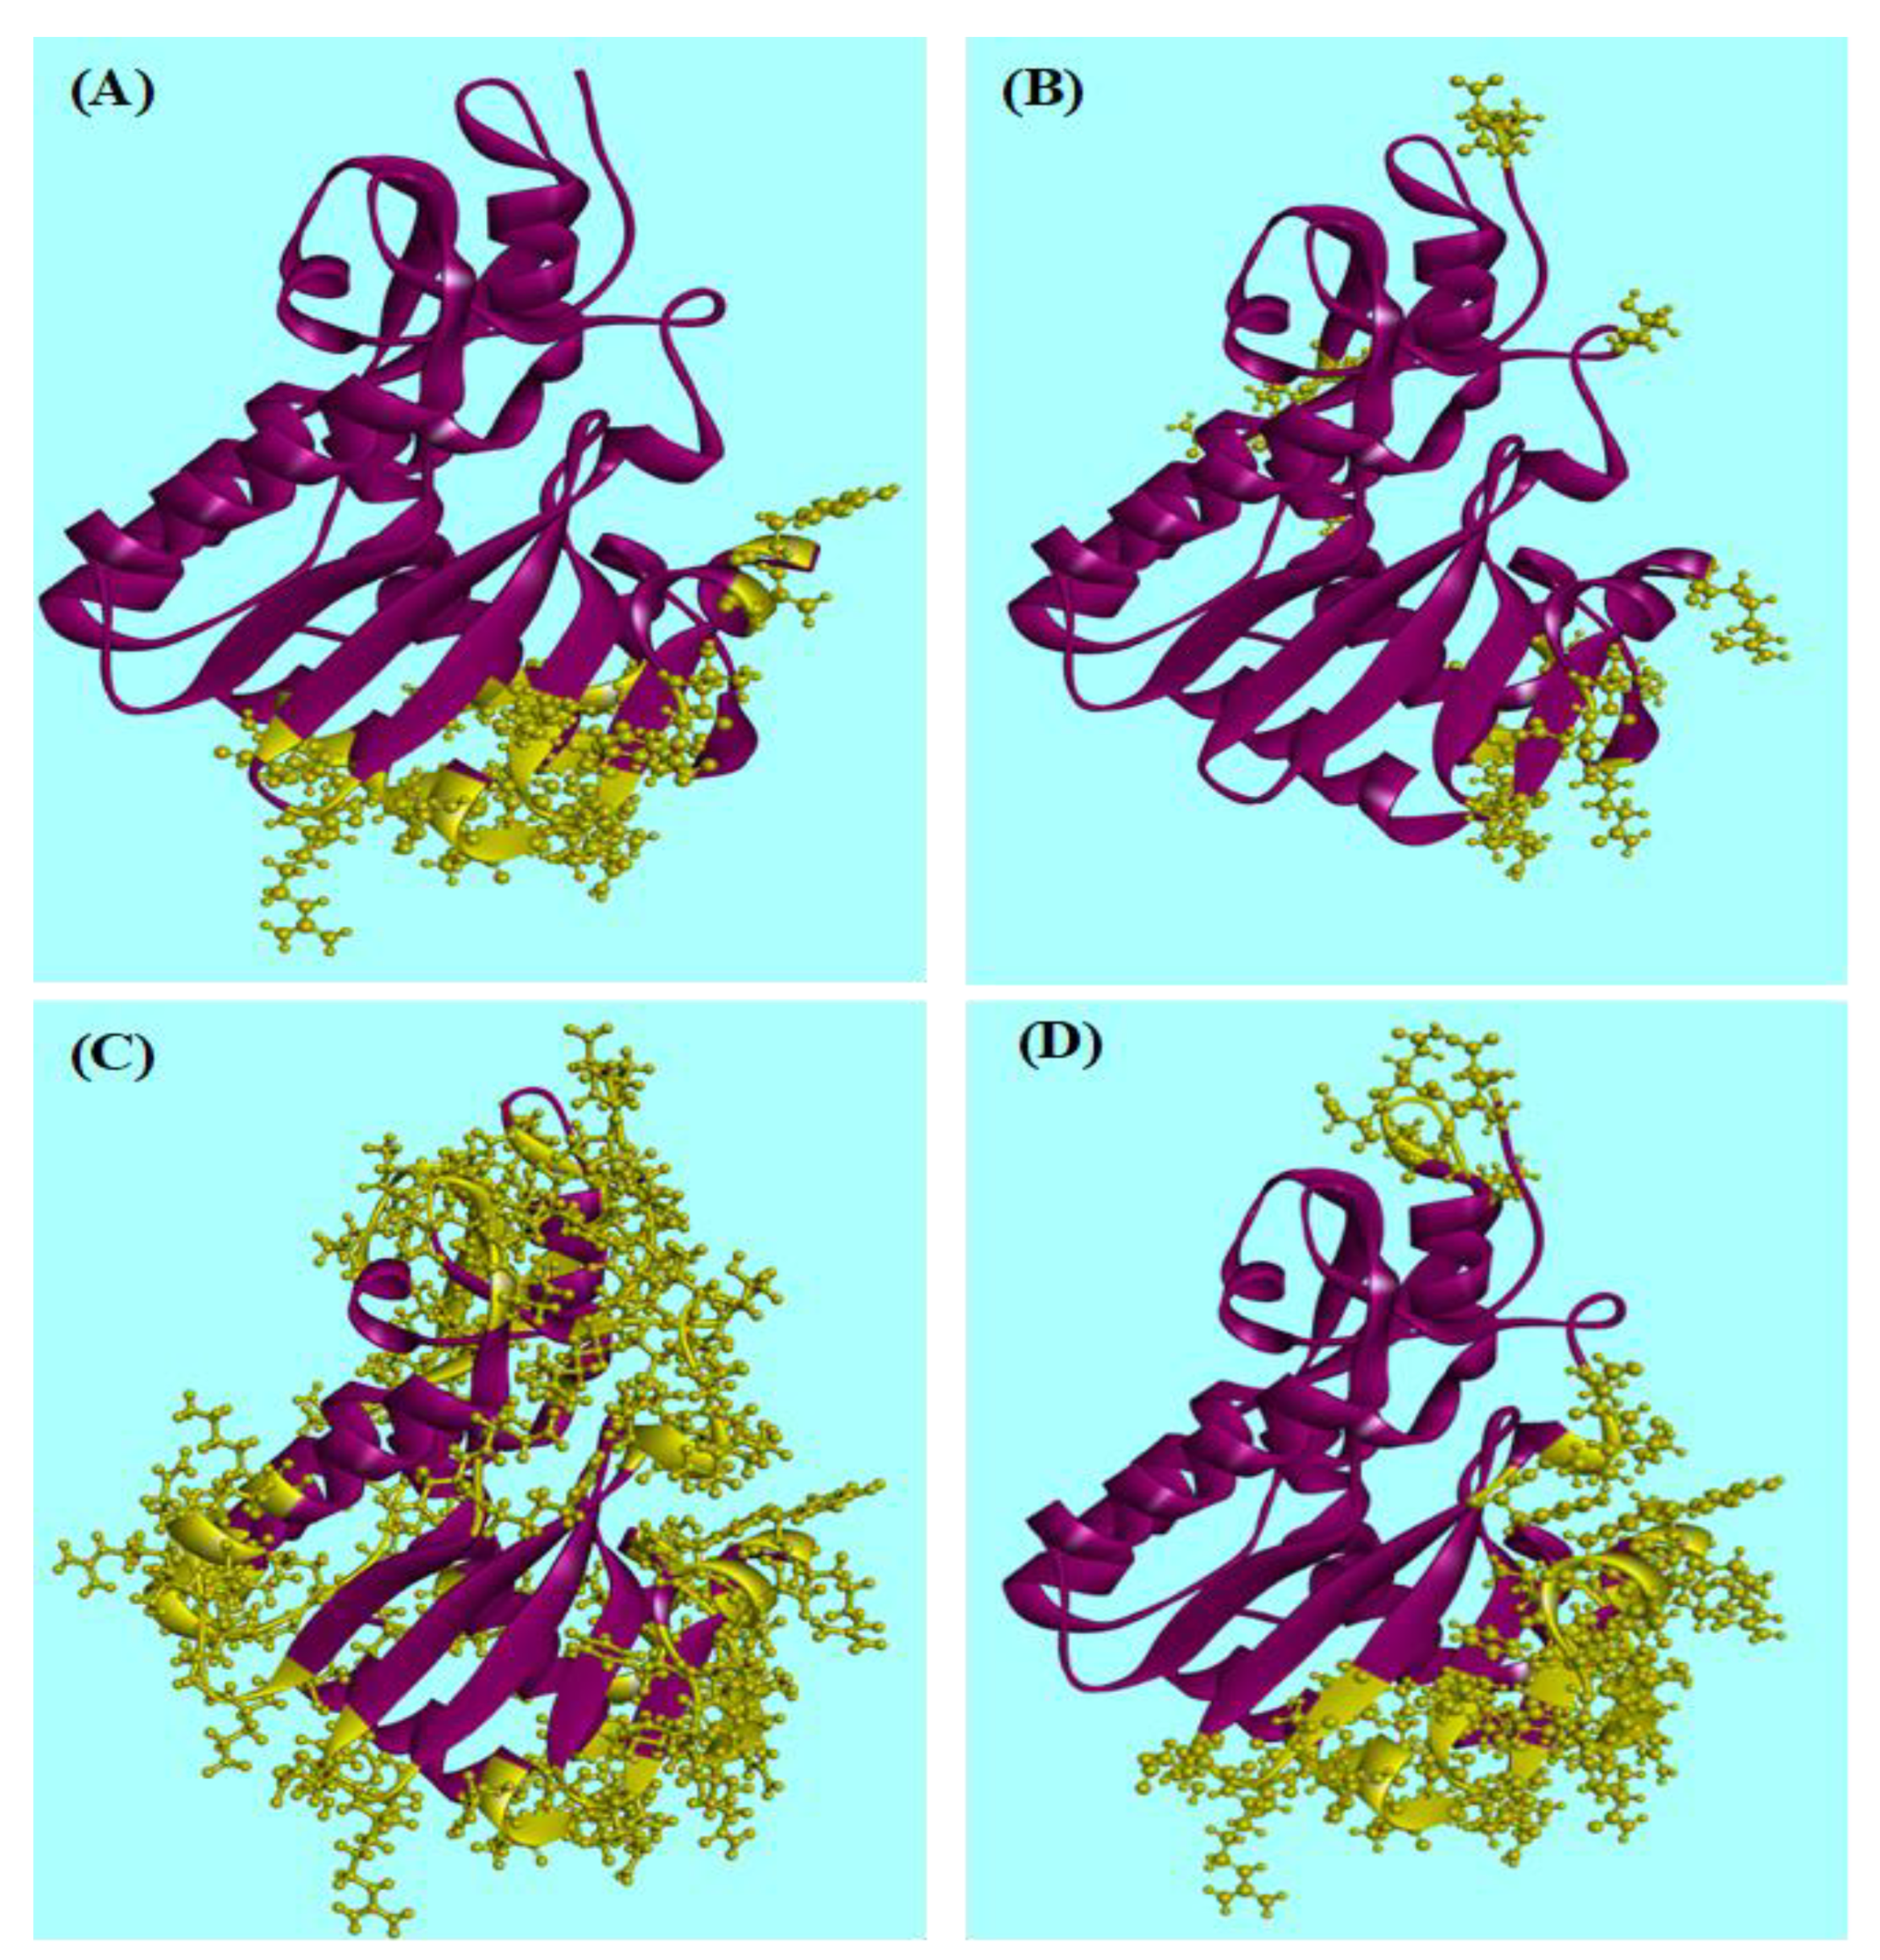
The four servers uncovered seven shared residues (out of 251 total residues) are strong immunogenic sites, which are T82, T100, D101, Q121, N146, D147, and R149. Except for R149, located at the alpha helix, the remaining chosen residues are found at beta strands. According to ConSurf server data, these residues are not in the active site and are not categorized as highly conserved amino acids. The discontinuous B-cell epitopes are visually portrayed in Figure 3. These residues were altered to alanine, valine, or Leucine. Of note, the presence of aromatic amino and large hydrophilic side chains, which are known to elicit a robust immunological response, has been confirmed [45,46]. Furthermore, it has been demonstrated that by identifying B-cell epitopes and making a point mutation in the immunogen residue, the immunogenicity of the protein could be reduced [47]. The mutation can be achieved by using nonpolar amino acids with small side chains, which could lead to a decrease in the immunogenicity of the immunogenic residues [13]. In this study, three small side chain amino acids were used for mutation: Ala, Val and Leu.

3.3. Making Mutants and Evaluation Stability and Immunogenicity

According to the evaluation of stability and immunogenicity of each mutation (Supplementary Table S3), seven final mutants were obtained: T82A, T100A, D101V, Q121V, N146V, D147A, and R149A. The stability of all mutants has increased after mutation except D101V, according to SDM2 server results. Immunogenicity changes and SDM2 overall stability of obtained mutants are described in Table 2. SDM2 employs two structural parameters for evaluating protein stability: residue-occluded packing density (OSP) and residue depth. High residue packing density areas (4 and 8 Å depth levels) are commonly observed with extremely destabilizing mutations. Destabilizing mutations have negative pseudo ΔΔG levels, whereas stabilizing mutations exhibit positive pseudo ΔΔG values. The mutant T100A displayed the most stable one according to the SDM2 results. All mutations, according to the EPSVR and DiscoTope servers, result in a reduction in immunogenicity. Except for T100A and D101V, practically all mutants reported a decline in immunogenicity in SEPPA analysis. In ElliPro conformational server, however, no significant changes were identified. Bioinformatics techniques and databases are critical for finding appropriate epitopes and lowering the immunogenicity of a targeted protein [48]. In this study, we just used conformational B-cell epitopes (not linear) because protein has a three-dimensional structure in its native state and predicting linear epitopes for immunogenicity could not be an effective strategy. In fact, defining epitopes is considerably dependent on conformational structure [49]. There are several methods and servers which could predict conformational B-cell epitope. Each server takes into account a variety of factors and by using a combination of servers, identifying immunogenic areas could be more precise [50]. The PAC epitopes were defined using four conformational B-cell epitope prediction systems with four distinct methods. For the prediction of conformational B-cell epitope in surface protein in SARSCoV2, Lon et al. employed the SEPPA3.0 and Ellipro servers [51]. Ellipro, EPSVR, and DiscoTope servers were used in another investigation to discover potent B- and T-cell epitopes of four structural proteins of SARS-CoV-2 [52].

3.4. Validation Analysis and Investigating Further Properties of Mutants

Because the mutants were obtained from the SDM2 server, it was required to assess their 3D structure validation once again. For this purpose, all mutants were subjected to validation servers, and the results were highly acceptable (Supplementary Table S4), except for the D101V mutation, which showed a small drop in ERRAT output (from 97.51 to 95.85) and a decline in the number of residues in the favored region in Ramachandran plot (decreased from 93.4 to 93). Nonetheless, this reduction was unimportant because D101V conformational structure reliability remained within the acceptable limit. Side chain accessibility and hydrophobicity are two features that play a role in immunogenicity. Residues that are more accessible and, as a result, more hydrophilic can be more likely to form epitopes [53,54]. The accessibility of side chains could be reduced as a result of mutations to small side chain amino acids, resulting in a reduction in antigenicity. According to the SDM server and Discovery studio results, the most reduction in residues accessibility was observed in R149A (Table 3). However, following mutation, the N146V mutant revealed the most accessible residues among the others.
Furthermore, after evaluating the attributes of point mutations, we opted to create a PAM model by combining all point mutations into a single model. As a result, the Galaxy server predicted and refined the favored model of PAM. A final model’s validation scores corresponded to permissible values across all validation servers (Supplementary Tables S5 and S6). Subsequently, it was discovered that there was a remarkable reduction in the number of shared Immunogenic residues by using servers computing conformational B-cell epitopes. Although certain residues remained immunogenic, no residues were found to be shared by all of the servers (data not shown). Therefore, it could be concluded that the most immunogenic epitopes were successfully eliminated in the PAM model.

3.5. Molecular Docking

Molecular docking and molecular dynamic modeling were used to ensure that mutations had no effect on the protein’s function. It was essential to obtain protein and ligand complexes to operate the MD simulation. Therefore, molecular docking was exploited initially by AutoDock Vina. This software uses a flexible docking algorithm based on Monte Carlo simulated dockings [37]. Docking findings revealed that approximately all ten residues of either wild type or mutants having a function at active site (based on homology to other type 2 RIPs) were involved in interacting with the CGAGAG ligand, even though all mutated amino acids did not contribute in interaction with ligand (supplementary Table S7). More precisely, in the N146V docking result, all predicted residues in the active site interacted with CGAGAG, and Q121A docking output represented the least contribution in having interaction with ligand by participating seven amino acids out of ten in the interaction process. Pulchellin belongs to the family of rRNA N-glycosylases, and it has been documented that the A-chain of type 2 RIPs cleaves a single adenine base in the GAGA loop [55]. Olson employed CGAGAG sequence as a ligand for interacting with Ricin in part of a research. They demonstrated that using oligonucleotide ligand rather than just adenine is more accurate [56]. As a result, the current investigation adopted CGAGAG oligonucleotide as a ligand. In addition to PAC, we also used the A-chain of Abrin-A (1ABR) as the control for two reasons; first, it is classified as rRNA N- glycosylase, same as pulchellin, and as opposed to pulchellin, the crystallography structure of Abrin-A RIP has been released on Protein Data Bank server. We were able to discover critical interactions between the binding site of receptors and the ligand, including hydrogen bonds, π-π interactions, and π-sigma interactions, by exploiting the Discovery studio visualizer. Table 4 exhibits the number of several forms of interaction. According to these findings, T82A formed the maximum number of hydrogen bonds (21 H-bonds) compared to PAC, which had 7 bonds. There were no ligand-receptor π-π interactions in PAC or Q121A whereas, D101V and R149A disclosed the greatest number (six π-π interactions). The highest number of π-interactions was reported by N146V with 8 and D147A did not form any π-Sigma interaction with ligand. By and large, practically every mutant revealed that they can interact with ligands appropriately. Besides, in comparison to other mutants and Abrin-A, PAM demonstrated an acceptable number of interactions with ligand, suggesting that it would be a promising mutant for use in the next experimental work. Although molecular docking offers valuable data, it might be insufficient to screen mutants. Therefore, MD simulation was used to evaluate the attributes of mutants more precisely by utilizing RMSD, gyrate, H-bonds, and binding energies.

3.6. Molecular Dynamic Simulation

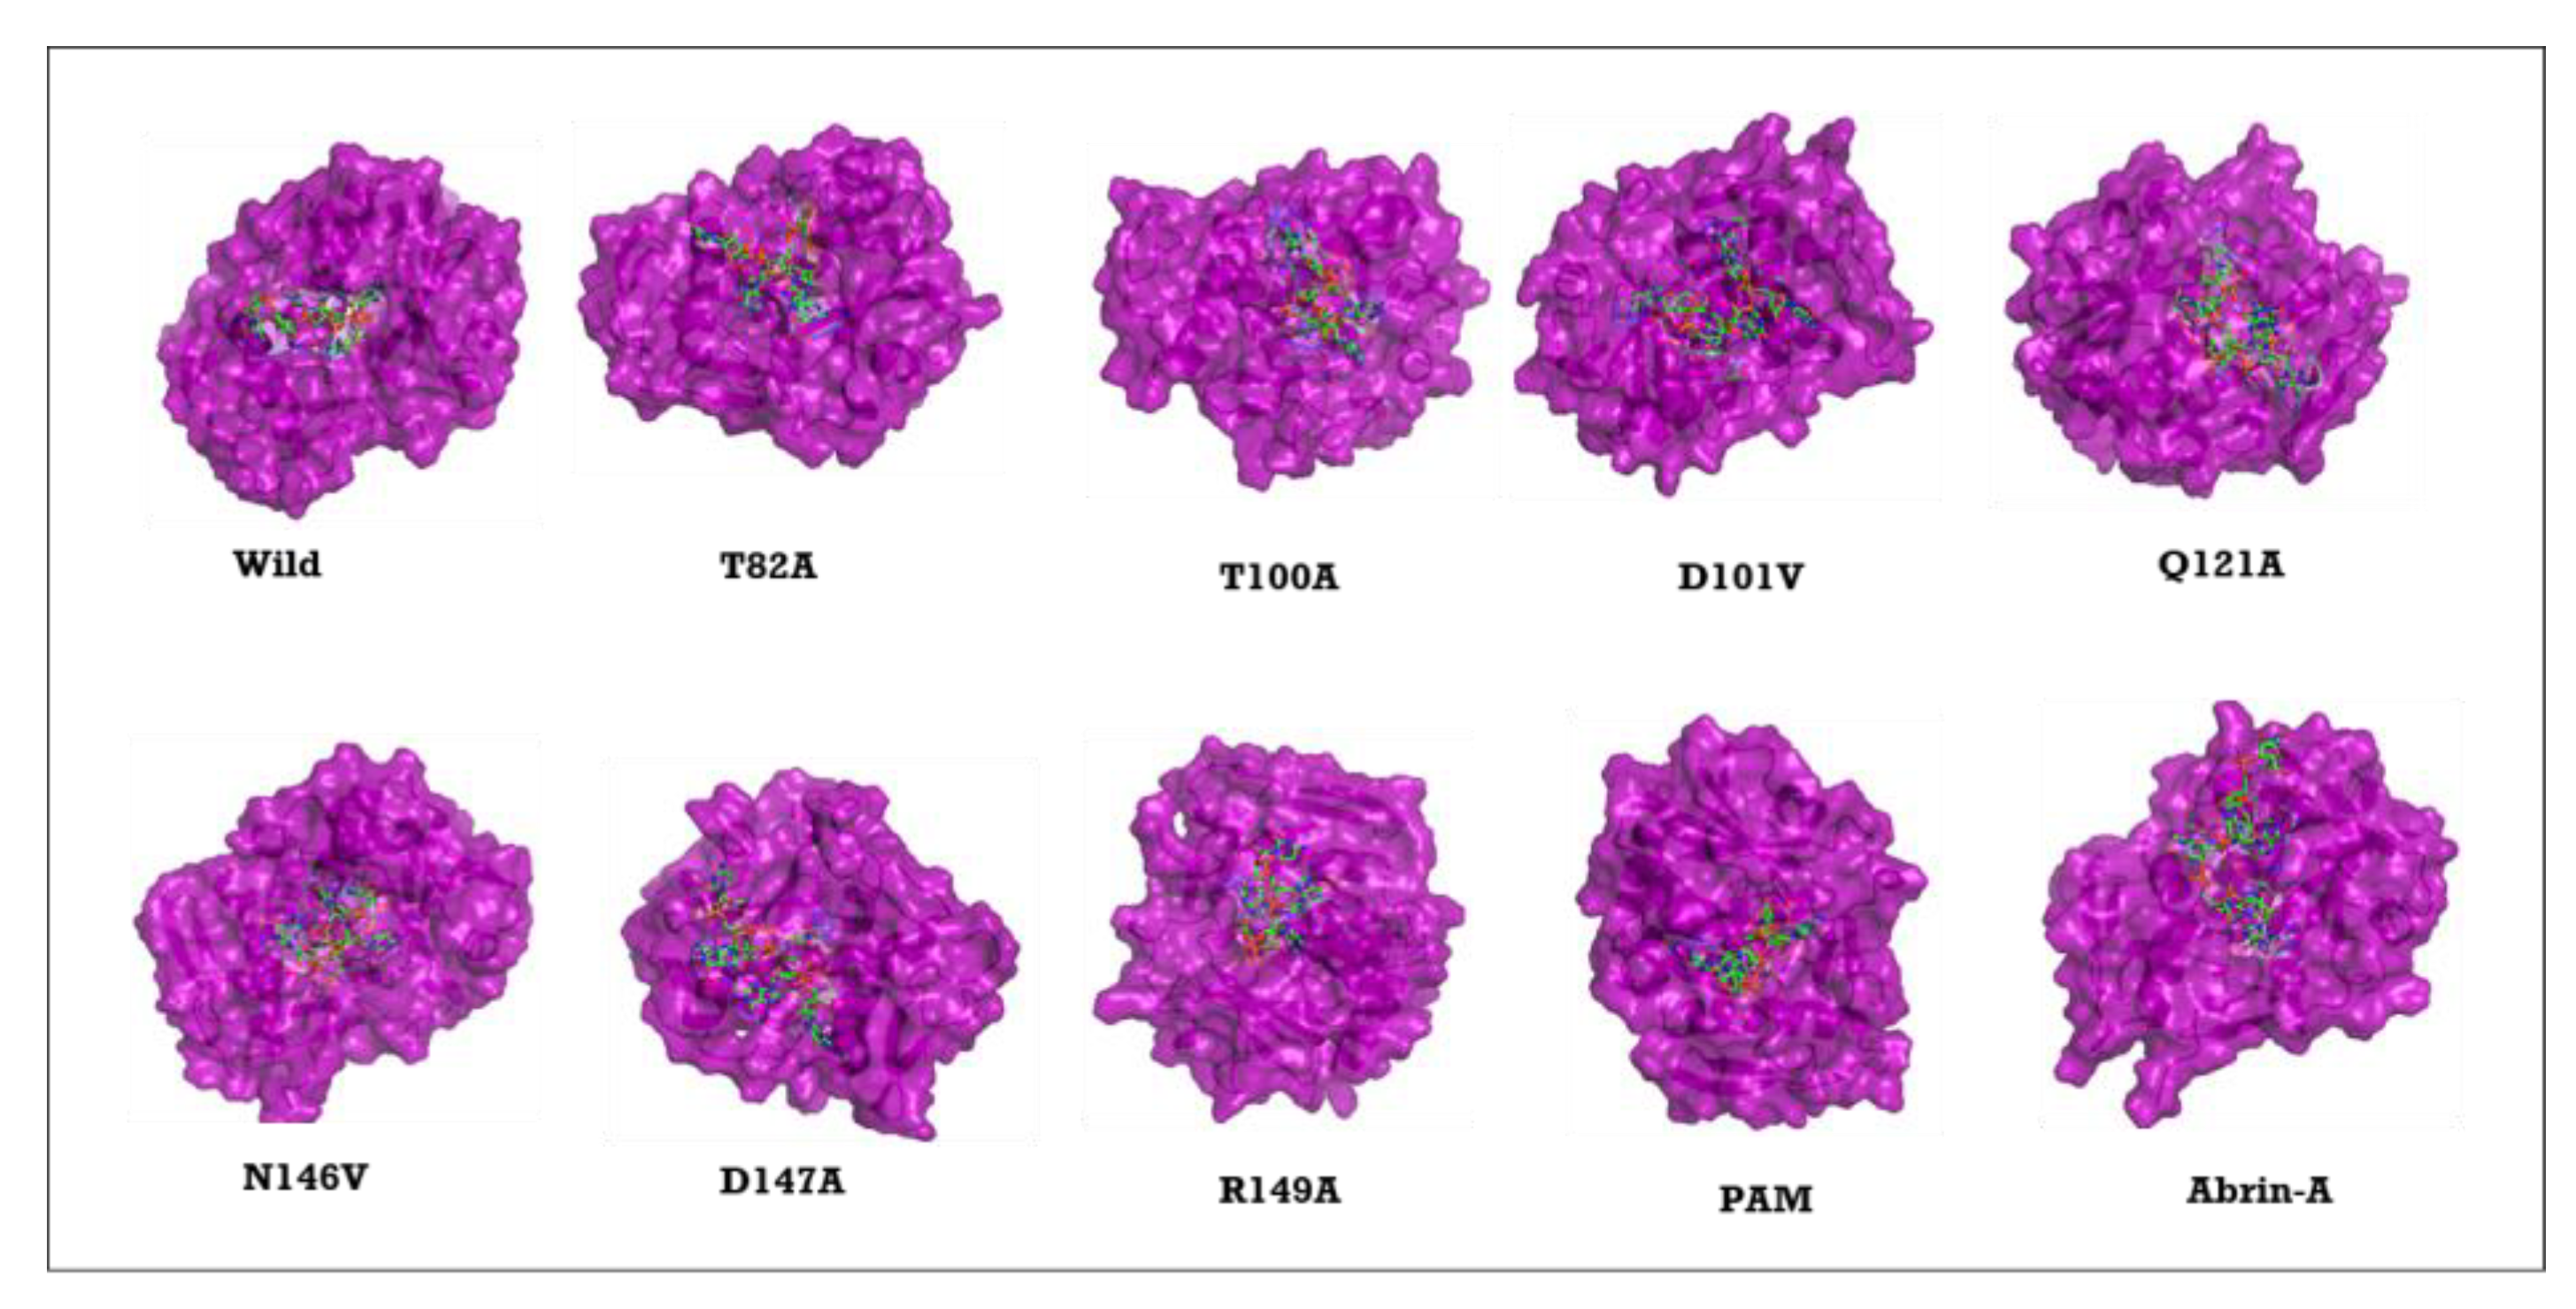
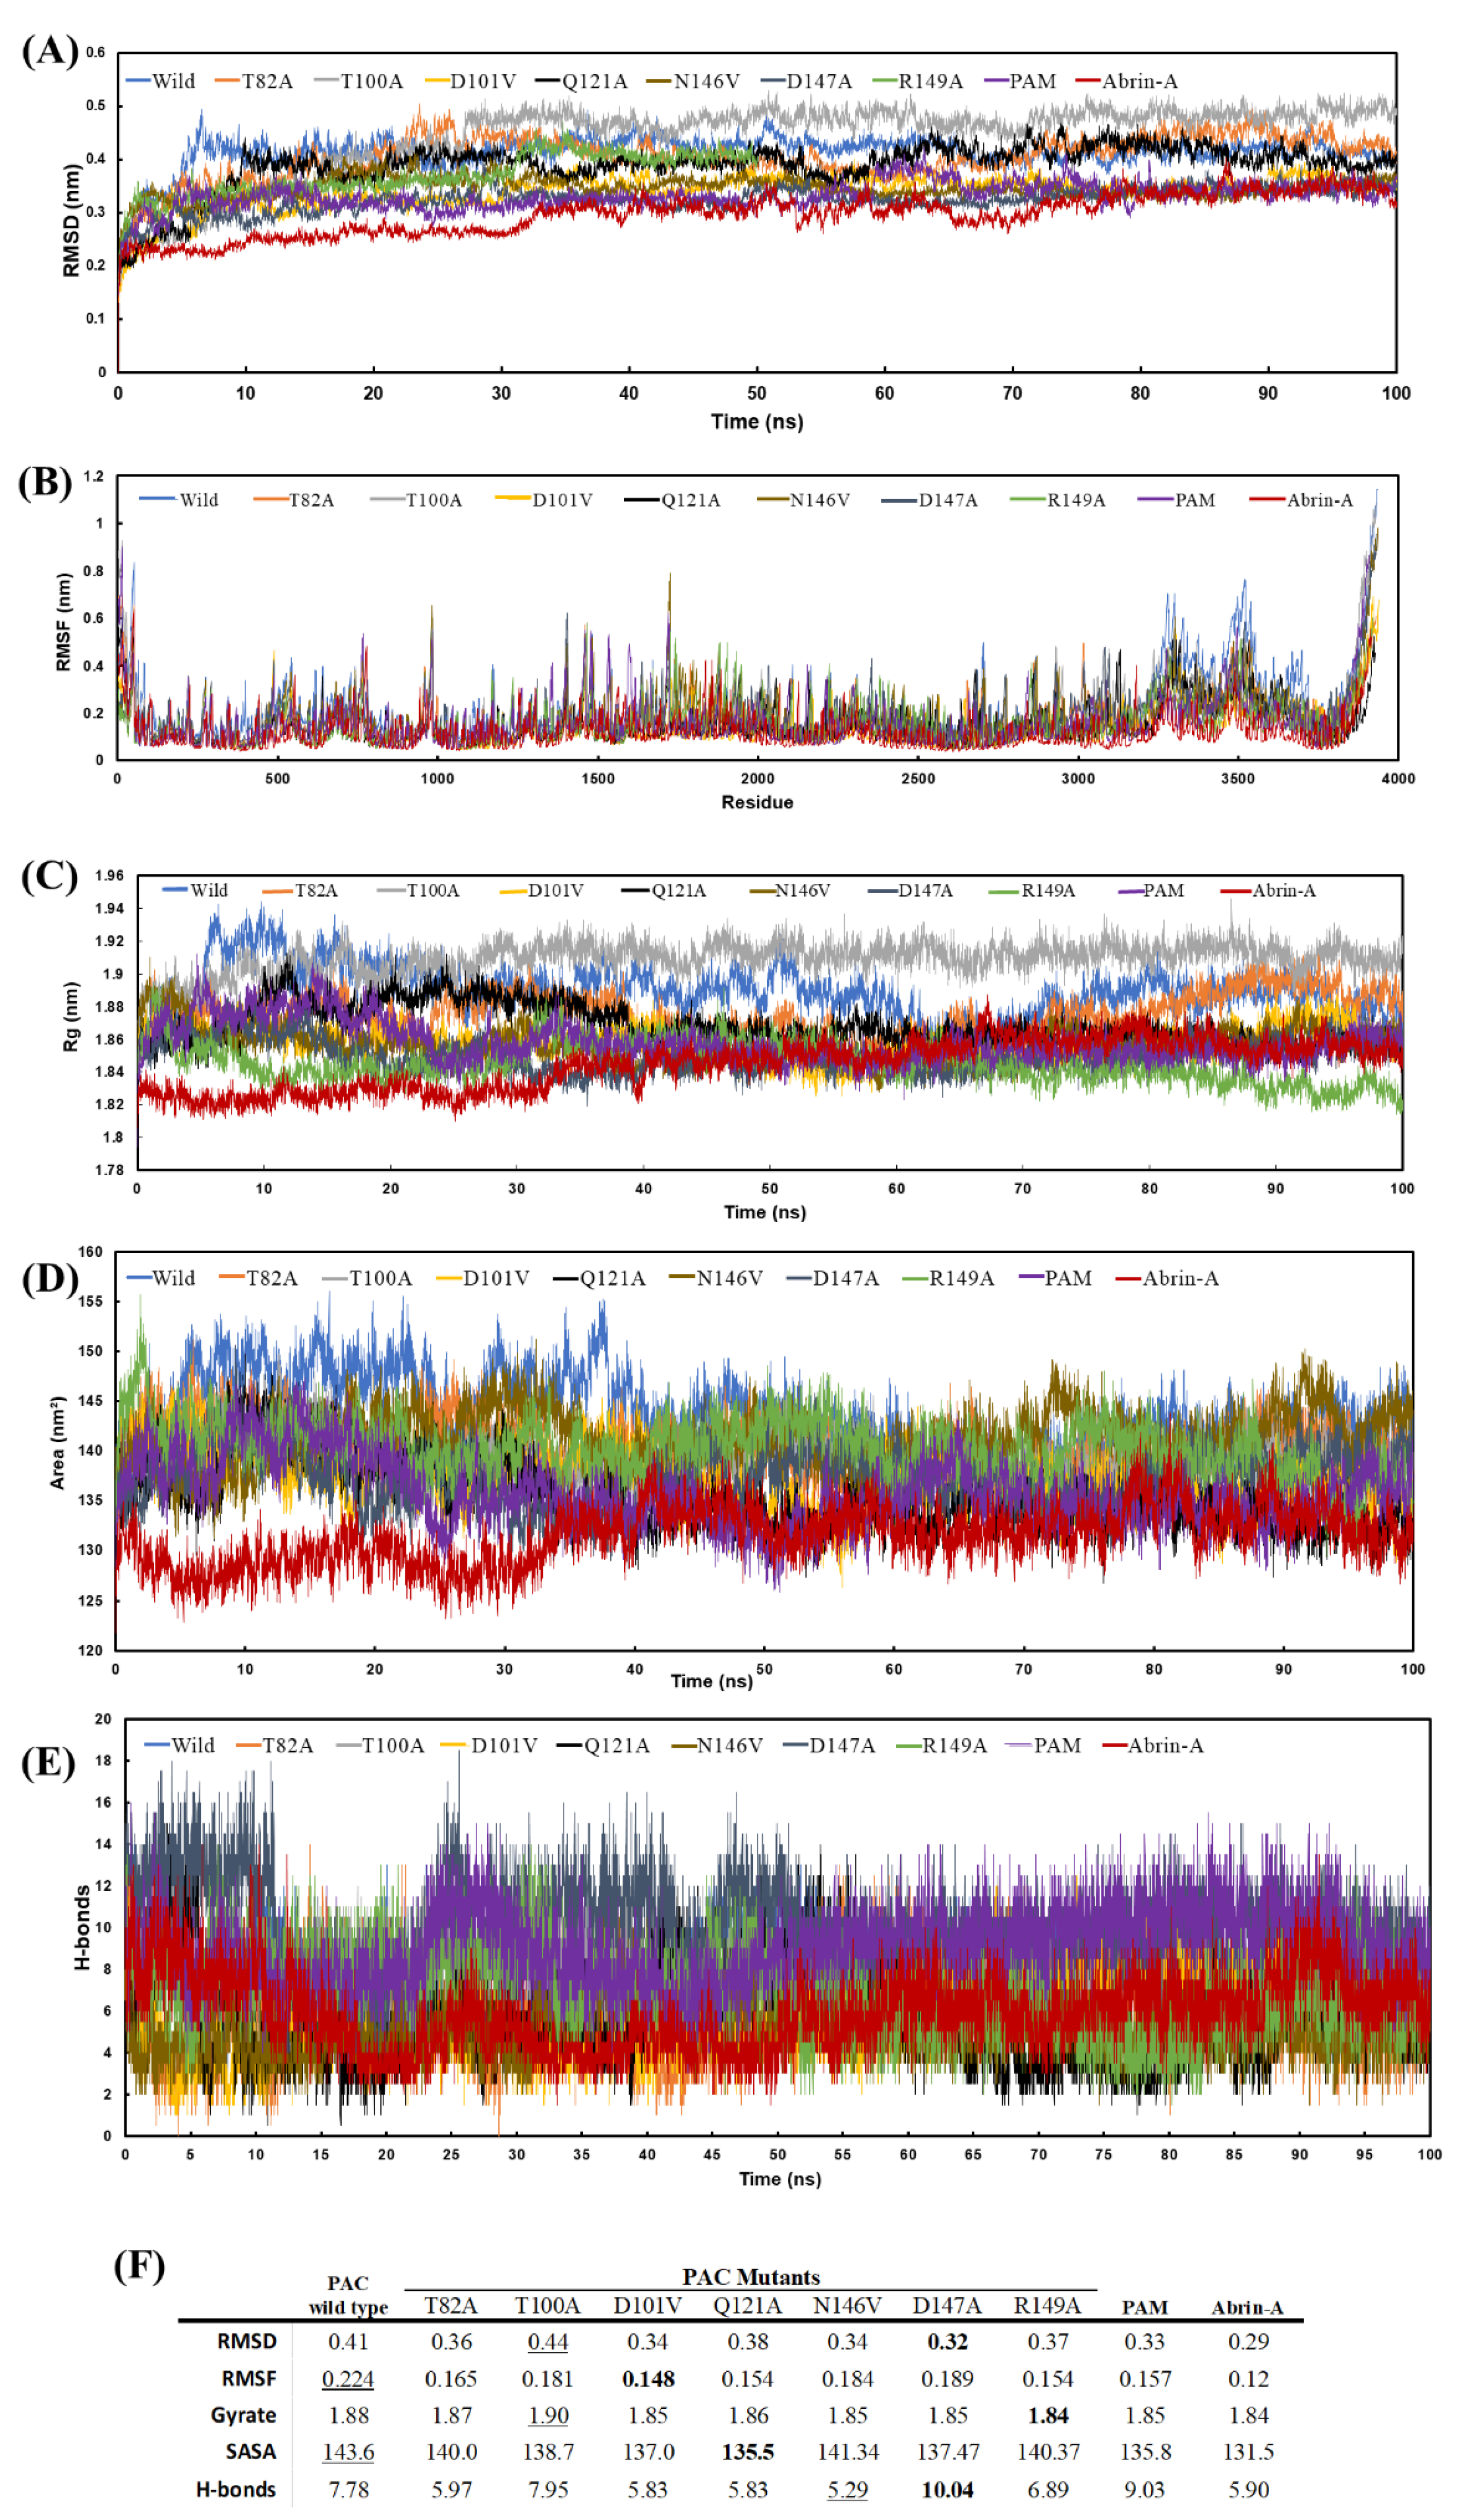
In the next step, MD simulation was performed to evaluate some main dynamic trajectories, including RMSD, RMSF, Rg, SASA, and hydrogen bonding of docked complexes. The last frame of each protein-ligand complex obtained from MD simulations is shown in Figure 4. To get more insights into mutant MD results, the simulations of PAC wild type and Abrin-A in complexes with ligand were performed simultaneously. Each toxin-ligand complex’s simulation parameters and plot are described as average values (Figure 5).
The spatial variation of mutants and wild type in the presence of Abrin-A was investigated using RMSD and RMSF. Attempting to assess the level of stability to examine the flexibility of the backbone structure of mutants or toxins, the RMSD of protein-ligand complexes was computed against their original structure. Protein structure would possess high stability when the RMSD value is in its minimum amount. After about five nanoseconds of simulation, the RMSD of mutants and toxins in the complex with CGAGAG begins to stabilize, according to the results. During the 100 ns MD simulation, there was no significant variation in the RMSDs, indicating that all complexes were consistent. D147A disclosed the least RMSD (0.32) among all mutants and wild type toxins, indicating excellent stability. Following that, the RMSF of protein portion in all complexes was determined to quantify residual flexibility over MD simulation. Except for wild type, N146V and D147A which residues showed RMSF value over 6 Å at some spots, almost all protein residues in all mutants revealed no considerable variation in the residual level. Average fluctuations of mutants’ residues were observed to be diminished upon ligand binding compared to wild type, which indicates that mutations not only did not disrupt the toxin stability but lowered the residual fluctuations. Moreover, the behavior of wildtype and mutant residues fluctuated similarly to that of Abrin-A. Kandasamy et al. evaluated the residual flexibility and stability of the Protein-ligand combination using RMSD and RMSF. They demonstrated that the lower value of these two factors is close associated with the higher stability of the complexes [57]. Additionally, in complex with CGAGAG, PAM demonstrated acceptable RMSF value and revealed a similar RMSD rate to Abrin-A. This result could bring about promising hope for using PAM model for in vitro application.
The solvent-accessible surface area and radius of gyration of mutants were determined to analyze their intactness. The SASA was estimated by measuring the whole area of the protein surface, and the radius of gyration was calculated by measuring the distance between the protein’s center of mass and both termini. A significant variation in these values implies that the protein structure has been disrupted. Tjoa et al. employed SASA and Rg parameters to evaluate the compactness of mutants compared to wild type in the MD simulation section of their investigation. They revealed less structural change, reflecting greater conformational tightness [58]. In this study, during 100 ns MD simulation, substantial variations were not observed in the SASA and Rg values of mutants or toxins when they bind to ligand.
When SASA and Rg values are compared between wildtype and point mutation model complexes, it is evident that they are comparable. Furthermore, these values are strikingly similar in Abrin-A and PAM model, suggesting that a model of pulchellin containing all mutations could be a good choice for creating immunotoxin.
MD simulations estimated the hydrogen bonds within 0.35 nm between mutations or toxins and ligand in a solvent setting to further confirm the docked complexes’ stability. The directionality and specificity of contact provided by hydrogen bonding between proteins and molecules are critical for molecular recognition [59]. According to the H-bond results, D147A created the most H-bonds, with an average of 9–11 H-bonds, as opposed to N146V, which formed the fewest H-bonds (average of 4–6). Additionally, the average number of H-bonds created in the PAM was greater than in the Abrin-A complex, demonstrating further confirmation of PAM validity.

3.7. Estimation of Binding Free Energy

The MM-PBSA method was utilized to more thoroughly describe the energy behavior of mutants in complex with CGAGAG. To comprehend the interactions between proteins and ligands, the Molecular Mechanics Poisson-Boltzmann Surface Area method has been extensively used and is regarded as a reputable free energy simulation technique [60]. The binding free energy was calculated by employing the gmx_MMPBSA to compute the latest 500 snapshots of each protein-ligand complex.
The binding free energy was calculated using this formula:
Δ G bind = Δ G complex Δ G protein Δ G ligand
where Δ G bind represents the binding free energy, Δ G complex (free energy of complex), Δ G protein (free energy of protein), and Δ G ligand (free energy of ligand).
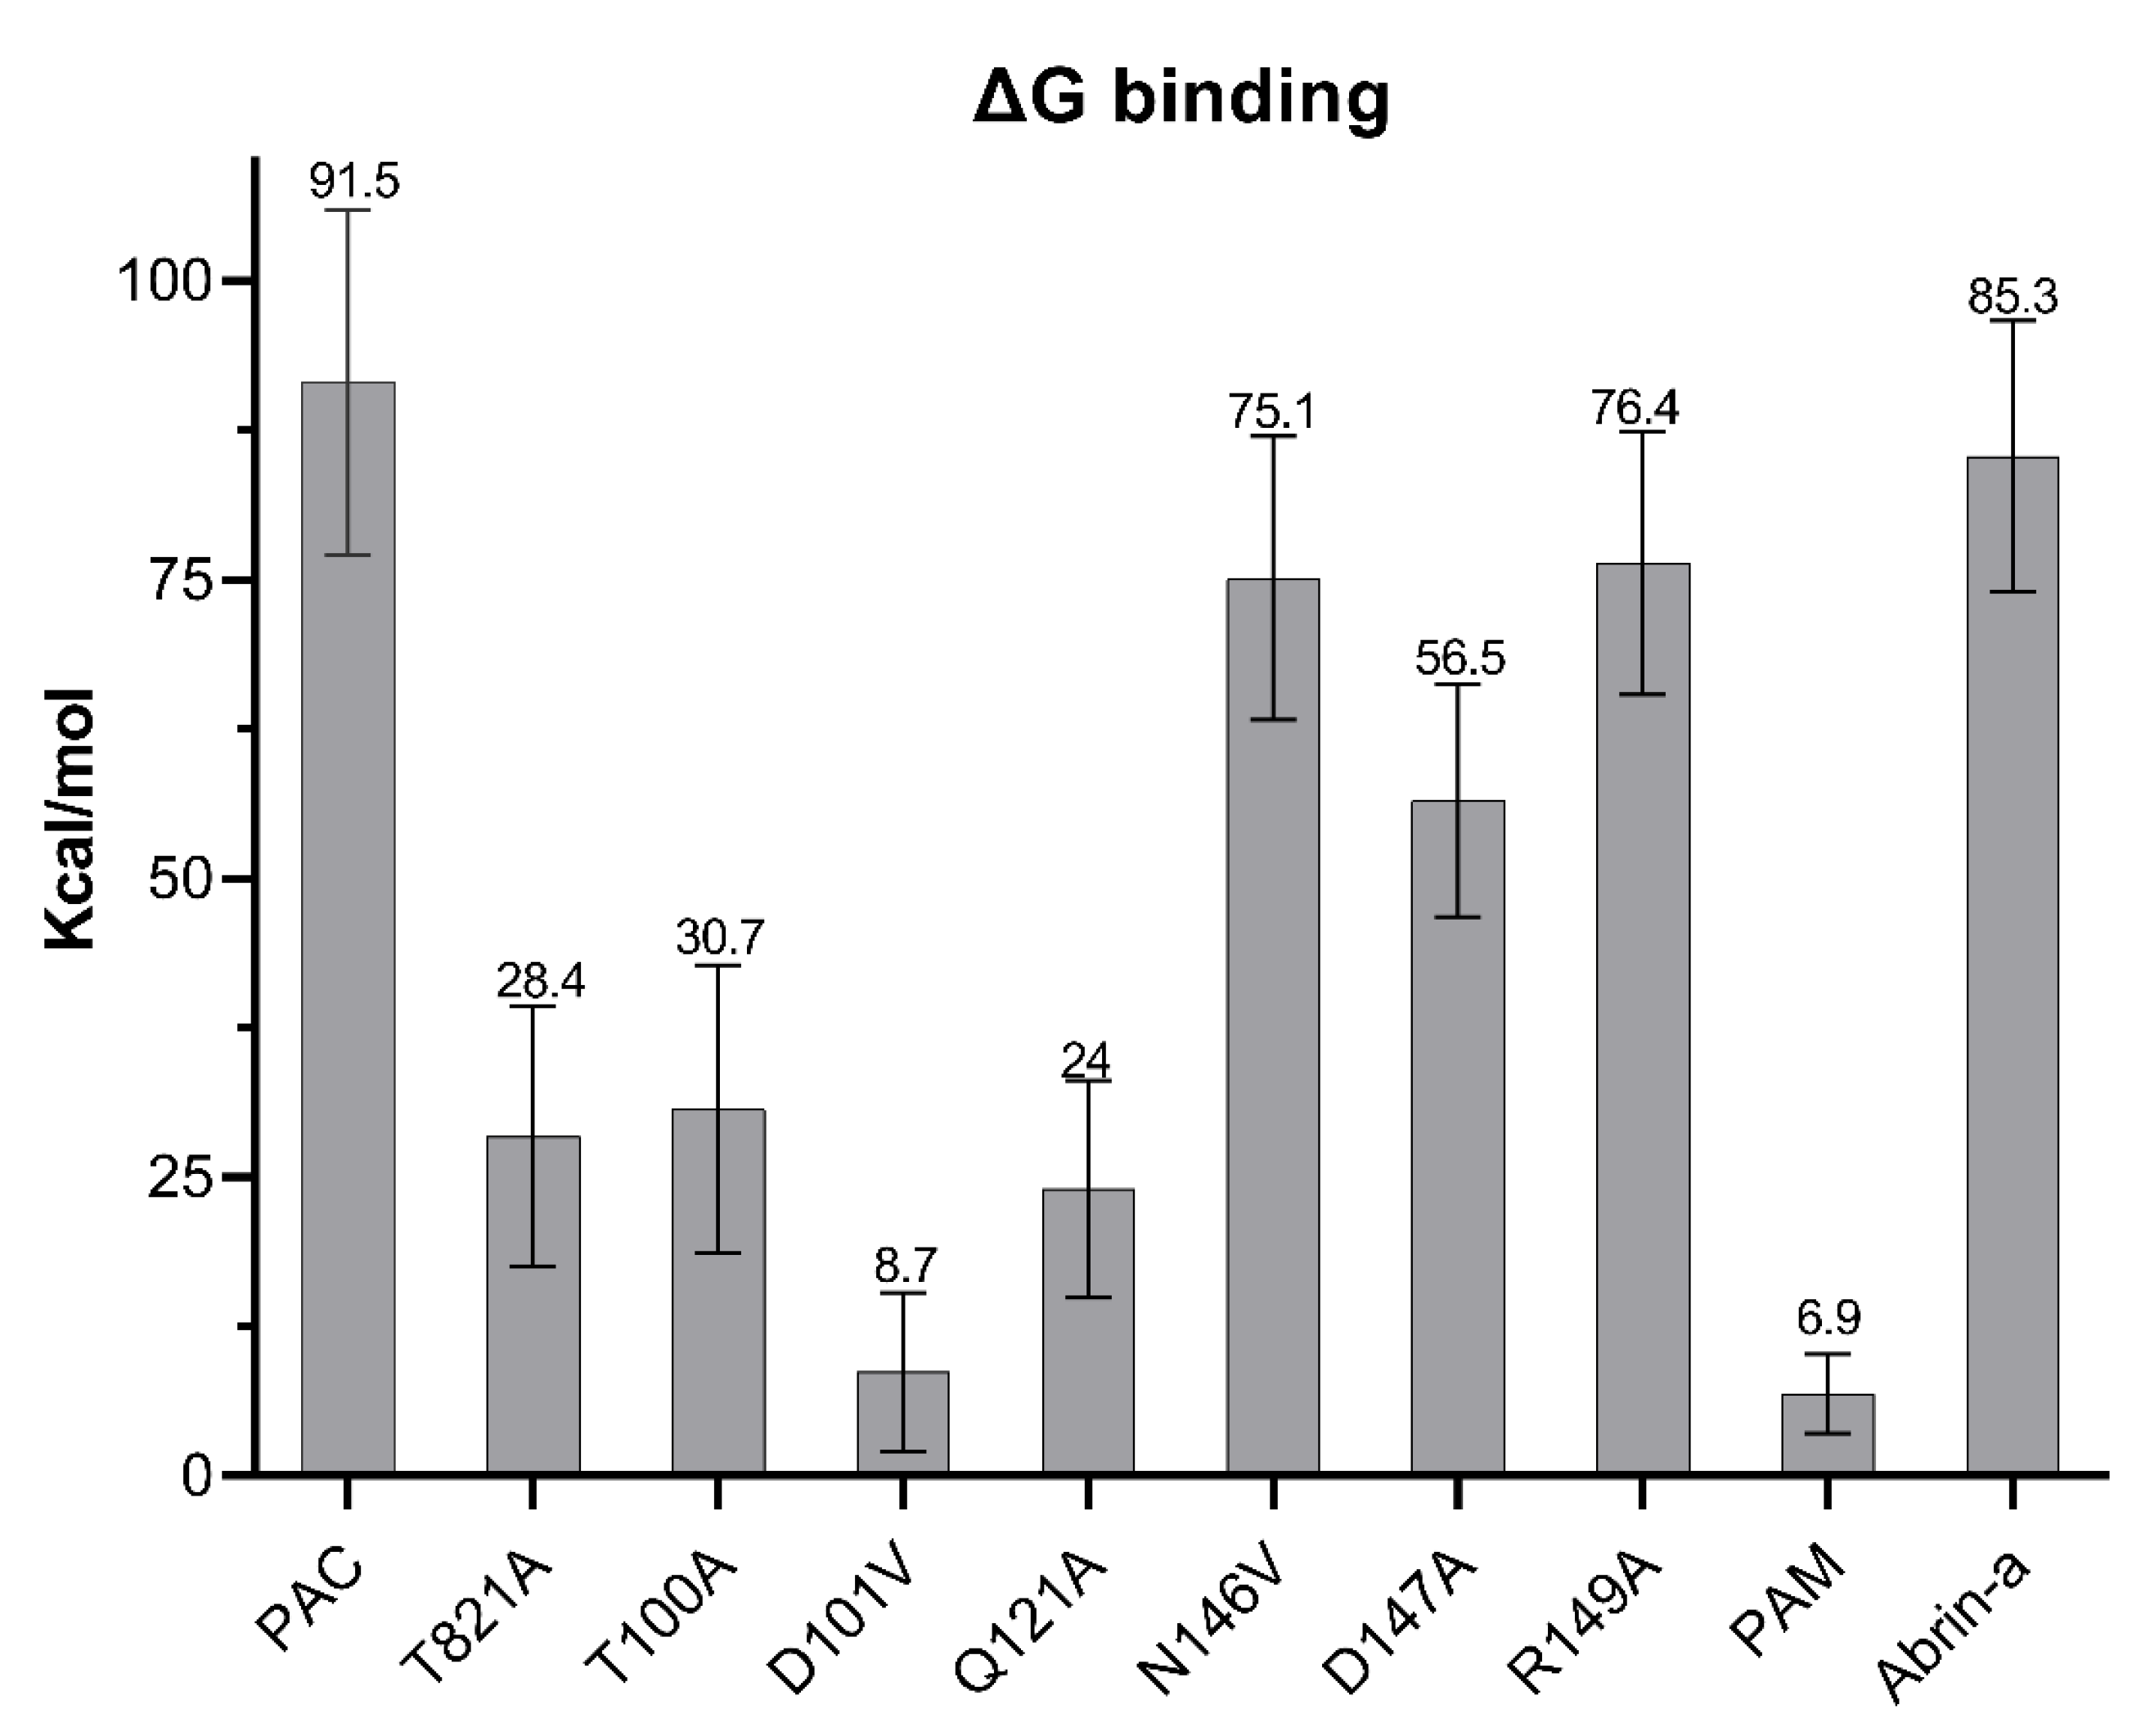
Comparing PAC and PAM, PAC has a greater Δ G bind quantity, suggesting a weaker interaction with CGAGAG, whereas PAM has the lowest Δ G bind values, reflecting the strongest ligand affinity among the mutants (Figure 6). The fact that all complexes showed a positive quantity of G bind which could be due to the large structure of the ligand involved in the complex.

4. Conclusions

In conclusion, utilizing in silico approaches could eliminate B-cell epitopes, resulting in less immunogenic ITs. Here, the immunogenic portions of pulchellin were identified using in silico analysis of conformational B cell epitopes, and these regions were then substituted with less immunogenic residues to generate seven mutants. Once mutants were obtained, their properties, such as immunogenicity, stability, and ligand binding, were assessed. The toxin candidate containing all mutations (PAM model) has the maximum stability and the lowest immunogenic areas, which makes it a promising candidate for experimental development. It should be highlighted that this study, based on in silico methodologies proposing potential models, could serve as a foundation for a larger project and calls for being supported by experimental validations.

Supplementary Materials

The following supporting information can be downloaded at: https://www.mdpi.com/article/10.3390/j6010006/s1. Table S1. Evaluation of 3D structure models of PAC by Verify 3D, ERRAT, ProSAWEB, and Ramachandran Plot. Galaxy model 4 was chosen for refinement process. Table S2. Validation scores of Galaxy Model after refinement. Selected model 2 of refinement obtained the highest validation score. Table S3. Conformational B-cell epitope scores and SDM2 results of all potential mutants. Table S4. Validation scores of wild type and mutants form of PAC. Mutant models were obtained from SDM2 server. Table S5. Evaluation of 3D structure of a pulchellin containing all mutations model with Verify 3D, ERRAT, ProSAWEB, and Ramachandran Plot. Table S6. Validation scores of PAM model after refinement. Model 3 of refinement was selected due to the highest validation score. Table S7. Pulchellin interaction amino acids (wild type and mutants) in the docking process. Residues of active site in N146V contributed the most, while Q121A contributed the least in docking process. Highlight amino acids indicate shared active site residues between homology prediction and molecular docking.

Author Contributions

M.S., R.M., L.F., O.C.-M. and G.C.-M. conceptualized and wrote the main manuscript text and prepared figures. F.E.G.G., R.S.D. and M.S. designed and performed the MD experiments. R.S.D., M.S. and R.M. designed and performed the bioinformatic analyzes. M.S., R.M., O.C.-M. and G.C.-M. supervised the study. All authors reviewed and edited the manuscript. All authors have read and agreed to the published version of the manuscript.

Funding

The authors acknowledge the support provided by: 2013/07276-1 (CEPOF–CEPID Program), 2019/14526-0, and 2020/05146-7 (G. Cabral-Miranda, JP FAPESP); FAPESP grants: 2018/18886-9, 2020/01688-0 and 2020/07069-0 to OCM.

Institutional Review Board Statement

Not applicable.

Informed Consent Statement

Not applicable.

Data Availability Statement

Data sharing not applicable.

Acknowledgments

We thank Seth Pincus for his supports and suggestions in the Department of Chemistry and Biochemistry, Montana State University, Bozeman, MT.

Conflicts of Interest

The authors declare no conflict of interest.

Abbreviations

ITImmunotoxin
MDMolecular Dynamic
PACPulchellin A-chain
PAMPulchellin containing All Mutations
RIPRibosome Inactivating Protein

References

  1. Zhu, F.; Zhou, Y.K.; Ji, Z.L.; Chen, X.R. The Plant Ribosome-Inactivating Proteins Play Important Roles in Defense against Pathogens and Insect Pest Attacks. Front. Plant Sci. 2018, 9, 146. [Google Scholar] [CrossRef] [Green Version]
  2. Tumer, N.E. Introduction to the toxins special issue on plant toxins. Toxins 2015, 7, 4503–4506. [Google Scholar] [CrossRef] [Green Version]
  3. Antignani, A.; Fitzgerald, D. Immunotoxins: The role of the toxin. Toxins 2013, 5, 1486–1502. [Google Scholar] [CrossRef] [Green Version]
  4. Silva, A.L.; Goto, L.S.; Dinarte, A.R.; Hansen, D.; Moreira, R.A.; Beltramini, L.M.; Araujo, A.P. Pulchellin, a highly toxic type 2 ribosome-inactivating protein from Abrus pulchellus. Cloning heterologous expression of A-chain and structural studies. FEBS J. 2005, 272, 1201–1210. [Google Scholar] [CrossRef]
  5. Sadraeian, M.; Honari, H.; Madanchi, H.; Hesaraki, M. Extraction, Cloning and Expression of RTB, as a vaccine adjuvant/carrier, in E. coli and production of mouse polyclonal antibody (Anti-B chain Abs). Iran. J. Pharm. Sci. 2011, 7, 247–254. [Google Scholar]
  6. Sadraeian, M.; Rasoul-Amini, S.; Mansoorkhani, M.J.; Mohkam, M.; Ghoshoon, M.B.; Ghasemi, Y. Induction of antitumor immunity against cervical cancer by protein HPV-16 E7 in fusion with ricin B chain in tumor-bearing mice. Int. J. Gynecol. Cancer 2013, 23, 809–814. [Google Scholar] [CrossRef]
  7. Qin, S.; Zhou, H.-X. Dissection of the high rate constant for the binding of a ribotoxin to the ribosome. Proc. Natl. Acad. Sci. USA 2009, 106, 6974–6979. [Google Scholar] [CrossRef] [Green Version]
  8. Castilho, P.V.; Goto, L.S.; Roberts, L.M.; Araujo, A.P. Isolation and characterization of four type 2 ribosome inactivating pulchellin isoforms from Abrus pulchellus seeds. FEBS J. 2008, 275, 948–959. [Google Scholar] [CrossRef]
  9. Mazor, R.; Onda, M.; Pastan, I. Immunogenicity of therapeutic recombinant immunotoxins. Immunol. Rev. 2016, 270, 152–164. [Google Scholar] [CrossRef] [Green Version]
  10. Sadraeian, M.; Guimaraes, F.E.G.; Araujo, A.P.U.; Worthylake, D.K.; LeCour, L.J.; Pincus, S.H. Selective cytotoxicity of a novel immunotoxin based on pulchellin A chain for cells expressing HIV envelope. Sci. Rep. 2017, 7, 7579. [Google Scholar] [CrossRef] [Green Version]
  11. Kreitman, R.J.; Pastan, I. Antibody fusion proteins: Anti-CD22 recombinant immunotoxin moxetumomab pasudotox. Clin. Cancer Res. 2011, 17, 6398–6405. [Google Scholar] [CrossRef] [PubMed]
  12. Wawrzynczak, E.J.; Watson, G.J.; Cumber, A.J.; Henry, R.V.; Parnell, G.D.; Rieber, E.P.; Thorpe, P.E. Blocked and non-blocked ricin immunotoxins against the CD4 antigen exhibit higher cytotoxic potency than a ricin A chain immunotoxin potentiated with ricin B chain or with a ricin B chain immunotoxin. Cancer Immunol. Immunother. 1991, 32, 289–295. [Google Scholar] [CrossRef] [PubMed]
  13. Onda, M.; Beers, R.; Xiang, L.; Nagata, S.; Wang, Q.C.; Pastan, I. An immunotoxin with greatly reduced immunogenicity by identification and removal of B cell epitopes. Proc. Natl. Acad. Sci. USA 2008, 105, 11311–11316. [Google Scholar] [CrossRef] [Green Version]
  14. Pincus, S.H.; Smallshaw, J.E.; Song, K.; Berry, J.; Vitetta, E.S. Passive and active vaccination strategies to prevent ricin poisoning. Toxins 2011, 3, 1163–1184. [Google Scholar] [CrossRef] [Green Version]
  15. Flavell, D.J. Countering immunotoxin immunogenicity. Br. J. Cancer 2016, 114, 1177–1179. [Google Scholar] [CrossRef] [Green Version]
  16. Du, L.; Tai, W.; Yang, Y.; Zhao, G.; Zhu, Q.; Sun, S.; Liu, C.; Tao, X.; Tseng, C.K.; Perlman, S.; et al. Introduction of neutralizing immunogenicity index to the rational design of MERS coronavirus subunit vaccines. Nat. Commun. 2016, 7, 13473. [Google Scholar] [CrossRef] [Green Version]
  17. Malaei, F.; Hesaraki, M.; Saadati, M.; Ahdi, A.M.; Sadraeian, M.; Honari, H.; Nazarian, S. Immunogenicity of a new recombinant IpaC from Shigella dysenteriae type I in guinea pig as a vaccine candidate. Iran. J. Immunol. 2013, 10, 110–117. [Google Scholar]
  18. Grinberg, Y.; Benhar, I. Addressing the Immunogenicity of the Cargo and of the Targeting Antibodies with a Focus on Demmunized Bacterial Toxins and on Antibody-Targeted Human Effector Proteins. Biomedicines 2017, 5, 28. [Google Scholar] [CrossRef] [Green Version]
  19. Hu, X.; Zhang, M.; Zhang, C.; Long, S.; Wang, W.; Yin, W.; Cao, Z. Removal of B-cell epitopes for decreasing immunogenicity in recombinant immunotoxin against B-cell malignancies. J. BUON 2016, 21, 1374–1378. [Google Scholar]
  20. Ko, J.; Park, H.; Heo, L.; Seok, C. GalaxyWEB server for protein structure prediction and refinement. Nucleic Acids Res. 2012, 40, W294–W297. [Google Scholar] [CrossRef]
  21. Wang, Y.; Virtanen, J.; Xue, Z.; Zhang, Y. I-TASSER-MR: Automated molecular replacement for distant-homology proteins using iterative fragment assembly and progressive sequence truncation. Nucleic Acids Res. 2017, 45, W429–W434. [Google Scholar] [CrossRef]
  22. Kelley, L.A.; Mezulis, S.; Yates, C.M.; Wass, M.N.; Sternberg, M.J. The Phyre2 web portal for protein modeling, prediction and analysis. Nat. Protoc. 2015, 10, 845–858. [Google Scholar] [CrossRef] [Green Version]
  23. Källberg, M.; Wang, H.; Wang, S.; Peng, J.; Wang, Z.; Lu, H.; Xu, J. Template-based protein structure modeling using the RaptorX web server. Nat. Protoc. 2012, 7, 1511–1522. [Google Scholar] [CrossRef]
  24. Bienert, S.; Waterhouse, A.; de Beer, T.A.; Tauriello, G.; Studer, G.; Bordoli, L.; Schwede, T. The SWISS-MODEL Repository—New features and functionality. Nucleic Acids Res. 2017, 45, D313–D319. [Google Scholar] [CrossRef] [Green Version]
  25. Eisenberg, D.; Lüthy, R.; Bowie, J.U. [20] VERIFY3D: Assessment of protein models with three-dimensional profiles. In Methods in Enzymology; Elsevier: Amsterdam, The Netherlands, 1997; Volume 277, pp. 396–404. [Google Scholar]
  26. Colovos, C.; Yeates, T.O. Verification of protein structures: Patterns of nonbonded atomic interactions. Protein Sci. 1993, 2, 1511–1519. [Google Scholar] [CrossRef] [Green Version]
  27. Wiederstein, M.; Sippl, M.J. ProSA-web: Interactive web service for the recognition of errors in three-dimensional structures of proteins. Nucleic Acids Res. 2007, 35, W407–W410. [Google Scholar] [CrossRef] [Green Version]
  28. Laskowski, R.A.; MacArthur, M.W.; Moss, D.S.; Thornton, J.M. PROCHECK: A program to check the stereochemical quality of protein structures. J. Appl. Crystallogr. 1993, 26, 283–291. [Google Scholar] [CrossRef]
  29. Lee, G.R.; Won, J.; Heo, L.; Seok, C. GalaxyRefine2: Simultaneous refinement of inaccurate local regions and overall protein structure. Nucleic Acids Res. 2019, 47, W451–W455. [Google Scholar] [CrossRef] [PubMed]
  30. Liang, S.; Zheng, D.; Standley, D.M.; Yao, B.; Zacharias, M.; Zhang, C. EPSVR and EPMeta: Prediction of antigenic epitopes using support vector regression and multiple server results. BMC Bioinform. 2010, 11, 381. [Google Scholar] [CrossRef] [Green Version]
  31. Kringelum, J.V.; Lundegaard, C.; Lund, O.; Nielsen, M. Reliable B cell epitope predictions: Impacts of method development and improved benchmarking. PLoS Comput. Biol. 2012, 8, e1002829. [Google Scholar] [CrossRef]
  32. Ponomarenko, J.; Bui, H.H.; Li, W.; Fusseder, N.; Bourne, P.E.; Sette, A.; Peters, B. ElliPro: A new structure-based tool for the prediction of antibody epitopes. BMC Bioinform. 2008, 9, 514. [Google Scholar] [CrossRef] [Green Version]
  33. Zhou, C.; Chen, Z.; Zhang, L.; Yan, D.; Mao, T.; Tang, K.; Qiu, T.; Cao, Z. SEPPA 3.0-enhanced spatial epitope prediction enabling glycoprotein antigens. Nucleic Acids Res. 2019, 47, W388–W394. [Google Scholar] [CrossRef] [PubMed]
  34. Fawcett, T. An introduction to ROC analysis. Pattern Recognit. Lett. 2006, 27, 861–874. [Google Scholar] [CrossRef]
  35. Glaser, F.; Pupko, T.; Paz, I.; Bell, R.E.; Bechor-Shental, D.; Martz, E.; Ben-Tal, N. ConSurf: Identification of functional regions in proteins by surface-mapping of phylogenetic information. Bioinformatics 2003, 19, 163–164. [Google Scholar] [CrossRef] [PubMed] [Green Version]
  36. Pandurangan, A.P.; Ochoa-Montano, B.; Ascher, D.B.; Blundell, T.L. SDM: A server for predicting effects of mutations on protein stability. Nucleic Acids Res. 2017, 45, W229–W235. [Google Scholar] [CrossRef] [Green Version]
  37. Morris, G.M.; Huey, R.; Lindstrom, W.; Sanner, M.F.; Belew, R.K.; Goodsell, D.S.; Olson, A.J. AutoDock4 and AutoDockTools4: Automated docking with selective receptor flexibility. J. Comput. Chem. 2009, 30, 2785–2791. [Google Scholar] [CrossRef] [Green Version]
  38. Szewczak, A.A.; Moore, P.B.; Chang, Y.L.; Wool, I.G. The conformation of the sarcin/ricin loop from 28S ribosomal RNA. Proc. Natl. Acad. Sci. USA 1993, 90, 9581–9585. [Google Scholar] [CrossRef] [Green Version]
  39. Hart, K.; Foloppe, N.; Baker, C.M.; Denning, E.J.; Nilsson, L.; MacKerell Jr, A.D. Optimization of the CHARMM additive force field for DNA: Improved treatment of the BI/BII conformational equilibrium. J. Chem. Theory Comput. 2012, 8, 348–362. [Google Scholar] [CrossRef] [Green Version]
  40. Zoete, V.; Cuendet, M.A.; Grosdidier, A.; Michielin, O. SwissParam: A fast force field generation tool for small organic molecules. J. Comput. Chem. 2011, 32, 2359–2368. [Google Scholar] [CrossRef]
  41. Lemkul, J. From proteins to perturbed hamiltonians: A suite of tutorials for the gromacs-2018 molecular simulation package [article v1. 0]. Living J. Comput. Mol. Sci. 2018, 1, 5068. [Google Scholar] [CrossRef]
  42. Valdés-Tresanco, M.S.; Valdés-Tresanco, M.E.; Valiente, P.A.; Moreno, E. gmx_MMPBSA: A new tool to perform end-state free energy calculations with GROMACS. J. Chem. Theory Comput. 2021, 17, 6281–6291. [Google Scholar] [CrossRef] [PubMed]
  43. Knodler, M.; Buyel, J.F. Plant-made immunotoxin building blocks: A roadmap for producing therapeutic antibody-toxin fusions. Biotechnol. Adv. 2021, 47, 107683. [Google Scholar] [CrossRef]
  44. De Groot, A.S.; Scott, D.W. Immunogenicity of protein therapeutics. Trends Immunol. 2007, 28, 482–490. [Google Scholar] [CrossRef] [PubMed]
  45. Price, M.; Petrakou, E.; Sekowski, M.; Murray, A. Immunogenicity of the hydrophilic region of the MUC1 mucin protein core. Oncol. Rep. 1997, 4, 337–339. [Google Scholar] [CrossRef] [PubMed]
  46. Ramya, L.; Pulicherla, K.K. Studies on deimmunization of antileukaemic L-asparaginase to have reduced clinical immunogenicity-an in silico approach. Pathol. Oncol. Res. 2015, 21, 909–920. [Google Scholar] [CrossRef]
  47. Cantor, J.R.; Panayiotou, V.; Agnello, G.; Georgiou, G.; Stone, E.M. Engineering reduced-immunogenicity enzymes for amino acid depletion therapy in cancer. Methods Enzym. 2012, 502, 291–319. [Google Scholar] [CrossRef]
  48. Sunita; Sajid, A.; Singh, Y.; Shukla, P. Computational tools for modern vaccine development. Hum. Vaccines Immunother. 2020, 16, 723–735. [Google Scholar] [CrossRef]
  49. Van Regenmortel, M.H. What is a B-cell epitope? Methods Mol. Biol. 2009, 524, 3–20. [Google Scholar] [CrossRef] [PubMed]
  50. Lo, Y.T.; Shih, T.C.; Pai, T.W.; Ho, L.P.; Wu, J.L.; Chou, H.Y. Conformational epitope matching and prediction based on protein surface spiral features. BMC Genom. 2021, 22, 116. [Google Scholar] [CrossRef]
  51. Lon, J.R.; Bai, Y.; Zhong, B.; Cai, F.; Du, H. Prediction and evolution of B cell epitopes of surface protein in SARS-CoV-2. Virol. J. 2020, 17, 165. [Google Scholar] [CrossRef]
  52. Devi, Y.D.; Goswami, H.B.; Konwar, S.; Doley, C.; Dolley, A.; Devi, A.; Chongtham, C.; Dowerah, D.; Biswa, V.; Jamir, L.; et al. Immunoinformatics mapping of potential epitopes in SARS-CoV-2 structural proteins. PLoS ONE 2021, 16, e0258645. [Google Scholar] [CrossRef] [PubMed]
  53. Chen, J.; Liu, H.; Yang, J.; Chou, K.C. Prediction of linear B-cell epitopes using amino acid pair antigenicity scale. Amino Acids 2007, 33, 423–428. [Google Scholar] [CrossRef] [PubMed]
  54. Jameson, B.A.; Wolf, H. The antigenic index: A novel algorithm for predicting antigenic determinants. Comput. Appl. Biosci. 1988, 4, 181–186. [Google Scholar] [CrossRef]
  55. Stirpe, F. Ribosome-inactivating proteins. Toxicon 2004, 44, 371–383. [Google Scholar] [CrossRef]
  56. Olson, M.A. Ricin A-chain structural determinant for binding substrate analogues: A molecular dynamics simulation analysis. Proteins 1997, 27, 80–95. [Google Scholar] [CrossRef]
  57. Kandasamy, T.; Sudhamalla, B.; Naskar, D. Designing of RNA aptamer against DNA binding domain of the glucocorticoid receptor: A response element-based in-silico approach. J. Biomol. Struct. Dyn. 2022, 40, 1120–1127. [Google Scholar] [CrossRef]
  58. Tjoa, S.E.E.; Vianney, Y.M.; Putra, S.E.D. In silico mutagenesis: Decreasing the immunogenicity of botulinum toxin type A. J. Biomol. Struct. Dyn. 2019, 37, 4767–4778. [Google Scholar] [CrossRef] [PubMed]
  59. Hubbard, R.E.; Haider, M.K. Hydrogen bonds in proteins: Role and strength. In Encyclopedia of Life Sciences (ELS); John Wiley & Sons, Ltd.: Hoboken, NJ, USA, 2010. [Google Scholar]
  60. Wang, C.; Greene, D.A.; Xiao, L.; Qi, R.; Luo, R. Recent developments and applications of the MMPBSA method. Front. Mol. Biosci. 2018, 4, 87. [Google Scholar] [CrossRef]
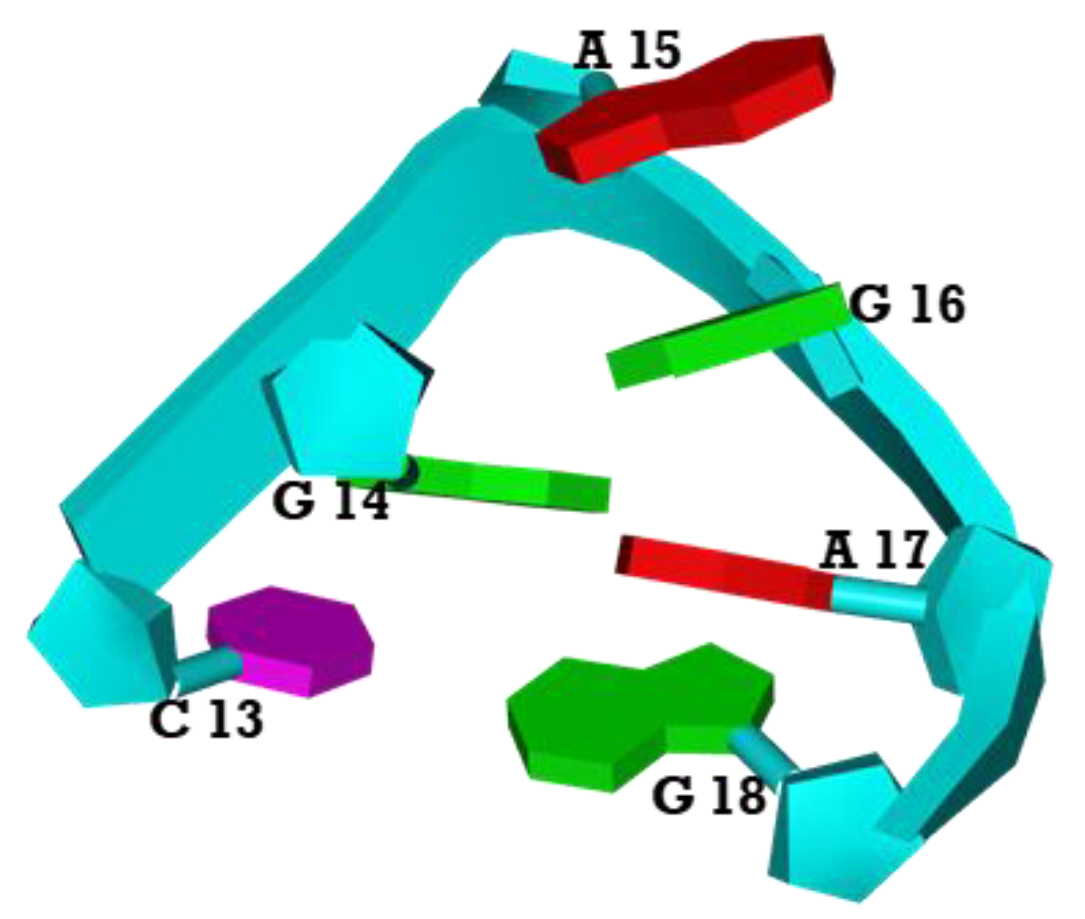
Figure 1. Ligand structure (CGAGAG) used in molecular docking. The hydrolysis of the adenine base of A15 in the loop region is catalyzed by the A-chain of type 2 RIPs.
J 06 00006 g001
Figure 2. Final model validation scores. (A) Verify 3D Plot showed 98.01% of the residues had an averaged 3D–1D score ≥ 0.2. (B) ERRAT plot reported 97.51 overall quality factor. Residues having an error value of less than 95% are in a desirable protein structure. Yellow and red lines represent portions of the 3D model that may be rejected at 95%and 99% confidence thresholds, respectively. (C) ProSA–web of final model earned a Z–score of −7.74. (D) Ramachandran plot represented 93.4% in favored (red), 6.1% in additionally allowed (yellow), and 0.4%.
J 06 00006 g002
Figure 3. Conformational B-cell PAC epitopes prediction (A) EPSVR server, and (B) DiscoTope server, (C) Ellipro server (D) SEPPA server. Yellow ball and stick shapes display high immunogen spots.
J 06 00006 g003
Figure 4. Complex structure of toxins or mutants with ligand (CGAGAG). Each snapshot was extracted from the last frame (t = 100 ns) of the trajectory.
J 06 00006 g004
Figure 5. Information of main trajectories during MD simulations. (A) The RMSD of each complex was calculated after least square fit to protein backbone. (B) The RMSF shows backbone residual fluctuations of each mutant or toxin. (C,D) Radius of gyration and solvent accessible surface area indicating the reasonable compactness of complexes. (E) The mean number of H-bonds be-tween mutants or toxins and their ligand during a 100 ns MD simulation. (F) Average values of toxins-ligand complexes parameters obtained through simulation. Bold and underline boxes represented the highest and the least desirable values, respectively.
J 06 00006 g005
Figure 6. Binding free energy of complexes. For 500 frames taken from the last 5 ns of the MD simulation, binding free energy was calculated using the gmx_MMPBSA tool. In comparison to Abrin-A and other mutants, the PAM in interaction with the ligand represented a significant amount of binding energy.
J 06 00006 g006
Table 1. Validation scores of top Galaxy Model 4, before and after refinement. Verify 3D (based on percentage of the residues had an averaged 3D–1D score ≥ 0.2), ERRAT (based on overall quality factor), ProSA-WEB (based on Z-score), and Ramachandran Plot (F: Favored, AA: additionally allowed, GA: generously allowed, D: disallowed). The best model of refinement with the highest score was selected for the next steps.
ModelsVerify 3D (%)ERRATProSA-WebRamachandran Plot (%)
Selected GALAXY Model
Before refinement
98.01%95.88−7.61F = 94.7, AA = 4.8
GA = 0.0, D = 0.4
Selected GALAXY Model
After refinement
98.01%97.51−7.74F = 93.4, AA = 6.1
GA = 0.0, D = 0.4
Table 2. Score changes of immunogenic residues according to conformational B-cell epitope predictor servers alongside prediction of overall stability through SDM2 server.
Wild Type and Mutant Residues DiscoTope Score
Threshold: −3.7
EPSVR
Score
SEPPA
Score
Threshold: 0.089
Ellipro Conformational
Score
Threshold: 0.5
Pseudo ΔΔG of ProteinStability
Wild type: T82−3.58940.1900.734-
T82A−4.96760.1690.7330.12J 06 00006 i001
Wild type: T100−3.37900.2230.734-
T100A−4.486.000.3370.7320.35J 06 00006 i001
Wild type: D101−2.41900.2470.734-
D101V−4.3382.000.2600.735−0.26J 06 00006 i002
Wild type: Q121−1.65870.0880.572-
Q121A−3.9667.000.0460.5670.24J 06 00006 i001
Wild type: N146−2.53960.2340.713-
N146V−5.2275.000.2000.7230.02J 06 00006 i001
Wild type: D147−3.65980.0750.758-
D147A−5.8596.000.0630.7220.15J 06 00006 i001
Wild type: R149−3.65940.0730.758-
R149A−6.1588.000.0510.6540.33J 06 00006 i001
Table 3. Accessibility and hydrophobicity of residues before and after mutation. The R149A mutant revealed the most decrease in Side chain accessibility in both SDM and Discovery studio. By exploiting mutation to short side chain and non-polar amino acids, it is clear that hydrophobicity of all mutants has been increased, which could bring about a reduction in antigenicity.
MutantSide Chain Accessibility
% (SDM)
Side Chain Accessibility (Discovery Studio)Hydrophobicity
(Kyte and Doolittle)
Original ResidueMutantOriginal ResidueMutantOriginal ResidueMutant
T82A103.392.794.1549.31−0.71.8
T100A74.166.764.8038.74−0.71.8
D101V92.492.481.9985.54−3.54.2
Q121A81.480.5115.7147.29−3.51.8
N146V10496.3104.9596.61−3.54.2
D147A42.94637.6820.63−3.51.8
R149A57.445.5116.4729.68−4.51.8
Table 4. Molecular docking analysis of mutants interacting with CGAGAG. Bold and underlined values represent the most and the least number of bonds or interactions, respectively.
Number of Bonds or
Interactions
PAC
Wild Type
PAC MutantsPAMAbrin-A
T82AT100AD101VQ121AN146VD147AR149A
Number of H-bonds721111510141516156
Number of π-π interactions0326024612
Number of π–Sigma interactions5112180322
Disclaimer/Publisher’s Note: The statements, opinions and data contained in all publications are solely those of the individual author(s) and contributor(s) and not of MDPI and/or the editor(s). MDPI and/or the editor(s) disclaim responsibility for any injury to people or property resulting from any ideas, methods, instructions or products referred to in the content.