
Can a Wastewater Treatment Plant Power Itself? Results from a Novel Biokinetic-Thermodynamic Analysis


Abstract
:1. Introduction
2. Model Description
2.1. WWTP
2.2. Cogeneration Power Cycle
3. Model Analysis
3.1. WWTP Model
3.1.1. Volatile Suspended Solid
3.1.2. Oxygen Transfer
3.1.3. Power Requirement
3.1.4. Exergy Analysis
3.2. Thermal Modeling
- A steady state condition has been assumed for all processes;
- Air and combustion products treated according to the ideal gas mixture law;
- The fuel is assumed to be CH4, and only volume portion of the methane in the biogas mixture is taken into consideration;
- A 2% heat loss of LHV of natural gas is considered in the combustion chamber, while all other systems are adiabatic;
- The oxidizer in the combustion chamber is assumed to be air, and it contains 77.48% N2, 20.59 O2, 0.03% CO2 and 1.90% H2O on a volumetric basis [38];
- Pressure drop in the air preheater, heat recovery steam generator, combustion chamber are considered to be 3%, 5% and 5%, respectively [38];
- The temperature and pressure of the environment are assumed to be 298.15 K and 1.013 bar, respectively;
- A temperature of 35 °C is assumed for the anaerobic digester [42].
3.2.1. Gas Turbine Cycle
3.2.2. Gas Turbine Cycle Exergy Analysis
3.2.3. Rankine Cycle
3.2.4. Overall Efficiencies
4. Results
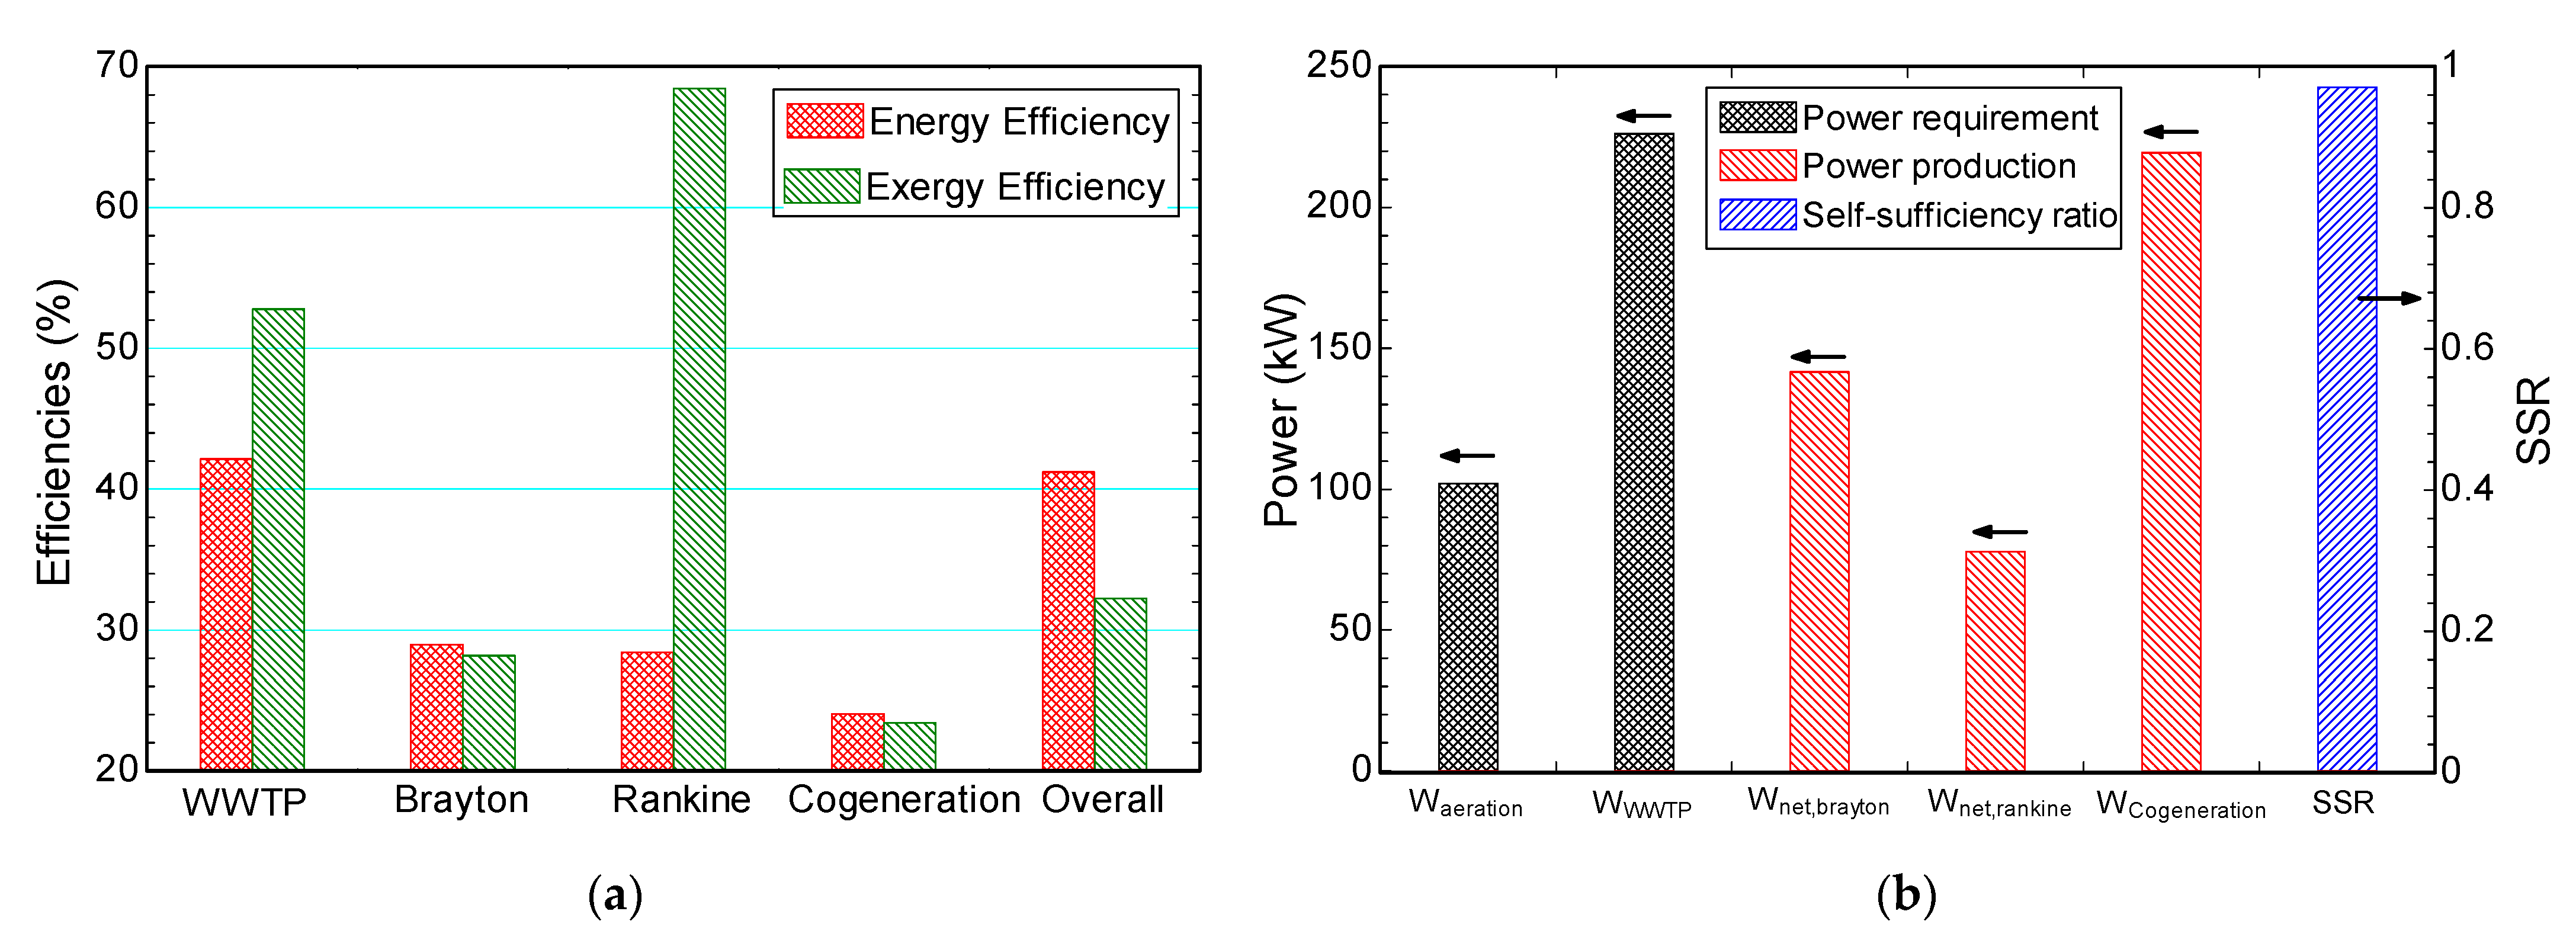
4.1. Case Study
4.2. Parametric Study—WWTP
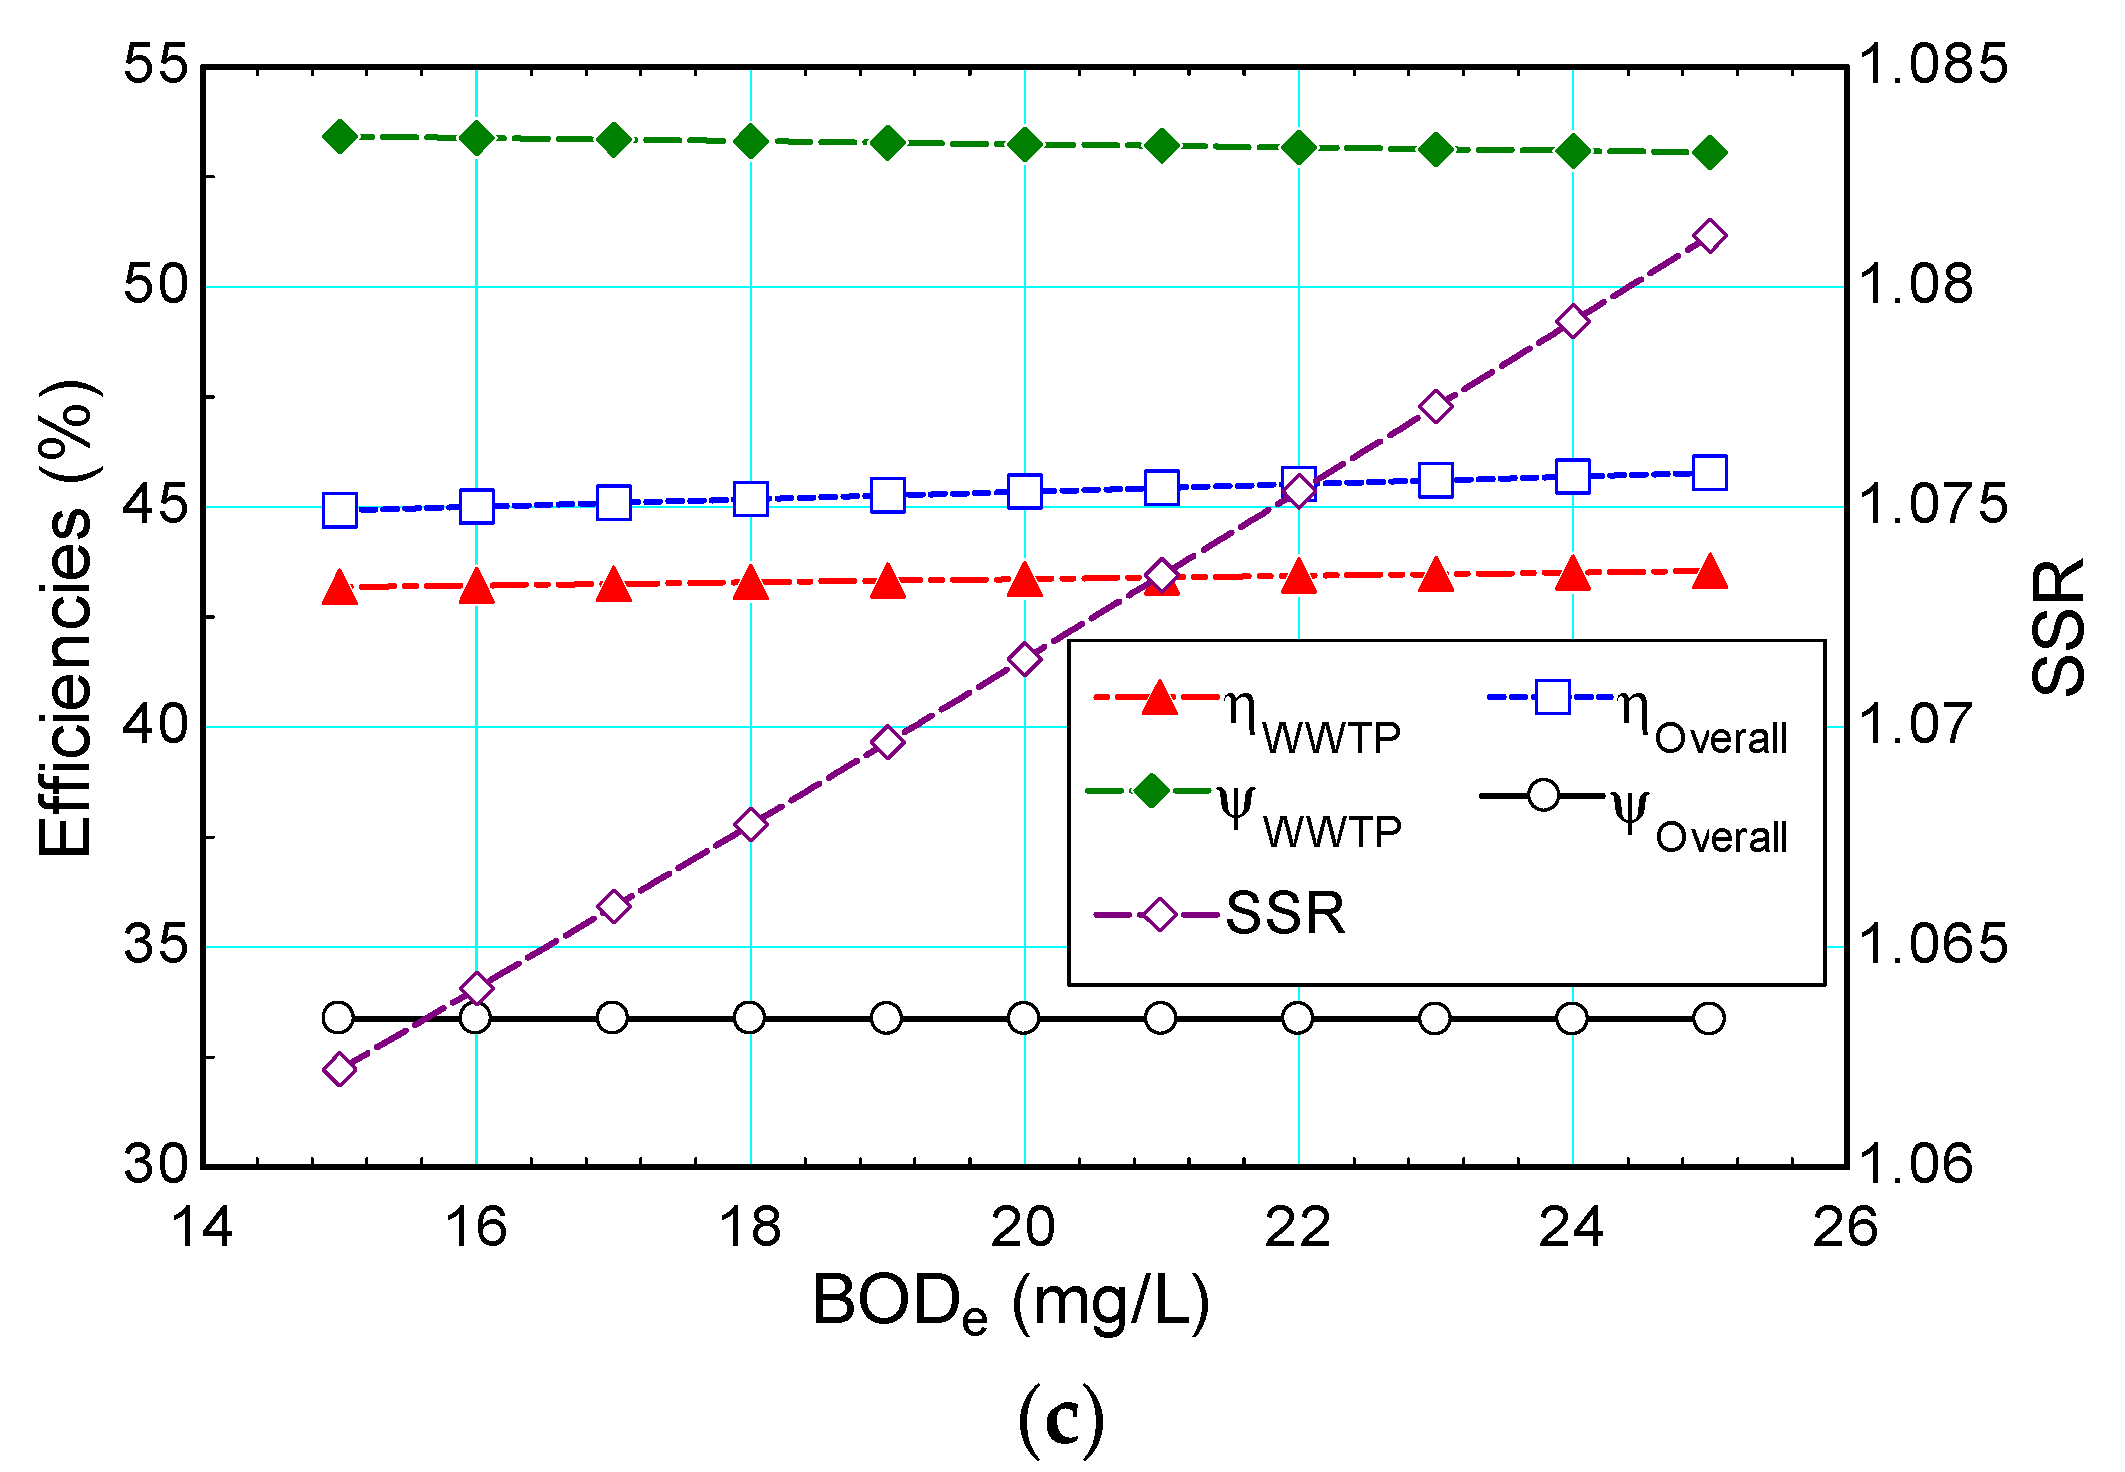
4.2.1. Biological Oxygen Demand
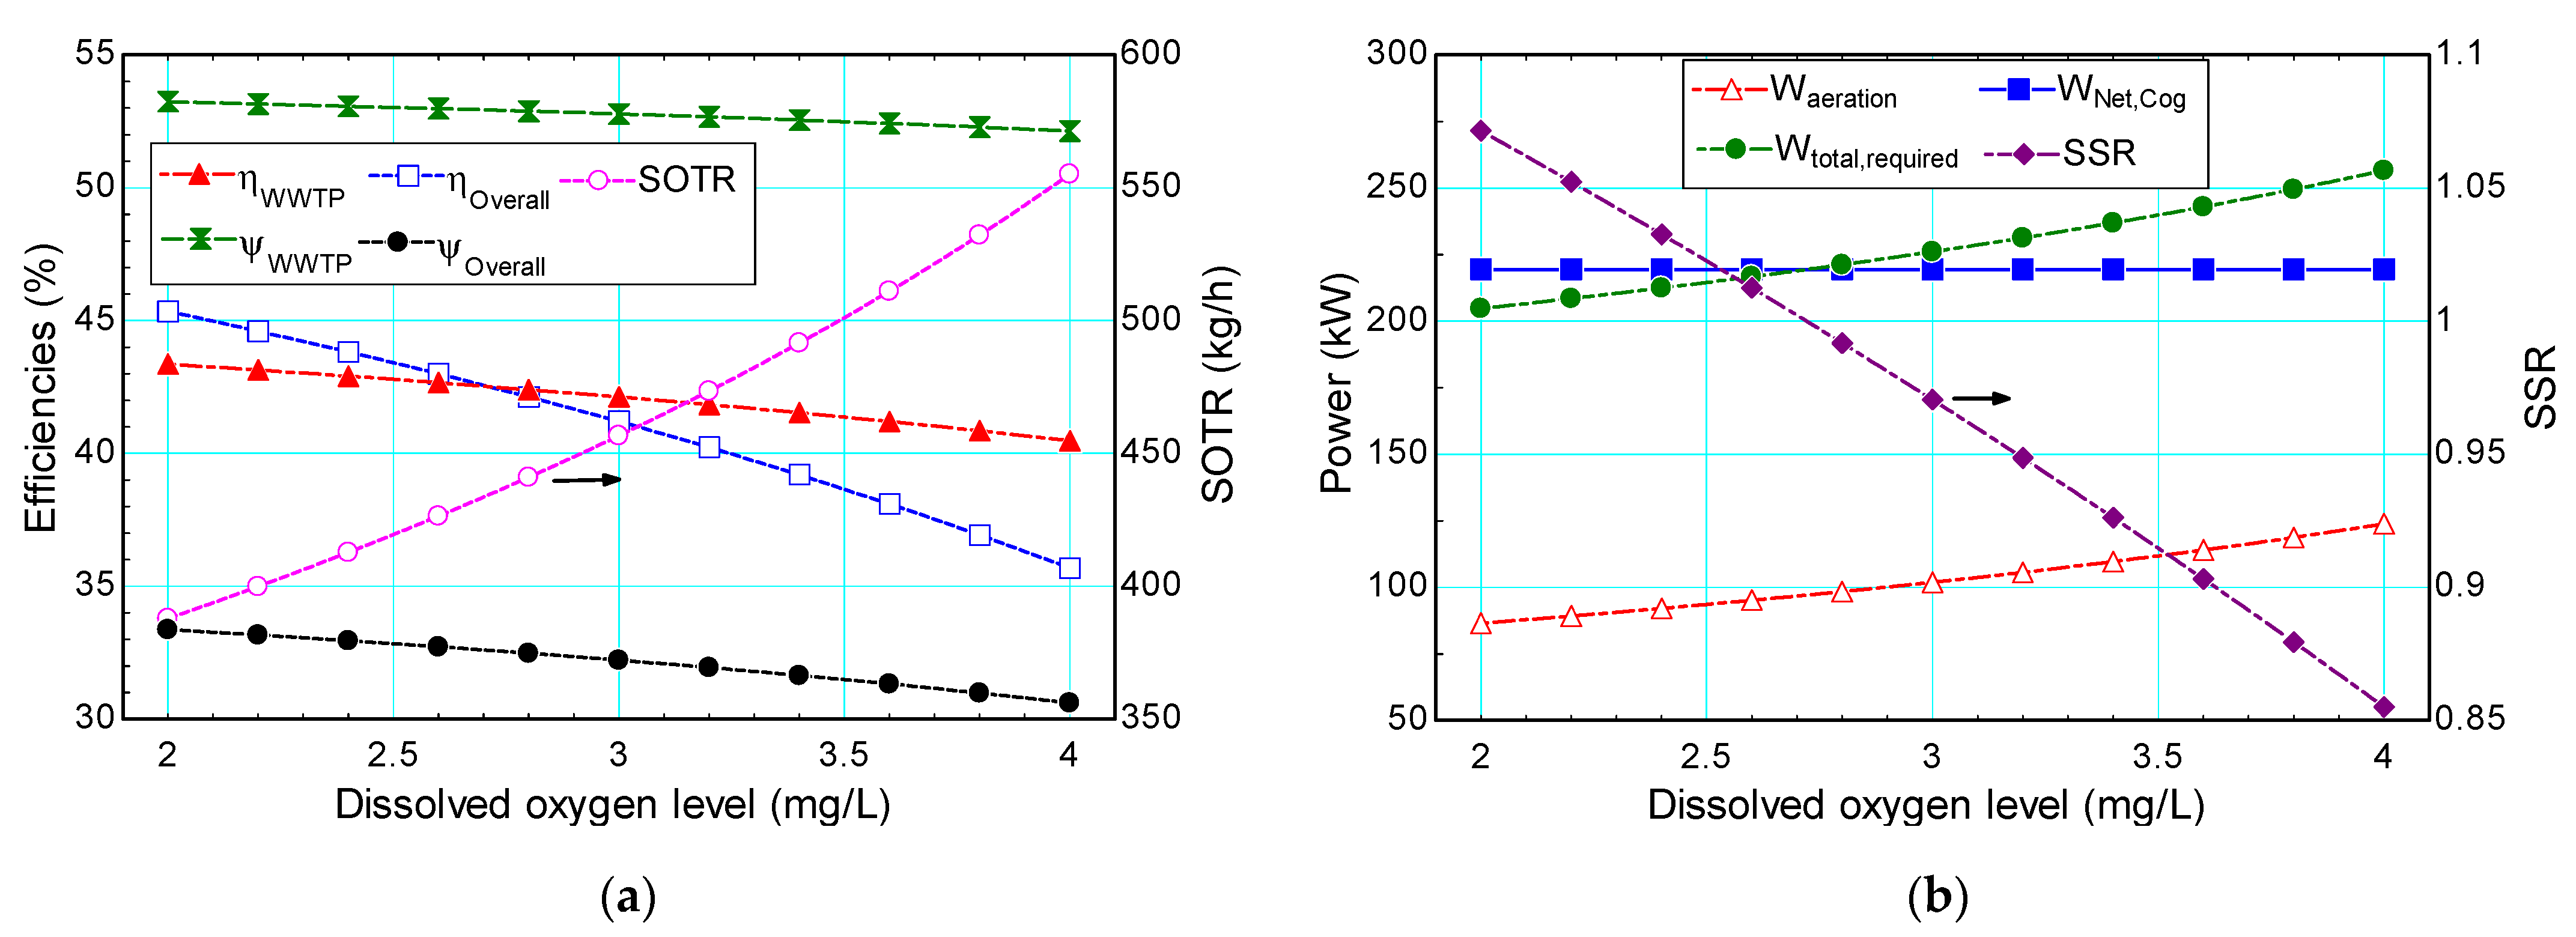
4.2.2. Dissolved Oxygen Concentration
4.3. Parametric Study—Cogeneration Power System
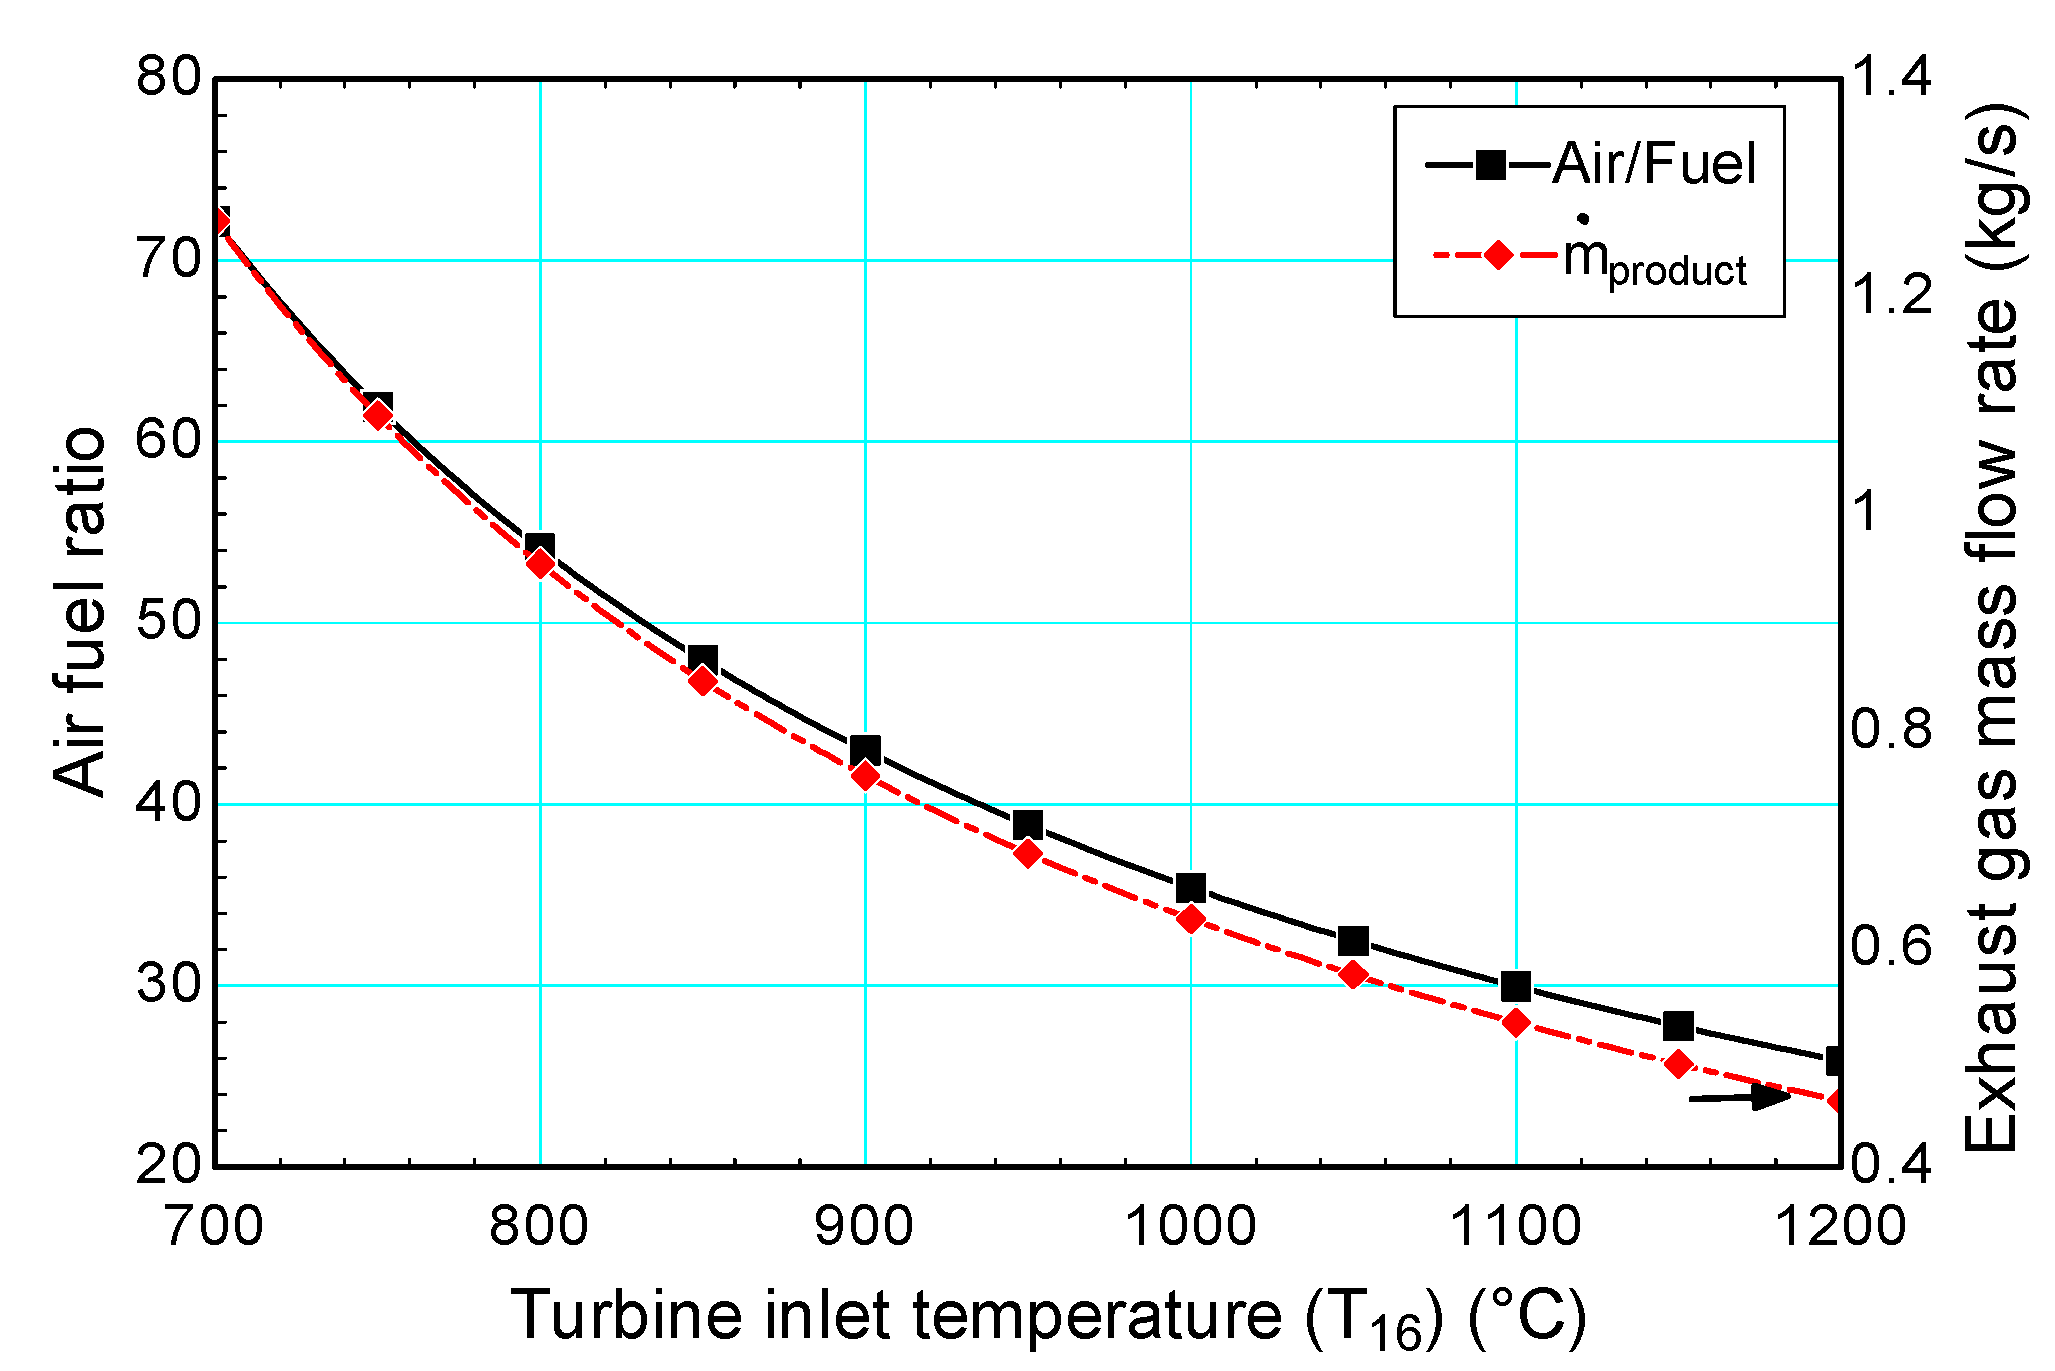
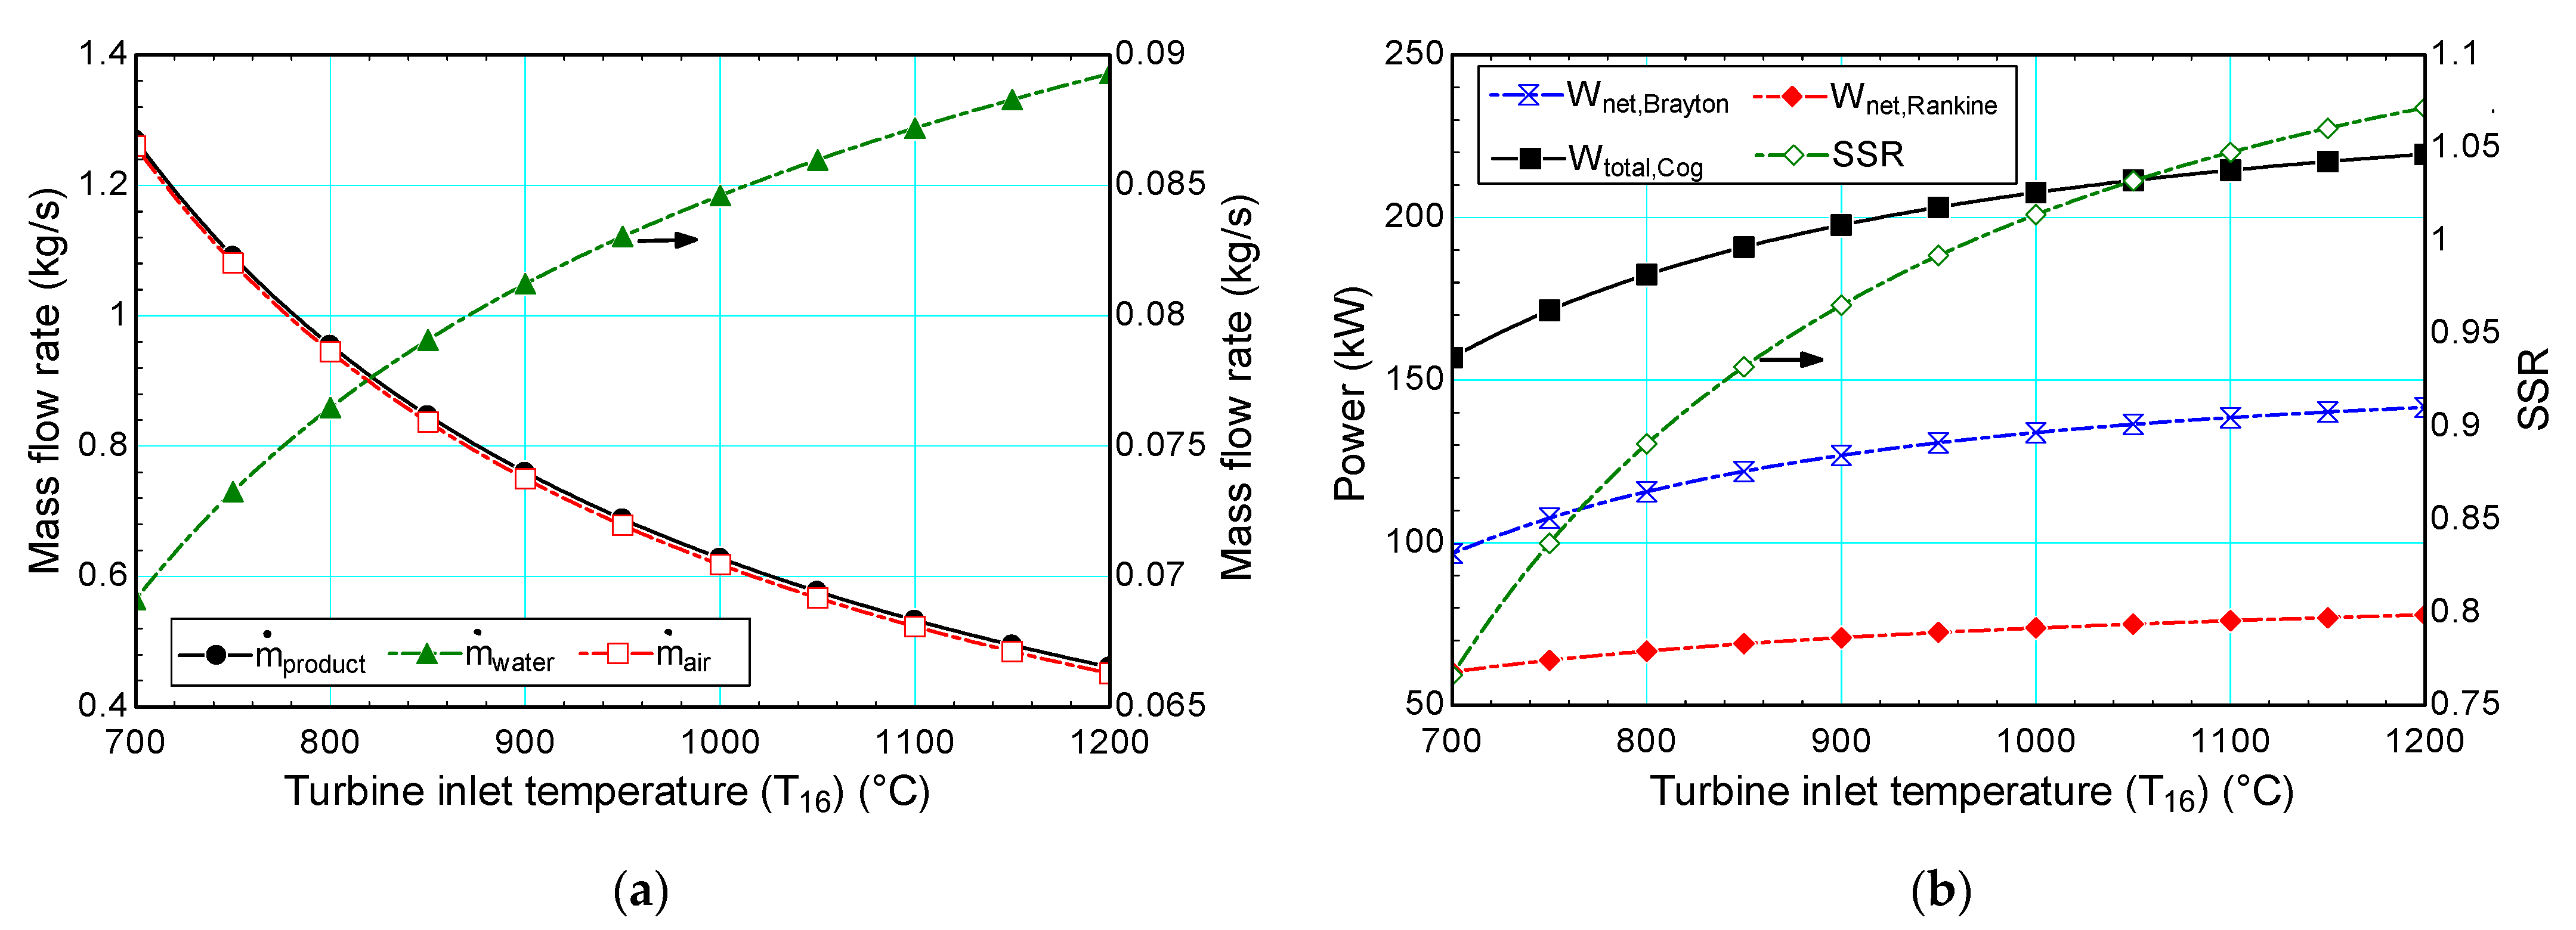
4.3.1. Gas Turbine Inlet Temperature (TIT)
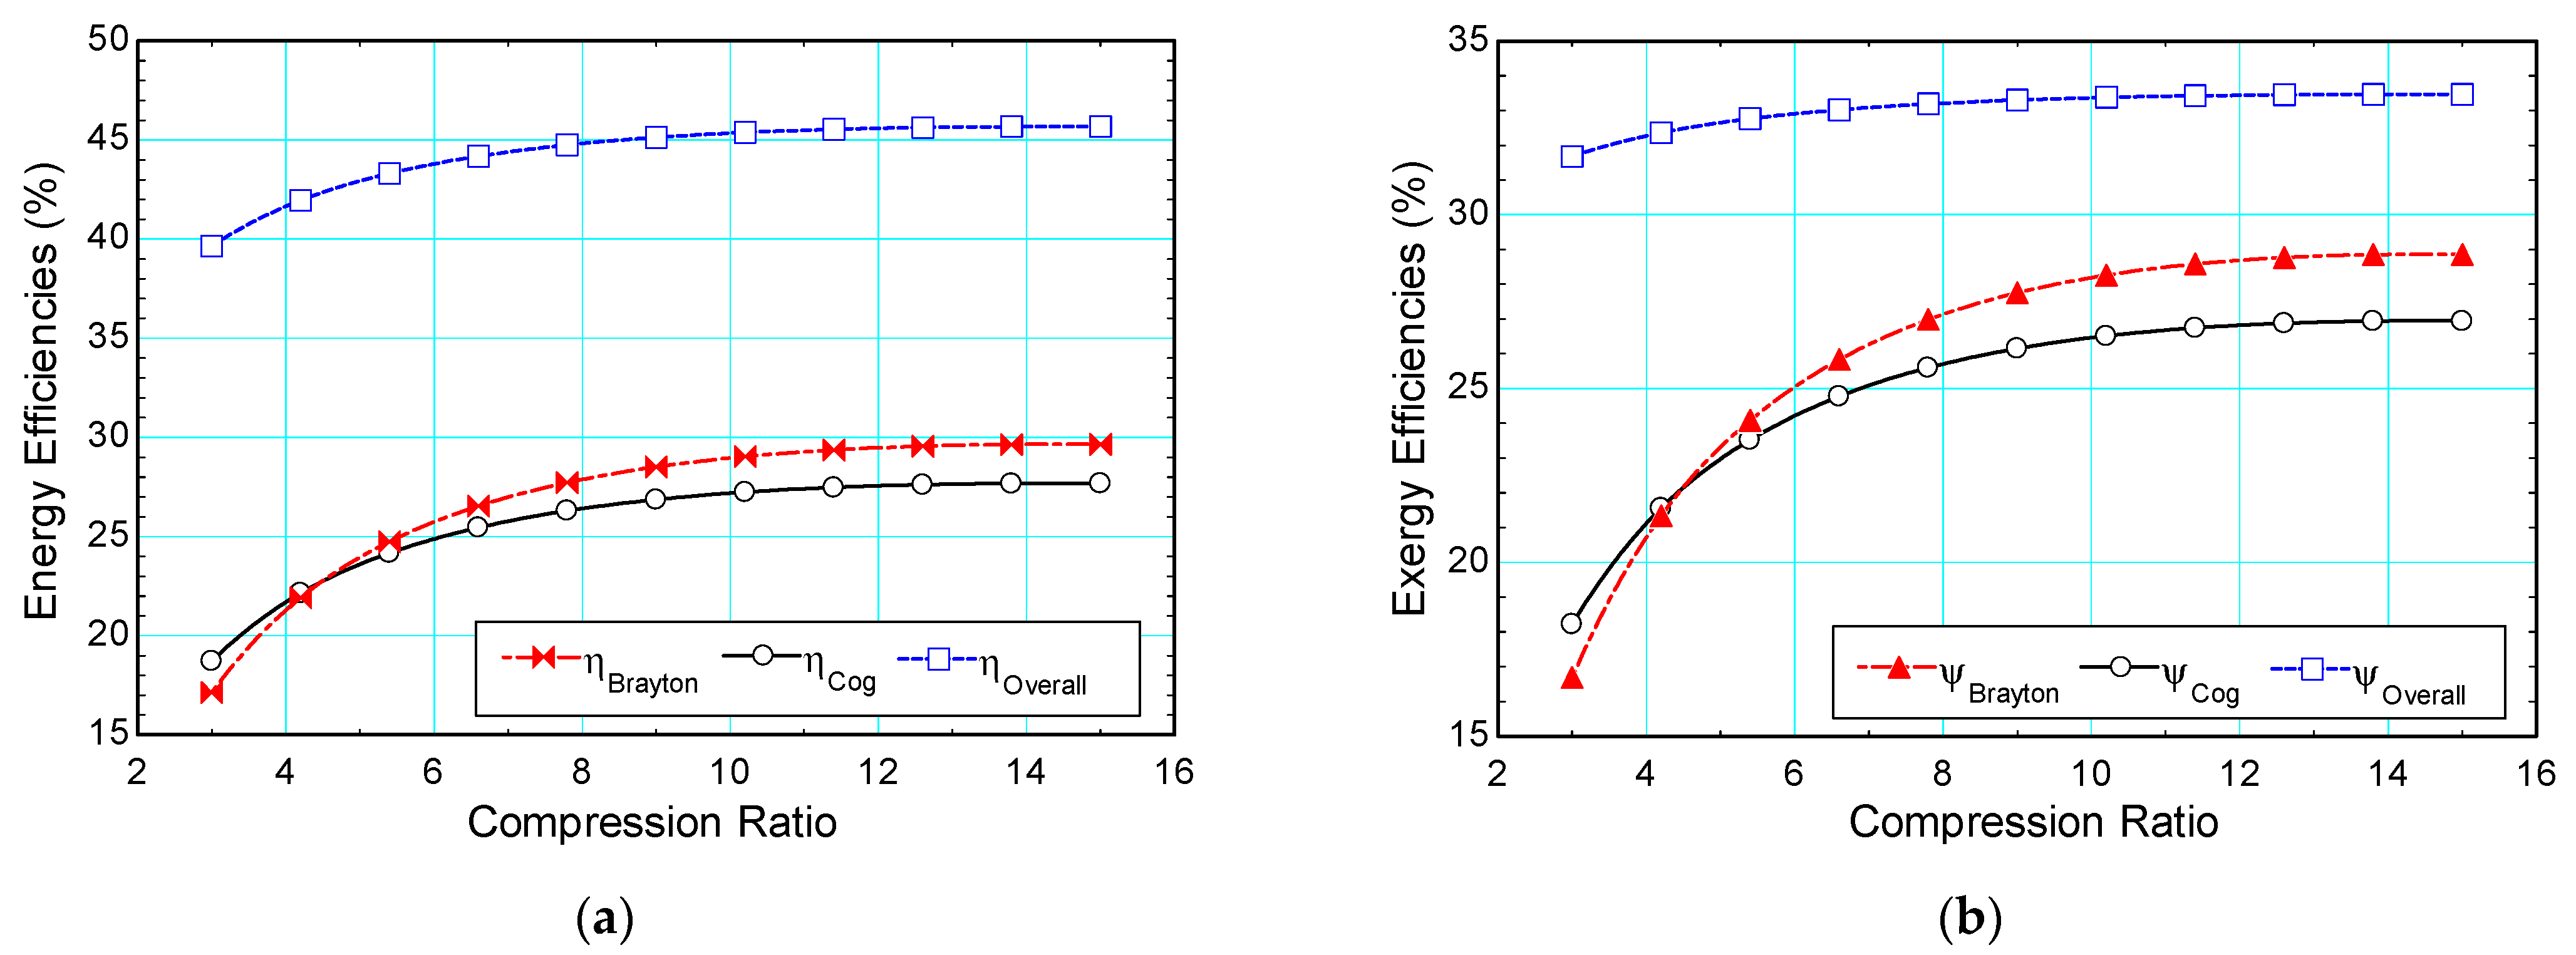
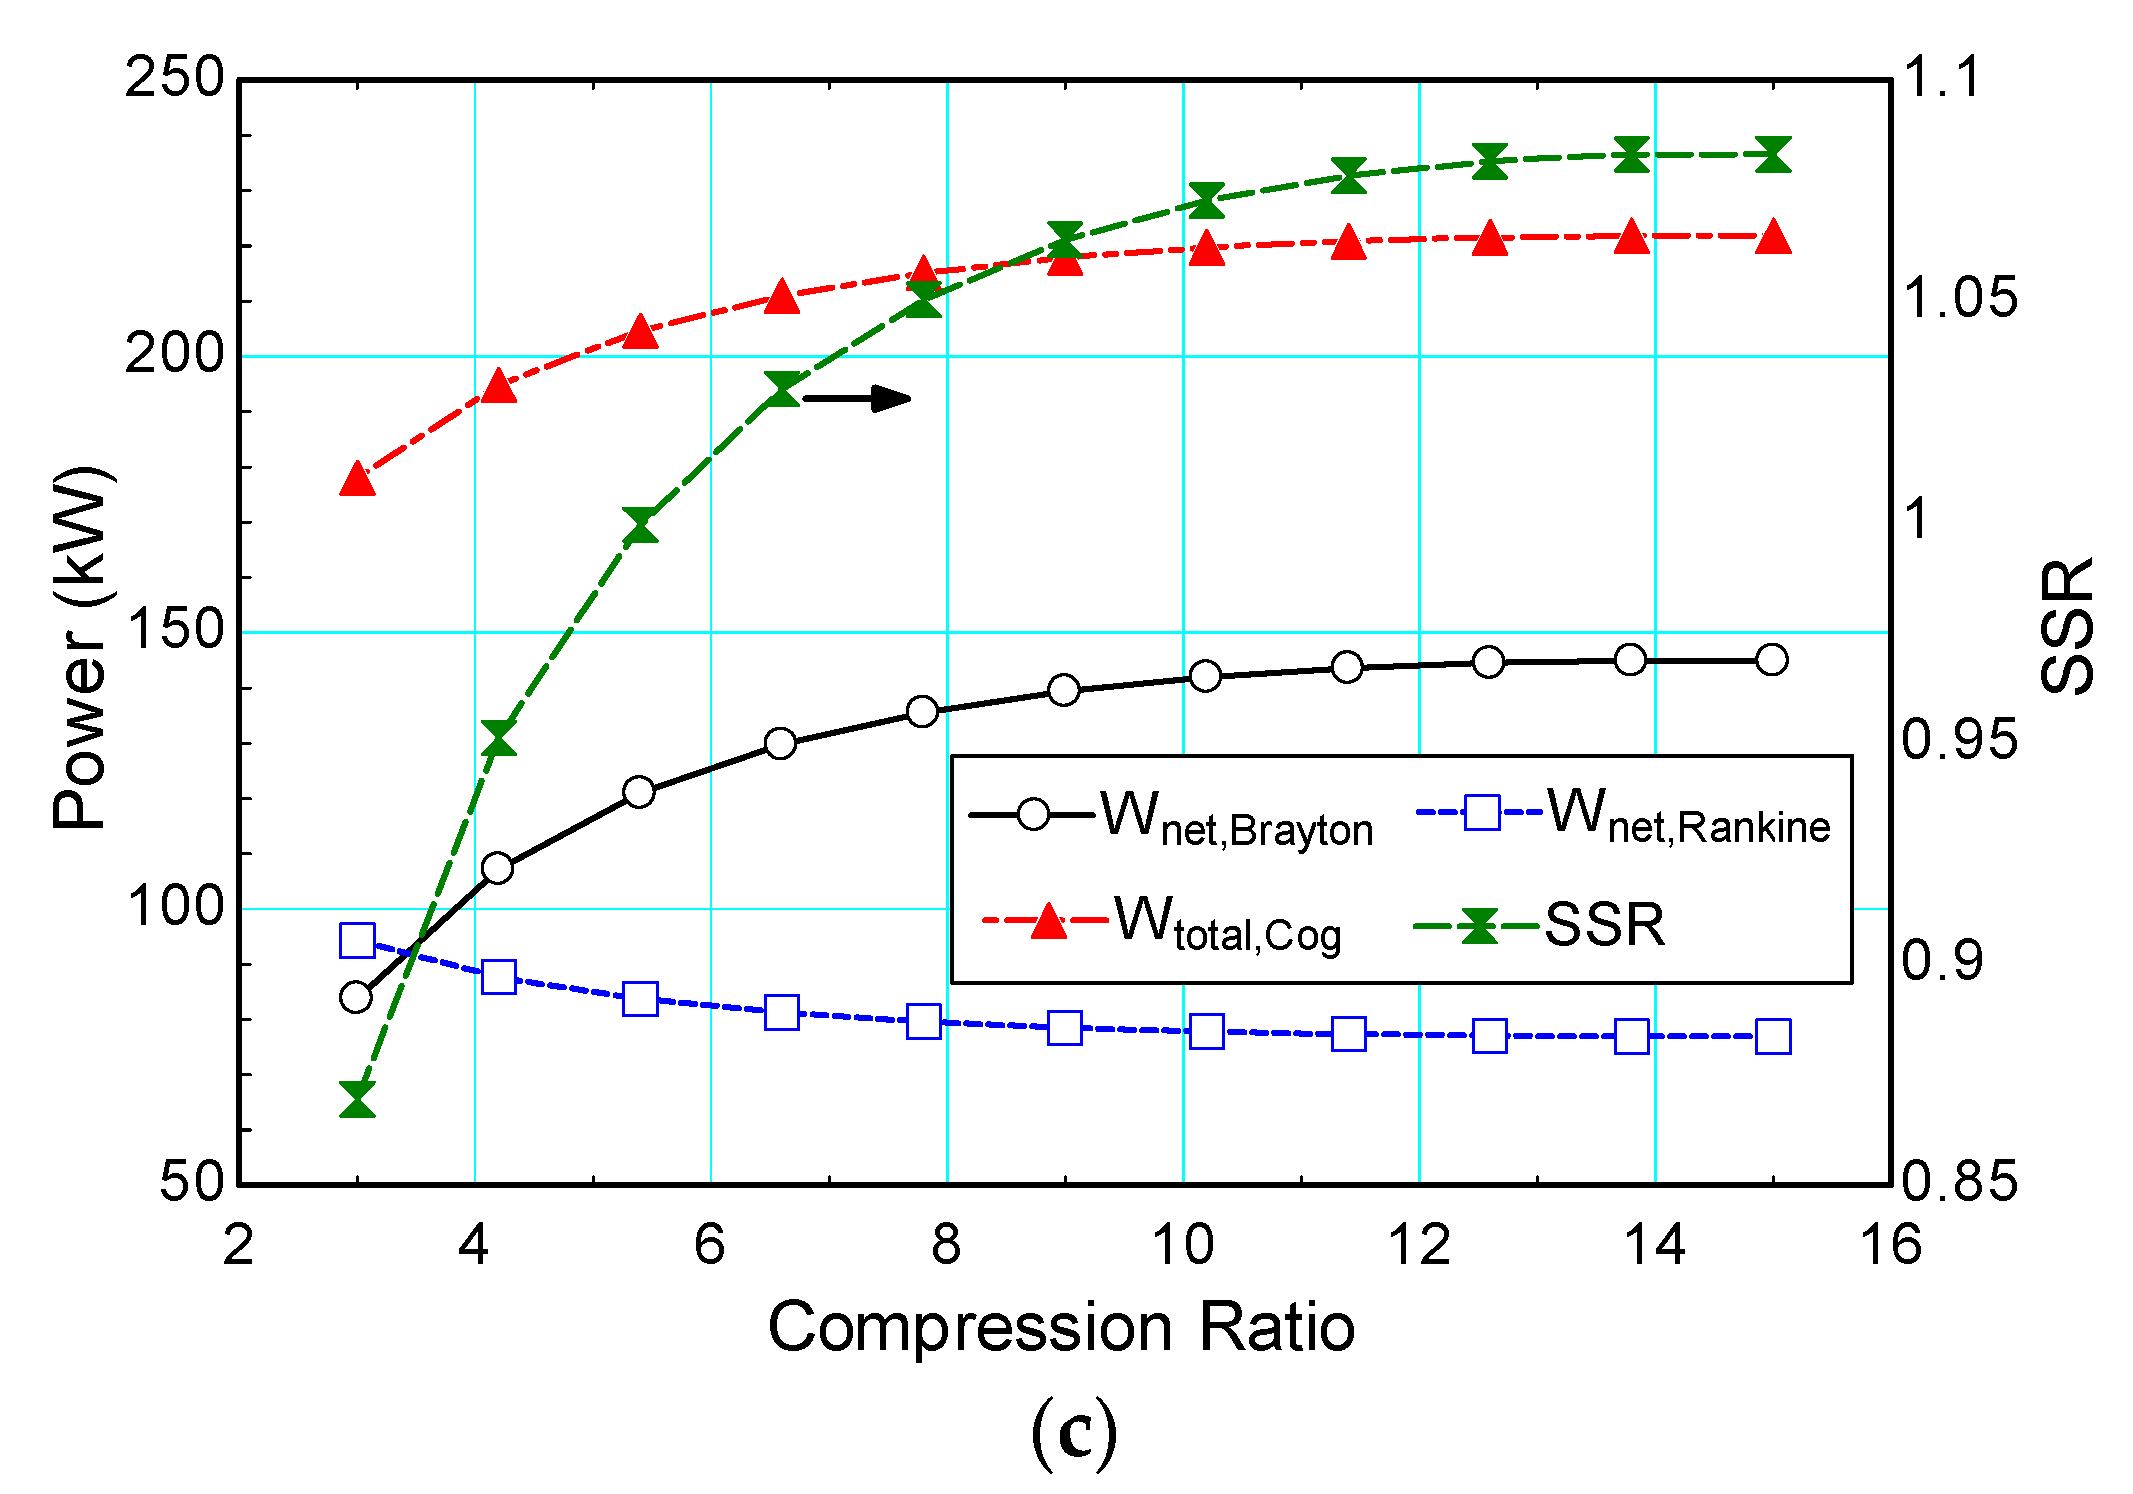
4.3.2. Compression Ratio (Rp)
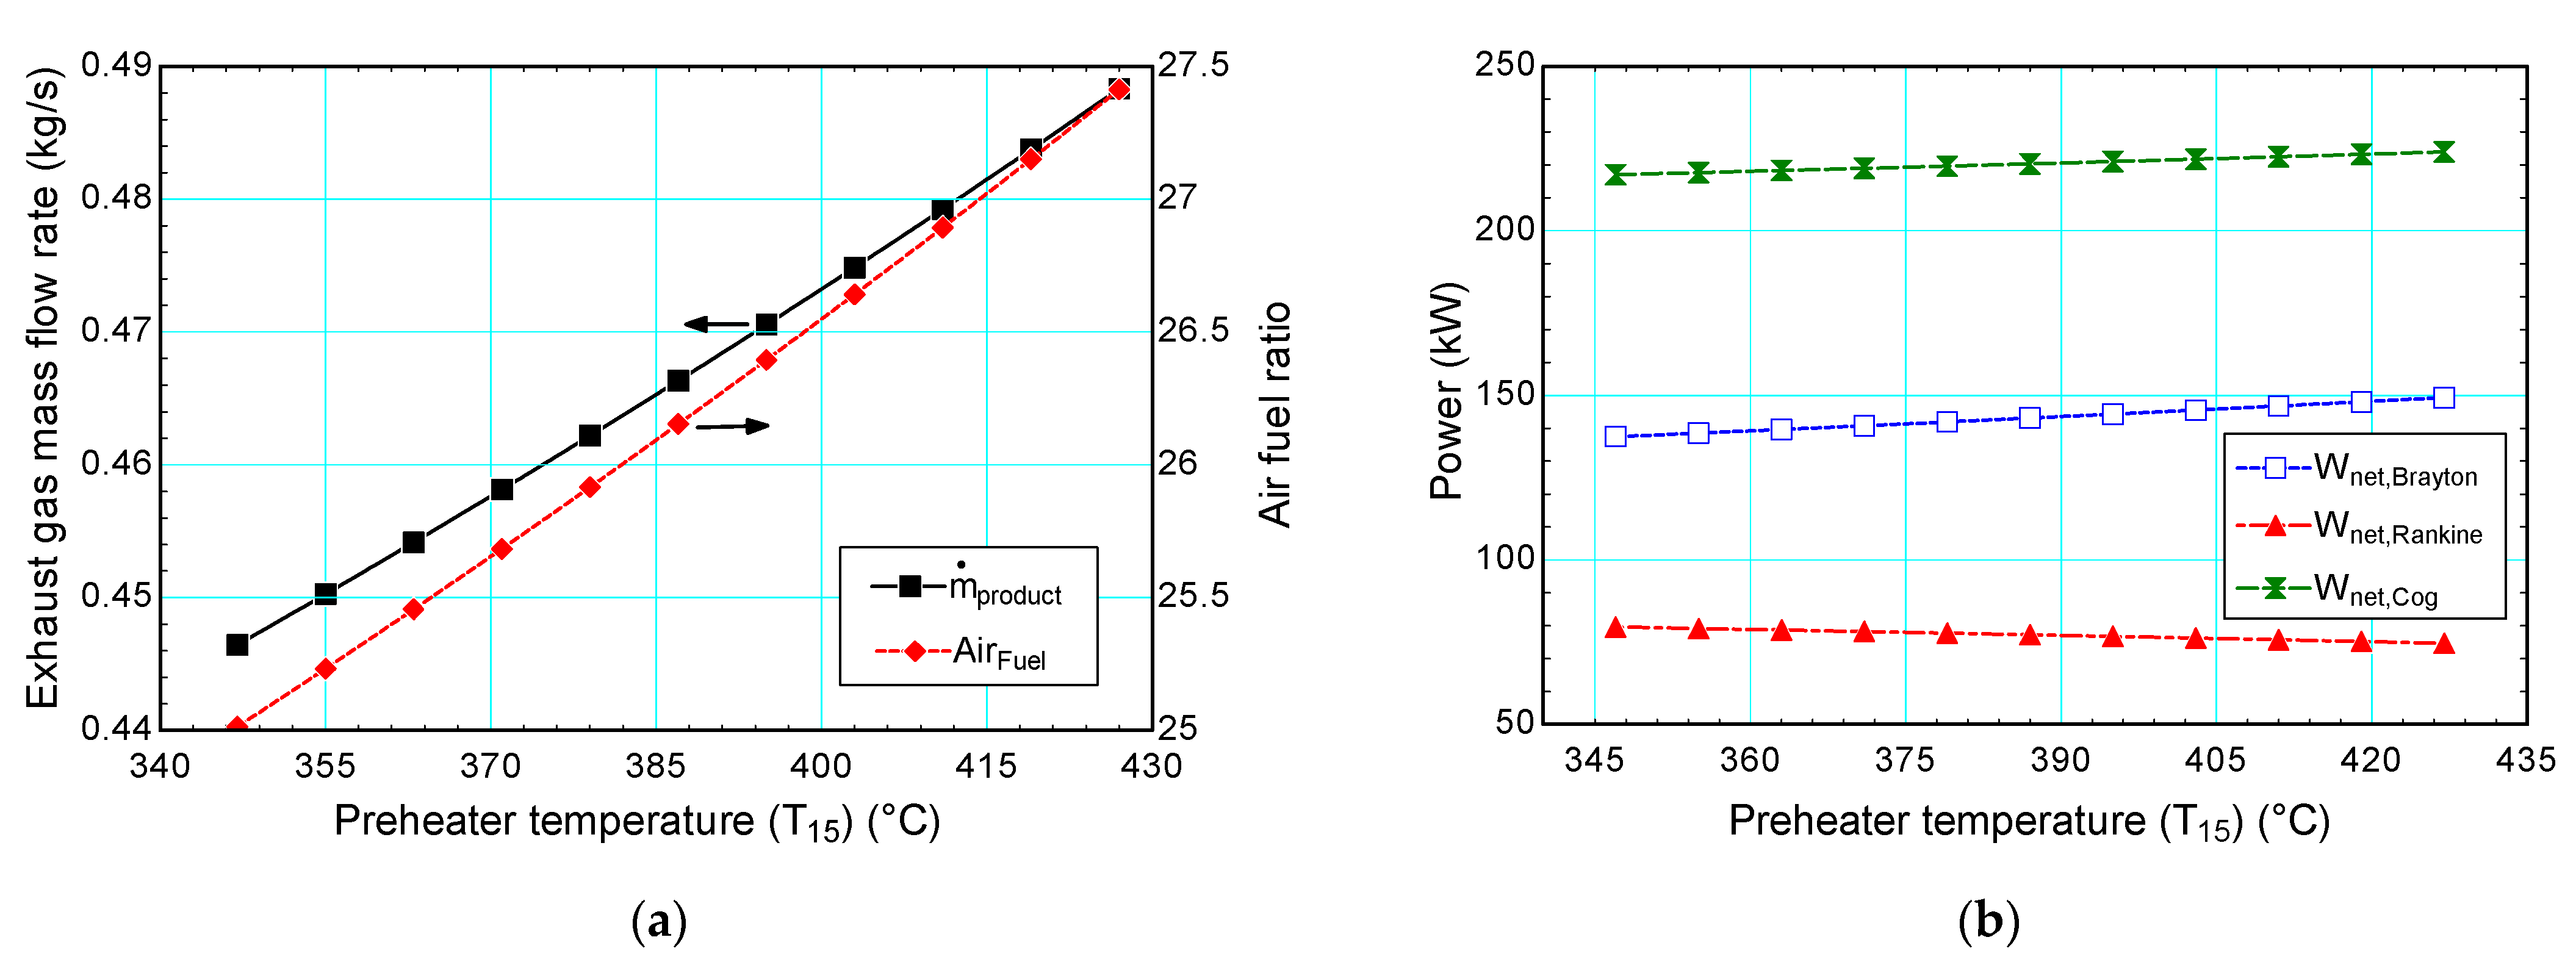
4.3.3. Preheater Temperature
5. Conclusions
- While energy efficiency of the overall system varied from 35.7% to 46.0, exergy efficiency changed from 30.6% to 33.55%;
- The highest efficiencies were obtained for a turbine inlet temperature, air preheater temperature, compression ratio, effluent biological oxygen demand and dissolved oxygen level of 1200 °C, 427 °C, 10, 20 mg/L and 2 mg/L, respectively;
- Self-sufficiency ratio varied between 76.6% to 109.4%. Hence, a self-sufficient system is possible using the proposed multigeneration system;
- Self-sufficiency ratio can be increased by 42% and 12.7% by choosing the optimal parameters compared to the least efficient system and case study, respectively;
- While an increase in the desired effluent BOD result in an increase in the oxygen requirement, a small increase in the desired DO level cause a tremendous rise in the oxygen requirement;
- Similarly, while efficiencies do not change considerably varying effluent BOD, the self-sufficiency ratio varies from 85% to 107% when the DO level is varied. Therefore, the proposed system is found to be self-sufficient when the DO level is lower than 3 mg/L;
- A power production increase of up to 52.9% can be realized by integrating a Rankine cycle into the Brayton cycle for lower compression ratios;
- While turbine inlet temperature and DO level are found to be the most dominant decision variables for self-sufficiency ratio variations, desired effluent BOD and air preheater temperature are found to be the least dominant parameters;
- While the most important factor on the self-sufficiency ratio is found to be turbine inlet temperature, DO concentration also has a high effect on the self-sufficiency ratio since it has the highest effect on the required power for aeration process.
Author Contributions
Funding
Conflicts of Interest
Abbreviations
| General | |
| AD | Anaerobic digestion |
| BOD | Biological oxygen demand (mg/L) |
| C | Operating DO (mg/L) |
| CHP | Combined heat and power |
| COD | Chemical oxygen demand (mg/L) |
| Cp | Specific heat (kj/kgK) |
| DO | Dissolved oxygen (mg/L) |
| E | Aeration efficiency |
| e | Specific energy (kj/kg) |
| ex | Specific exergy (kj/kg) |
| F | Diffuser fouling factor |
| GP | VSS destruction rate (m3/kg VSS destroyed) |
| h | Specific enthalpy (kj/kg) |
| HX | Heat exchanger |
| kd | Decay rate of microorganism (1/day) |
| LHV | Lower heating value (kj/kmol) |
| M | Molecular weight (kg/kmol) |
| Mass flow rate (kg/s) | |
| Molar flow rate (kmol/s) | |
| NZE | Net zero energy |
| OTR | Actual oxygen transfer rate (kg/h) |
| P | Pressure (bar) |
| Q | Flow rate (m3/d) |
| R | Universal gas constant (J/mol.K) |
| Rp | Compression ratio |
| S | Soluble BOD (mg/L) |
| s | Specific entropy (kj/kgK) |
| SOTR | Standard oxygen transfer rate (kg/h) |
| SRT | Solid retention time (day) |
| SSR | Self-sufficiency ratio |
| T | Temperature (°C) |
| TIT | Turbine inlet temperature (°C) |
| TSS | Total suspended solid (mg/L) |
| UBOD | Ultimate biological oxygen demand |
| VSD | Biogas production factor |
| VSS | Volatile suspended solid (mg/L) |
| W | Power (kW) |
| w | Air flow rate (kg/h) |
| WEN | Water energy nexus |
| WWTP | Wastewater treatment plant |
| X | Molar concentration |
| Y | Biomass conversion factor |
| z | Mass fraction |
| δ | Removal efficiency |
| ΔP | Pressure change |
| λ | Fuel to air ratio |
| ρ | Density (kg/m3) |
| Greek Symbols | |
| α | Relative transfer rate to clean water |
| β | Relative DO saturation to clean water |
| η | Energy efficiency |
| ψ | Exergy efficiency |
| Subscripts | |
| a | Air |
| ac | Air compressor |
| ch | Chemical |
| comp | Compressor |
| De | Dewatering |
| dig | Digester |
| f | Fuel |
| gc | Grit chamber |
| gt | Gas turbine |
| p | Product |
| pc | Primary clarifier |
| ph | Physical |
| sc | Secondary clarifier |
| sl | Sludge |
| sul | Sulfur |
| sw | Sewage |
| tic | Thickener |
| tw | Treated wastewater |
| w | Water |
References
- Angelakis, A.N.; Zheng, X.Y. Evolution of water supply, sanitation, wastewater, and stormwater technologies globally. Water 2015, 7, 455–463. [Google Scholar] [CrossRef] [Green Version]
- Salgot, M.; Folch, M. Wastewater treatment and water reuse. Curr. Opin. Environ. Sci. Health 2018, 2, 64–74. [Google Scholar] [CrossRef]
- United Nations Educational Scientific and Cultural Organization. United Nations World Water Development Report 2020: Water and Climate Change; United Nations Educational, Scientific and Cultural Organization: Paris, France, 2020. [Google Scholar]
- Rojas, J.; Zhelev, T. Energy efficiency optimisation of wastewater treatment: Study of ATAD. Comput. Chem. Eng. 2012, 38, 52–63. [Google Scholar] [CrossRef]
- US. EPA. Energy Efficiency in Water and Wastewater Facilities; U.S. Environment Protection Agency: Washington, DC, USA, 2014; p. 49.
- Qandil, M.D.; Abbas, A.I.; Salem, A.R.; Abdelhadi, A.I.; Hasan, A.; Nourin, F.N.; Abousabae, M.; Selim, O.M.; Espindola, J.; Amano, R.S. Net zero energy model for wastewater treatment plants. J. Energy Resour. Technol. 2021, 143, 122101. [Google Scholar] [CrossRef]
- Lee, S.; Esfahani, I.J.; Ifaei, P.; Moya, W.; Yoo, C. Thermo-environ-economic modeling and optimization of an integrated wastewater treatment plant with a combined heat and power generation system. Energy Convers. Manag. 2017, 142, 385–401. [Google Scholar] [CrossRef]
- Olsson, G. Water and Energy: Threats and Opportunities; IWA Publishing: London, UK, 2012. [Google Scholar]
- Ali, B.; Kumar, A. Development of life cycle water footprints for gas-fired power generation technologies. Energy Convers. Manag. 2016, 110, 386–396. [Google Scholar] [CrossRef]
- Sotomayor, O.; Park, S.; Garcia, C. A simulation benchmark to evaluate the performance of advanced control techniques in biological wastewater treatment plants. Braz. J. Chem. Eng. 2001, 18, 81–101. [Google Scholar] [CrossRef]
- Jafarinejad, S. Cost estimation and economical evaluation of three configurations of activated sludge process for a wastewater treatment plant (WWTP) using simulation. Appl. Water Sci. 2017, 7, 2513–2521. [Google Scholar] [CrossRef] [Green Version]
- Drewnowski, J.; Remiszewska-Skwarek, A.; Duda, S.; Łagód, G. Aeration process in bioreactors as the main energy consumer in a wastewater treatment plant. Review of solutions and methods of process optimization. Processes 2019, 7, 311. [Google Scholar] [CrossRef] [Green Version]
- Sánchez, F.; Rey, H.; Viedma, A.; Nicolás-Pérez, F.; Kaiser, A.; Martínez, M. CFD simulation of fluid dynamic and biokinetic processes within activated sludge reactors under intermittent aeration regime. Water Res. 2018, 139, 47–57. [Google Scholar] [CrossRef]
- Mohseni, E.; Herrmann-Heber, R.; Reinecke, S.; Hampel, U. Bubble generation by micro-orifices with application on activated sludge wastewater treatment. Chem. Eng. Process. Process. Intensif. 2019, 143, 107511. [Google Scholar] [CrossRef]
- Mahmud, R.; Erguvan, M.; Macphee, D.W. Performance of closed loop venturi aspirated aeration system: Experimental study and numerical analysis with discrete bubble model. Water 2020, 12, 1637. [Google Scholar] [CrossRef]
- Kim, M.; Yoo, C. Multi-objective controller for enhancing nutrient removal and biogas production in wastewater treatment plants. J. Taiwan Inst. Chem. Eng. 2014, 45, 2537–2548. [Google Scholar] [CrossRef]
- Appels, L.; Baeyens, J.; Degrève, J.; Dewil, R. Principles and potential of the anaerobic digestion of waste-activated sludge. Prog. Energy Combust. Sci. 2008, 34, 755–781. [Google Scholar] [CrossRef]
- Calli, O.; Colpan, C.O.; Gunerhan, H. Performance assessment of a biomass-fired regenerative ORC system through energy and exergy analyses. In Exergetic, Energetic and Environmental Dimensions; Elsevier Inc.: Amsterdam, The Netherlands, 2018; pp. 253–277. [Google Scholar]
- Aydin, E.S.; Yucel, O.; Sadikoglu, H. Numerical investigation of fixed-bed downdraft woody biomass gasification. In Exergetic, Energetic and Environmental Dimensions; Elsevier Inc.: Amsterdam, The Netherlands, 2018; pp. 323–339. [Google Scholar]
- Shizas, I.; Bagley, D. Experimental determination of energy content of unknown organics in municipal wastewater streams. Am. Soc. Civ. Eng. 2004, 130, 45–53. [Google Scholar]
- Shen, Y.; Linville, J.L.; Urgun-Demirtas, M.; Mintz, M.M.; Snyder, S.W. An overview of biogas production and utili-zation at full-scale wastewater treatment plants (WWTPs) in the United States: Challenges and opportunities towards energy-neutral WWTPs. Renew. Sustain. Energy Rev. 2015, 50, 346–362. [Google Scholar] [CrossRef] [Green Version]
- Farahbakhsh, M.T.; Chahartaghi, M. Performance analysis and economic assessment of a combined cooling heating and power (CCHP) system in wastewater treatment plants (WWTPs). Energy Convers. Manag. 2020, 224, 113351. [Google Scholar] [CrossRef]
- Mauger, G.; Tauveron, N.; Bentivoglio, F.; Ruby, A. On the dynamic modeling of Brayton cycle power conversion systems with the CATHARE-3 code. Energy 2019, 168, 1002–1016. [Google Scholar] [CrossRef]
- Jenicek, P.; Kutil, J.; Benes, O.; Todt, V.; Zabranska, J.; Dohanyos, M. Energy self-sufficient sewage wastewater treatment plants: Is optimized anaerobic sludge digestion the key? Water Sci. Technol. 2013, 68, 1739–1744. [Google Scholar] [CrossRef]
- Schwarzenbeck, N.; Pfeiffer, W.; Bomball, E. Can a wastewater treatment plant be a powerplant? A case study. Water Sci. Technol. 2008, 57, 1555–1561. [Google Scholar] [CrossRef]
- Nowak, O.; Keil, S.; Fimml, C. Examples of energy self-sufficient municipal nutrient removal plants. Water Sci. Technol. 2011, 64, 1–6. [Google Scholar] [CrossRef]
- Nowak, O.; Enderle, P.; Varbanov, P. Ways to optimize the energy balance of municipal wastewater systems: Lessons learned from Austrian applications. J. Clean. Prod. 2015, 88, 125–131. [Google Scholar] [CrossRef]
- Willis, J.; Stone, L.; Durden, K.; Beecher, N.; Hemenway, C.; Greenwood, R. Barriers to Biogas Utilization for Renewable Energy; IWA Publishing: London, UK, 2012. [Google Scholar]
- Yan, P.; Shi, H.-X.; Chen, Y.-P.; Gao, X.; Fang, F.; Guo, J.-S. Optimization of recovery and utilization pathway of chemical energy from wastewater pollutants by a net-zero energy wastewater treatment model. Renew. Sustain. Energy Rev. 2020, 133, 110160. [Google Scholar] [CrossRef]
- Erguvan, M.; MacPhee, D.W. Second law optimization of heat exchangers in waste heat recovery. Int. J. Energy Res. 2019, 43, 5714–5734. [Google Scholar] [CrossRef]
- Erguvan, M.; Macphee, D.W. Energy and exergy analyses of tube banks in waste heat recovery applications. Energies 2018, 11, 2094. [Google Scholar] [CrossRef] [Green Version]
- Siddiqui, O.; Dincer, I.; Yilbas, B.S. Development of a novel renewable energy system integrated with biomass gasification combined cycle for cleaner production purposes. J. Clean. Prod. 2019, 241, 118345. [Google Scholar] [CrossRef]
- Ozdil, N.F.T.; Tantekin, A. Exergy and exergoeconomic assessments of an electricity production system in a running wastewater treatment plant. Renew. Energy 2016, 97, 390–398. [Google Scholar] [CrossRef]
- Abusoglu, A.; Demir, S.; Kanoglu, M. Thermoeconomic assessment of a sustainable municipal wastewater treatment system. Renew. Energy 2012, 48, 424–435. [Google Scholar] [CrossRef]
- Abusoglu, A.; Demir, S.; Kanoglu, M. Thermodynamic analysis and assessment of a wastewater treatment plant in scope of anaerobic sludge digestion and on-site electricity production from biogas. In Proceedings of the 2nd International Exergy, Life Cycle Assessment, and Sustainability Workshop & Symposium (ELCAS2), Nisyros, Greece, 19–21 June 2011. [Google Scholar]
- Abusoglu, A.; Demir, S.; Kanoglu, M. Exergoeconomic assessment of a municipal primary and secondary sewage treatment. Int. J. Exergy 2012, 11, 387. [Google Scholar] [CrossRef]
- Cengel, Y.A.; Boles, M.A. Thermodynamics an Engineering Approach, 8th ed.; McGraw-Hill Education: New York, NY, USA, 2015. [Google Scholar]
- Bejan, A.; Tsatsaronis, G.; Moran, M. Thermal Design and Optimization; John Wiley & Sons: New York, NY, USA, 1995. [Google Scholar]
- Metcalf and Eddy Inc. Wastewater Engineering: Treatment and Resource Recovery, 5th ed.; McGraw-Hill Education: New York, NY, USA, 2014. [Google Scholar]
- Qasim, S.R.; Zhu, G. Wastewater Treatment and Reuse: Theory and Design Examples; CRC Press: Boca Raton, FL, USA, 2017; Volume 1. [Google Scholar]
- Weiland, P. Biogas production: Current state and perspectives. Appl. Microbiol. Biotechnol. 2010, 85, 849–860. [Google Scholar] [CrossRef]
- Safari, F.; Dincer, I. Development and analysis of a novel biomass-based integrated system for multigeneration with hydrogen production. Int. J. Hydrogen Energy 2019, 44, 3511–3526. [Google Scholar] [CrossRef]
- Gu, Y.; Li, Y.; Li, X.; Luo, P.; Wang, H.; Robinson, Z.P.; Wang, X.; Wu, J.; Li, F. The feasibility and challenges of energy self-sufficient wastewater treatment plants. Appl. Energy 2017, 204, 1463–1475. [Google Scholar] [CrossRef] [Green Version]
- Tai, S.; Matsushige, K.; Goda, T. Chemical exergy of organic matter in wastewater. Int. J. Environ. Stud. 1986, 27, 301–315. [Google Scholar] [CrossRef]
- Szargut, J.; Morris, D.R.; Steward, F.R. Energy Analysis of Thermal, Chemical, and Metallurgical Processes; Hemisphere Publishing: New York, NY, USA, 1988. [Google Scholar]
- Cartmell, E.; Gostelow, P.; Riddell-Black, D.; Simms, N.; Oakey, J.; Morris, J.; Jeffrey, P.; Howsam, P.; Pollard, S.J. Biosolids—A fuel or a waste? An integrated appraisal of five co-combustion scenarios with policy analysis. Environ. Sci. Technol. 2006, 40, 649–658. [Google Scholar] [CrossRef] [Green Version]
- Gholizadeh, T.; Vajdi, M.; Mohammadkhani, F. Thermodynamic and thermoeconomic analysis of basic and modified power generation systems fueled by biogas. Energy Convers. Manag. 2019, 181, 463–475. [Google Scholar] [CrossRef]
- Hosseini, S.E.; Barzegaravval, H.; Wahid, M.A.; Ganjehkaviri, A.; Sies, M.M. Thermodynamic assessment of integrated biogas-based micro-power generation system. Energy Convers. Manag. 2016, 128, 104–119. [Google Scholar] [CrossRef]
- Erguvan, M.; MacPhee, D.W. Analysis of a Multigeneration Energy System for Wastewater Treatment. In Proceedings of the ASME 2021 Power Conference, ASME 2021 Power Conference, Virtual, Online, 20–22 July 2021. [Google Scholar] [CrossRef]
- Riffat, R. Fundamentals of Wastewater Treatment and Engineering; CRC Press: Boca Raton, FL, USA, 2013. [Google Scholar]


| Description | Parameter | Unit | Value |
|---|---|---|---|
| Wastewater flow rate | Q | (m3/d) | 22,600 |
| Influent BOD | BOD0 | (mg/L) | 375 |
| Influent TSS concentration | TSS1 | (mg/L) | 400 |
| Grit removal efficiency | δGC | - | 0.9 |
| Primary clarifier removal efficiency | δPC | - | 0.7 |
| Thickener removal efficiency | δTic | - | 0.9 |
| Dewatering removal efficiency | δDe | - | 0.93 |
| Effluent total BOD | BOD9 | (mg/L) | 20 |
| Effluent TSS | TSS9 | (mg/L) | 22 |
| Fraction of biodegradable solids | fb | - | 0.65 |
| Solid retention time | SRT | days | 10 |
| Biomass conversion factor | Y | - | 0.5 |
| Decay rate of microorganism | kd | (1/day) | 0.06 |
| Ultimate biological oxygen demand | UBOD | - | 1.42 |
| Conversion factor UBOD to BODe | f | - | 0.68 |
| Volatile fraction in primary clarifier | fpc | - | 0.683 |
| Volatile fraction in secondary clarifier | fsc | - | 0.8 |
| Biogas production factor | VSD | - | 0.5 |
| Density of air | ρair | kg/m3 | 1.204 |
| Density ratio of biogas/density of air | ρr | - | 0.86 |
| VSS destruction rate | GP | m3/kg of VSS destroyed | 0.95 |
| Description | Parameter | Unit | Value |
|---|---|---|---|
| Relative transfer rate to clean water | α | - | 0.50 |
| Relative DO saturation to clean water | β | - | 0.95 |
| Diffuser fouling factor | F | - | 0.90 |
| Saturated DO value at sea level and 20 °C for diffused aeration (mg/L) | (mg/L) | 10.64 | |
| Saturated DO value at sea level and 20 °C | (mg/L) | 9.09 | |
| Saturated DO at sea level and operating temperature (at 25 °C) | (mg/L) | 8.263 | |
| Pressure correction factor | - | 0.94 | |
| Operating DO in basin | C | (mg/L) | 2.0 |
| Aeration basin temperature | T | °C | 25 |
| Description | Parameter | Unit | Value |
|---|---|---|---|
| Universal gas constant | R | J/mol·K | 8.314 |
| Absolute inlet temperature | T0 | K | 298 |
| Absolute inlet pressure | Px | kPa | 101.3 |
| Absolute outlet pressure | Py | kPa | 156.5 |
| Compressor efficiency | e | - | 0.85 |
| Oxygen transfer efficiency | E | - | 0.25 |
| Specific heat ratio | n | - | 0.285 |
| Description | Parameter | Unit | Range |
|---|---|---|---|
| Compression ratio | Rp | - | 3–15 |
| Air temperature before combustor | T15 | °C | 347–427 |
| Turbine inlet temperature | T16 | °C | 700–1200 |
| Parameter | Unit | Range |
|---|---|---|
| T1 | °C | 25 |
| P1 | Bar | 1.013 |
| T15 | °C | 377 |
| T16 | °C | 927 |
| Rp | - | 10 |
| ηAC | - | 0.86 |
| ηGT | - | 0.86 |
| T19 | °C | 153 |
| Parameter | Unit | Range |
|---|---|---|
| Steam Turbine inlet temperature, T21 | °C | 500 |
| Steam Turbine inlet pressure, P21 | Bar | 30 |
| Condenser pressure, P22 | Bar | 0.75 |
| Parameter | Unit | Base Study | Variation [39,42,48] | |
|---|---|---|---|---|
| WWTP | Effluent total BOD, BOD9 | mg/L | 20 | 15–25 |
| Dissolved Oxygen Level, DO | mg/L | 3 | 2–4 | |
| Gas Turbine Cycle | Gas Turbine inlet temperature, T16 | °C | 1200 | 700–1200 |
| Compression ratio, Rp | - | 10 | 3–15 | |
| Air preheater temperature, T15 | °C | 377 | 347–427 |
| Component | Power/Heat Transfer Rate (kW) | Exergy Destruction Rate (kW) | Exergy Efficiency (%) |
|---|---|---|---|
| Compressor 1 | 103.1 | 13.5 | 86.9 |
| Compressor 2 | 147.2 | 10.4 | 92.9 |
| Combustion chamber | 371.7 | 160.9 | 68.0 |
| Gas turbine | 288.8 | 14.9 | 95.1 |
| Heat exchanger 1 | 19.07 | 6.4 | 55.9 |
| Heat exchanger 2 | 274.1 | 38.0 | 74.9 |
| State | Fluid | (kg/s) | P (bar) | T (°C) | h (kj/kg) | s (kj/kgK) | ex (kj/kg) |
|---|---|---|---|---|---|---|---|
| 0 | Water | 0 | 1.00 | 25.0 | 104.9 | 0.367 | 0 |
| 1 | Sewage | 250 | 1.00 | 25.5 | 107.0 | 0.374 | 8.996 |
| 2 | Sewage | 245 | 1.15 | 25.6 | 107.4 | 0.376 | 9.012 |
| 3 | Sewage | 245.5 | 1.18 | 25.7 | 107.9 | 0.377 | 5.021 |
| 4 | Sludge | 1.05 | 10.90 | 25.1 | 106.3 | 0.369 | 771.1 |
| 5 | Sewage | 241.7 | 1.71 | 25.3 | 106.2 | 0.371 | 3.064 |
| 6 | Sludge | 4.189 | 13.77 | 25.1 | 106.5 | 0.368 | 57.7 |
| 7 | Sludge | 0.4143 | 8.20 | 25.1 | 106.0 | 0.368 | 514.1 |
| 8 | Treated Water | 237.5 | 1.71 | 25.3 | 106.2 | 0.371 | 0.9473 |
| 9 | Sludge | 1.464 | 6.00 | 25.1 | 105.6 | 0.368 | 698 |
| 10 | Digestate | 1.028 | 1.05 | 32.0 | 134.2 | 0.464 | 642.1 |
| 11 | Digestate | 0.2051 | 1.10 | 27.0 | 113.3 | 0.395 | 2824 |
| 12 | Biogas | 0.009776 | 1.00 | 35.0 | −4627.2 | 11.691 | 51,382 |
| 13 | Air | 0.4513 | 1.01 | 25.0 | −164.5 | 6.954 | 0 |
| 14 | Air | 0.4513 | 10.13 | 337.7 | 161.6 | 7.032 | 303 |
| 15 | Air | 0.4513 | 9.62 | 376.9 | 203.9 | 7.114 | 320.8 |
| 16 | Exhaust gas | 0.4611 | 9.14 | 1200.0 | 79.4 | 8.315 | 1054 |
| 17 | Exhaust gas | 0.4611 | 1.10 | 706.6 | −546.9 | 8.424 | 395.6 |
| 18 | Exhaust gas | 0.4611 | 1.07 | 672.6 | −588.2 | 8.390 | 364.4 |
| 19 | Exhaust gas | 0.4611 | 1.01 | 153.8 | −1182.6 | 7.501 | 35.15 |
| 20 | Water | 0.08928 | 30.00 | 91.9 | 387.5 | 1.213 | 32.82 |
| 21 | Water | 0.08928 | 30.00 | 500.0 | 3457.2 | 7.236 | 1307 |
| 22 | Water | 0.08928 | 0.75 | 91.8 | 2582.2 | 7.236 | 431.9 |
| 23 | Water | 0.08928 | 0.75 | 91.8 | 384.4 | 1.213 | 29.79 |
| 24 | Air | 2.187 | 1.01 | 25.0 | −164.5 | 6.954 | 0 |
| 25 | Air | 2.187 | 1.57 | 71.2 | −117.3 | 6.975 | 40.97 |
Publisher’s Note: MDPI stays neutral with regard to jurisdictional claims in published maps and institutional affiliations. |
© 2021 by the authors. Licensee MDPI, Basel, Switzerland. This article is an open access article distributed under the terms and conditions of the Creative Commons Attribution (CC BY) license (https://creativecommons.org/licenses/by/4.0/).
Share and Cite
Erguvan, M.; MacPhee, D.W. Can a Wastewater Treatment Plant Power Itself? Results from a Novel Biokinetic-Thermodynamic Analysis. J 2021, 4, 614-637. https://doi.org/10.3390/j4040045
Erguvan M, MacPhee DW. Can a Wastewater Treatment Plant Power Itself? Results from a Novel Biokinetic-Thermodynamic Analysis. J. 2021; 4(4):614-637. https://doi.org/10.3390/j4040045
Chicago/Turabian StyleErguvan, Mustafa, and David W. MacPhee. 2021. "Can a Wastewater Treatment Plant Power Itself? Results from a Novel Biokinetic-Thermodynamic Analysis" J 4, no. 4: 614-637. https://doi.org/10.3390/j4040045