
A Cost-Effective IoT Model for a Smart Sewerage Management System Using Sensors

 ,
, 
 ,
,  ,
,  and
and 
Abstract
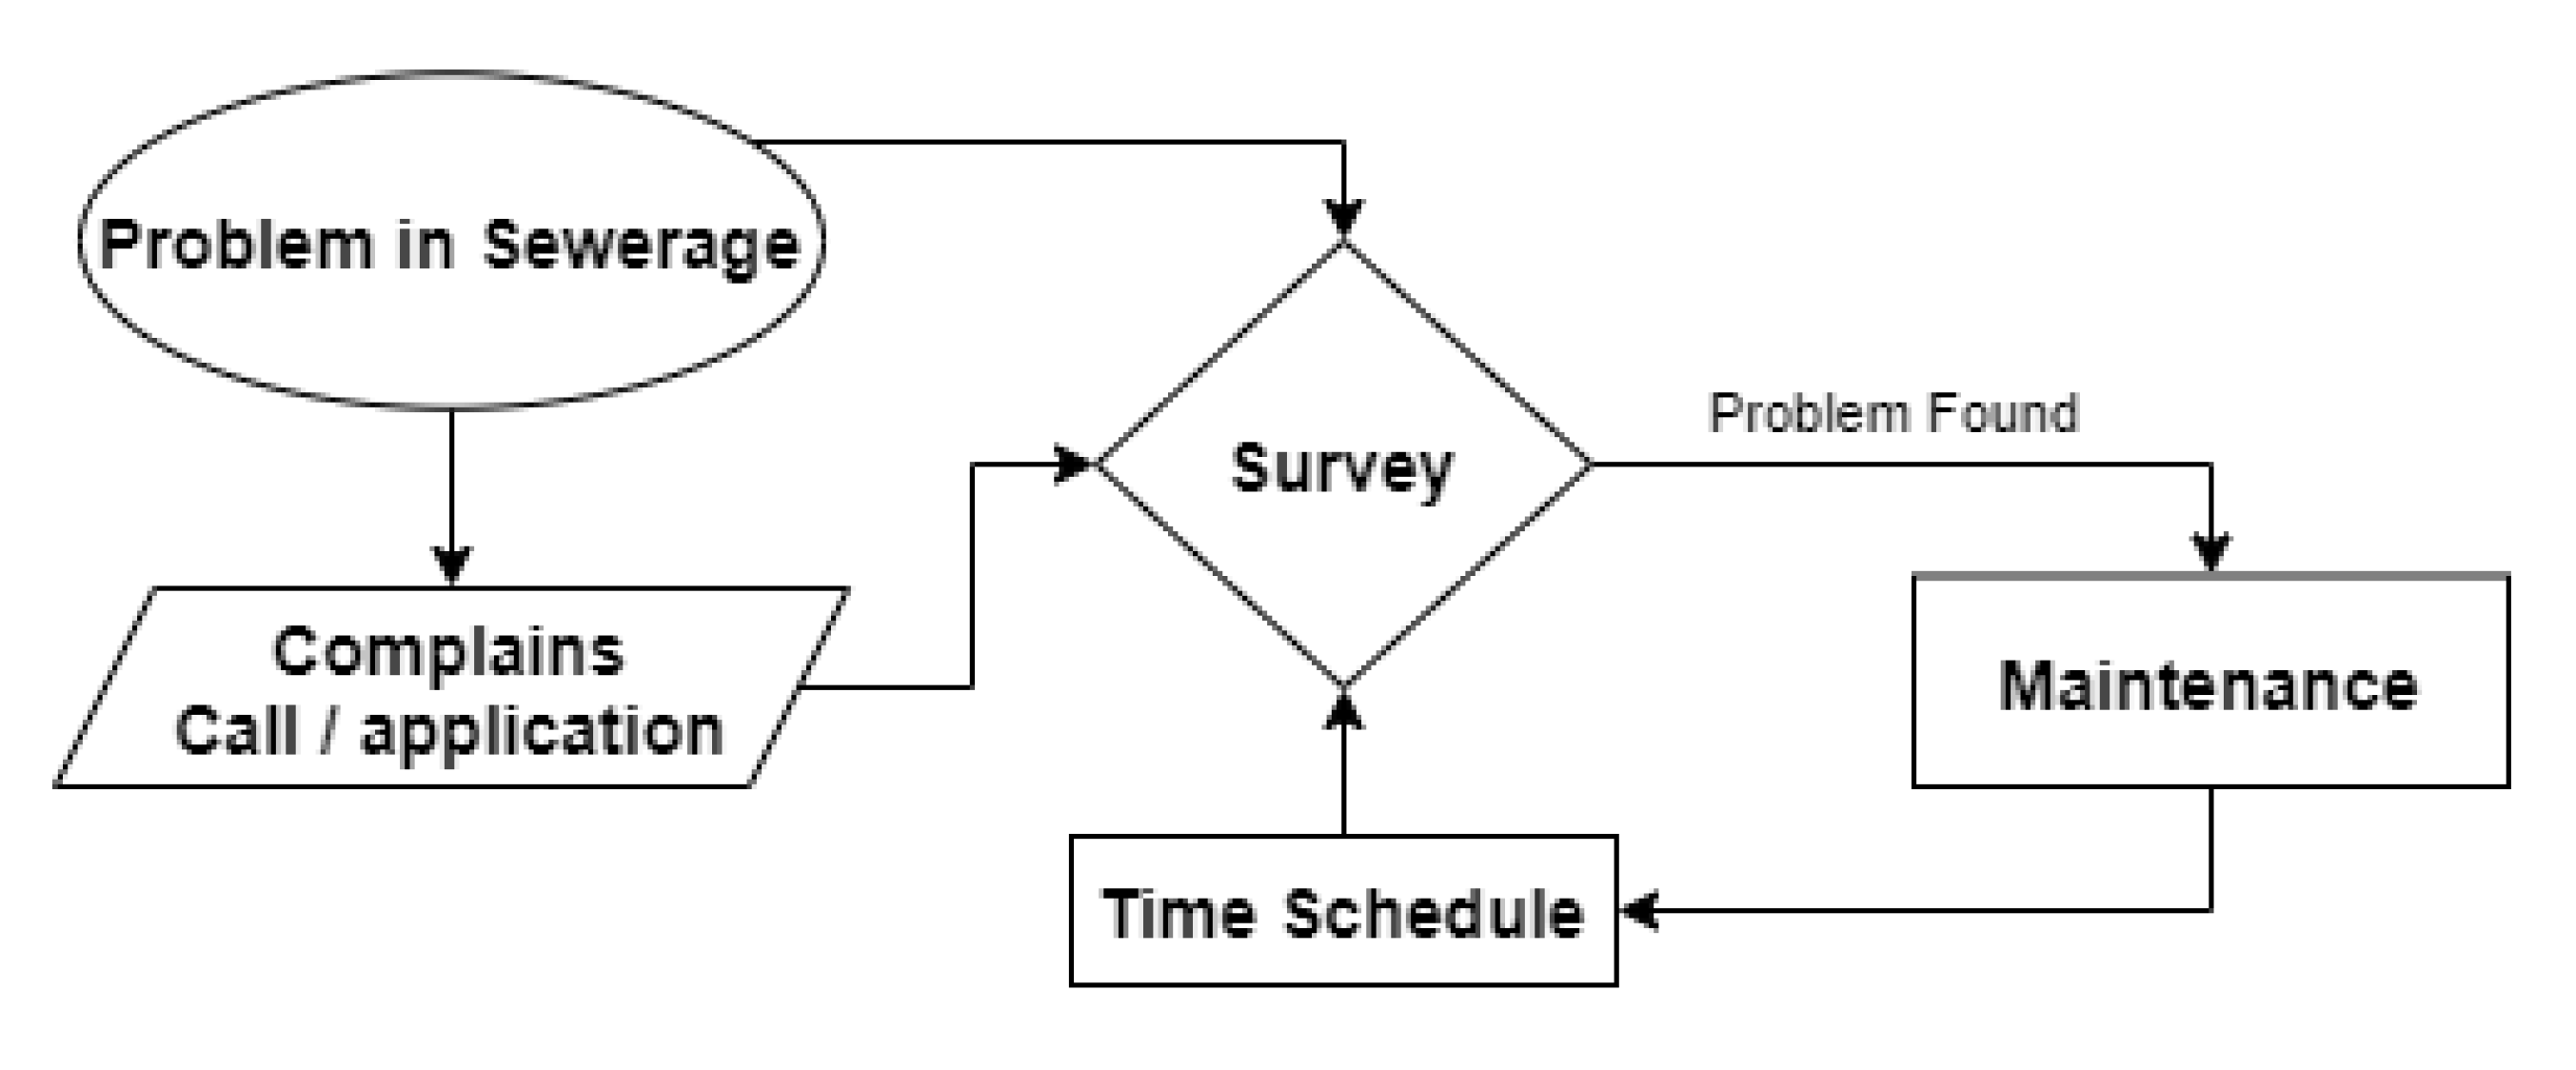
:1. Introduction
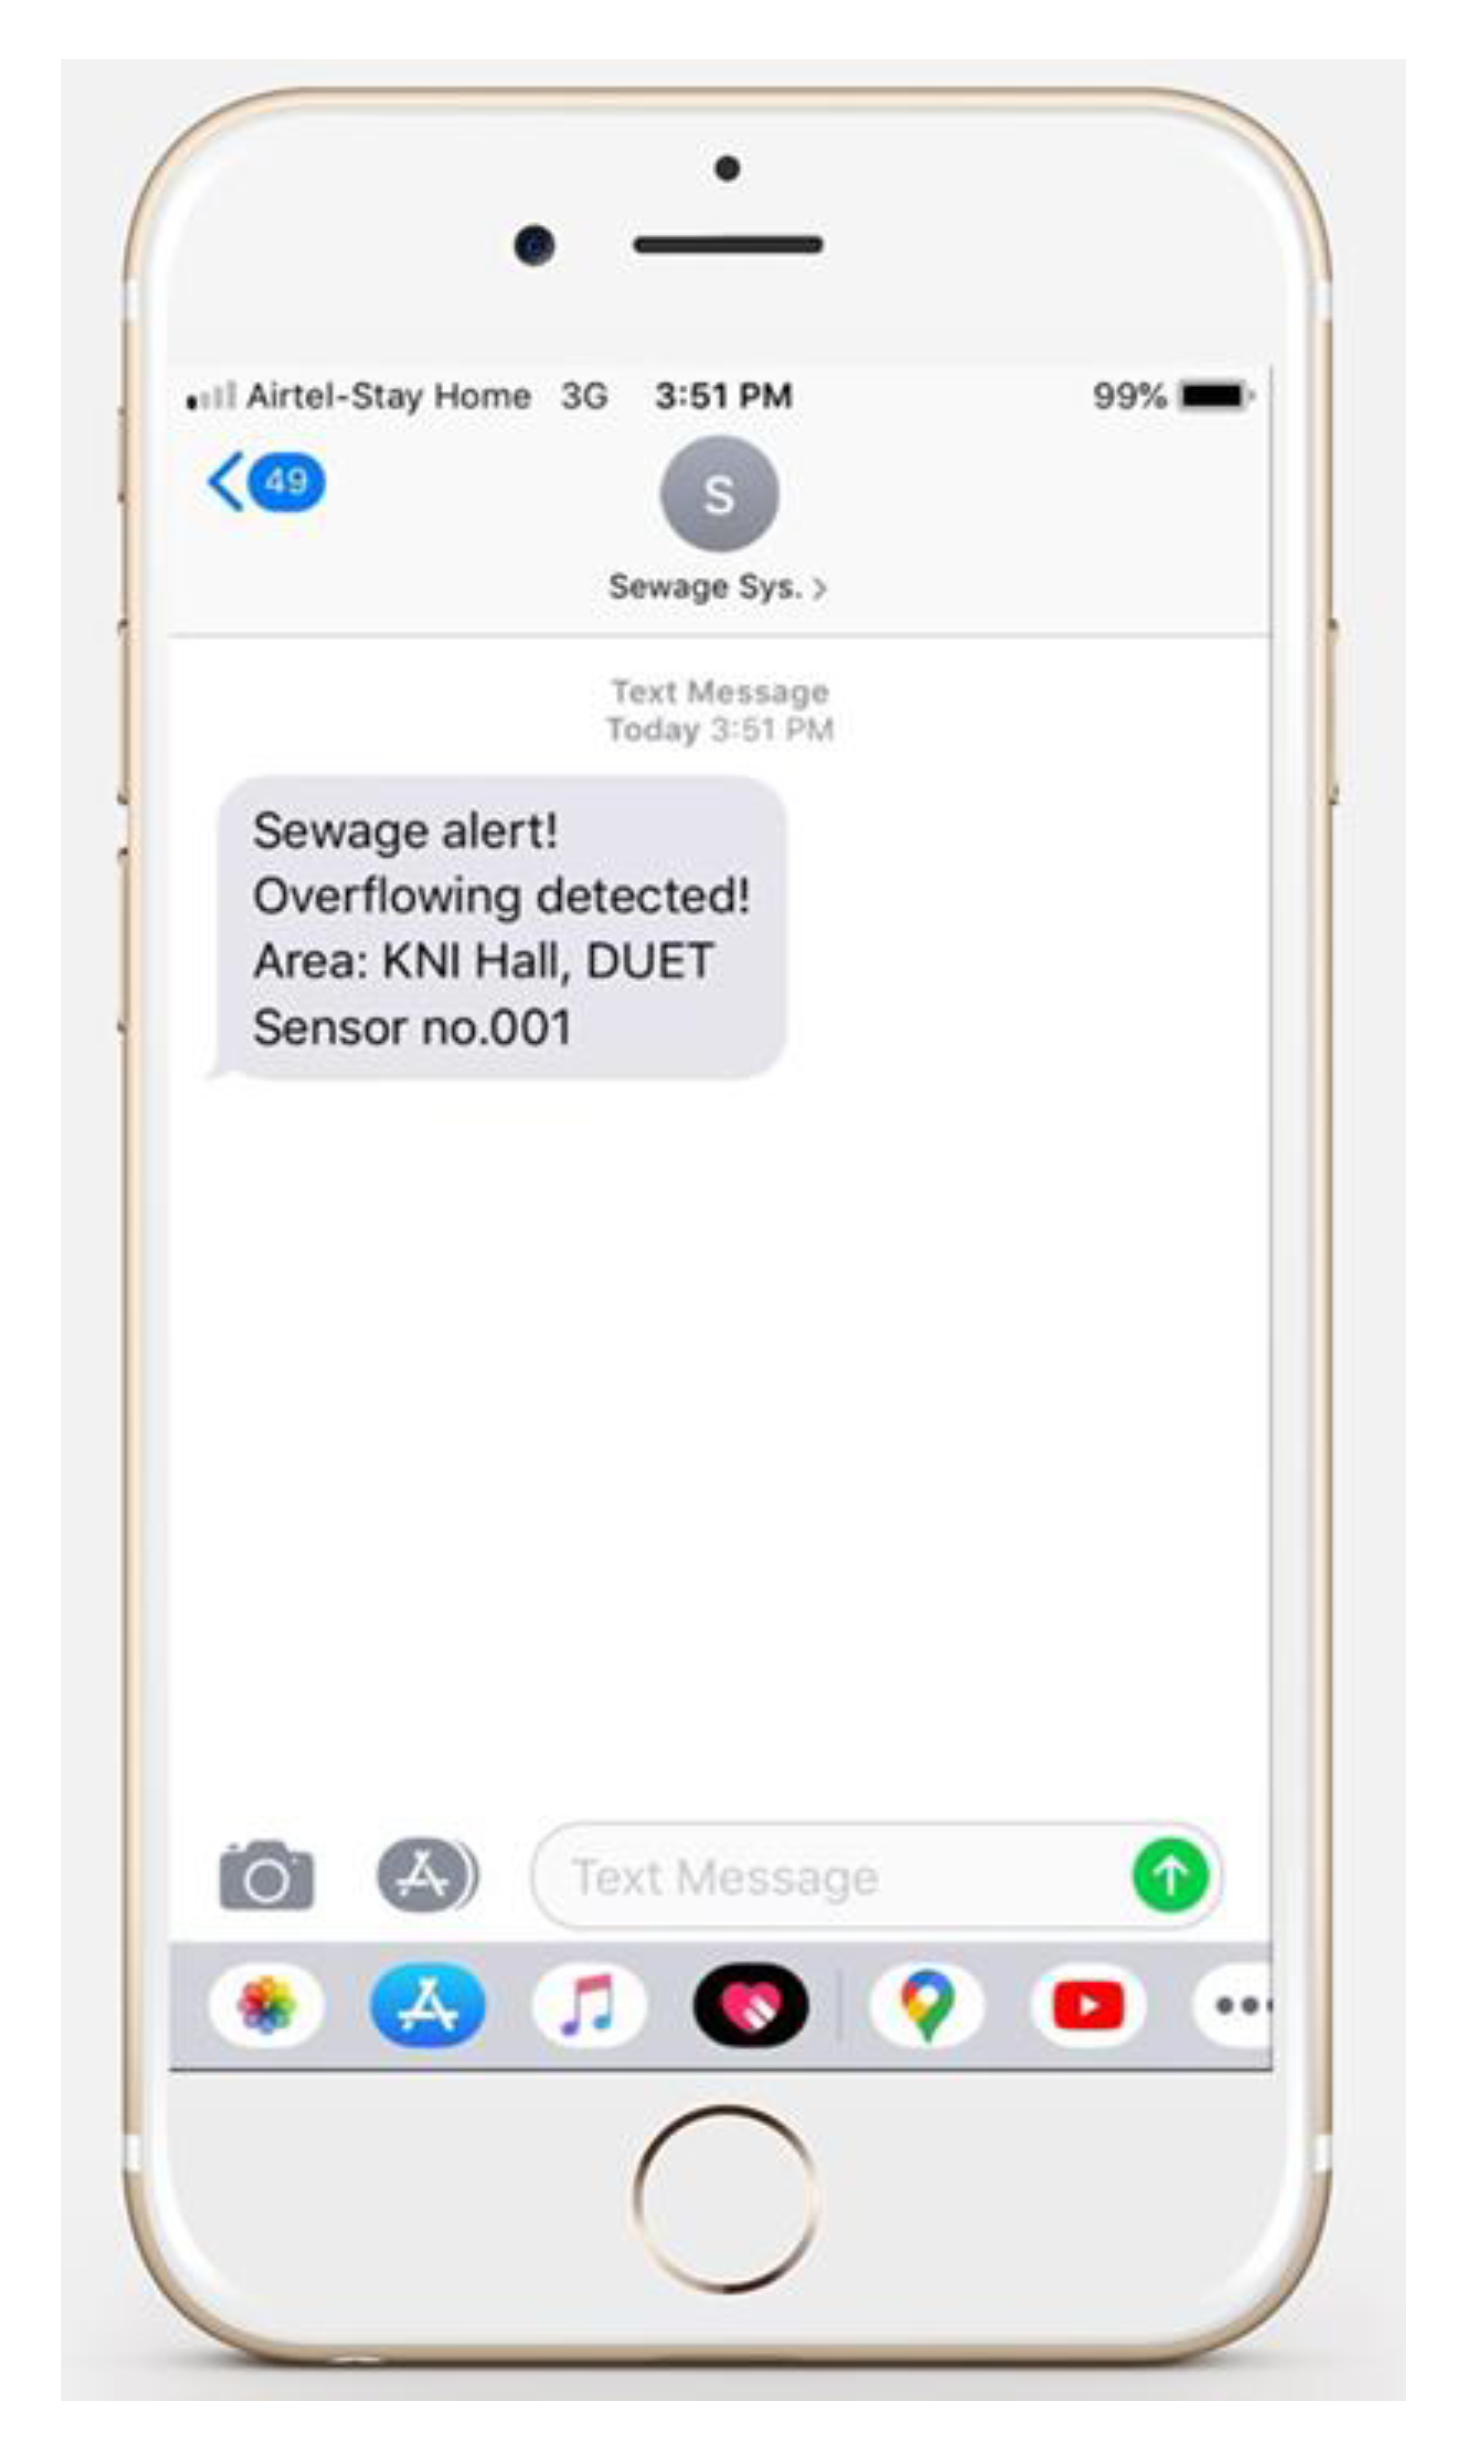
- Low-cost real-time monitoring.
- Overflow detection.
- SMS alerts.
- Waste-removing mechanisms.
2. Literature Review
3. Methodology
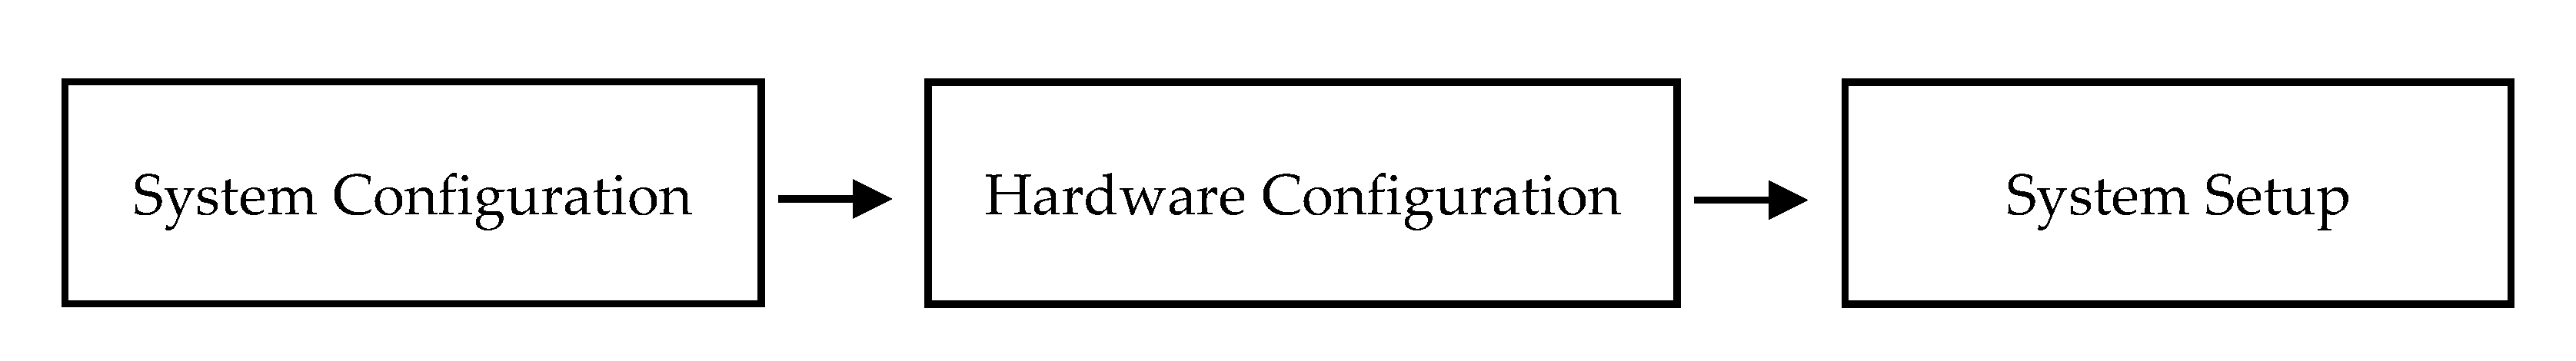
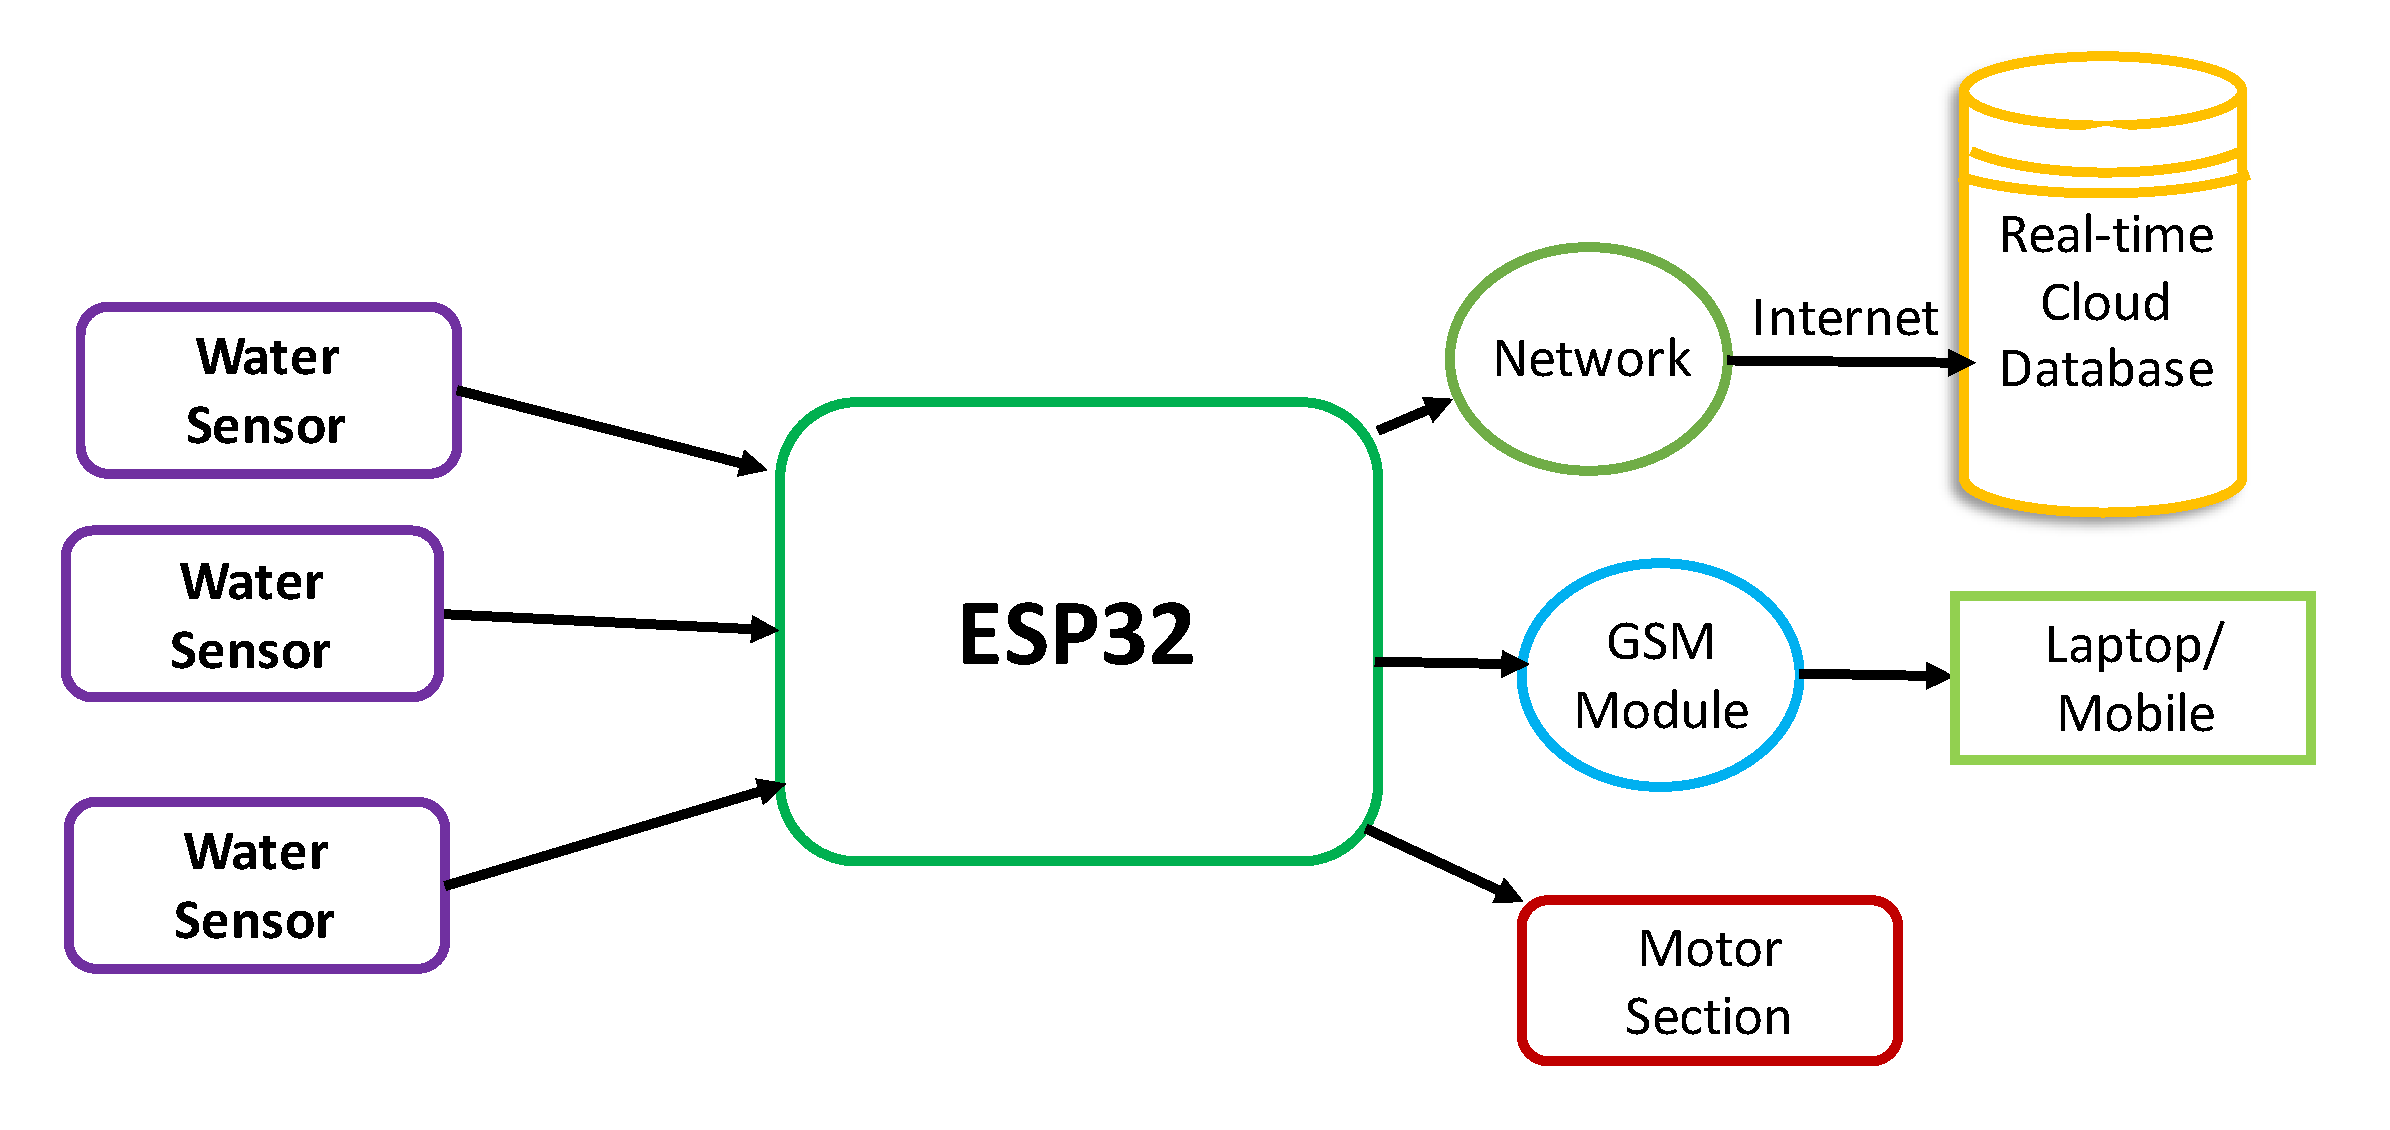
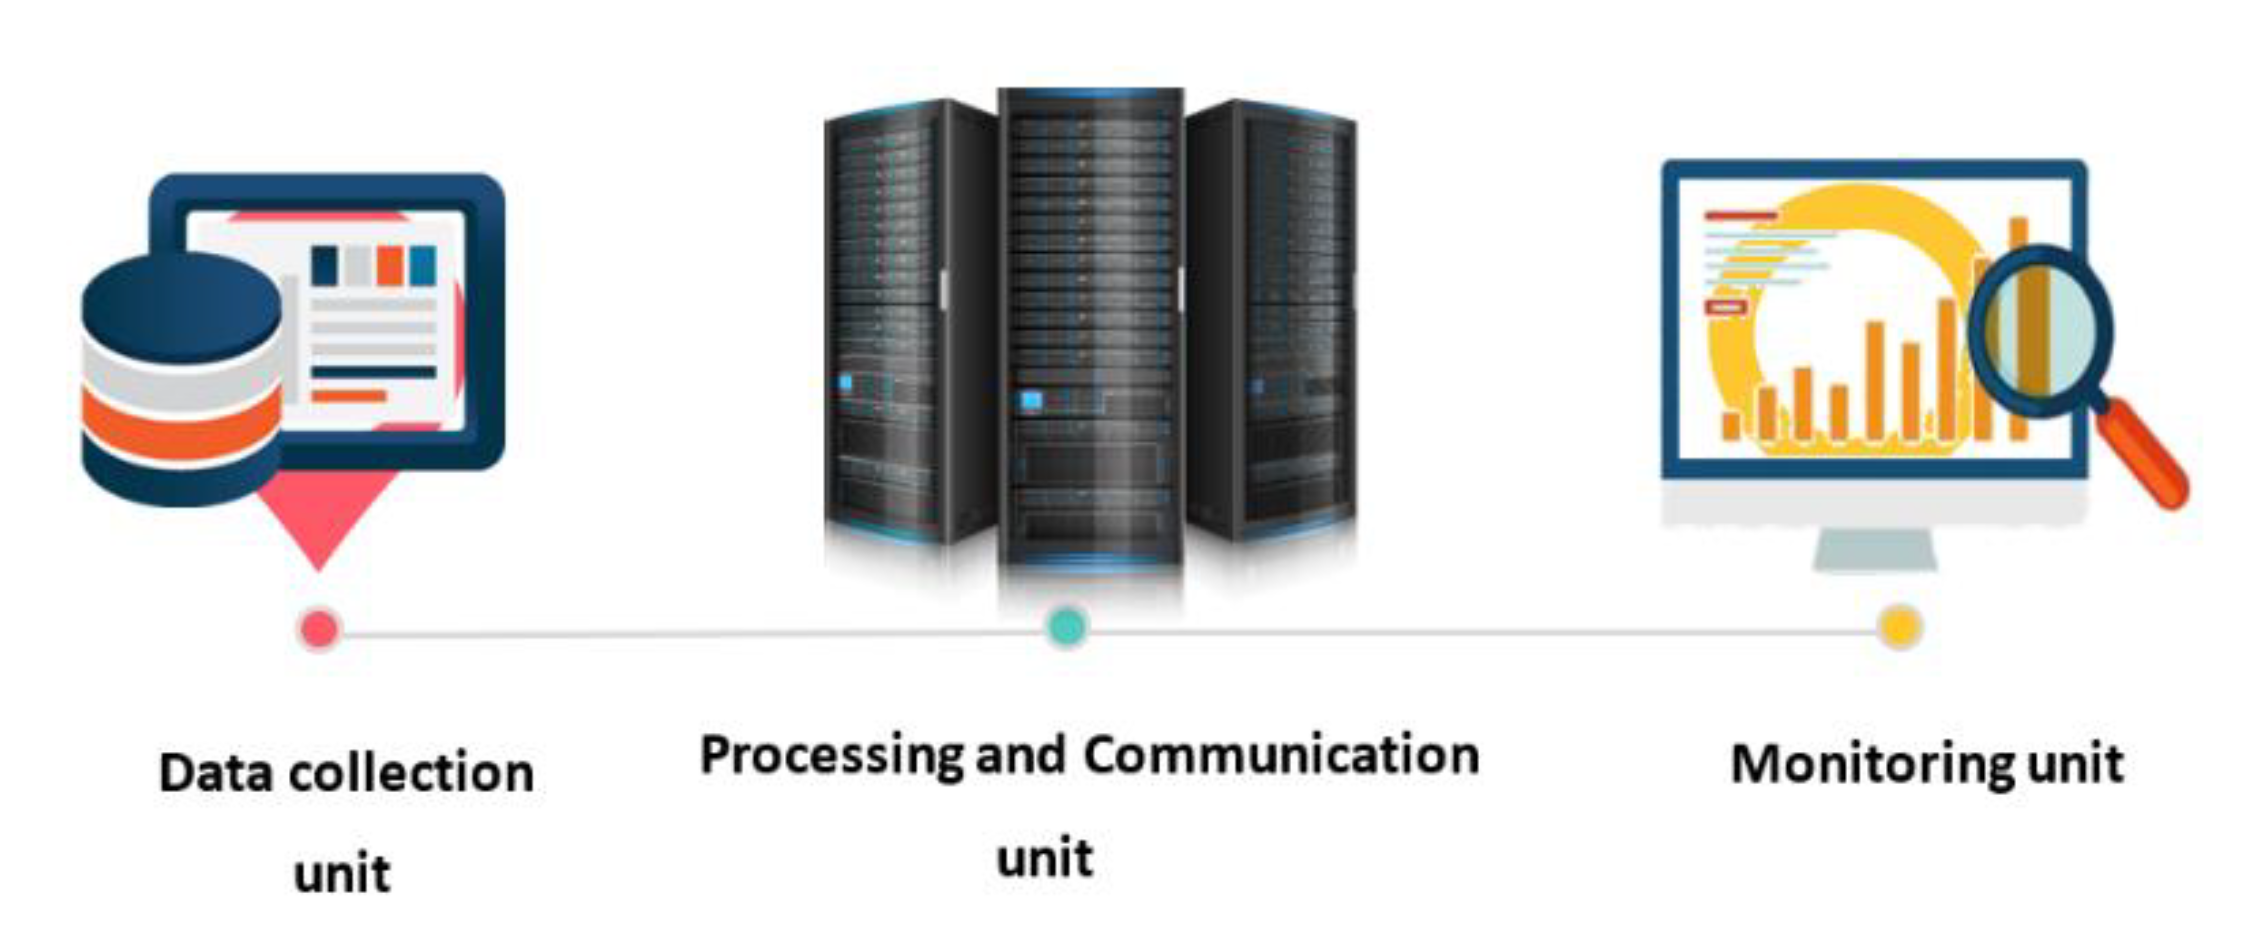
3.1. System Configuration
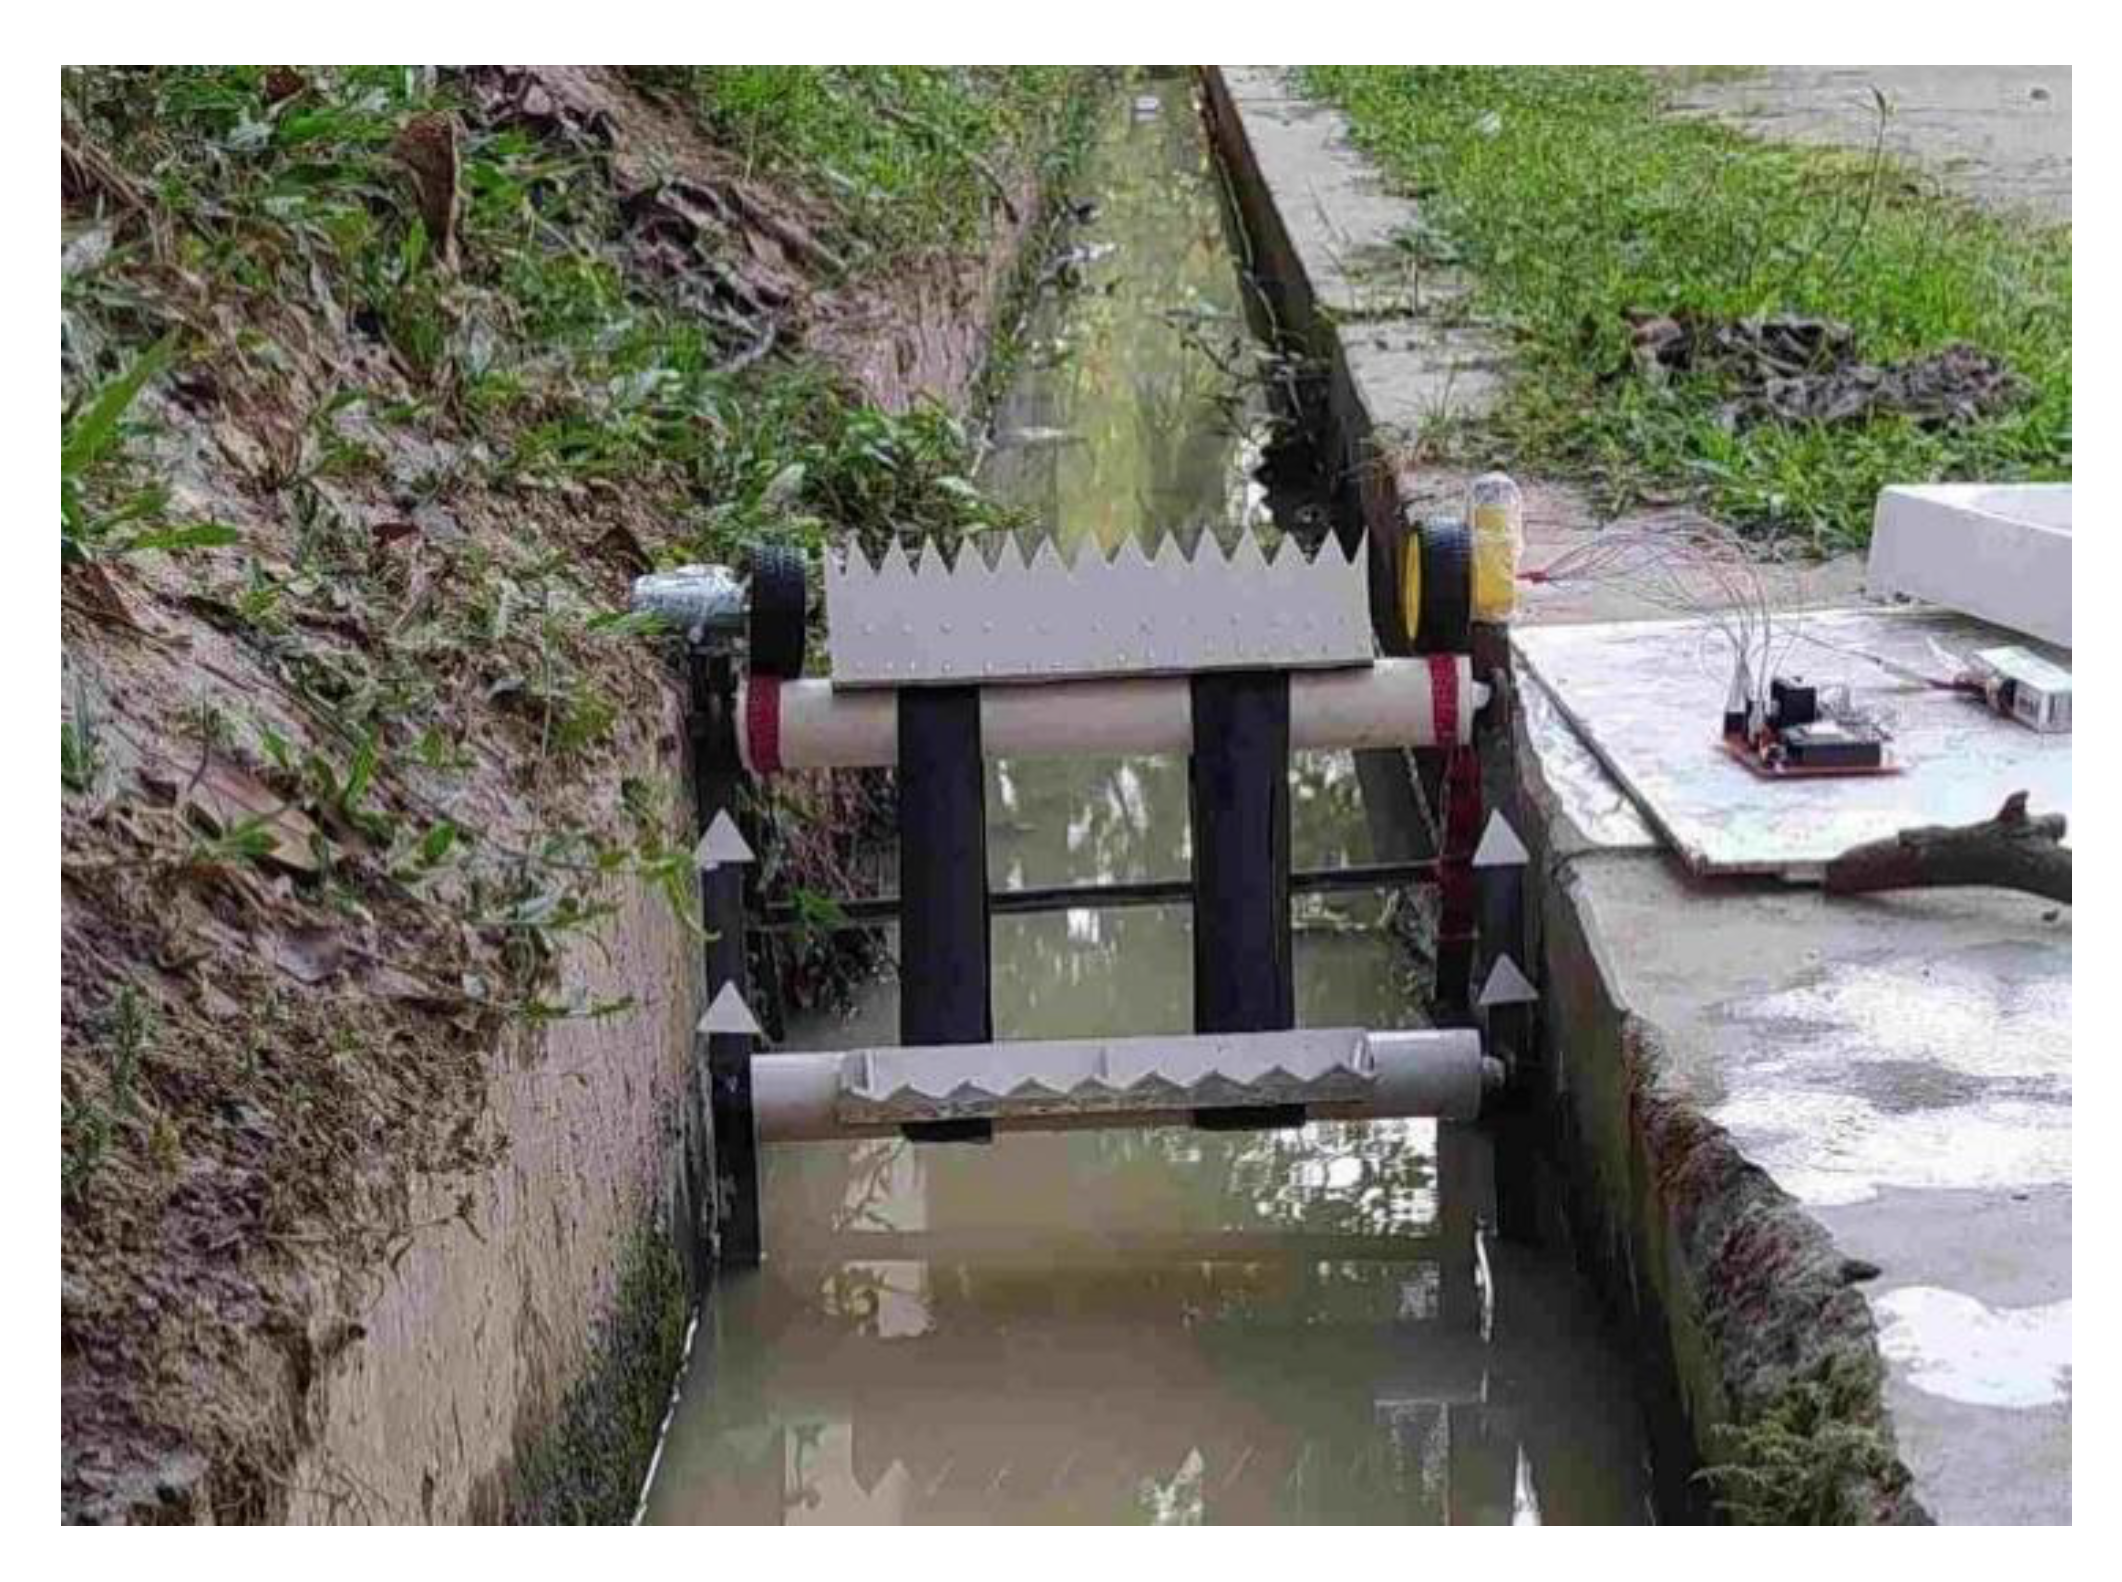
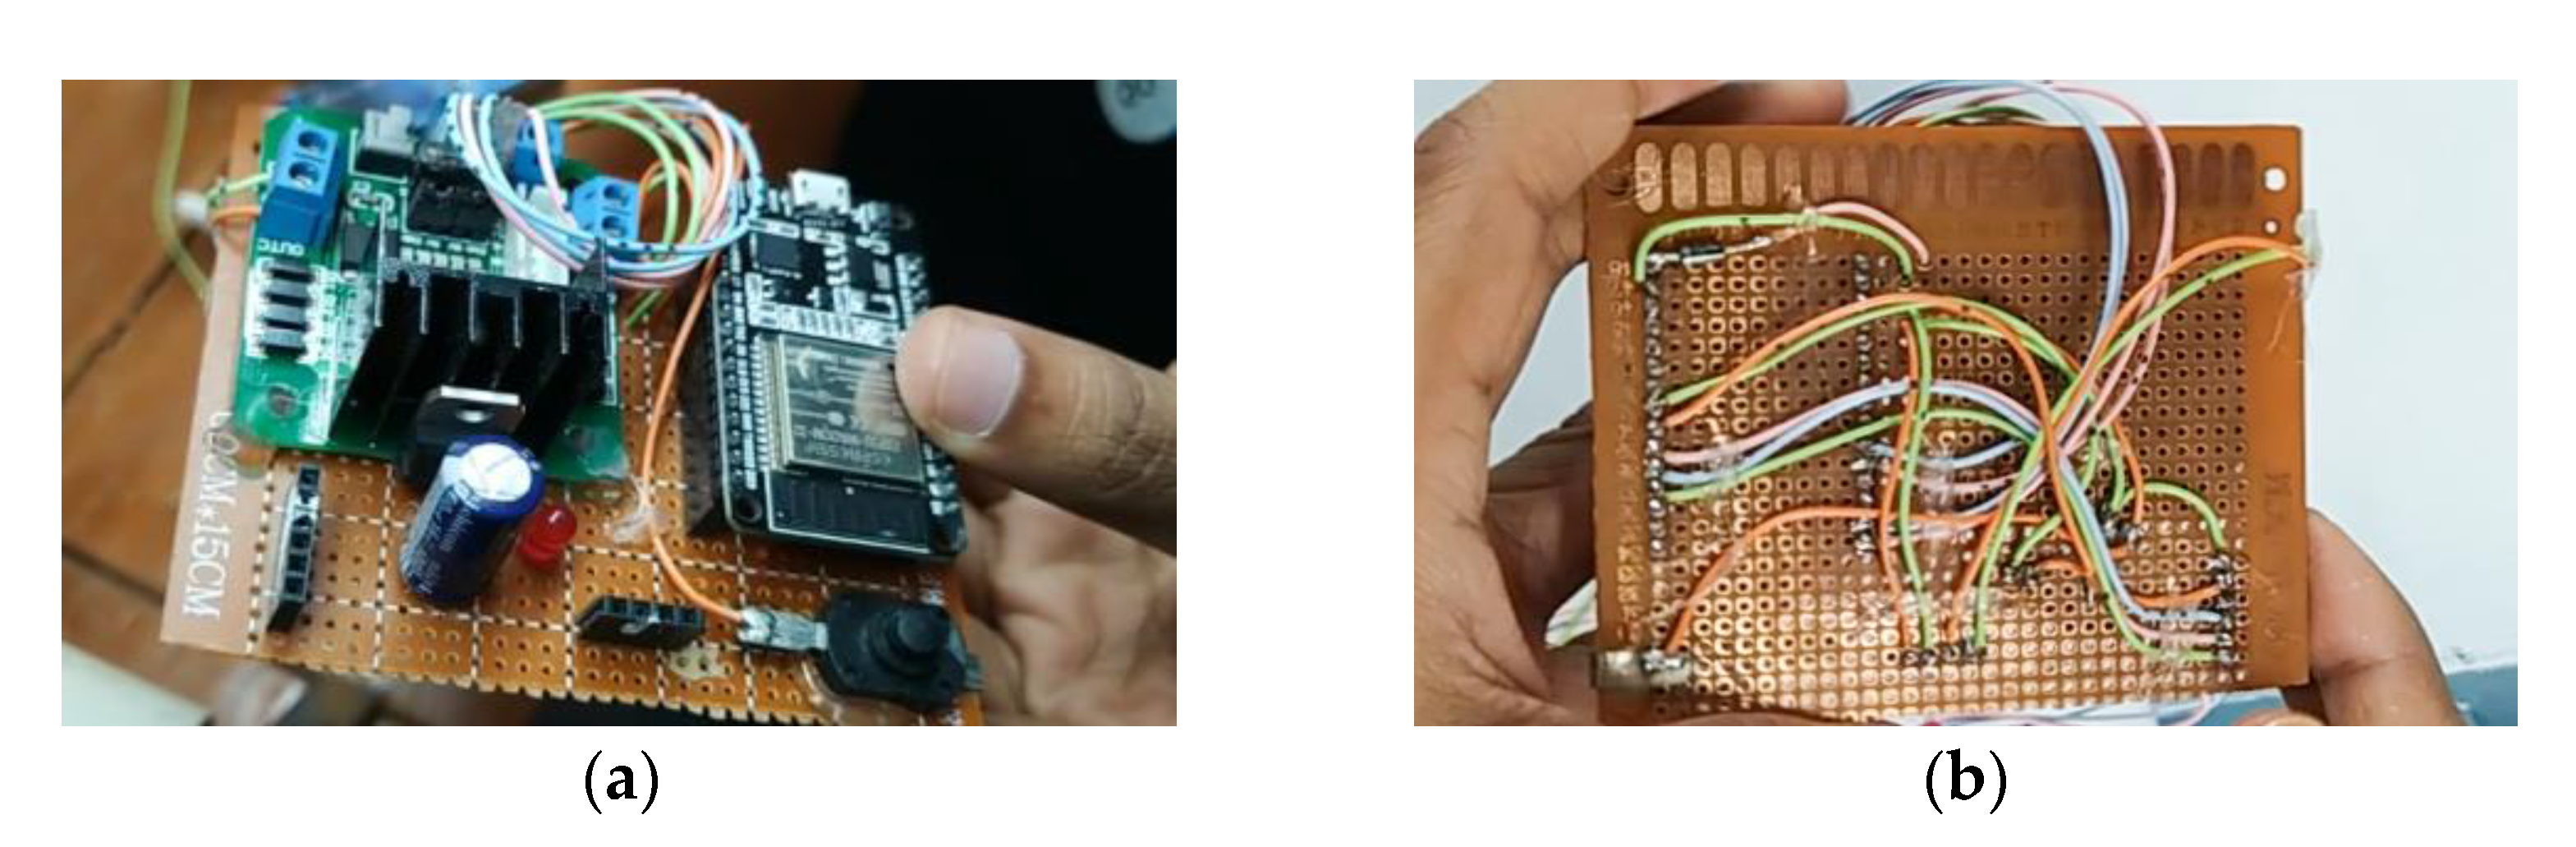
3.2. Hardware Configuration
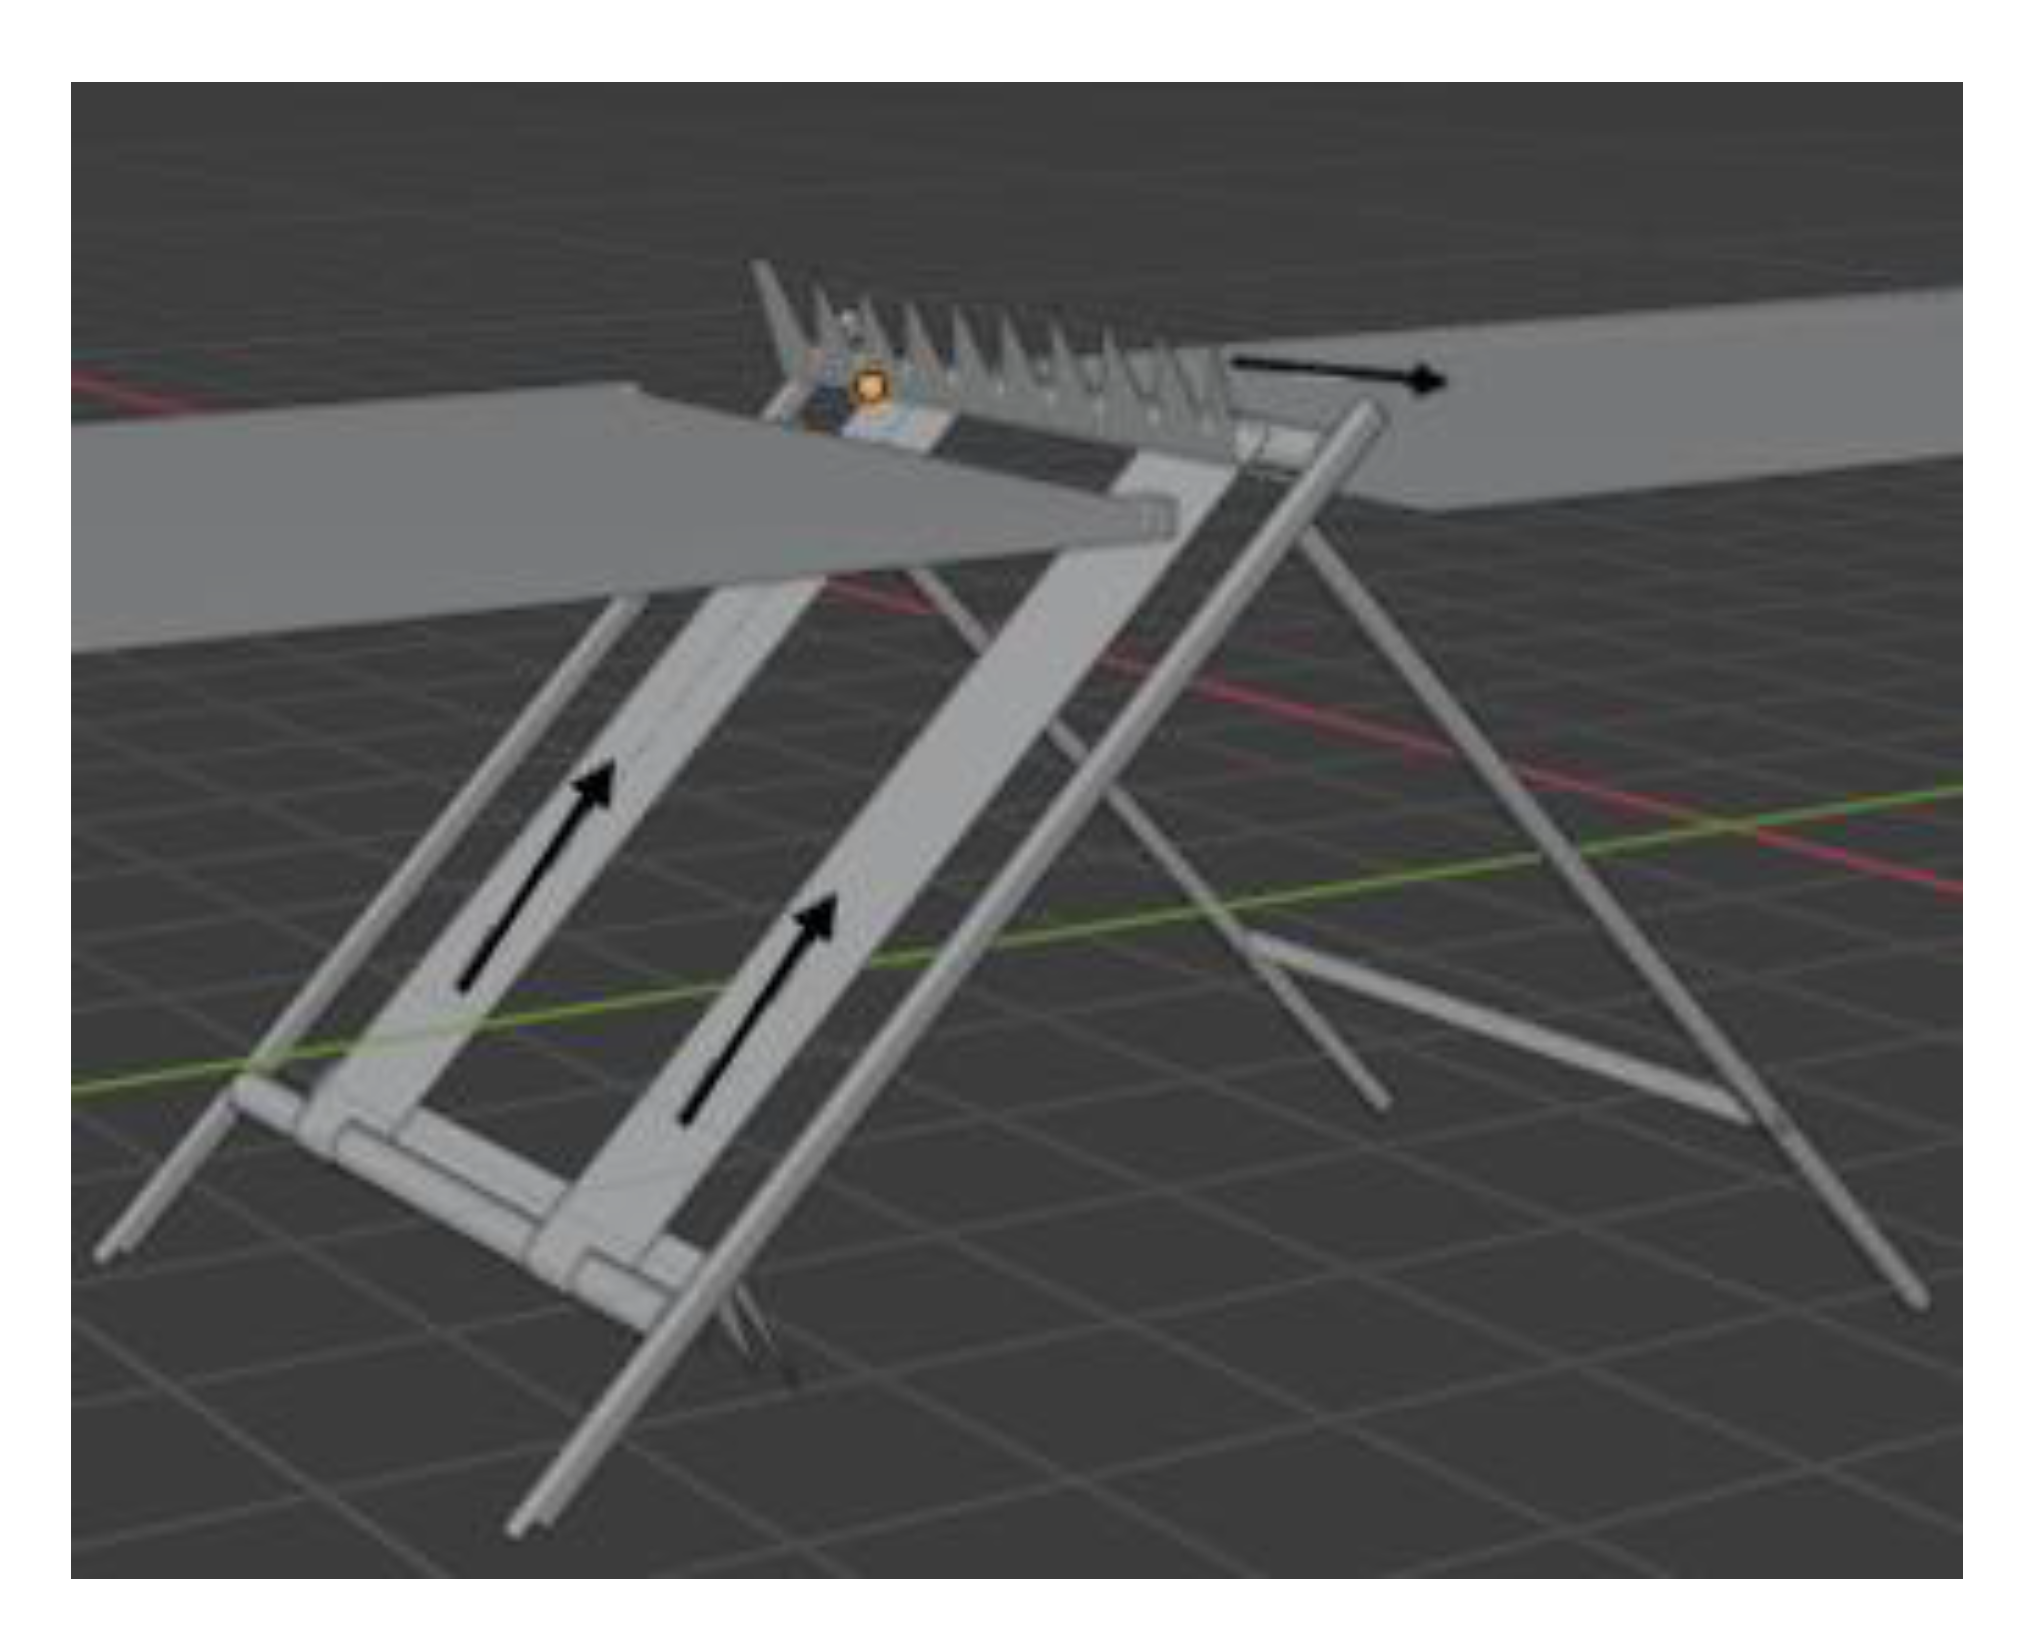
3.3. System Setup
4. Results and Discussion
5. Conclusions
Author Contributions
Funding
Data Availability Statement
Conflicts of Interest
References
- Health Definition. Available online: https://www.who.int/about/who-we-are/frequently-asked-questions (accessed on 30 April 2021).
- Jahan, M. Impact of Rural Urban Migration on Physical and Social Environment: The Case of Dhaka City. Int. J. Dev. Sustain. 2012, 1, 186–194. [Google Scholar]
- List of Countries and Dependencies by Population Density. Available online: https://en.wikipedia.org/wiki/List_of_countries_and_dependencies_by_population_density (accessed on 30 April 2021).
- Dhaka Population 2021 (Demographics, Maps, Graphs). Available online: https://worldpopulationreview.com/world-cities/dhaka (accessed on 30 April 2021).
- Dhaka. Available online: https://en.wikipedia.org/wiki/Dhaka (accessed on 30 April 2021).
- Tiwari, R.R. Occupational health hazards in sewage and sanitary workers. Indian J. Occup. Environ. Med. 2008, 12, 112–115. [Google Scholar] [CrossRef] [PubMed] [Green Version]
- Khan, E.T.A. Dhaka Water Supply and Sewerage Authority: Performance and Challenges. Available online: http://app.dwasa.org.bd/admin/news/Dhaka%20WASA%20Article-for%20BOOK.pdf (accessed on 30 April 2021).
- Reza, A.; Yousuf, T. Impacts of Waste Dumping on Water Quality in the Buriganga River, Bangladesh and Possible Mitigation Measures. J. Environ. 2016, 11, 35–40. [Google Scholar]
- Annual Floor Report. Available online: http://www.ffwc.gov.bd/images/annual19.pdf (accessed on 30 April 2021).
- Nahrin, K. Urban development policies for the provision of utility infrastructure: A case study of Dhaka, Bangladesh. Util. Policy 2018, 54, 107–114. [Google Scholar] [CrossRef]
- Madakam, S.; Ramaswamy, R.; Tripathi, S. Internet of Things (IoT): A literature review. J. Comput. Commun. 2015, 3, 164–173. [Google Scholar] [CrossRef] [Green Version]
- IP Sensing—Telemetry Solutions for Water and Sewer Utilities—Automatic Water Meter Reading AMR, Vacuum Sewer System VSS—Pit-Bull Radio System. Available online: http://ipsensing.com/smms_management.htm (accessed on 30 April 2021).
- Applications of the IP Camera in the Sewage Treatment Plant. Available online: https://en.cnki.com.cn/Article_en/CJFDTotal-GZXG201103012.htm (accessed on 30 April 2021).
- Talukder, S.; Sakib, I.I.; Talukder, Z.R.; Das, U.; Saha, A.; Bayev, N.S.N. USenSewer: Ultrasonic Sensor and GSM-Arduino based Automated Sewerage Management. In Proceedings of the 2017 International Conference on Current Trends in Computer, Electrical, Electronics and Communication (CTCEEC), Mysore, India, 8–9 September 2017; Institute of Electrical and Electronics Engineers (IEEE): Piscataway, NJ, USA, 2017; pp. 12–17. [Google Scholar]
- Latif, S.L.; Afzaal, H.A.; Zafar, N.A. Modeling of Sewerage System Using Internet of Things for Smart City. In Proceedings of the 2017 International Conference on Frontiers of Information Technology (FIT), Islamabad, Pakistan, 18–20 December 2017; Institute of Electrical and Electronics Engineers (IEEE): Piscataway, NJ, USA, 2017; pp. 46–51. [Google Scholar]
- Edmondson, V.; Cerny, M.; Lim, M.; Gledson, B.; Lockley, S.; Woodward, J. A smart sewer asset information model to enable an ‘Internet of Things’ for operational wastewater management. Autom. Constr. 2018, 91, 193–205. [Google Scholar] [CrossRef]
- Liu, Y.; Zhang, W.; Cui, X.; Zhang, G.; Wang, G. City Pipe Network Intelligent Service Based on GIS and Internet of Things. In Proceedings of the 2014 7th International Conference on Intelligent Computation Technology and Automation, Changsha, China, 24–26 October 2014; Institute of Electrical and Electronics Engineers (IEEE): Piscataway, NJ, USA, 2014; pp. 936–939. [Google Scholar]
- Brandstetter, A.; Engel, R.L.; Cearlock, D.B. A Mathematical Model for Optimum Design and Control of Metropolitan Wastewater Management Systems. J. Am. Water Resour. Assoc. 1973, 9, 1188–1200. [Google Scholar] [CrossRef]
- Cao, L. Wireless mesh monitoring system for sewage treatment plant. In Proceedings of the 2009 ISECS International Colloquium on Computing, Communication, Control, and Management, Sanya, China, 8–9 August 2009; Volume 4, pp. 350–353. [Google Scholar] [CrossRef]
- Pasha, S. Thingspeak Based Sensing and Monitoring System for IoT with Matlab Analysis. Int. J. New Technol. Res. 2016, 2, 5. [Google Scholar]
- Nasution, T.H.; Muchtar, M.A.; Siregar, I.; Andayani, U.; Christian, E.; Sinulingga, E.P. Electrical appliances control prototype by using GSM module and Arduino. In Proceedings of the 2017 4th International Conference on Industrial Engineering and Applications (ICIEA), Nagoya, Japan, 21–23 April 2017; Institute of Electrical and Electronics Engineers (IEEE): Piscataway, NJ, USA, 2017; pp. 355–358. [Google Scholar]
- Li, L.; Xiaoguang, H.; Ke, C.; Ketai, H. The Applications of WiFi-Based Wireless Sensor Network in Internet of Things and Smart Grid. In Proceedings of the 2011 6th IEEE Conference on Industrial Electronics and Applications, Beijing, China, 21–23 June 2011; pp. 789–793. [Google Scholar]
- Novo, O.; Beijar, N.; Ocak, M.; Kjallman, J.; Komu, M.; Kauppinen, T. Capillary networks—bridging the cellular and IoT worlds. In Proceedings of the 2015 IEEE 2nd World Forum on Internet of Things (WF-IoT), Milan, Italy, 14–16 December 2015; Institute of Electrical and Electronics Engineers (IEEE): Piscataway, NJ, USA, 2015; pp. 571–578. [Google Scholar]
- Guo, W.; Healy, W.M.; Zhou, M. ZigBee-Wireless Mesh Networks for Building Automation and Control. In Proceedings of the 2010 International Conference on Networking, Sensing and Control (ICNSC), Chicago, IL, USA, 10–12 April 2010; pp. 731–736. [Google Scholar]
- Lavric, A.; Popa, V. Internet of Things and LoRaTM Low-Power Wide-Area Networks: A Survey. In Proceedings of the 2017 International Symposium on Signals, Circuits and Systems (ISSCS), Iasi, Romania, 13–14 July 2017; pp. 1–5. [Google Scholar]
- Sengupta, N.; Chinnasamy, R. Designing of an Immaculate Smart City with Cloud Based Predictive Analytics. In Proceedings of the 2nd Smart Cities Symposium (SCS 2019), Zallaq, Bahrain, 24–26 March 2019; pp. 1–7. [Google Scholar]
- Islam, M.; Uddin, J.; Kashem, M.A.; Rabbi, F.; Hasnat, W. Design and Implementation of an IoT System for Predicting Aqua Fisheries Using Arduino and KNN. In Proceedings of the Intelligent Human Computer Interaction, Daegu, Korea, 24–26 November 2020; Singhm, M., Kang, D.-K., Lee, J.-H., Tiwary, U.S., Singh, D., Chung, W.Y., Eds.; Springer International Publishing: Cham, Switzerland, 2021; pp. 108–118. [Google Scholar]
- ESP32 Wi-Fi & Bluetooth MCU I Espressif Systems. Available online: https://www.espressif.com/en/products/socs/esp32 (accessed on 30 April 2021).
- GSM. Available online: https://en.wikipedia.org/w/index.php?title=GSM&oldid=1020444251 (accessed on 30 April 2021).
- IoT Based Home Automation System Using ThingSpeak. Available online: https://ieeexplore.ieee.org/document/8941737/ (accessed on 30 April 2021).
- Khan, E.T.A. Annual Report—Dwasa. Available online: https://bit.ly/2SdC8xM (accessed on 30 April 2021).


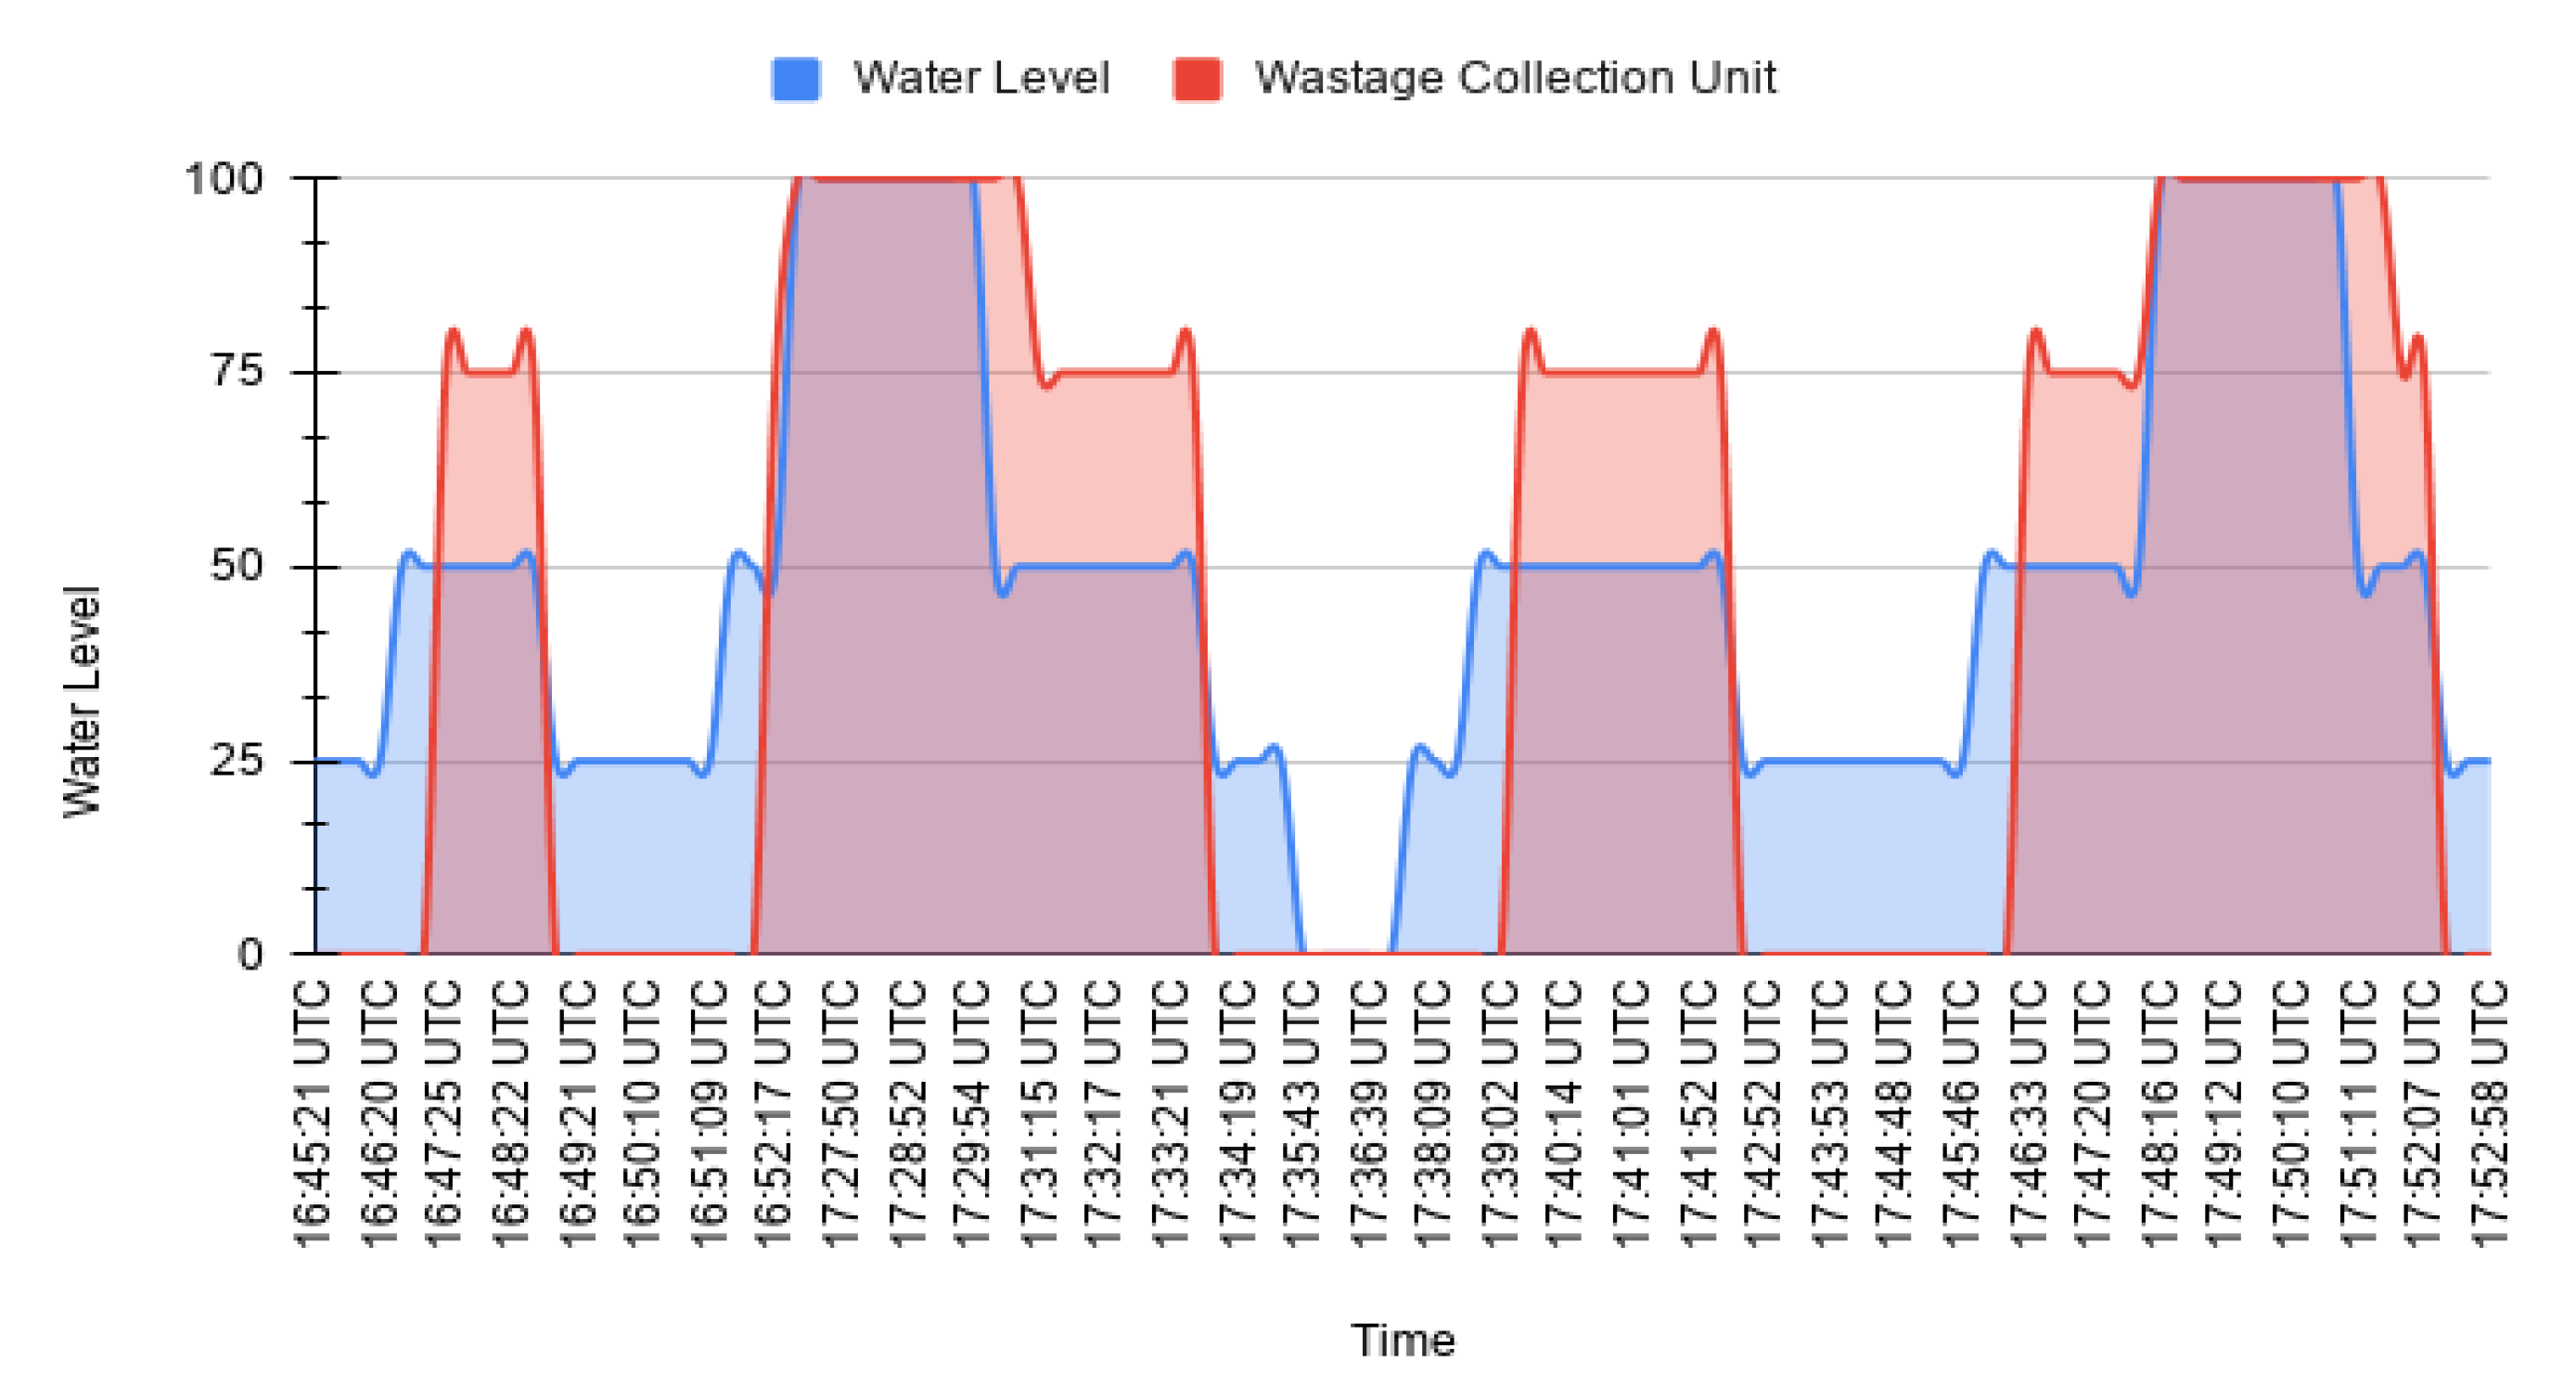
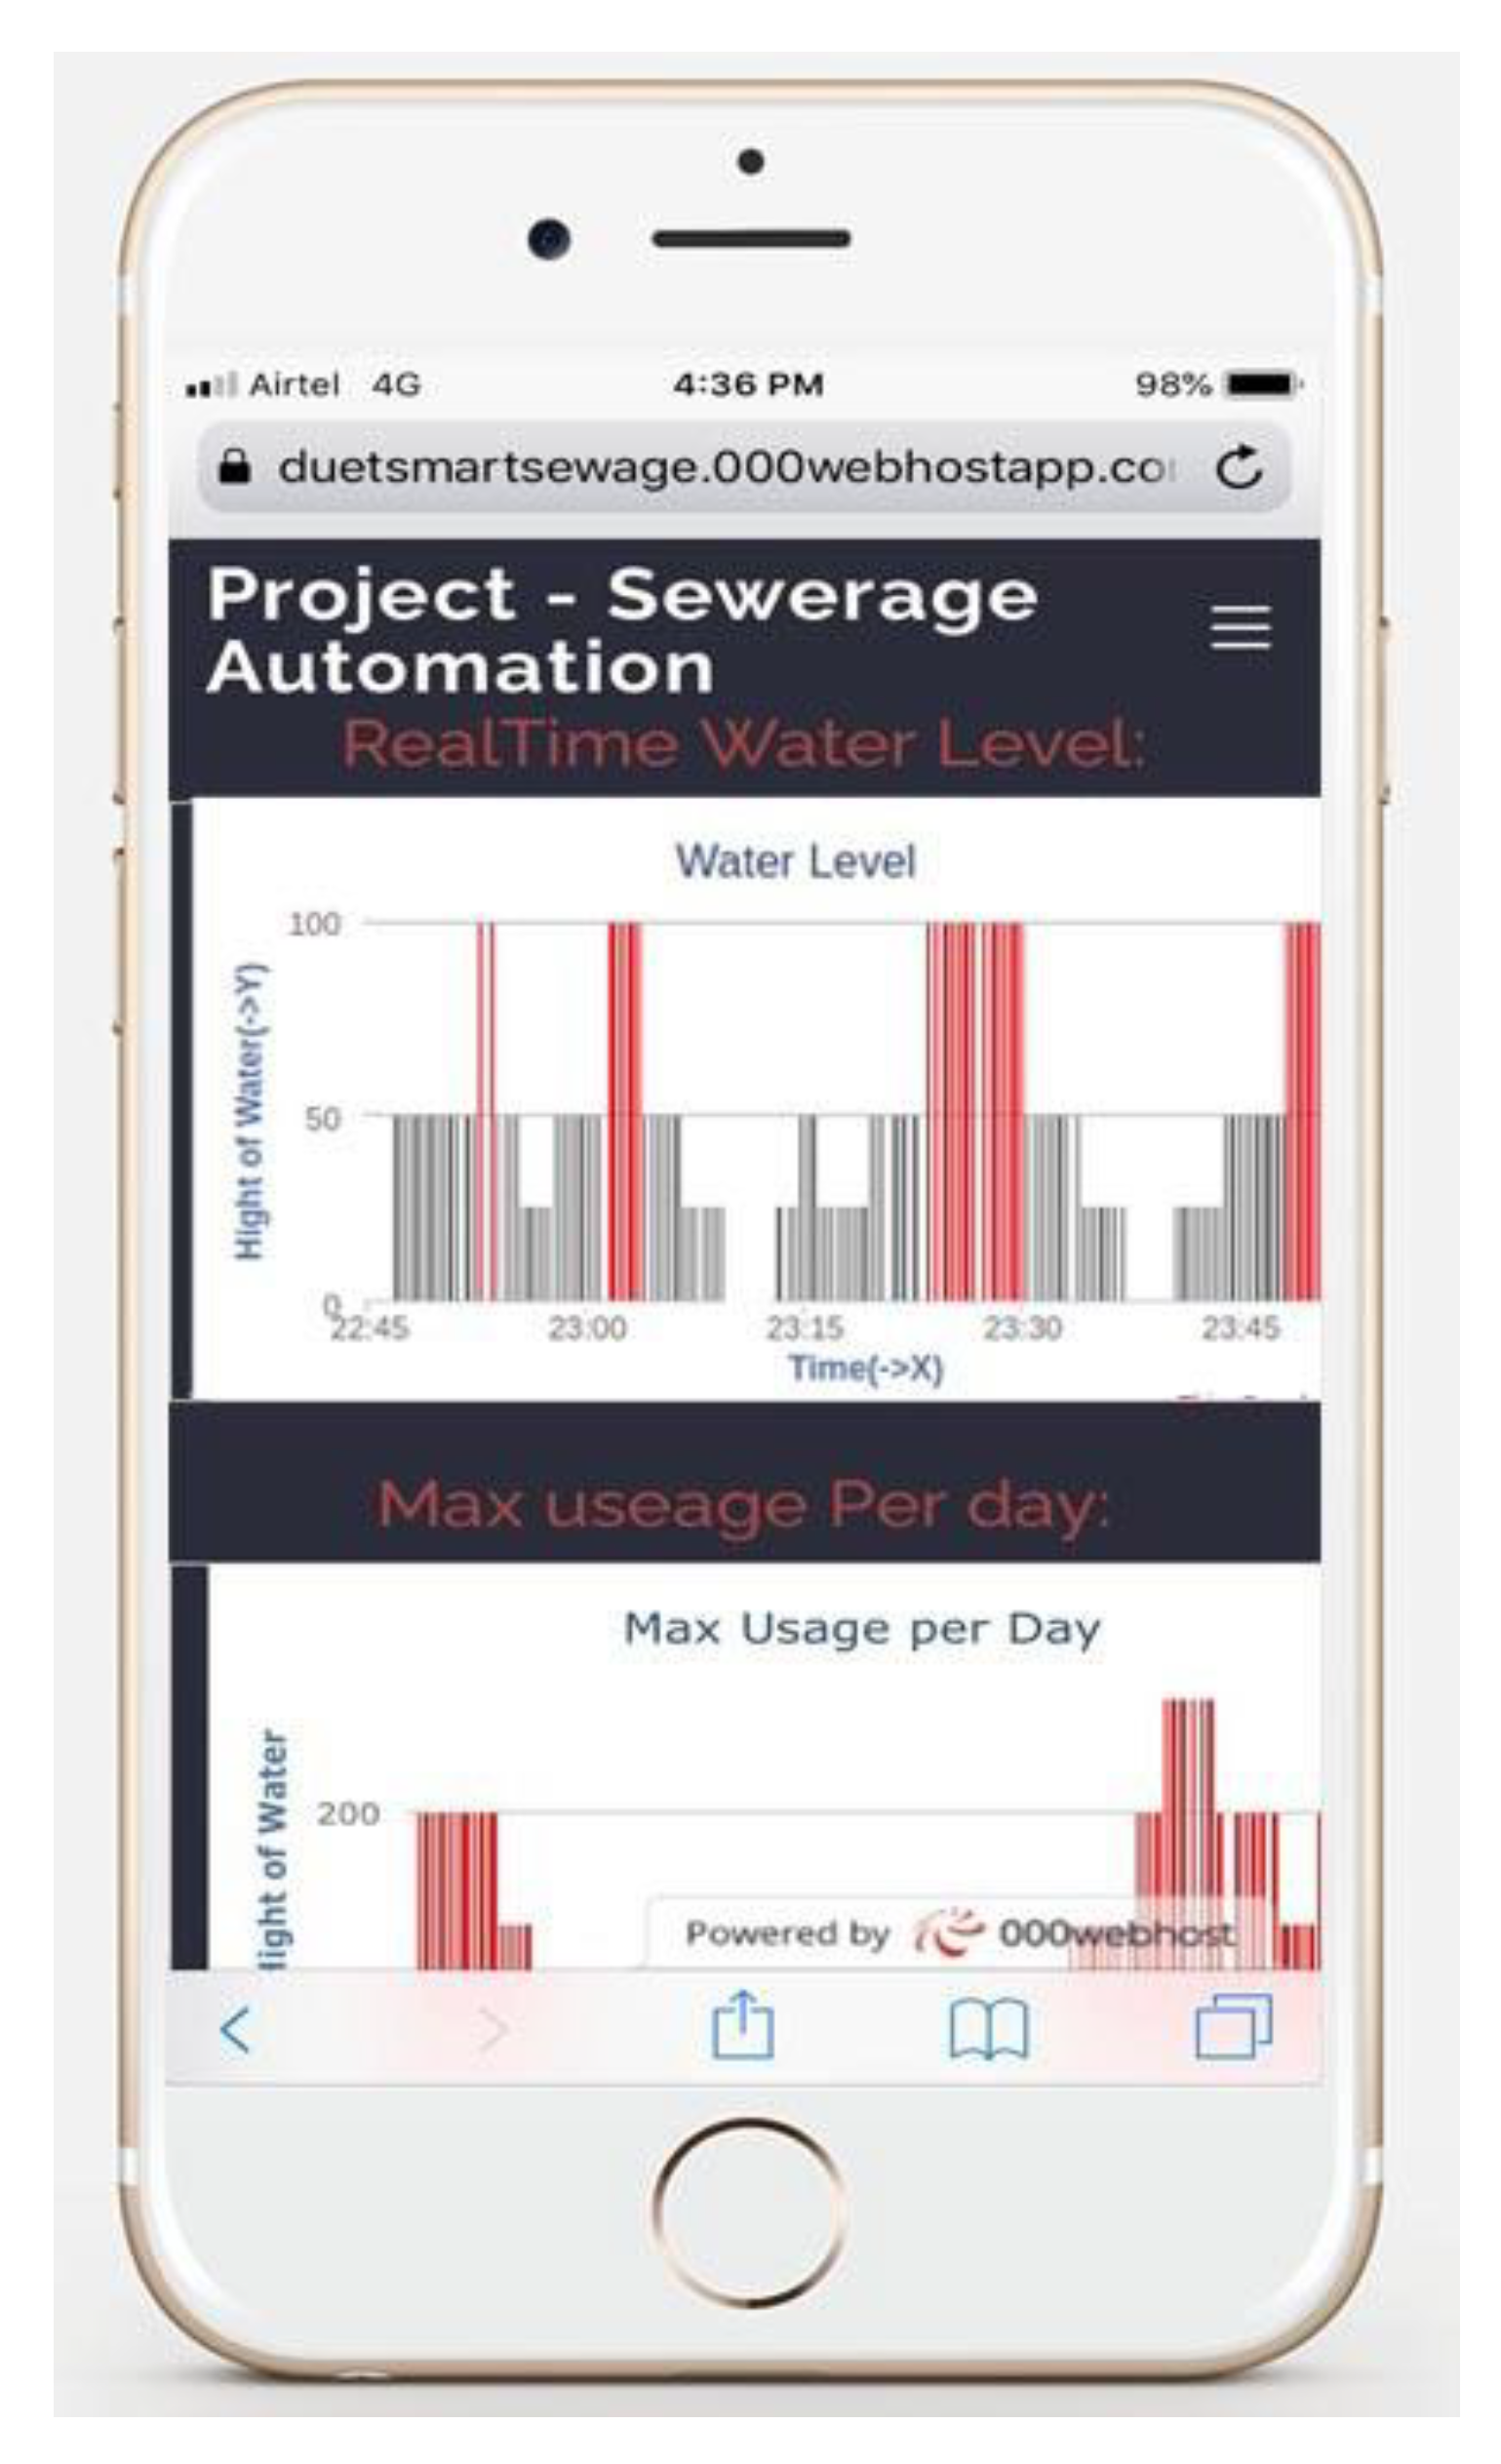
| Date/Time | Water Level | Waste Collection (%) | Remark |
|---|---|---|---|
| 2021-04-10 16:45:21 UTC | 0 | 0 | No water |
| 2021-04-10 16:45:51 UTC | 25 | 0 | Minor water flow |
| 2022-04-10 16:46:22 UTC | 50 | 25 | Mid-level water |
| 2023-04-10 16:46:52 UTC | 50 | 50 | Mid-level water |
| 2024-04-10 16:47:23 UTC | 50 | 75 | Motor start, mid-level water |
| 2025-04-10 16:47:54 UTC | 50 | 75 | Mid-level water |
| 2026-04-10 16:48:24 UTC | 50 | 75 | Mid-level water |
| 2027-04-10 16:48:54 UTC | 100 | 100 | Water level increase, motor speed increase |
| 2028-04-10 16:49:24 UTC | 100 | 100 | Full level water |
| 2029-04-10 16:49:54 UTC | 50 | 100 | Water level decreased high to mid |
| 2030-04-10 16:50:24 UTC | 50 | 75 | Mid-level water |
| 2031-04-10 16:50:55 UTC | 50 | 50 | Mid-level water, motor speed decrease |
| 2032-04-10 16:51:25 UTC | 25 | 25 | low level water, motor stop |
| 2033-04-10 16:51:55 UTC | 25 | 0 | Minor water flow |
| Sl. | Equipment | Unit | Price (BDT) | Cost (BDT) |
|---|---|---|---|---|
| 1 | ESP32 | 1 | 400 | 400 |
| 2 | LoRa Ra-02 | 1 | 400 | 400 |
| 3 | Motor Driver | 1 | 300 | 300 |
| 4 | 12V DC Motor | 2 | 250 | 500 |
| 5 | Water Sensor | 3 | 100 | 300 |
| 6 | Others | 500 | 500 | |
| Total = | 2400 | |||
| Cost for 1 Unit (BDT) | Cost for 30 Units (BDT) | ||
|---|---|---|---|
| Device | Cost shown in Table 2 | 2400 | 2400 * 30 = 72,000 |
| Connectivity | Internet access | 500 (per month) | 500 * 2 = 1000 |
| Cloud | ThingSpeak | 4750 (per month, up to 250 channel) | 4750 |
| Application | In-house development | - | |
| Service | Standard web hosting | 500 (per month) | 500 |
| Others | Expected hardware maintenance and energy consumption | 300(per month) | 9000 |
| Total | =8450 | =87,250 | |
Publisher’s Note: MDPI stays neutral with regard to jurisdictional claims in published maps and institutional affiliations. |
© 2021 by the authors. Licensee MDPI, Basel, Switzerland. This article is an open access article distributed under the terms and conditions of the Creative Commons Attribution (CC BY) license (https://creativecommons.org/licenses/by/4.0/).
Share and Cite
Rony, J.H.; Karim, N.; Rouf, M.A.; Islam, M.M.; Uddin, J.; Begum, M. A Cost-Effective IoT Model for a Smart Sewerage Management System Using Sensors. J 2021, 4, 356-366. https://doi.org/10.3390/j4030027
Rony JH, Karim N, Rouf MA, Islam MM, Uddin J, Begum M. A Cost-Effective IoT Model for a Smart Sewerage Management System Using Sensors. J. 2021; 4(3):356-366. https://doi.org/10.3390/j4030027
Chicago/Turabian StyleRony, Jahid Hasan, Nazmul Karim, MD. Abdur Rouf, Md. Monirul Islam, Jia Uddin, and Momotaz Begum. 2021. "A Cost-Effective IoT Model for a Smart Sewerage Management System Using Sensors" J 4, no. 3: 356-366. https://doi.org/10.3390/j4030027
APA StyleRony, J. H., Karim, N., Rouf, M. A., Islam, M. M., Uddin, J., & Begum, M. (2021). A Cost-Effective IoT Model for a Smart Sewerage Management System Using Sensors. J, 4(3), 356-366. https://doi.org/10.3390/j4030027