1. Introduction
In 2018, the anniversaries of two major scientific discoveries were celebrated. One in biology for the forty years of Hox Gene Collinearity (HGC) that was formulated by E.B. Lewis in 1978 [
1]. The other was the centenary of the far-reaching theory in physics and mathematics, as introduced by Emmy Noether [
2,
3,
4]. In the present study, it is argued that these two groundbreaking discoveries may be linked.
In 1918, Emmy Noether proposed a rigorous and elegant correlation between two fundamental concepts in physics and mathematics: symmetry and conservation laws [
2]. In simple terms, Noether proved that, under some well-founded conditions in classical mechanics, a physical system obeying a symmetry law is necessarily followed by a conserved physical quantity [
3,
4]. For instance, the physical laws that are symmetrical under translations in space (freedom to choose the origin of the coordinate system) lead to the conservation of momentum. Similarly, energy conservation during physical processes is a consequence of the symmetry of the physical laws under time translations [
4,
5]. (See the
Appendix A). Symmetry is a very broad concept with many facets covering aesthetic, philosophical, physical, and mathematical aspects. Hermann Weyl gave a broad definition as follows: A body, a spatial configuration, is symmetric with respect to a given plane E if it is carried into itself by reflection (mirror image) in E [
6]. Similarly, the operation of rotations on several physical bodies may define rotational symmetry. For example, if a rotation of a body around a given axis, say by thirty degrees or (30°), carries every point of the body to another point that belongs to the body. Thus, according to Pythagoras, the circle and the sphere are completely rotationally symmetric (invariant) in two- and three-dimensional spaces, respectively [
6].
Many operations (not only geometric) can be applied to physical bodies or entities, which may lead to an invariance (symmetry) related to this particular operation. Noether’s theory (NT) proved very helpful in the solution of physical problems even in the most modern fields of elementary particles and quarks. Given a symmetry, the search is directed to discover the corresponding conserved quantity (particle) and vice versa. For instance, testing the validity of some supersymmetry theories applied to elementary particles, a corresponding conserved quantity (particle) is expected [
4,
7].The lasting search for this particle led to the discovery of the Higgs boson in the CERN Laboratory in 2012 [
7].
2. Hox Gene Collinearity on a Straight Line
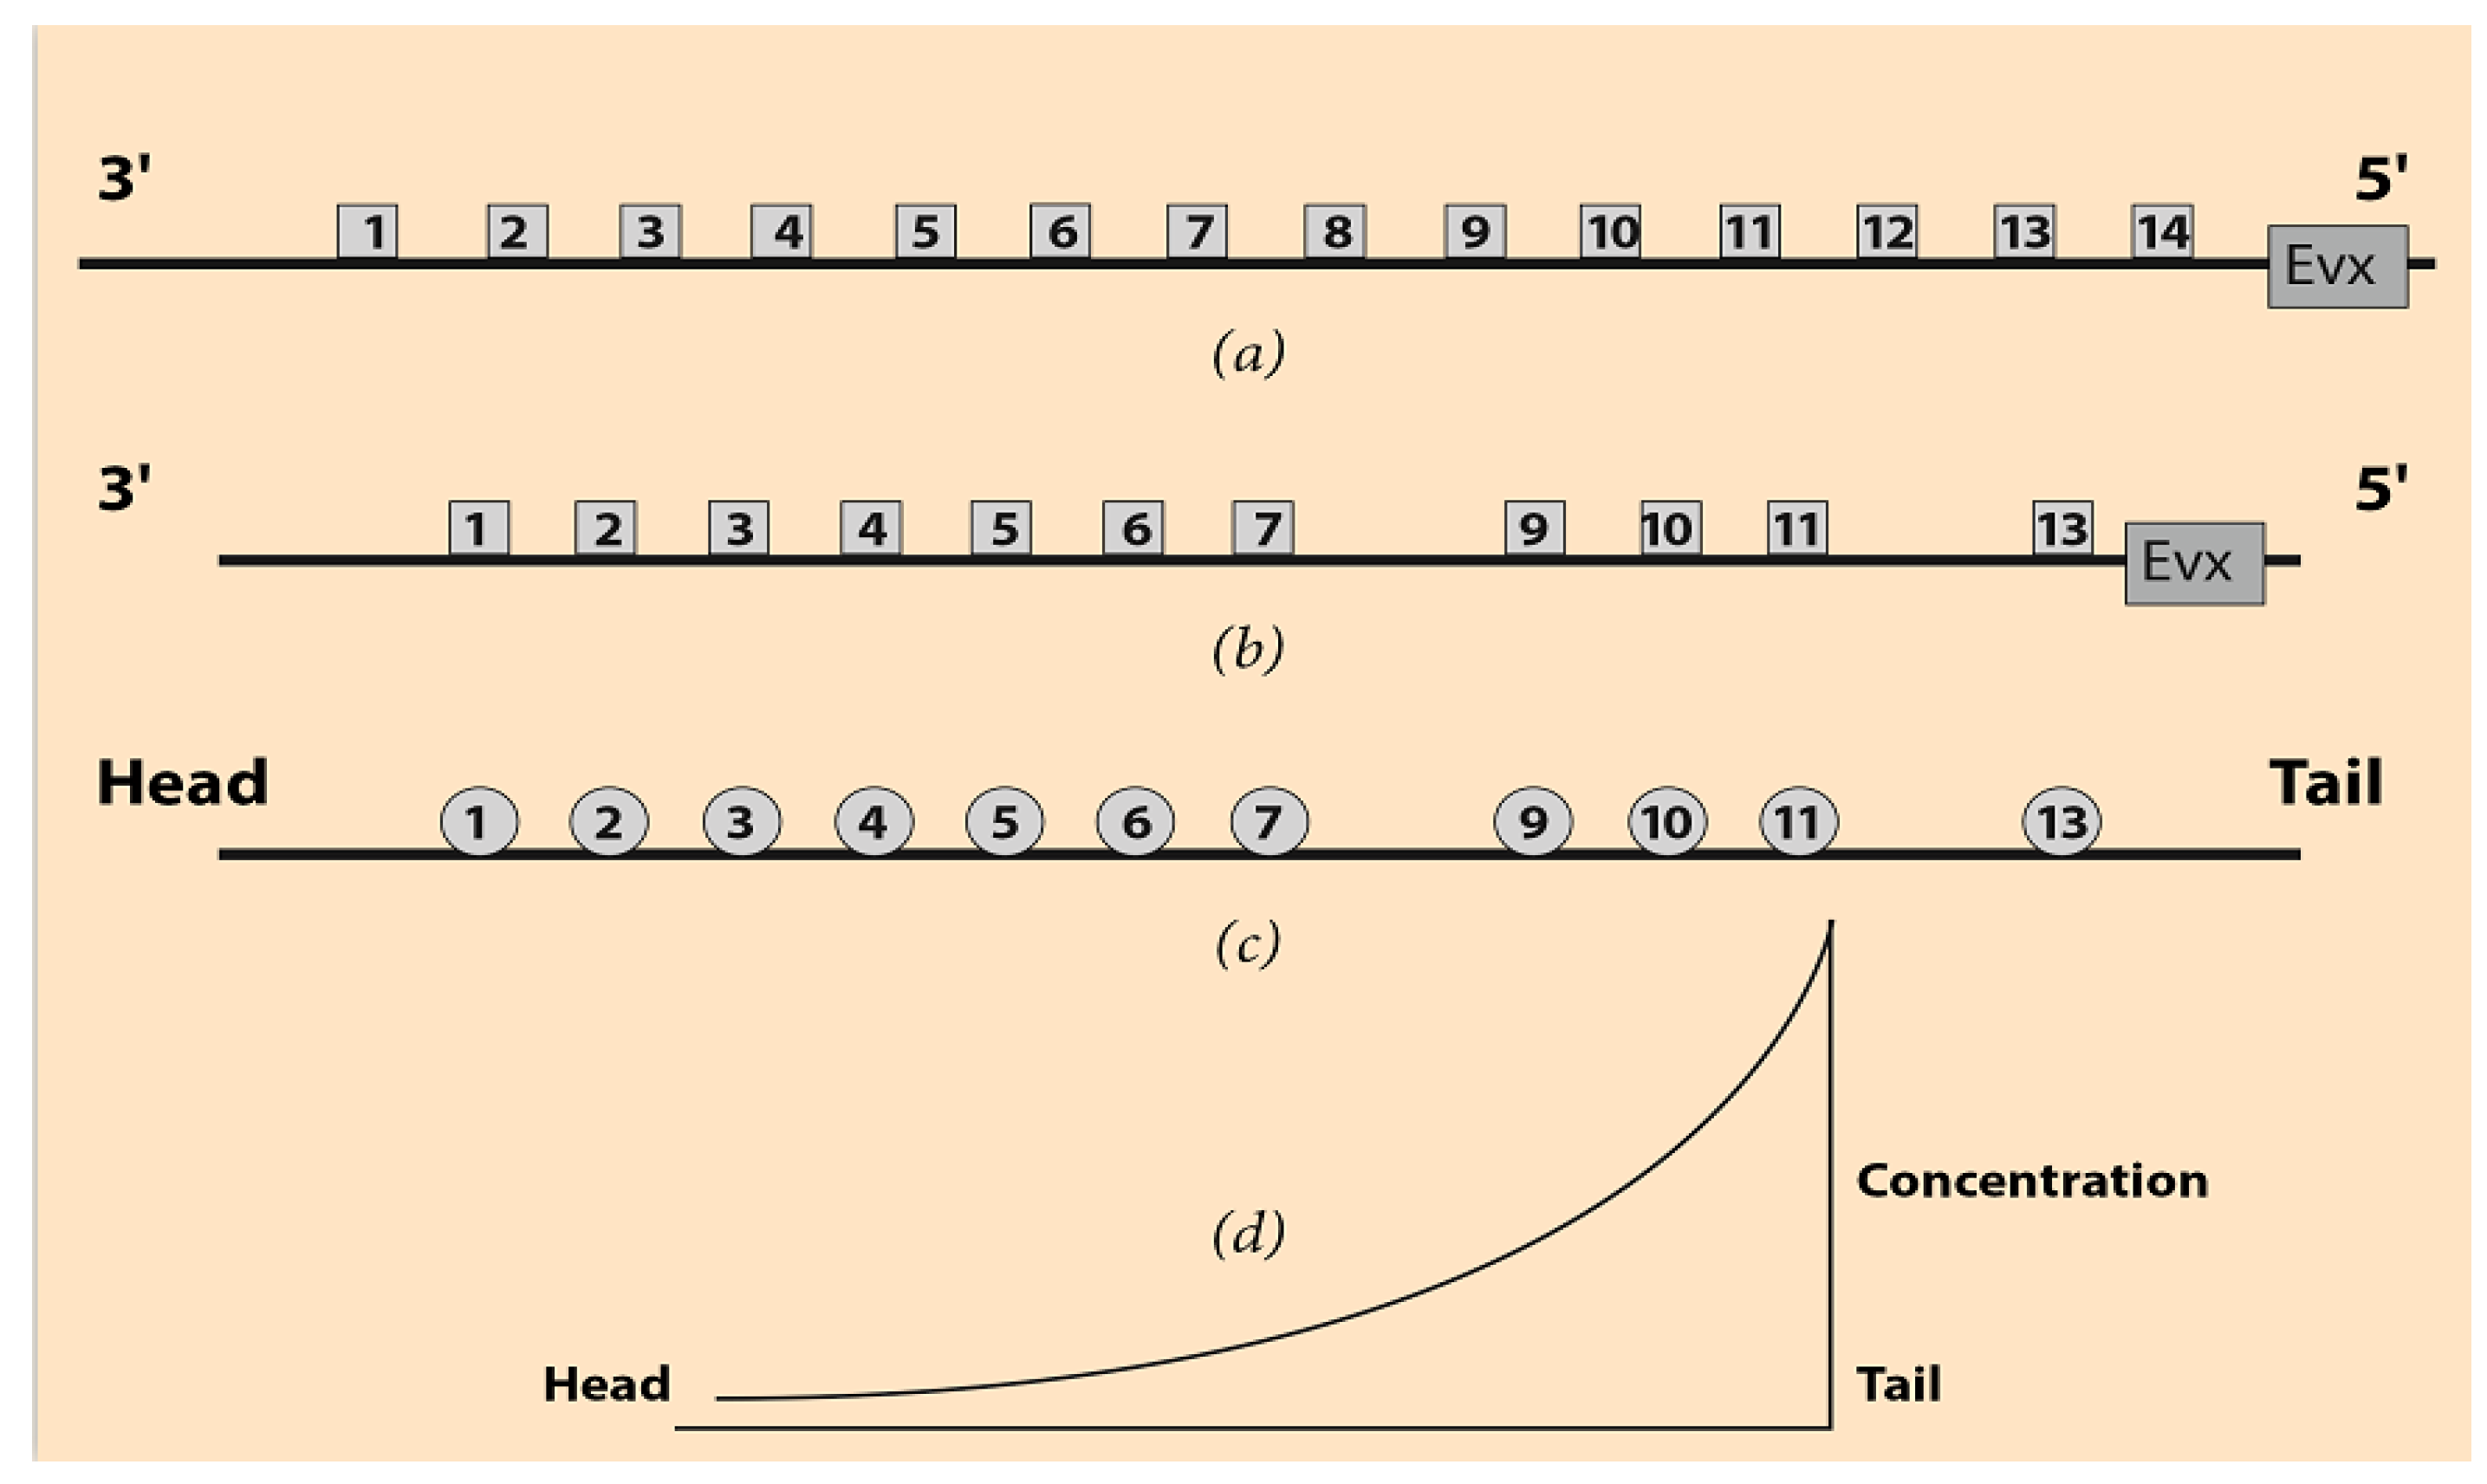
Hox genes are a group of genes playing a fundamental role in the development of most animals, including vertebrates (hence, also the humans). In many cases, some of these genes are grouped in clusters and denoted Hox1, Hox2, Hox3, etc. Numbering starts at the 3’ end of the telomeric side of the cluster, and it is directed toward the 5’ end of the centromeric side of the DNA sequence. In
Figure 1a, a (theoretical)common ancestor Hox cluster is shown together with a prototypic animal clade, the mouse Hox Acluster (
Figure 1b) [
8]. In
Figure 1a,b the distances between the Hox genes are not faithfully represented.
The Even Skipped Gene (Evx) lies close to the centromeric side of the mouse HoxA cluster. It is believed that the tandem duplication of an ancestral ur-Hox gene, followed by several evolutionary modifications, may be the origin of these organized Hox gene arrays [
9]. Many other hypotheses have been proposed based on new data on gene duplication and gene ordering [
10]. The speculative common ancestor Hox cluster is complete, and the gene ordering is normal from the first Hox1 to the last Hox gene (
Figure 1a) [
8,
9,
10]. In vertebrates, there are four paralogue Hox clusters (HoxA, HoxB, HoxC, and HoxD). These paralogue Hox clusters are complementary to each other, and their combinatorial cooperation guides their evolutionary modifications. In each paralogue Hox cluster, some Hox genes are missing as, for example, in the mouse HoxA in
Figure 1b. The origin and crucial role of such ‘holes’ in the vertebrate Hox clusters are not well understood (see
Section 6).
In the early stages of embryogenesis, one can ontogenetically divide the embryo into body Domains D1, D2, D3, etc., following the anterior–posterior axis from head to tail (
Figure 1c). E.B. Lewis noticed that some Drosophila Hox genes are activated in a collinear manner [
1]. (See the
Appendix A). Schematically, Hox1 is activated in D1, Hox2 in D2, Hox3 in D3, etc. For instance, in the cells of D1, only the Hox1 gene is transcribed. In the cells of D2, the Hox2 gene is transcribed, etc. The clear cut expression regions of the Hox genes in the ontogenetic domains D1, D2, etc., of the vertebrates are only a simplification. In reality, these expressions are partially overlapping and nested gradually toward the tail end of the embryo or the limb bud tip, e.g., [
11,
12]. This nested pattern, denoted as Hox Gene Collinearity (HGC), can be easily incorporated in the present simplifying representation. In addition, the spatial and temporal features of HGC are still intensively studied in several animal species [
13].The above particular local transcription of the Hox genes is a very surprising event that proved later to be a universal property widespread to most animal species where the Hox genes are grouped in clusters [
8].
The linear size of the Hox clusters extends up to some hundreds of nanometers (nm), whereas the linear size of an early embryo (head to tail) is about 1 millimeter (mm) (
Figure 1). The sizes of these two entities (gene cluster and early embryo) differ by more than four orders of magnitude. In HGC, the unexpected one-to-one correspondence of the two sequences constitutes an enigma of developmental biology. Several explanatory models were proposed which can correctly reproduce many of the performed genetic engineering experimental results, e.g., [
11,
14]. All these models are based solely on well-established biomolecular processes responsible for gene activation or inhibition. Nevertheless, the collinearity phenomenon is still an enigma (see
Section 6). Notice that the multiscale nature of HGC hints at the action of long-range forces which may cooperate with the biomolecular mechanisms. Physical processes, such as diffusion or electric attraction, can trigger such forces [
15].
3. The Macro- and Micro-Influences in the Biophysical Model
As early as 2001, a biophysical model (BM) was proposed, which combines long-range gradients based mainly on diffusion, causing pulling forces at the level of theHox clusters [
15,
16,
17,
18]. For many years this model was poorly endorsed because supporting experimental evidence was lacking. However, in recent years novel experimental techniques were developed that enabled the observation of physical–geometric deformations of the Hox clusters during Hox gene activation in mice [
19,
20,
21]. These novel techniques, mainly based on super-resolution imaging (STORM), made it possible to measure gradual elongations of the Hox clusters. These elongations could be explained by the action of physical forces in the BM [
16].
A one-dimensional mathematical model was introduced to explain how a morphogen monotonic gradient may be formed. The model assumes that a morphogen is produced at one end of a morphogenetic field, and it spreads mainly via passive diffusion. It has been verified that several molecules play the role of morphogens, e.g., the fibroblast growth factor (FGF), or the Sonic hedgehog [
22,
23]. According to this diffusion mechanism, the morphogen is produced at the tail of the embryo, where its concentration
C is kept constant (
C0).
C diffuses along the anterior–posterior axis (
Figure 1d). At the same time, the morphogen is decomposed by first-order chemical kinetics. The diffusion-plus-degradation equation in space x and time t of
C(x,t) is [
16,
17]
D is the diffusion constant, and k is the chemical decomposition constant.
Following the method of Carslow and Jaeger, the asymptotic steady-state solution
C(x) of Equation (1) is
where
A =
,
x0 is the tail position and
x varies between 0 and
x0 ( 0 ≤
x ≤
x0) [
24].
In an experiment testing the time dependence of the morphogen (FGF) spreading in the chick limb bud, it is confirmed that diffusion is the responsible main mechanism [
25].
In the following, the morphogen signals are transduced inside the cells and produce specific molecules that are allocated in particular positions inside the cell nucleus. The existence and action of such molecules (e.g., molecule proteins called SMAD) are thoroughly studied [
26,
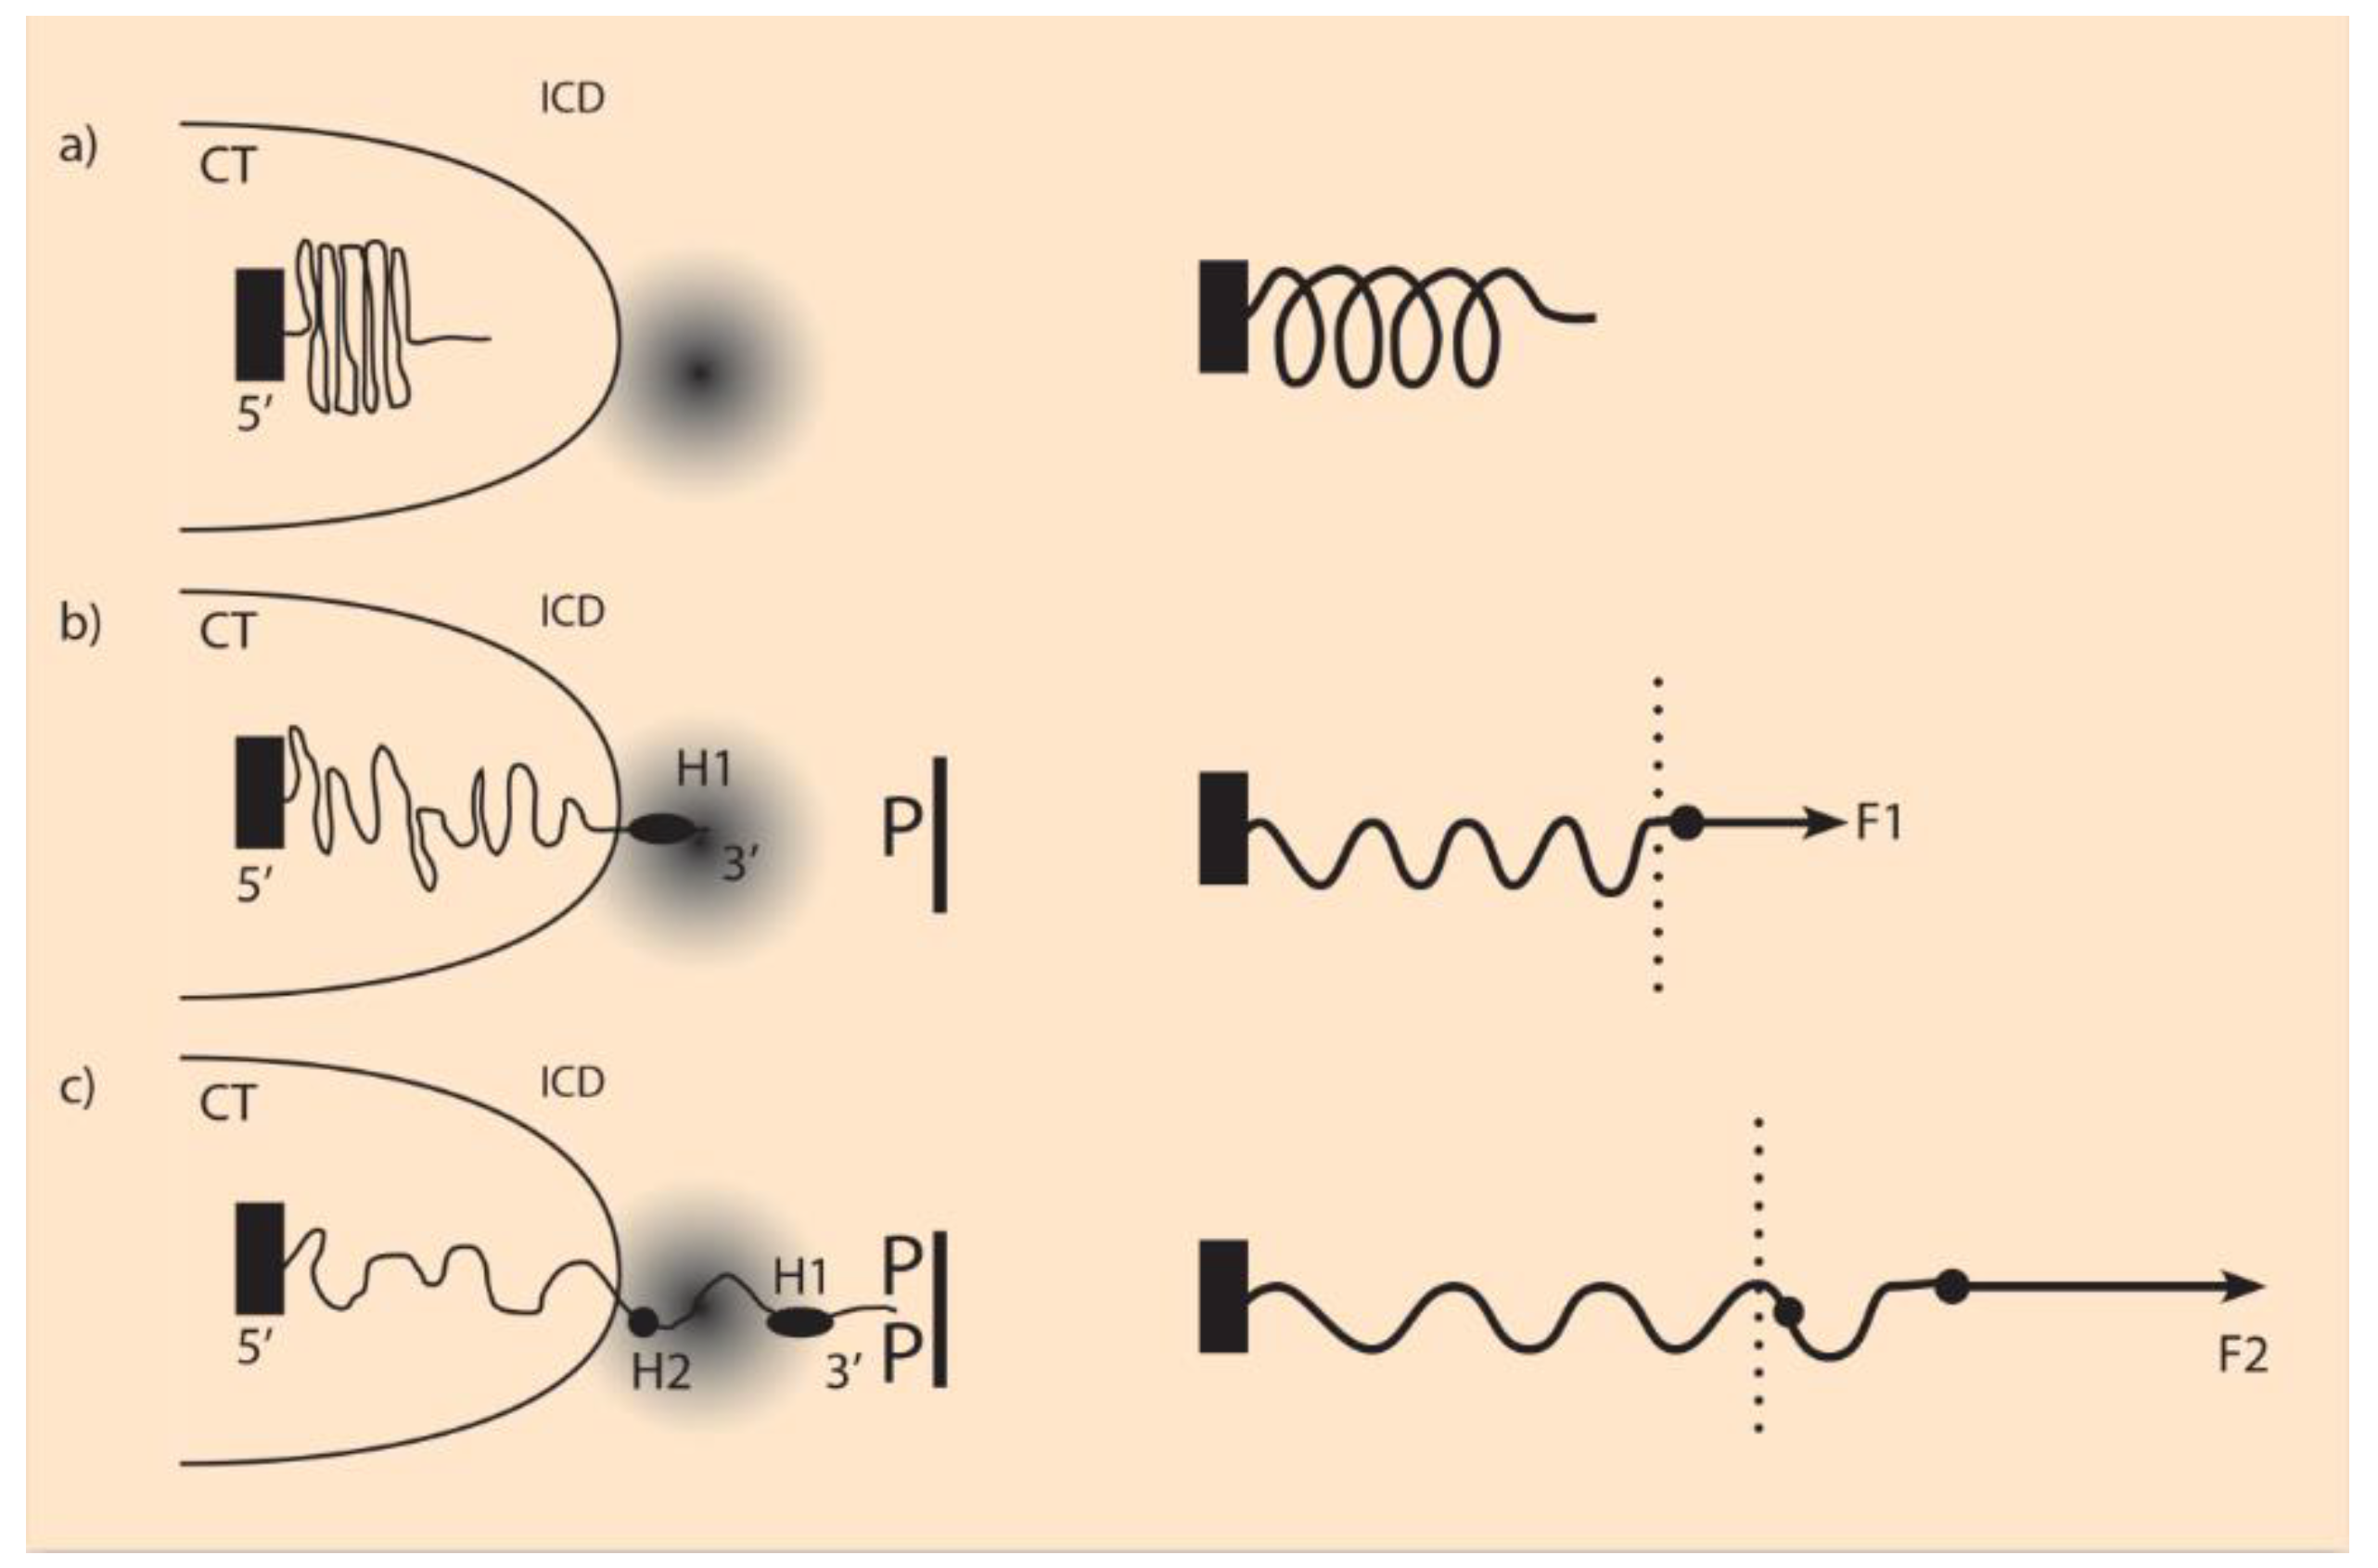
27]. In analogy, it is here assumed that similar molecules P are produced and anchored facing the Hox cluster (
Figure 2). It is further assumed that the P molecules are positively charged, while the Hox gene clusters are negatively charged (N). An attractive force acting on the Hox cluster is created resembling a truncated Coulomb force [
16,
17]. A simple heuristic form for the attractive force
F can be introduced:
The factor
P in Equation (3) varies according to the cell position along the morphogen gradient in the anterior–posterior axis.
P is high at the tail and low at the head of the embryo. The factor
N represents the Hox cluster, which is negatively charged, as mentioned above. The physical force
F pulls the Hox genes gradually to a region where gene activation is possible (
Figure 2). These regions (transcription factories) are studied in depth by Cook and collaborators [
28]. In this model, the force F of Equation (3) depends on both macro (P) and micro (N) influences, and the Hox cluster behaves like an expanding elastic spring [
17,
18].
The intermediate dimensions are not included in formulating Equation (3), although they are important for the transition from single-cell expression to tissue development. For instance, Acemel et al. analyzed the bipartite chromatin structure of jawed vertebrate HoxD clusters. This architecture allows Hox genes to pattern disparate parts of the body, including limbs [
29]. In the evolutionary process, each Hox gene of the vertebrate Hox cluster is endowed with specific features and a functional role. In this course, some of these genes are lost (deleted) (see
Figure 1b). Even in the case of missing genes, the ordering remains ever-increasing like a ‘ratchet’. For instance, the Hox ordering (1, 2, . , 4 ,5,…) may be observed, but the ordering (1, 2, . , 5 , 4,…) is not allowed since it represents a gene reversal (See the
Appendix A). This Hox gene ordering and the ontogenetic units of the embryo are located on a finite straight line with discrete ends (
Figure 1b,c).
A phenomenon or object is self-similar if the image of the part is similar to the image of the whole. For example, the image of a coastline is the same, independent of the scale of the image. Similarly, the branching picture of a neuron is the same, independent of the magnification of the drawing. These phenomena or objects were coined ‘fractals’ by Mandelbrot, who was the first to study them consistently [
30]. In this analysis, self-similarity is a continuous symmetry applying to all dimensional sizes (scale invariance). The next step is to incorporate the fractals in NT: self-similarity is the symmetry, and the conserved quantity is the complete Hox gene ordering (
Figure 1a).
The genes of a Hox cluster and the embryonic body elements of the vertebrates are somehow ‘self-similar’ objects embedded in the same space, namely the one-dimensional finite straight line with distinct ends. The Hox gene collinearity is a ‘primitive’ self-similarity on a straight line since it applies to only two discrete dimensional scales (genetic and embryonic). In contrast, the proper self-similarity is a continuous symmetry applying to all scale dimensions. Therefore NT applies to the vertebrate Hox clusters where the primitive symmetry is linked to a partially conserved Hox gene ordering as in an irreversibly increasing ratchet with holes (
Figure 1b). An inspection of the existing data on vertebrate Hox clusters confirms the structure of these orderings [
8,
31].
A fundamental question may be raised: Are the physical (and chemical) laws invariant when the scale changes? The answer is no [
5]. The reason is that the basic constituents of matter (electrons, protons, and other elementary particles) have concrete and fixed material properties (mass, electric charge, spin, etc.). This ‘atomic’ nature of matter is not arbitrary. Therefore, it imposes its specific scale, so it affects the properties of macroscopic matter, such as the strength, elasticity, etc., of different materials.
The above property is equally true in biological phenomena. For instance, in the Reaction–Diffusion theory of Turing, patterns in space and time can be spontaneously created [
32].These patterns are scale-dependent since both Diffusion and Chemical kinetics have their inherent ‘atomic’ scales. Therefore the original genius theory of Turing cannot describe pattern regulation in Morphogenesis—the ability of embryos to adjust their pattern to variable sizes. To achieve pattern regulation, a supplementary mechanism to the Reaction–Diffusion theory must be introduced, see, e.g., [
33].
4. Hox Gene Ordering in Rotationally Symmetric Animals
The above primitive collinearity applies to ‘directly’ developing organisms, such as arthropods or vertebrates. These organisms, in their very early embryogenesis, look like a miniature version of an adult animal. The major body elements are formed at once during embryogenesis along the A-P axis [
34]. However, besides these directly developing animals, there is a large variety of invertebrates that, at the very early stages of embryogenesis, are ‘indirectly’ developing a larva, where the adult body shape is formed. This body plan differs from the initial A-P organization [
34,
35]. The powerful mechanism of evolution drives the creation of a new species by imposing a novel symmetry at the larva stage. For instance, twenty-nine hours after fertilization in the larva stage of Echinoderms, a rotational symmetry is superimposed on the linear symmetry (A-P) of the initial embryo [
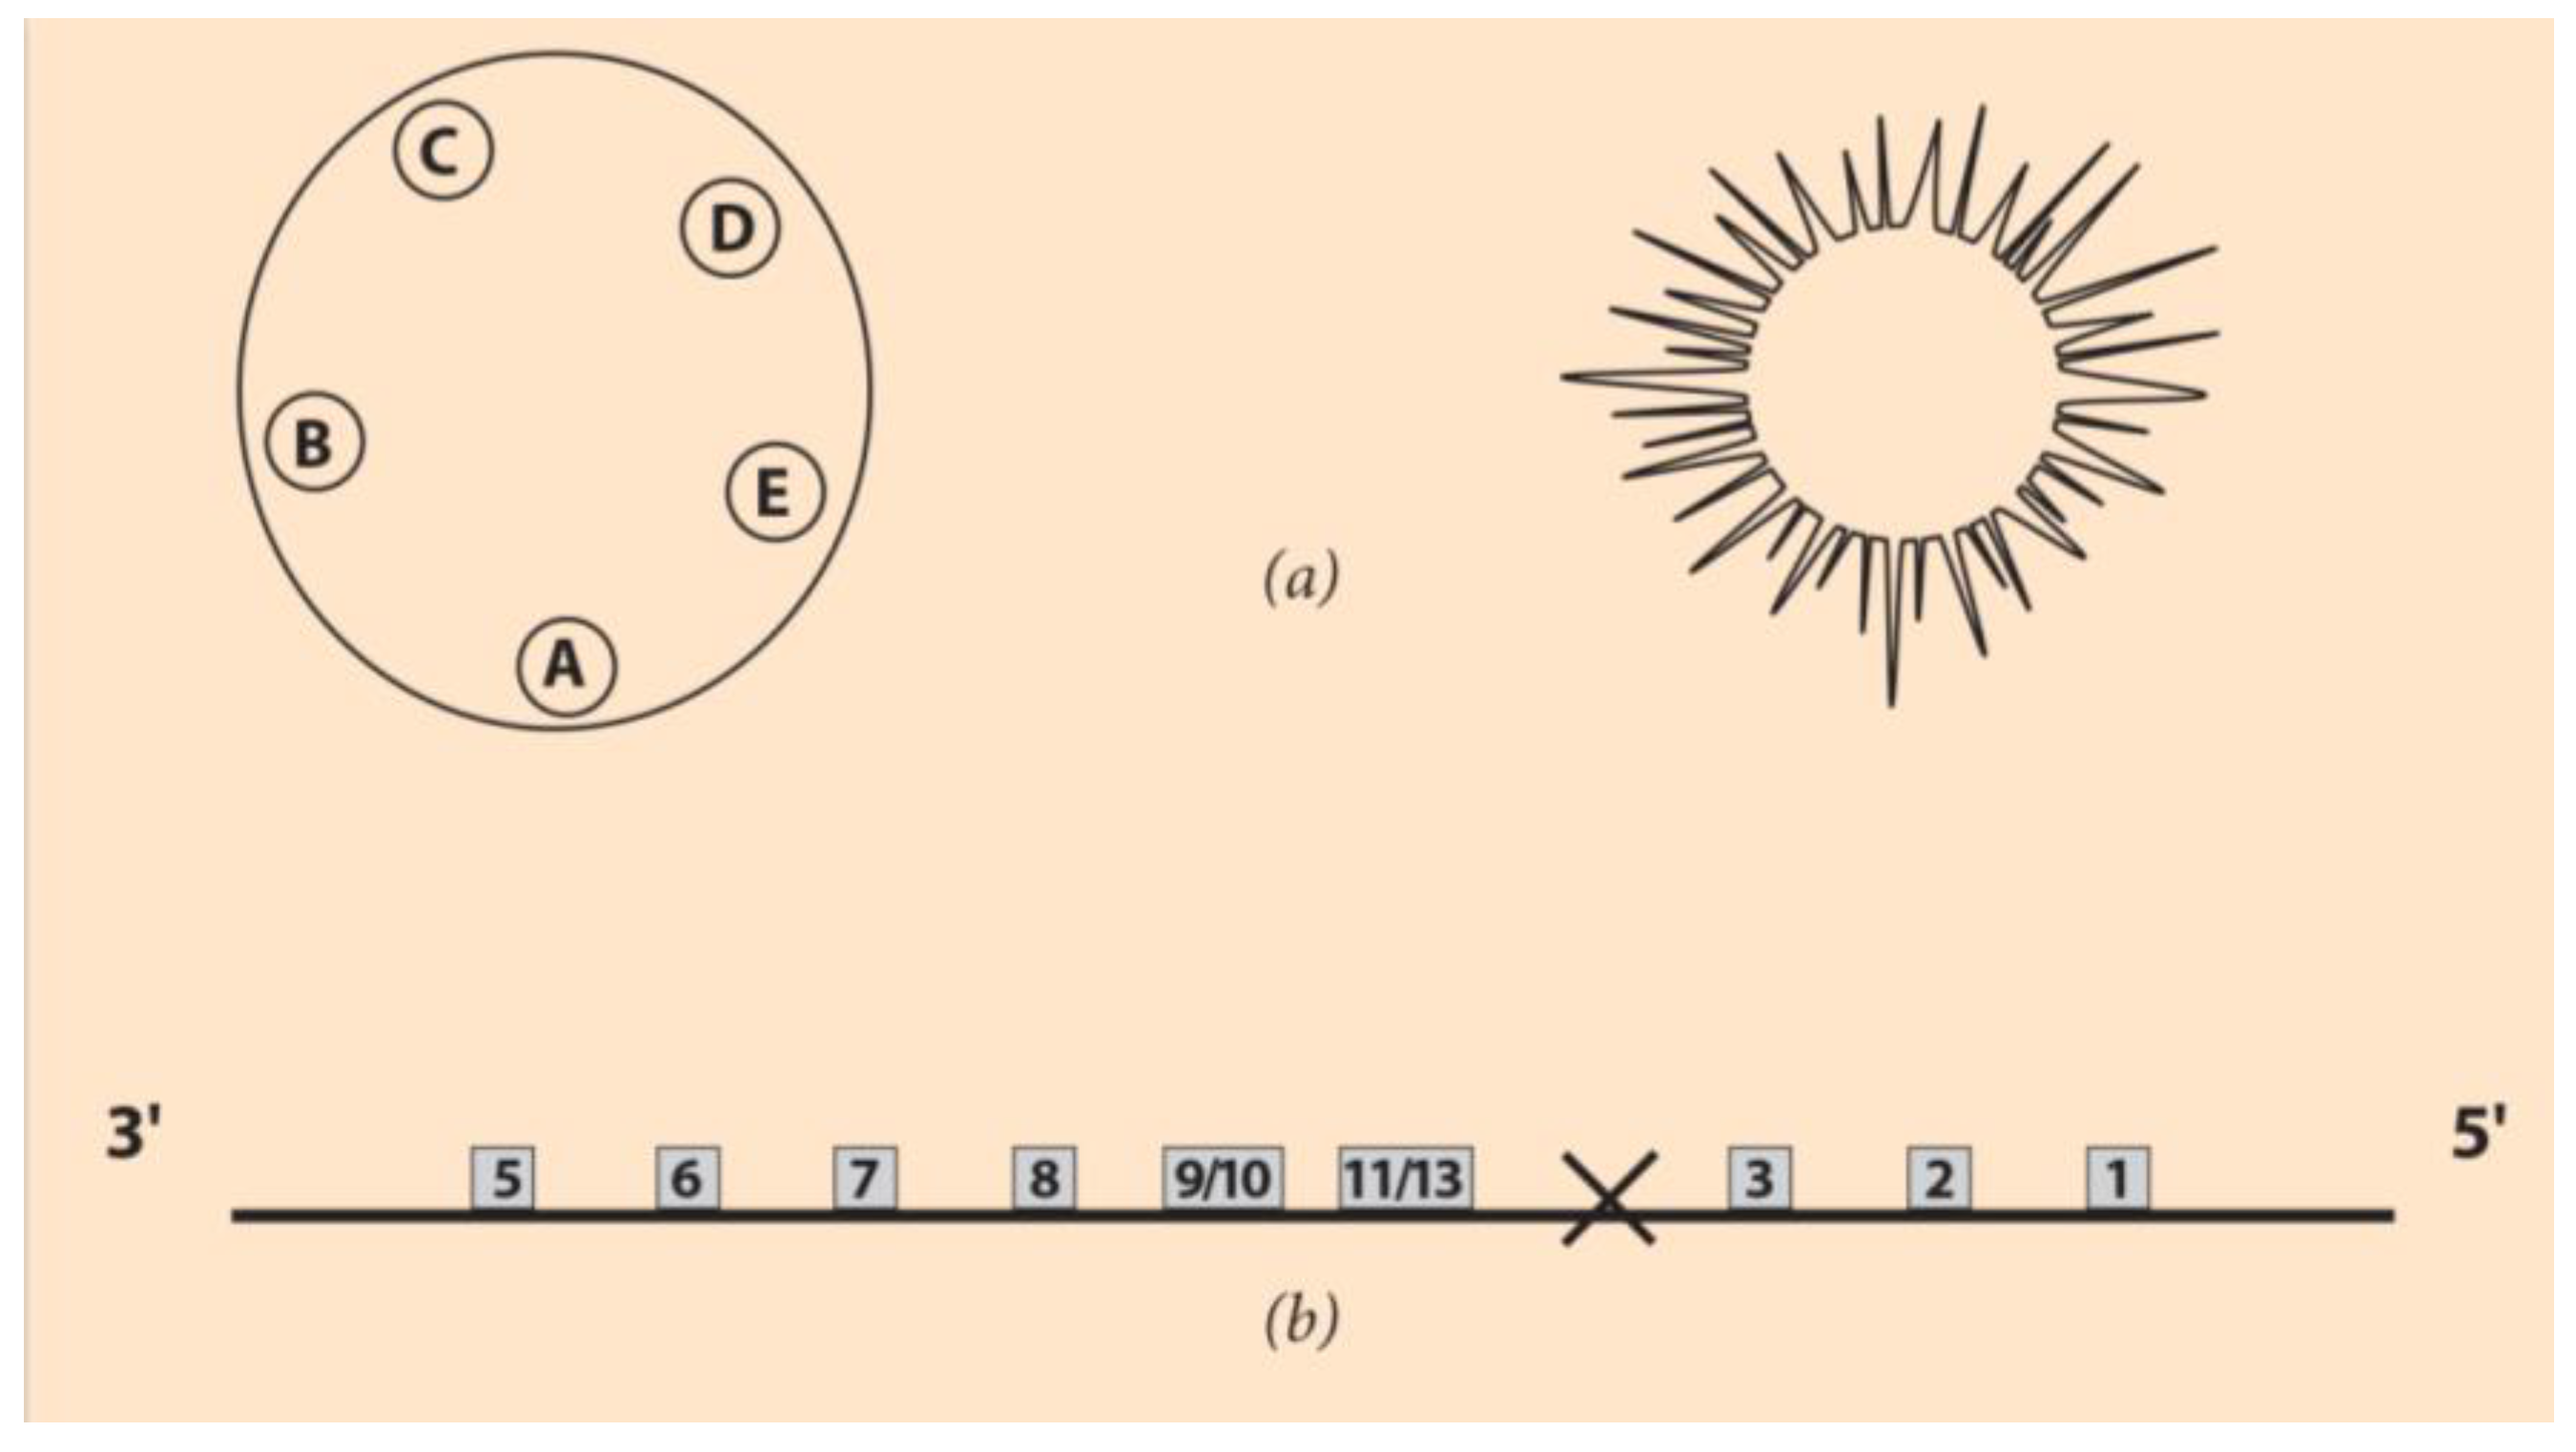
35]. In
Figure 3a (left), the larva of Holopneustes purpurescens is drawn with the morphology of five podia A-E located on a closed contour on top of the initial A-P axis [
36].
The finite line with distinct ends is substituted by this rotationally symmetric contour [
36]. In
Figure 3a (left and right), a larva and an adult echinoderm are, respectively, depicted.
After the powerful new sequencing techniques developed in the last decade or so, many unexpected data have been discovered concerning the Hox gene ordering of the rotationally symmetric animals. For instance, the Hox gene cluster of the sea urchin was surprising (
Figure 3b). The normally anterior class of genes (Hox1, Hox2, Hox3) are ‘translocated and inverted’ to the 5’ end of the cluster, as shown in
Figure 3b [
37,
38]. This reorganization is coined TAI, and many hypotheses have been put forward to explain its origin [
31,
38].
Vertebrates and the major deuterostome clades (Echiniderms included) have a supposedly common ancestor [
8,
31]. The vertebrates retain the ancestor’s Hox gene ordering partially while the Echinoderms deviate radically from this common ancestor’s Hox gene ordering [
31,
38]. Below, as a typical example, the case of the vertebrates will be compared to the Echinoderms Hox orderings.
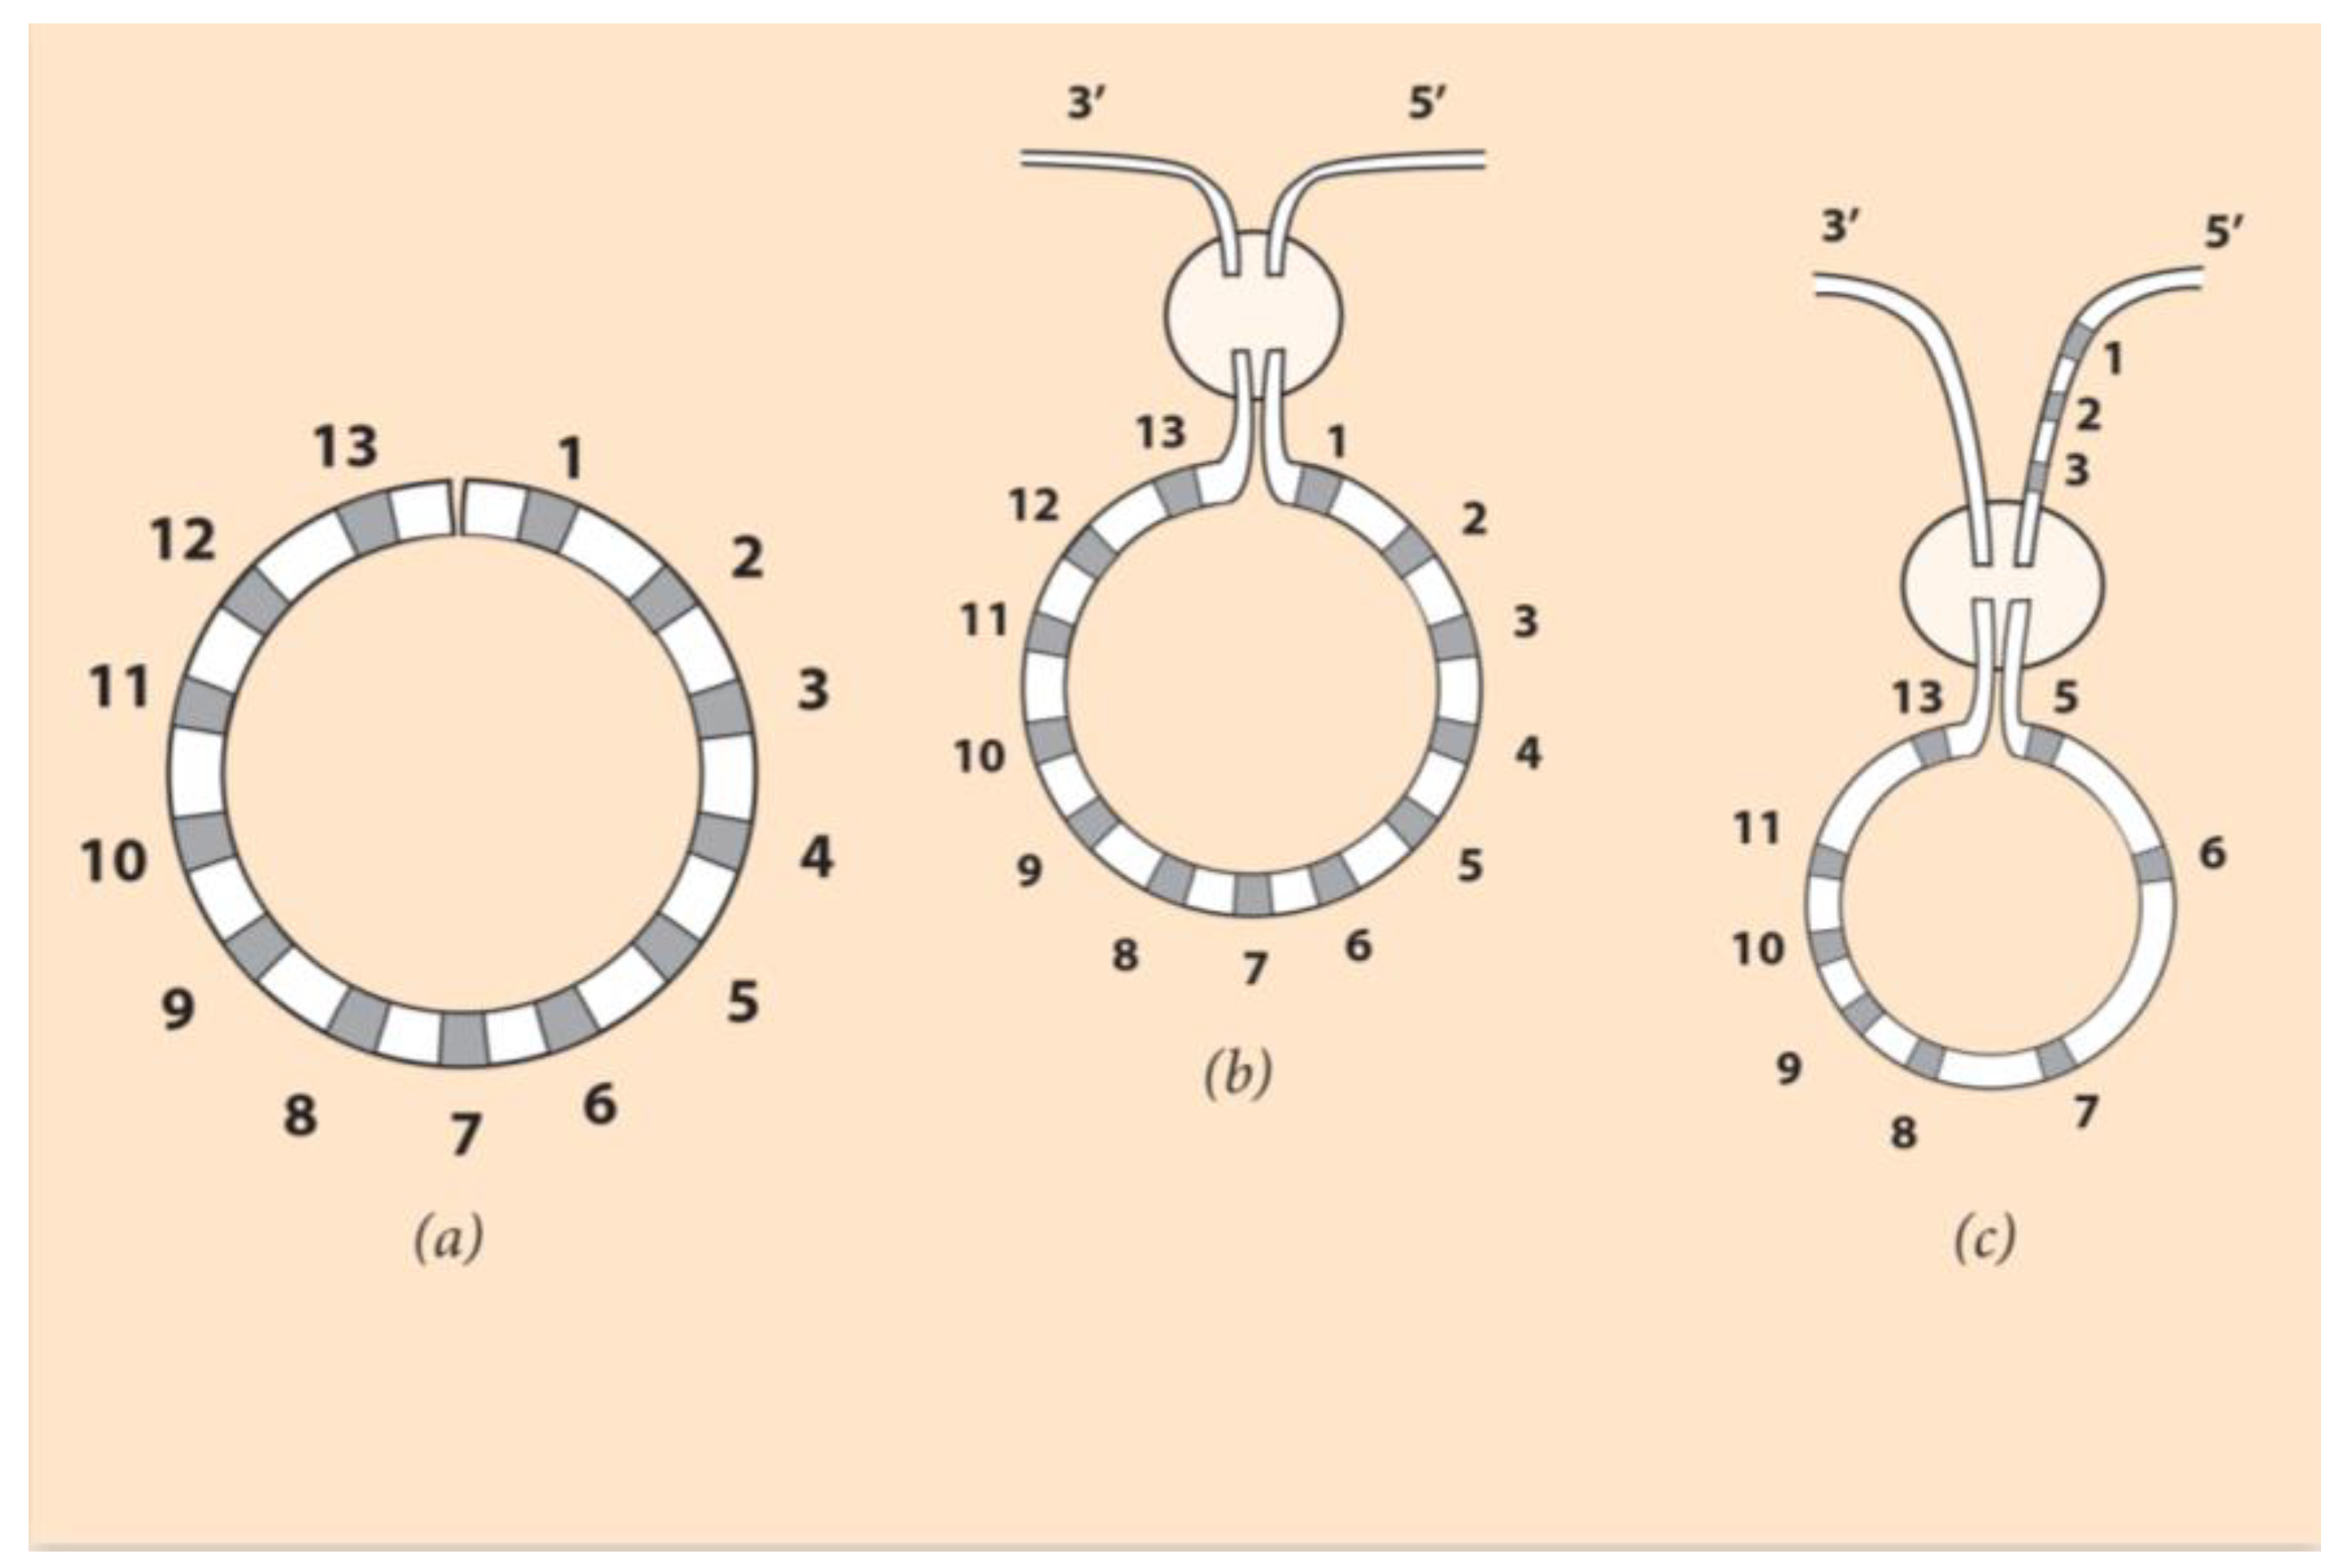
According to the self-similarity hypothesis proposed here, without breaking the common ancestor’s ordering of Hox genes, a bending of the linear arrangement brings Hox1 close to Hox13 (
Figure 4, left).
In this figure, the 13 Hox genes are depicted in a circular ordering like a clock face where the clock ‘hours’ and the sequencing is self-similar to the rotationally symmetric larva body elements [
37]. How this symmetry change is imposed remains to be clarified. After the establishment of the new symmetry, the circular contour has to be incorporated in the DNA sequence. The DNA fiber undergoes a double-strand break, shown in
Figure 4 (middle). Such events are spontaneous, and they constitute the innovative force of evolution. This break enables two switching combinations to the endings Hox1 and Hox13 genes of the Hox cluster. Note that the number of Hox genes remains constant as in the common ancestor case (see, however,
Section 6).
If Hox1 and Hox13 are attached to the 3’ and 5’ chromosome ends, respectively, no novel DNA sequence is created. This case could explain the Asteroid planci Hox cluster ordering. Although this Asteroid is rotationally symmetric, its Hox gene cluster ordering is comparable to the normal vertebrate ordering [
37].In contrast, a novel Hox gene sequence will be created if Hox1 and Hox13 are attached to the 5’ and 3’ ends of the flanking chromosome, respectively (
Figure 4, right). If a subsequent break occurs at the level of Hox4, the reshuffling indicated in
Figure 4 (right) leads to the Hox gene linear ordering of
Figure 3b. At the location of the break, Hox4 is deleted. This resulting gene sequence is the observed ordering of Hox genes in the sea urchin Hox cluster. According to NT, the linear Hox gene ordering of
Figure 3b is the partially conserved quantity linked to the primitive self-symmetry of rotationally symmetric animals. Every Hox gene of the cluster has been endowed with a specific role at the larva stage, where the circular structure was led down.
5. Equivalence of Biophysical Model and Primitive Noether Theory
In vertebrates, both spatial and temporal collinearities are confirmed. According to BM, spatial collinearity (SC) proceeds gradually in coordination and entanglement with temporal collinearity (TC) [
17,
18]. In particular, several experiments were proposed to test further the space–time entanglement inherent in BM. Below, a BM prediction is compared to the corresponding NT prediction.
(A) According to BM and its elastic spring approximation for a Hox cluster, the centromeric end of the cluster is fastened at its neighboring DNA area. If the fastening domain is cut off, the fastening ability is reduced, and a weak force applied at the telomeric end of the cluster could oblige the cluster to slide abnormally toward the 3’ direction [
39]. It is, therefore, predicted that the elimination of only the centromeric domain neighboring the cluster would cause an abnormally premature activation of the cluster [
39]. This experimental prediction is a variation of the Kondo and Duboule experiment, which had an unexpected outcome [
40].
(B) According to NT, a primitive symmetry is endowed to the Hox cluster. This symmetry conveys to the cluster an invariant property, which consists of the irreversible ordering of the Hox genes where some genes are missing. This gene ordering remains the same even after the excision of the centromeric domain. However, other physical quantities, such as timing, may change in relation to the excision. It is expected that a weaker or tighter fastening of the Hox cluster will cause its premature or retarded activation, respectively. This result is consistent with the above case A of BM. The compatibility of A and B hints at a possible generalized equivalence of BM and the primitive NT. Additional experimental evidence is necessary to confirm further this equivalence.
When the fastening of a Hox cluster is very loose, a minimal pulling force suffices to make the whole cluster to slide in the 3’ direction. In this spirit, one could explain the observed absence of temporal collinearity in Drosophila (see
Appendix A.2). If the Drosophila Hox cluster is really loosely fastened, from the start of its activation, the whole cluster is translocated inside the transcription factory domain, and no TC is observed (
Figure 2). Therefore, during Hox gene activation, only spatial collinearity is taking place. This means Hox genes are activated at the same time in all ontogenetic domains Ds. This daring assumption has to be confirmed. In contrast, vertebrates follow a quite different pathway of activation where both TC and SC are entangled.
6. Discussion and Conclusions
The evolutionary pathways differ in directly and indirectly developing animals. In the first case of direct development (e.g., vertebrates), paralogue Hox clusters with missing Hox genes cooperate to organize the different species. In indirect development, at some early embryonic stage, the larva develops so that the initial embryonic organization along the A-P axis switches to a circular form. The corresponding circular Hox cluster breaks at a certain gene location so that the cluster is incorporated in the flanking DNA sequence. It has been observed in another context that Hox gene loss is possible if ‘the gene’s role in development is lost or significantly modified during evolution [
41].
According to NT and in analogy to the irreversible Hox gene ordering along a finite line, another conserved ordering should be expected for the ontogenetic units along the embryonic A-P axis. The Antennapedia mutation in Drosophila is a case of ordering violation between Hox genes and the resulting ectopic growth of middle legs instead of antennae [
42] (see also
Appendix A.2).
In rotationally symmetric animals, no paralog Hox clusters are formed, and the number of genes is complete except the gene at the breaking point. Several spatial and temporal features of the Hox gene expressions in echinoderms have already been reported [
43]. A similar analysis for other rotationally symmetric animals with differing morphologies and Hox gene cluster orderings could be illuminating. It should be interesting to clarify if the Hox4 loss is the cause or the effect of a partially conserved gene ordering in the sea urchin.
A hypothesis was proposed according to which, during Hox gene activation, physical forces precede and organize the geometry of the Hox clusters, followed by the biomolecular interactions [
44]. This prediction is in agreement with the conclusion that ‘the data suggest the structural organization of the HoxD gene cluster may predate transcriptional activation’ [
20].
Krumlauf rightly noticed that, although significant progress has been made in exploring Hox gene collinearity, ‘collinearity remains as intriguing today as it did when Ed Lewis first described this unique feature…’ [
12]. The reason for this failure is probably due to the fact that all approaches up to now ignore the role of Noether’s theory. As it is indicated here, the inclusion of NT in explaining HGC leads to the observed gene ordering in the finite (with two ends) linear vertebrate Hox clusters. Furthermore, NT can also explain Hox gene ordering in animals with different endless topologies and symmetries, as in the case of circular embryos (e.g., echinoderms).


