1. Introduction
Since the mid-20th century, the plastic industry revolution has improved the lifestyles of humans by influencing a variety of fields [
1] including agriculture, sports, electronics, construction, and majorly, packaging [
2]. According to reports, 12 million tonnes of plastic waste reach the aquatic environment annually [
3]. By 2040, that number is expected to increase to 30 million tonnes annually [
4]. Around 26 to 36% of the plastic produced is intended to be used just once [
5]. Once in water systems, plastics undergo various chemical processes such as abrasion, biodegradation, hydrolysis, and photocatalysis, resulting in the formation of nanoplastics (NPs) with size up to <1 µm [
6]. Nevertheless, reported particle size ranges for nanoplastics remain inconsistent across the scientific literature. Different definitions place the upper size boundary at either 100 or 1000 nm, with considerable conceptual overlap with the colloidal size range [
7,
8]. Gigault et al. defined nanoplastics as plastic particles 1–1000 nm in size that can exhibit colloidal behavior, while other classification frameworks distinguish nanoplastics (1–<1000 nm) from microplastics (1–<1000 μm) [
8]. In addition to small size, increased mobility, surface reactivity, and bioavailability, NPs also present the threat of permeation through biological membranes leading to their accumulation in living cells [
9]. Moreover, NPs can carry heavy metals, organic pollutants, and pathogenic microorganisms, increasing the threats to the environment and human health [
10].
Among widely used plastics, polystyrene (PS) is commonly found in single-use food containers, insulating material, and packaging, whereas polyethylene terephthalate (PET) is widely utilized in beverage bottles, synthetic fiber production, and food packaging processes [
11,
12,
13], which produce massive nanoplastic pollution. Both PS and PET nanoplastics exhibit hydrophobicity as well as surface activity; therefore, they tend to absorb toxins, toxic organic compounds, heavy metals, and pathogens that serve as the second-level pollutants in water. This issue has become a serious concern because of the presence of both types of nanoplastics in wastewater, rivers, lakes, and marine environments [
14]. Studies have shown these NPs can generate toxicological effects such as oxidative stress, inflammation, cellular damage, metabolic disturbance, and possibly genotoxicity [
15,
16,
17,
18].
The increasing presence of nanoplastics in aquatic systems requires effective removal methods. Adsorption offers high removal efficiency, simple operation, low cost, and minimal secondary pollution [
19]. Materials such as clays, zeolites, biochar, metal–organic frameworks (MOFs), and graphene oxide (GO) composites have been investigated for nanoplastic removal [
20]. However, nanoplastic–adsorbent interactions remain poorly understood. Chitosan and cellulose are widely used in water treatment because of their abundance and low toxicity [
20]. Chitosan provides amino and hydroxyl groups [
21,
22], while cellulose is rich in hydroxyl groups [
23,
24]. Their use can nevertheless be restricted by poor mechanical strength, limited adsorption sites, and pH sensitivity [
25,
26]. GO contains carbonyl, epoxy, hydroxyl, and carboxyl groups that can provide additional interaction sites [
27]. Its application can be limited by sheet aggregation, which reduces the availability of surface sites [
28]. Incorporation of GO into these biopolymer matrices can improve stability and maintain accessible functional groups. Accordingly, GO-, chitosan-, chitin-, and cellulose-based materials have shown potential for microplastic and nanoplastic removal [
28,
29,
30].
In our recent work, GO–CS and GO–MCC composites demonstrated effective adsorption of PE–NPs, confirming their potential for nanoplastic removal [
31]. However, how nanoplastics with different polymer chemistries interact with the same GO–polysaccharide platform remains insufficiently understood. The present study therefore extends this work by comparatively investigating the adsorption of PET–NPs and PS–NPs under identical experimental conditions. The novelty lies in elucidating how differences in their physicochemical properties affect adsorption affinity and interactions with GO–CS and GO–MCC composites. By integrating adsorption studies with particle-size, surface-charge, and spectroscopic characterization, this work provides insight into polymer-dependent adsorption behavior and the applicability of GO–polysaccharide composites toward chemically distinct nanoplastics.
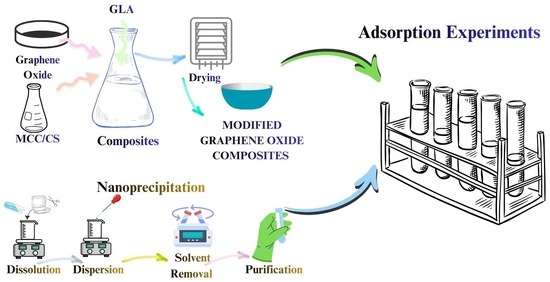
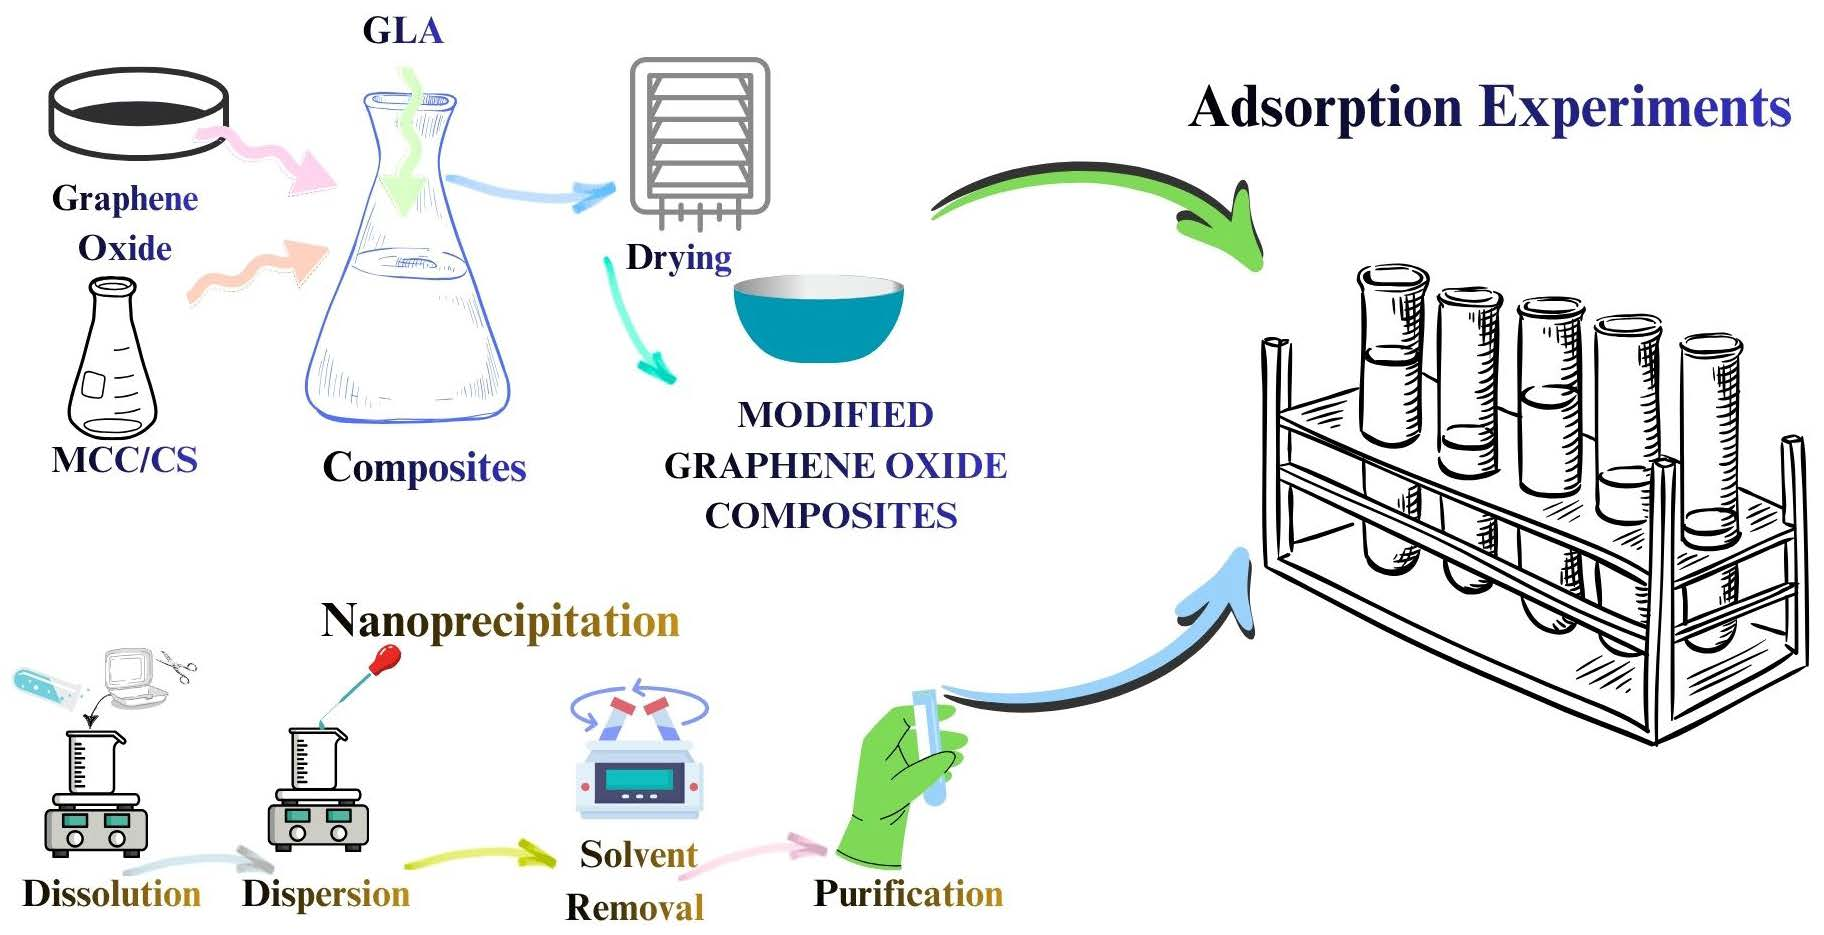
PET–NPs and PS–NPs were synthesized by nanoprecipitation, and their adsorption onto GO–CS, GO–MCC50µm, and GO–MCC90µm was investigated under different pH, contact time, temperature, and concentration conditions. The novel contribution lies in the direct comparison of chemically distinct PET and PS nanoplastics on the same GO–polysaccharide platform, enabling polymer-dependent differences in adsorption affinity and interactions to be identified. TEM, DLS, and zeta-potential measurements characterized primary particle size, hydrodynamic size, and surface charge, while XPS provided insight into surface chemical changes after adsorption. Kinetic and equilibrium models were further applied to evaluate adsorption behavior and controlling mechanisms. This approach provides mechanistic insight into how nanoplastic chemistry influences adsorption by GO–polysaccharide composites.
2. Materials and Methods
Tetrahydrofuran (THF, pure p.a., Chempur, Piekary Śląskie, Poland), trifluoroacetic acid (TFA, pure, Carlo Erba Reagents S.A.S., Val de Reuil, Cedex, France), polyvinyl alcohol (PVA, 98–99% hydrolyzed, medium molecular weight, Thermo Scientific Chemicals, Ward Hill, MA, USA), dimethyl sulfoxide (DMSO; Chempur, Piekary Śląskie, Poland), Milli-Q water (Merck Millipore, Billerica, MA, USA).
2.1. Preparation of PET Nanoplastics
One gram of PET plastic (plastic bottle) was dissolved in 100 mL of TFA for 10 min. Then slowly, with the help of a syringe, smaller amounts of solution were added to 100 mL of 5% PVA solution (5 g of poly vinyl alcohol in 95 mL of water). This mixture was stirred at 1500 rpm for 2 h for stabilization of formed nanoplastics. After stabilization the solution was centrifuged at 7000 rpm for 25 min to remove all the solvent from the nanoplastics. Further water was applied 3 times to wash off all the solvent. The nanoplastics were dried at 80 °C to remove any excessive solvent and then stored at 4 °C [
32].
2.2. Preparation of PS Nanoplastics
One gram of polystyrene plastics (food packaging) was added to 100 mL of tetrahydrofuran (THF) at 25 °C and stirred for 10 min. A 5% PVA solution was prepared by adding 5 g of PVA in 95 mL of water and stirred at 80 °C for 2 h. A prepared solution of plastics was slowly added, with the help of a syringe, to the prepared stabilizer solution of 5% PVA and stirred for 2 h for stabilization [
33]. After stabilization, the nanoplastics solution was washed with water three times through centrifugation. The washed nanoplastics were dried at 80 °C and stored at 4 °C [
34].
2.3. Determination of Point of Zero Charge
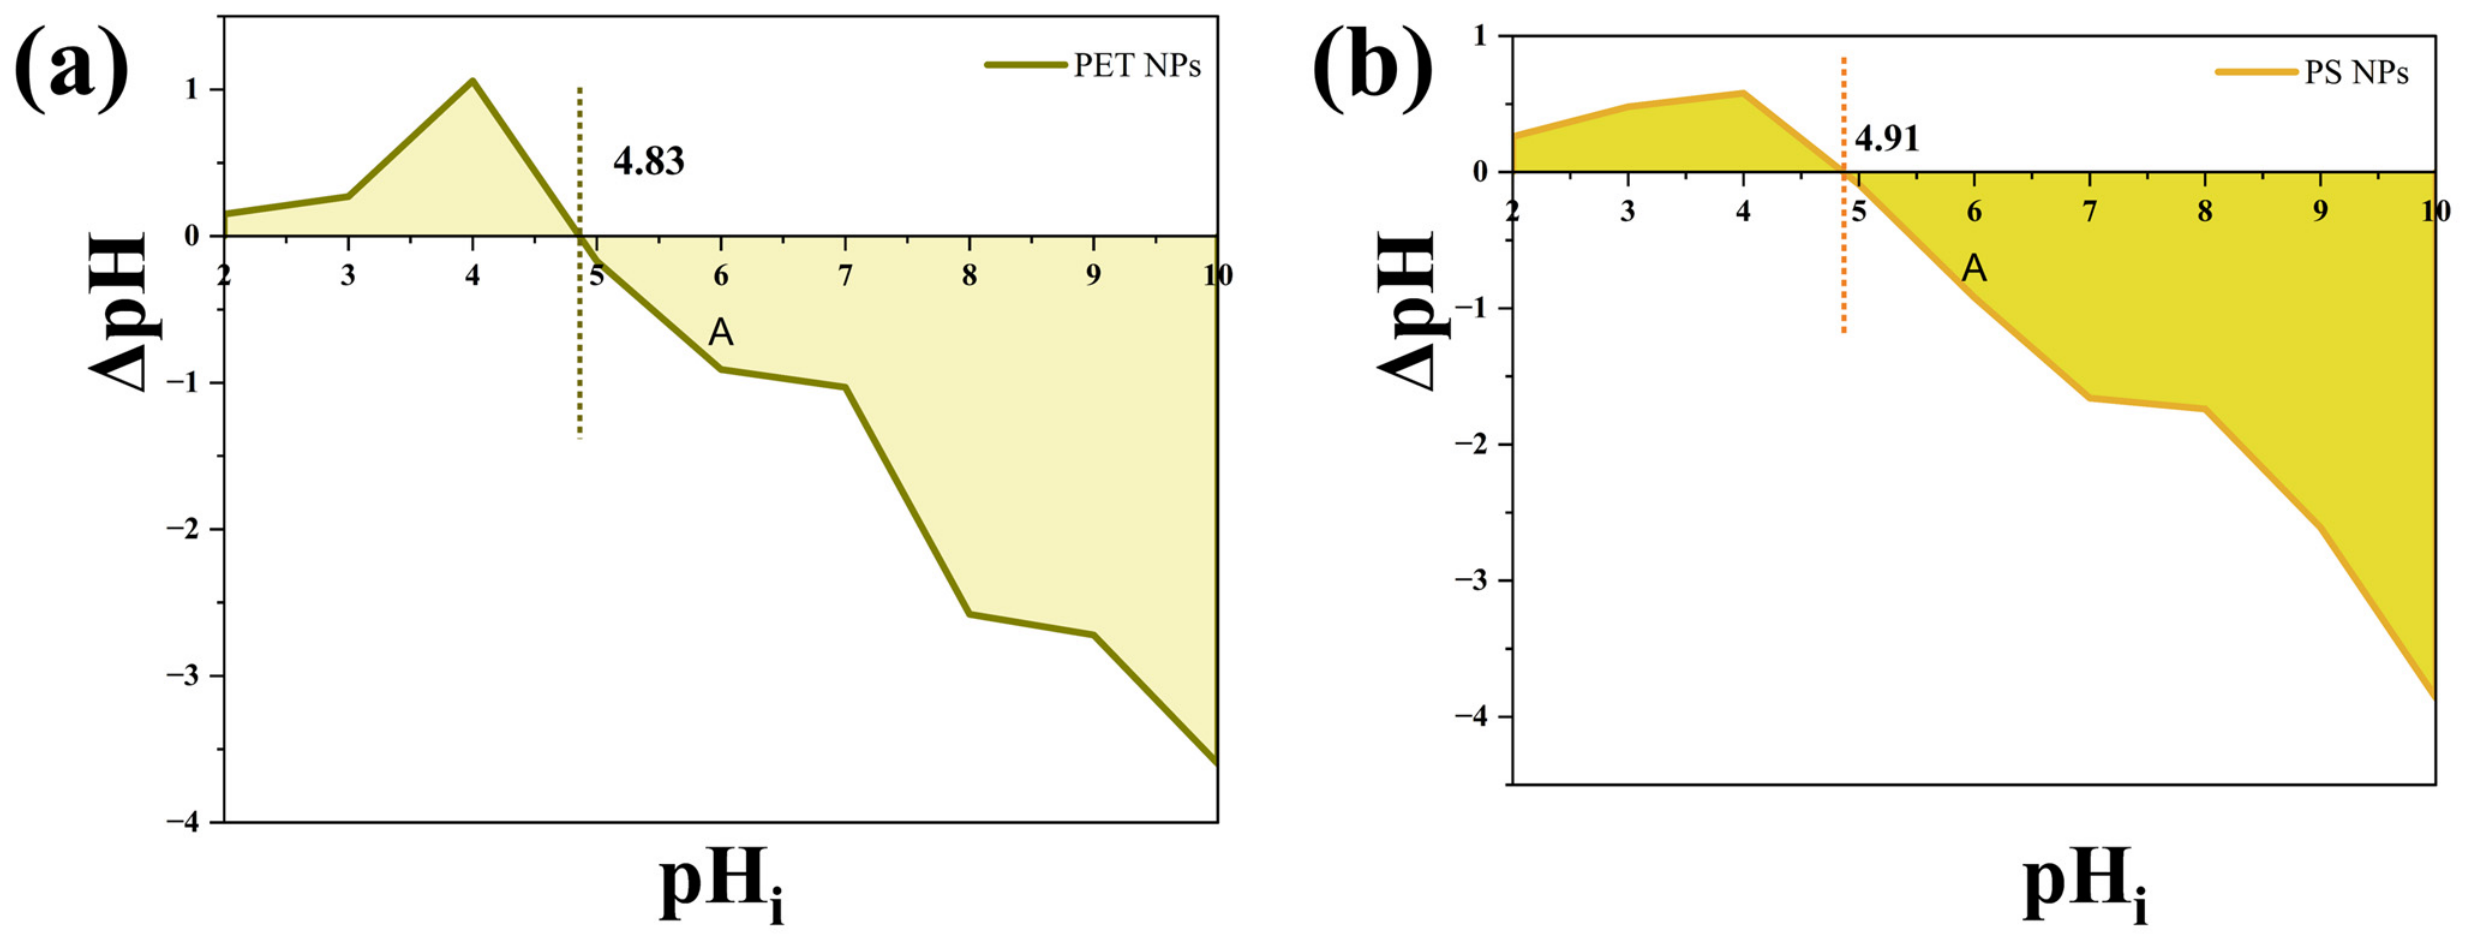
The pHpzc for PET–NPs and PS–NPs was determined using the salt titration method. In short, 30 mg of each material was individually added to 0.1 M NaCl that had been adjusted to a pH of 2–10. The prepared samples were agitated at a speed of 150 rpm. After 24 h, samples were filtered, followed by pH measurement. To find pHpzc, a graph was plotted against initial pH (pHi) and ΔpH. The pHpzc was located at the intersection of ΔpH and pHi.
2.4. DLS
Samples were dispersed in ultrapure water to a concentration 20mg/L to avoid multiple scattering effects and were equilibrated at 25 °C for 120 s prior to measurement. Measurements were performed using low-volume disposable micro-cuvettes (40 µL sample volume; ZEN0040, Malvern Panalytical, Malvern, UK) at 25 °C, with 10 measurements recorded for each sample.
2.5. Zeta Potential
Samples were dispersed in ultrapure water and loaded into folded capillary zeta cells (DTS1070, Malvern Panalytical). Measurements were conducted at 25 °C after a 120 s equilibration period, applying an electric field across the sample and measuring particle velocity using a combination of laser Doppler velocimetry and phase-analysis light scattering. The zeta potential was calculated from the measured electrophoretic mobility using the Smoluchowski approximation.
2.6. X-Ray Photoelectron Spectroscopy
The XPS analyses were carried out with a Kratos Axis Supra spectrometer using a monochromatic Al K(alpha) source (25 mA, 15 kV). Spectra were analyzed using CasaXPS software (version 2.3.23rev1.1R).
2.7. Adsorption Experimental Procedure
The adsorption capacities of the three composites toward PET–NPs and PS–NPs were evaluated using batch adsorption experiments. To guarantee stock solutions, PET–NPs and PS–NPs (20 mg·L
−1) were individually ultrasonicated using an ultrasonic bath for 180 min to ensure sufficient dispersion of the nanoplastics. A quantity of 10 mg of the dried composites was mixed with 10 mg·L
−1 of PET–NPs and PS–NPs solutions separately at varying pH levels for the adsorption experiment for 24 h. In order to evaluate the effect of the NPs concentration on adsorption capacity, initial PET–NPs and PS–NPs concentrations ranging from 5 to 20 mg·L
−1 were used. By varying the amount of adsorbents between 5 and 20 mg while maintaining the concentration of PET–NPs and PS–NPs at 50 mg·L
−1, the impact of adsorbent dose was examined. Adsorption kinetics were investigated using distinct samples for each contact period (5 min, 10 min, 30 min, 1 h, 1.5 h, and 24 h). A quantity of 10 mg of all three GO-composites was combined with 10 mg·L
−1 of PET–NPs and PS–NPs solution separately, and the mixture was agitated at 150 rpm and 25 °C. The impact of temperature on adsorption was measured at 25, 30, 35, and 40°C. For UV-Visible analysis, the centrifugation speed was set to 7000 rpm for the treated samples and the PET–NPs and PS–NPs concentrations were found using a UV-spectrophotometer with wavelengths of 265 nm and 215 nm, respectively. All adsorption tests were carried out in triplicate. The observed trends in removal efficiency were consistent across triplicate trials, with variations within the experimental error within ±5%. The following Equations (1) and (2) were used to determine the removal efficiency and adsorption capacity at equilibrium (q
e):
where m (g) is the mass of the adsorbent, C
i (mg·L
−1) is the initial concentration and C
e (mg·L
−1) the equilibrium concentration of the PET–NPs and PS–NPs, and V (L) is the volume of the solution.
3. Results
The chemical, structural, and morphological characteristics of GO–MCC90µm, GO–MCC50µm, and GO–CS were previously evaluated using FT–IR, XRD, SEM, and pH
pzc analyses and reported in our earlier study [
31]; a summary of these results is provided in the
Supplementary Materials. In the present study, XPS studies were additionally performed to investigate the surface elemental composition and chemical states of the composites. Meanwhile, FT–IR, Zeta potential, TEM, DLS, and pH
pzc analyses of the PS–NPs and PET–NPs are presented to establish their chemical functionalities, particle size, hydrodynamic diameter, and pH-dependent surface-charge properties relevant to adsorption [
35].
3.1. Attenuated Total Reflectance-Fourier Transform Infrared Spectroscopy
The attenuated total reflectance-Fourier transform infrared spectroscopy (ATR-FTIR) spectra were recorded using an Alpha spectrometer (Bruker Inc., Ettlingen, Germany) with an ATR platinum diamond accessory and a room temperature Detector RT-DLATGS.
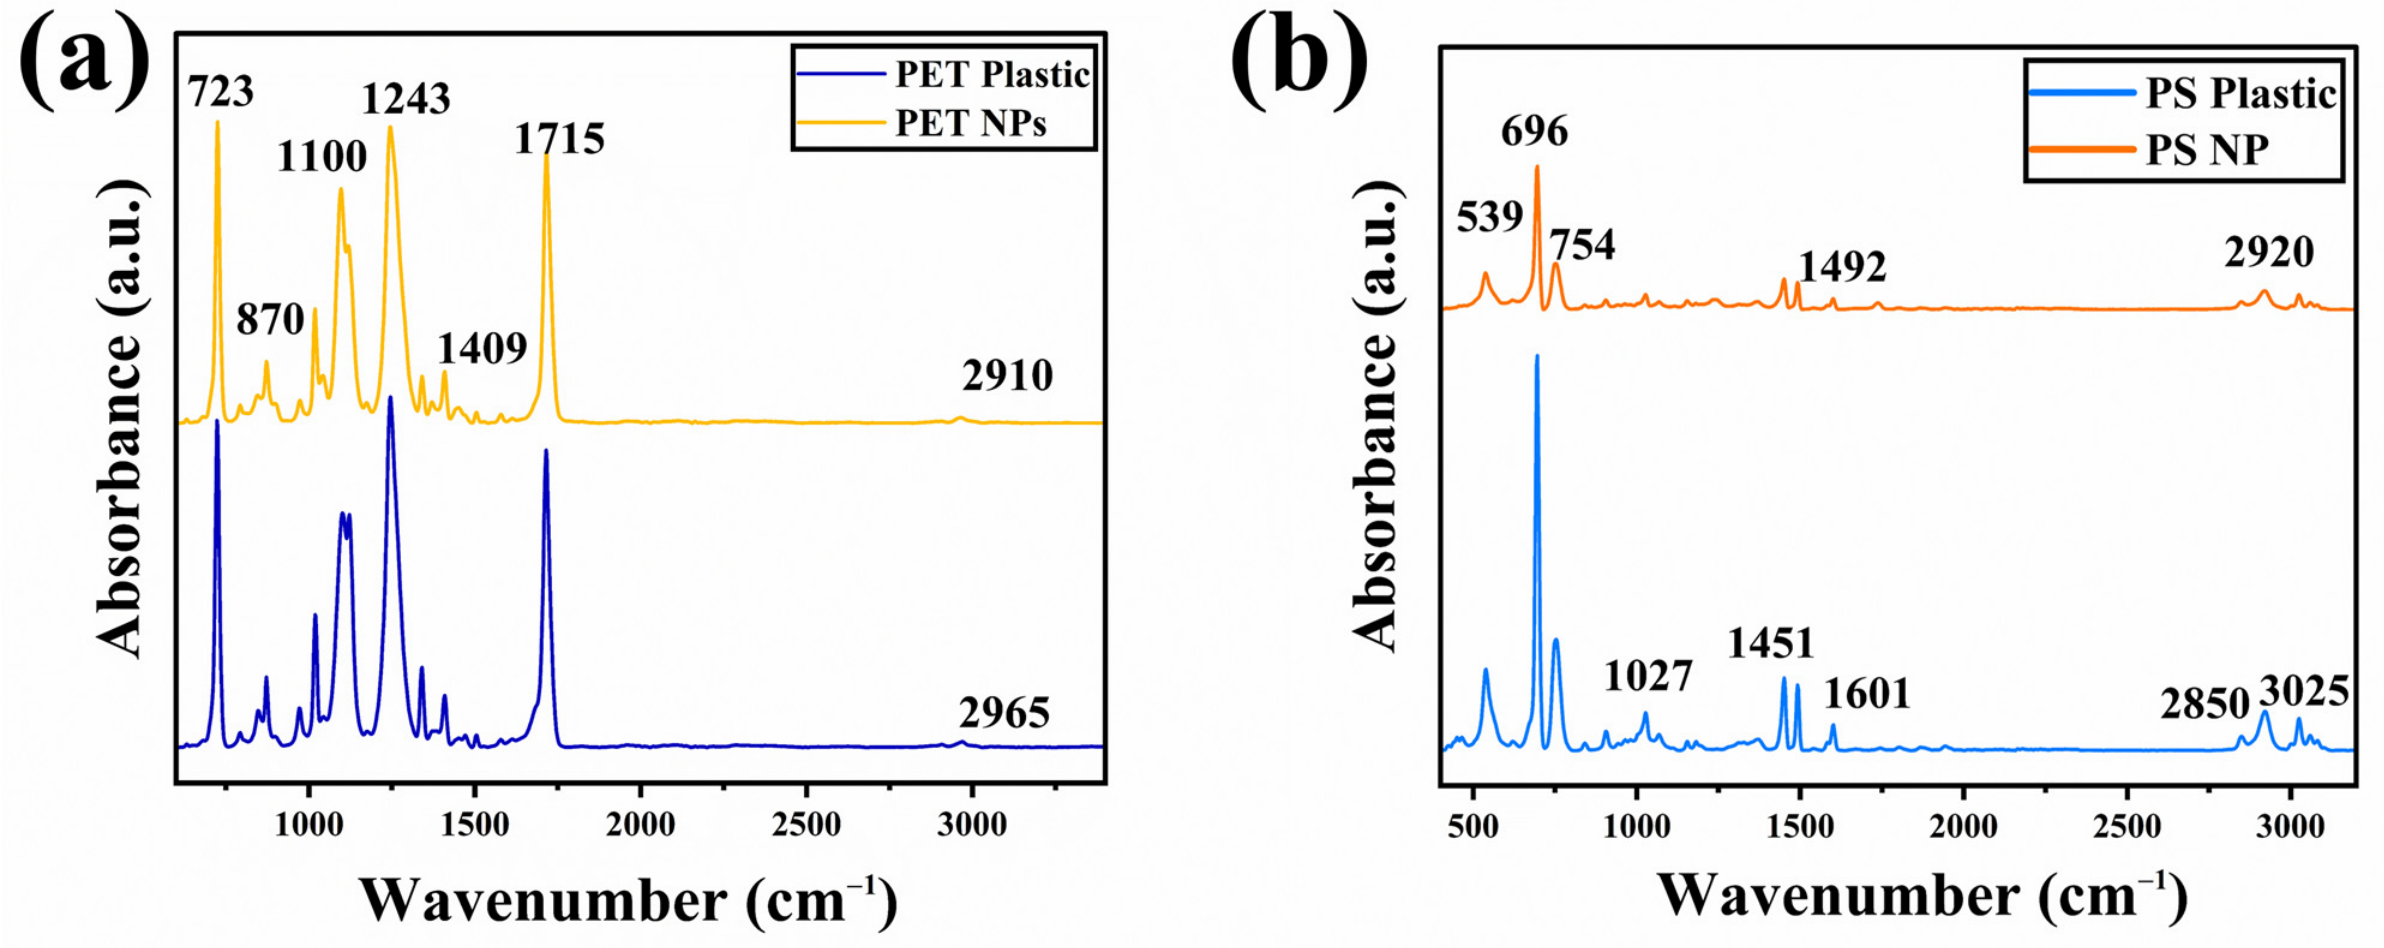
PET–NPs and PET plastic were characterized by ATR-FTIR (
Figure 1a). All the peaks that were observed had already been identified as PET plastic characteristics. The principal peaks for the PET polymers are 723, 870, 1100, 1243, 1715, 2856, 2910, and 2965 cm
−1 [
36]. At 2910, and 2965 cm
−1, the symmetric CH
2 stretching and significant asymmetric stretching vibrations of –CH
2 in the methylene group were identified. The ester linkage’s carbonyl (C=O) stretching vibration is responsible for the band at 1715 and 1243 cm
−1, while 1100 cm
−1 represents the methylene group. Out-of-plane deformation and out-of-plane bending of aromatic C–H bonds are represented by the peaks around 870 cm
−1 and 723 cm
−1. For the nanoplastics, all these peaks were equally noted. These peaks represent all characteristic structural elements of PET polymer chains, including aliphatic ethylene segments, ester functional groups, and aromatic benzene rings. The ATR-FTIR results for PS–NPs and PS plastic are displayed in
Figure 1b.
Prior research identified all the identified peaks as PS plastic characteristics. The principal peaks for the PS polymers are 539, 696, 754, 1027, 1451, 1492, 1601, 2850, 2920 and 3025 cm
−1. At 3025, 2920, and 2850 cm
−1, the aromatic C–H stretching asymmetric stretching and symmetric stretching vibrations of –CH
2 in the methylene group were noted. Aromatic ring stretching vibrations (C=C stretching) of the phenyl group bonded to the polymer chain are responsible for the band at 1601 cm
−1 and 1492 cm
−1. C–H bending deformation vibrations, in-plane C–H bending, and aromatic rings are represented by the peaks at 1451 cm
−1 and 1027 cm
−1. The out-of-plane aromatic C-H bending vibrations and out-of-plane monosubstituted benzene ring C–H bending vibrations are represented by the peaks at 754 cm
−1 and 696 cm
−1. The skeleton bending vibrations of the aromatic ring are responsible for the band at 539 cm
−1 [
37]. For the nanoplastics, all these peaks were found as well. The minor difference in the intensity of peak formation is due to the size of the particles, increase in surface area, and minor variation during the nanoplastic preparation process using polyvinyl alcohol (PVA) as one of the reactants. Overall, during the production of PS–NPs and PET–NPs, no new absorption bands were found, suggesting that no significant chemical structural alterations had taken place during the preparation of the nanoplastics.
3.2. Transmission Electron Microscopy
PET–NPs and PS–NPs were observed using transmission electron microscopy (TEM) [
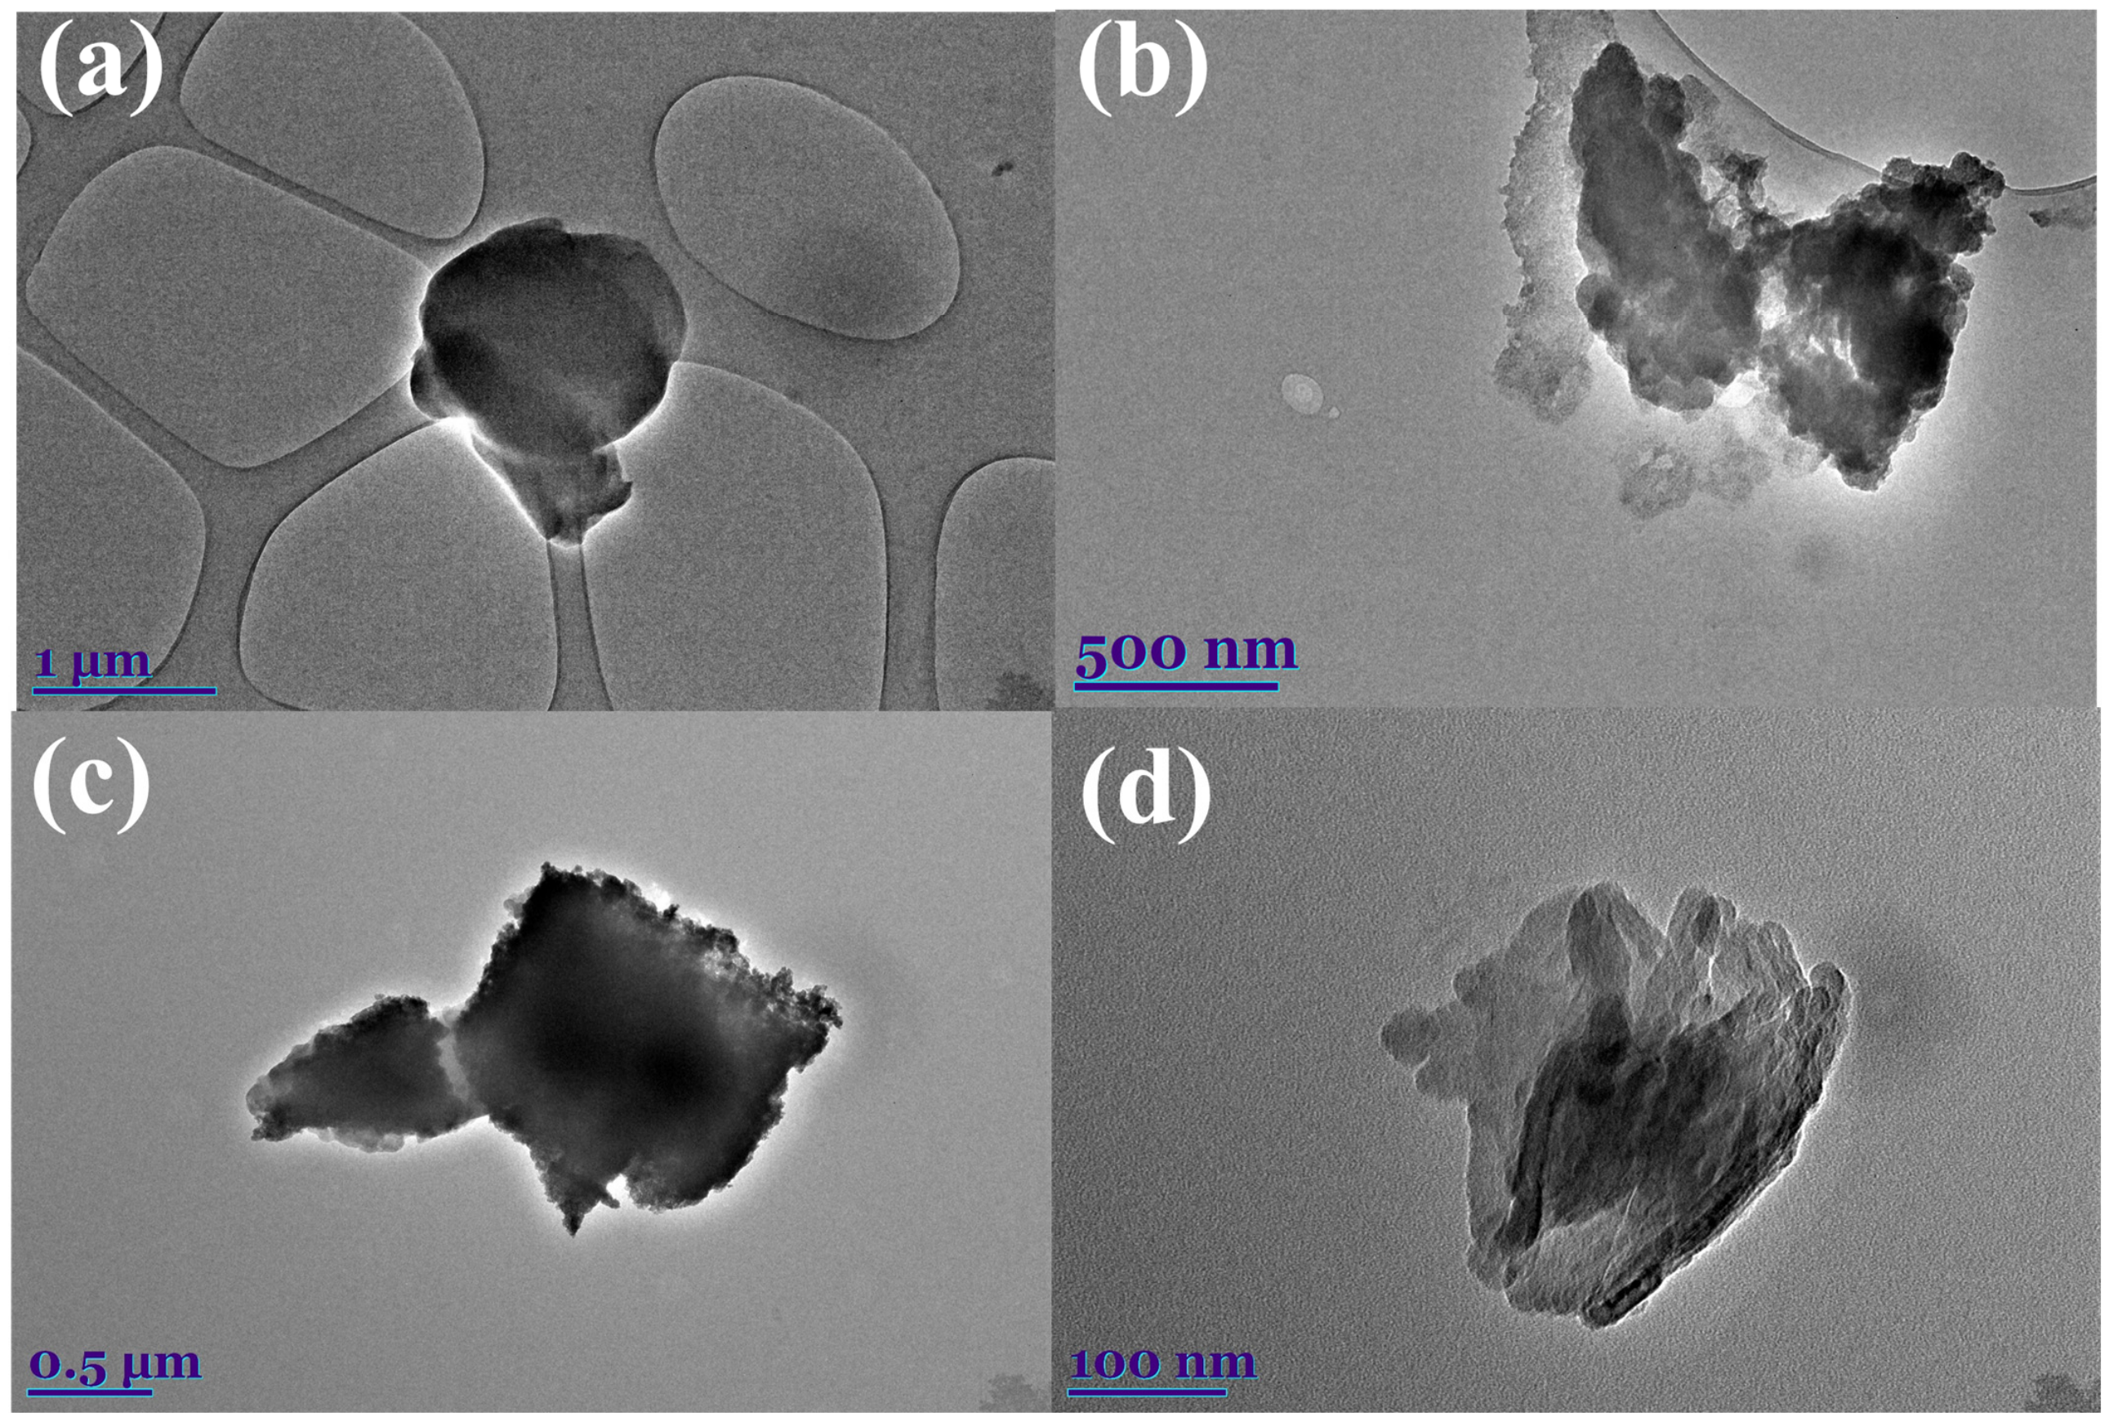
38]. TEM pictures of PS nanoplastics (PS–NPs) demonstrated that the production of nanoplastics for sizes between 500 nm and 1 µm was achieved successfully, as shown in
Figure 2a with agglomerated particles and
Figure 2b. These particles were characterized by an irregular but well-defined morphology, suggesting efficient nanoprecipitation and particle synthesis. Similarly, as shown in
Figure 2c containing a combination of smaller particles and
Figure 2d with smaller size particles, the TEM images of the PET nanoplastics (PET–NPs) demonstrated that nanosized particles with diameters ranging from almost 100 nm to 0.5 µm were successfully manufactured.
3.3. Dynamic Light Scattering (DLS) and Zeta Potential
The hydrodynamic diameter, particle size distribution, and surface charge of the fabricated PET−NPs and PS−NPs were determined using Dynamic Light Scattering (DLS) [
39], as depicted in
Table 1 below. PET−NPs had a Z-average diameter of 782.61 nm while PS−NPs had a significantly higher diameter of 1142.28 nm, reflecting higher levels of aggregation in the PS suspension. The PDI values of 0.295 and 0.336 for PET−NPs and PS−NPs, respectively, also reflected broader size distributions of PS−NPs than those of PET−NPs.
The diameters measured using dynamic light scattering were higher compared to the primary particle size determined using electron microscope since DLS provides an apparent diameter of solvated particles, which are heavily affected by large particles and aggregates due to high scattering intensity [
40]. Therefore, while the TEM showed that both PET–NPs and PS–NPs were mostly submicron-sized primary NPs, their aggregates may range up to the broader colloidal scale range. The difference is vital since there is an intersection between classifications of NPs sizes.
The zeta potentials of PET−NPs and PS−NPs (
Table 1) were −3.687 mV and −11.61 mV, respectively. Despite the stronger negativity of the PS−NPs surface potential, both values were less than the critical ±30 mV usually characterizing the electrostatic stability of colloids [
41]. Therefore, the electrostatic repulsion between particles was not strong enough to hinder the interactions at the measurement conditions. The zeta potential of near zero value of PET–NPs indicated weak electrostatic stabilization, but the smaller values of the average size and PDI of these nanoplastics revealed a lesser extent of aggregation in comparison with PS–NPs. In summary, both nanoplastic suspensions have some aggregations, while PS–NPs have higher aggregations and size polydispersity.
3.4. Point of Zero Charge
Surface charges have a major impact on the interface between the adsorbent and analyte in adsorption analysis. Because it depends on the interaction involving the surface charge and the initial pH of the solution, the pH point of zero charge (pH
pzc) is an essential chemical property used to determine the surface charge of a substance. The pH where the surface charge becomes neutral is determined by this procedure [
42]. It is widely acknowledged that the surface charge of a material is positive when the pH is lower compared to the pH
pzc and negative when it is greater. As a result, adsorption of cationic species is preferred at pH values greater than the pH
pzc, whereas adsorption of anionic species is typically more successful at lower pH values. The surface groups of material interact with the OH
− and H
+ ions in solution. In order to examine the surface chemistry of the synthesized composites and nanoplastics, pH values were used to plot the pH
pzc and assess the surface charge.
According to recent studies, the point of zero charge for PS and PET nanoplastics usually falls between 3 and 8 [
43,
44]. However, the degree of degradation, particle size, surfactant, and preparation technique can all affect the surface charges of PET and PS nanoplastics, changing their morphological heterogeneities, surface functional groups, and surface charge properties. In this study, the produced PET and PS nanoplastics were found to have point of zero charge (pH
pzc) values of 4.83 (
Figure 3a) and 4.91(
Figure 3b), respectively.
It has been noted that the negative charges on the surface of PET and PS nanoplastics at pH levels relevant to the environment are directly related to the molecular structure of these materials, which have aromatic groups and oxygen-containing groups that can undergo ionization at the surface. Specifically, the ester groups present in PET (–COO–) play an important role in the generation of negative surface charge. The reason for this relatively high pHpzc possibly lies in the differences in the synthetic process of the nanoplastics and the surface functional groups formed during the synthesis. In view of the usage of PVA as a stabilizer during the synthesis of nanoparticles, some traces of PVA can still remain on the surface of the NPs after being washed. It is possible that some traces of PVA present on the surface of the nanoplastic will have an effect on the pHpzc determined through the experiment. There is no indication of the presence of PVA bands from the FT–IR analysis. This suggests that under environmentally important pH circumstances (pH > 5), the nanoplastics have a net negative surface charge, which might have a major impact on their sorption processes, transport dynamics, and aggregation behavior in aqueous settings.
3.5. Batch Adsorption Study
The effects of key operational parameters, including solution pH, adsorbent dosage, contact time, initial adsorbate concentration, and temperature, on the adsorption performance were systematically investigated.
3.5.1. Effect of pH
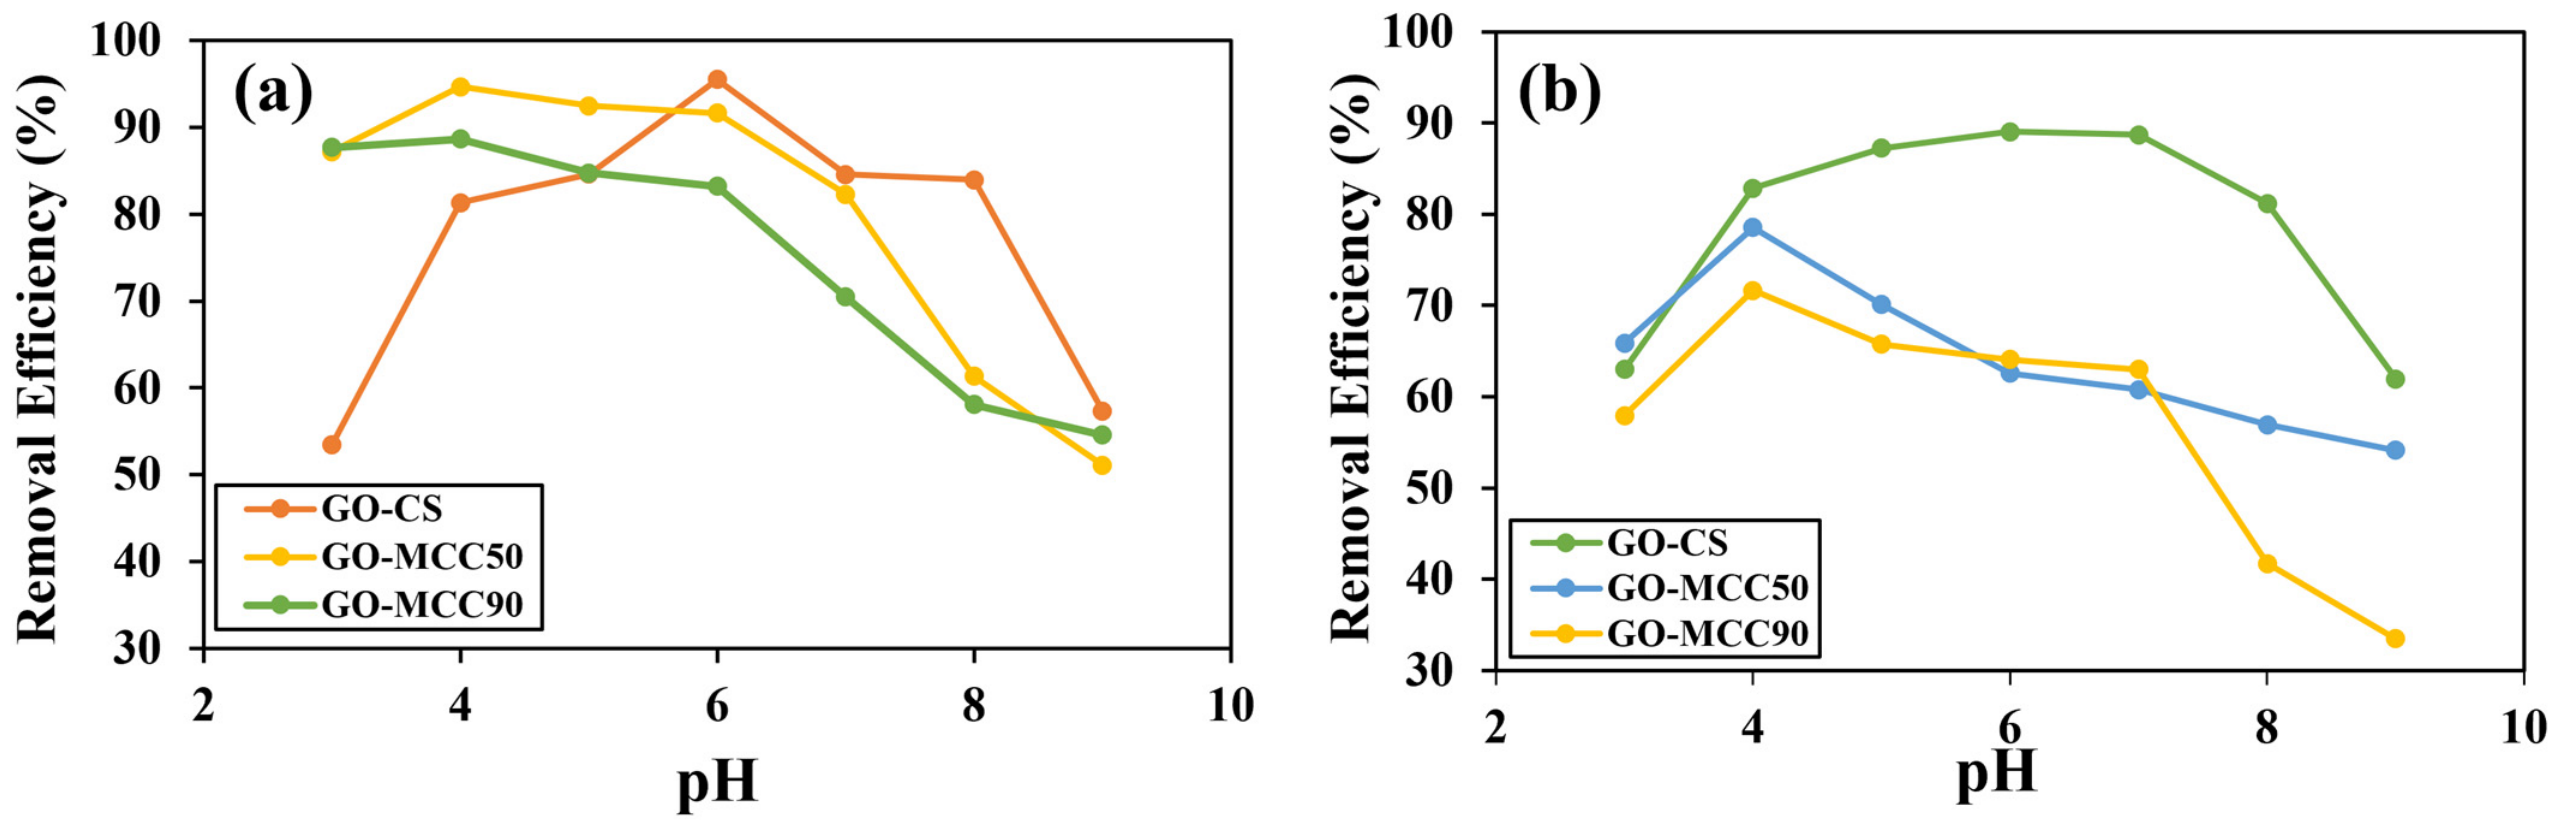
pH is a crucial factor in adsorption because it influences the surface charge of the nanoplastic and adsorbent. In this study, pH significantly influenced the adsorption of PET–NPs and PS–NPs by GO–CS, GO–MCC50µm, and GO–MCC90µm composites by regulating the surface charge of both the adsorbents and adsorbates. The pHpzc values of GO–CS, GO–MCC50µm, and GO–MCC90µm were 6.50, 3.30, and 3.04, respectively, while the pHpzc values of PET–NPs and PS–NPs were 4.83 and 4.91. Consequently, electrostatic interactions varied substantially across the studied pH range (i.e., 3–9).
The adsorption efficiency for GO–CS showed highest performance at pH 6, with 89.02% removal efficiency for PET–NPs and 95.50% removal efficiency for PS–NPs. At this pH, the GO–CS surfaces were positively charged due to protonation of amino groups in the chitosan, while the PET–NPs and PS–NPs surfaces were negatively charged. This charge difference improved electrostatic attractions along with hydrogen bonds and π–π interactions. In contrast, GO–MCC50µm and GO–MCC90µm exhibited optimum adsorption at pH 4, with PET–NPs removal efficiencies of 78.54% and 71.64%, respectively, and PS–NPs removal efficiencies of 94.68% and 88.63%, as shown in
Figure 4. At pH 4, GO–MCC50µm and GO–MCC90µm possessed a weak negative surface charge, whereas PET–NPs and PS–NPs were close to their respective pH
pzc values and therefore had relatively weak surface charge. Consequently, electrostatic repulsion between the composites and nanoplastics was limited, allowing non-electrostatic interactions, including hydrogen bonding, hydrophobic interactions, van der Waals forces, and π–π interactions, to contribute substantially to adsorption. At higher pH, both the GO–MCC composites and nanoplastics became increasingly negatively charged, strengthening electrostatic repulsion and contributing to the observed decrease in adsorption. The comparatively lower performance of GO–MCC90µm may additionally be associated with reduced accessibility of adsorption sites compared with GO–MCC50µm.
In another aspect, the significantly higher removal efficiency of PS–NPs than that of PET–NPs can be attributed to their distinct characteristics in terms of chemical composition and structure. PS–NPs are made up of phenyl rings, which make up their aromatic component with a carbon-based hydrophobic backbone. This makes it likely for there to be a strong affinity between the hydrophobicity of PS–NPs and the graphene oxide composite due to the presence of π–π stacking between aromatic domains of the graphene composites and PS–NPs. On the other hand, PET–NPs have ester (–COO–) groups, making them more polar or hydrophilic. These functional groups increase the likelihood of forming bonds with water molecules rather than with the composite adsorbent surface. Although PET–NPs possess the ability to form hydrogen bonds with oxygenated or nitrogenated functional groups, their affinity towards the GO–based adsorbents was less compared to PS–NPs.
Adsorption on all adsorbents declined in an alkaline environment owing to gradual deprotonation of surface functional groups that increased the negatively charged nature of adsorbents and nanoplastics. In addition, electrostatic repulsion, combined with the presence of competing hydroxide ions, lowered the rate of adsorption. This is clearly evident from the results obtained, which show that adsorption is a function of the equilibrium maintained between electrostatic forces and non-electrostatic forces. The optimal operation of adsorption can be achieved by optimizing these conditions. While there was a relatively small difference in the removal efficiency throughout the tested pH values, there was consistency among all repeat trials carried out, with the variations being below the experimental error (±5%).
3.5.2. Effect of Adsorbent Dose
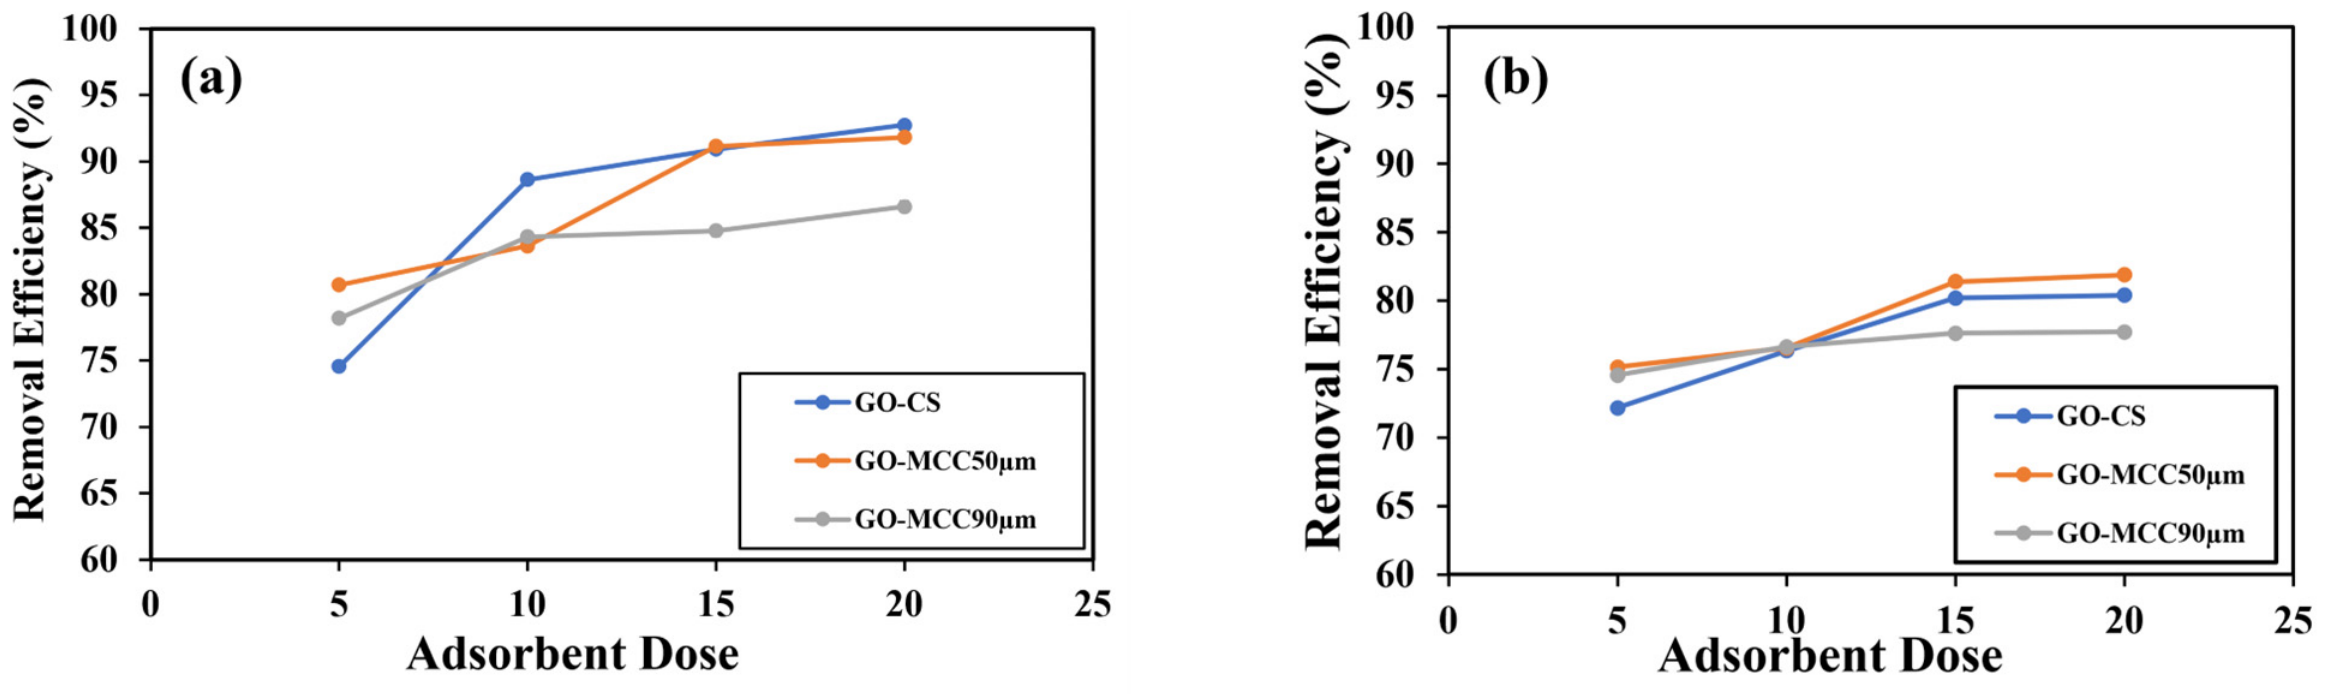
The effectiveness of the adsorbent in attracting the pollutant depends on the quantity of the adsorbent used for a given initial concentration of the adsorbate. To determine the removal efficiency and adsorption capacity of the composites; GO–CS, GO–MCC50µm, and GO–MCC90µm, adsorbent doses were varied as 5, 10, 15, and 20 mg·L−1 at room temperature.
In general, it may be said that the removal efficiency increases with increasing adsorbent dosage. With increase in the dose of adsorbents, the available active sites and surface area increased, thus increasing the probability of interactions between nanoplastics and the adsorbent surface. With lower dose of adsorbents, the few available active sites were unable to take up the nanoplastics. As the amount of GO–CS was increased, there was an increment in the removal efficiency of PET–NPs and PS–NPs from 72.17 to 80.19% and 74.54% to 90.90%, respectively. The same trend was observed for the GO–MCC50µm composite where the percentage of PET–NPs adsorption was increased from 74.55% to 77.62%, whereas the percentage adsorption of PS–NPs was increased from 80.68% to 91.13%. Similarly, the removal efficiency of the GO–MCC90µm composite for PET–NPs and PS–NPs was increased from 75.14% to 81.88% and 78.18% to 81.38%, as shown in
Figure 5.
Hence, the adsorption capacities of both PET–NPs and PS–NPs are increased by adding up to 0.015 g amounts of GO–CS, GO–MCC50µm, and GO–MCC90µm composites. After the dose of 0.015 g, no significant increase was seen in the removal efficiency, which is due to overlapping of the active sites of the adsorbent because of excessive adsorbent amounts. The same trend was noted in PS–NP adsorption, in which the adsorbent amount was found to increase efficiency since there were more adsorption sites and more surface area for the adsorption of nanoplastics [
45,
46].
3.5.3. Effect of Initial Concentration
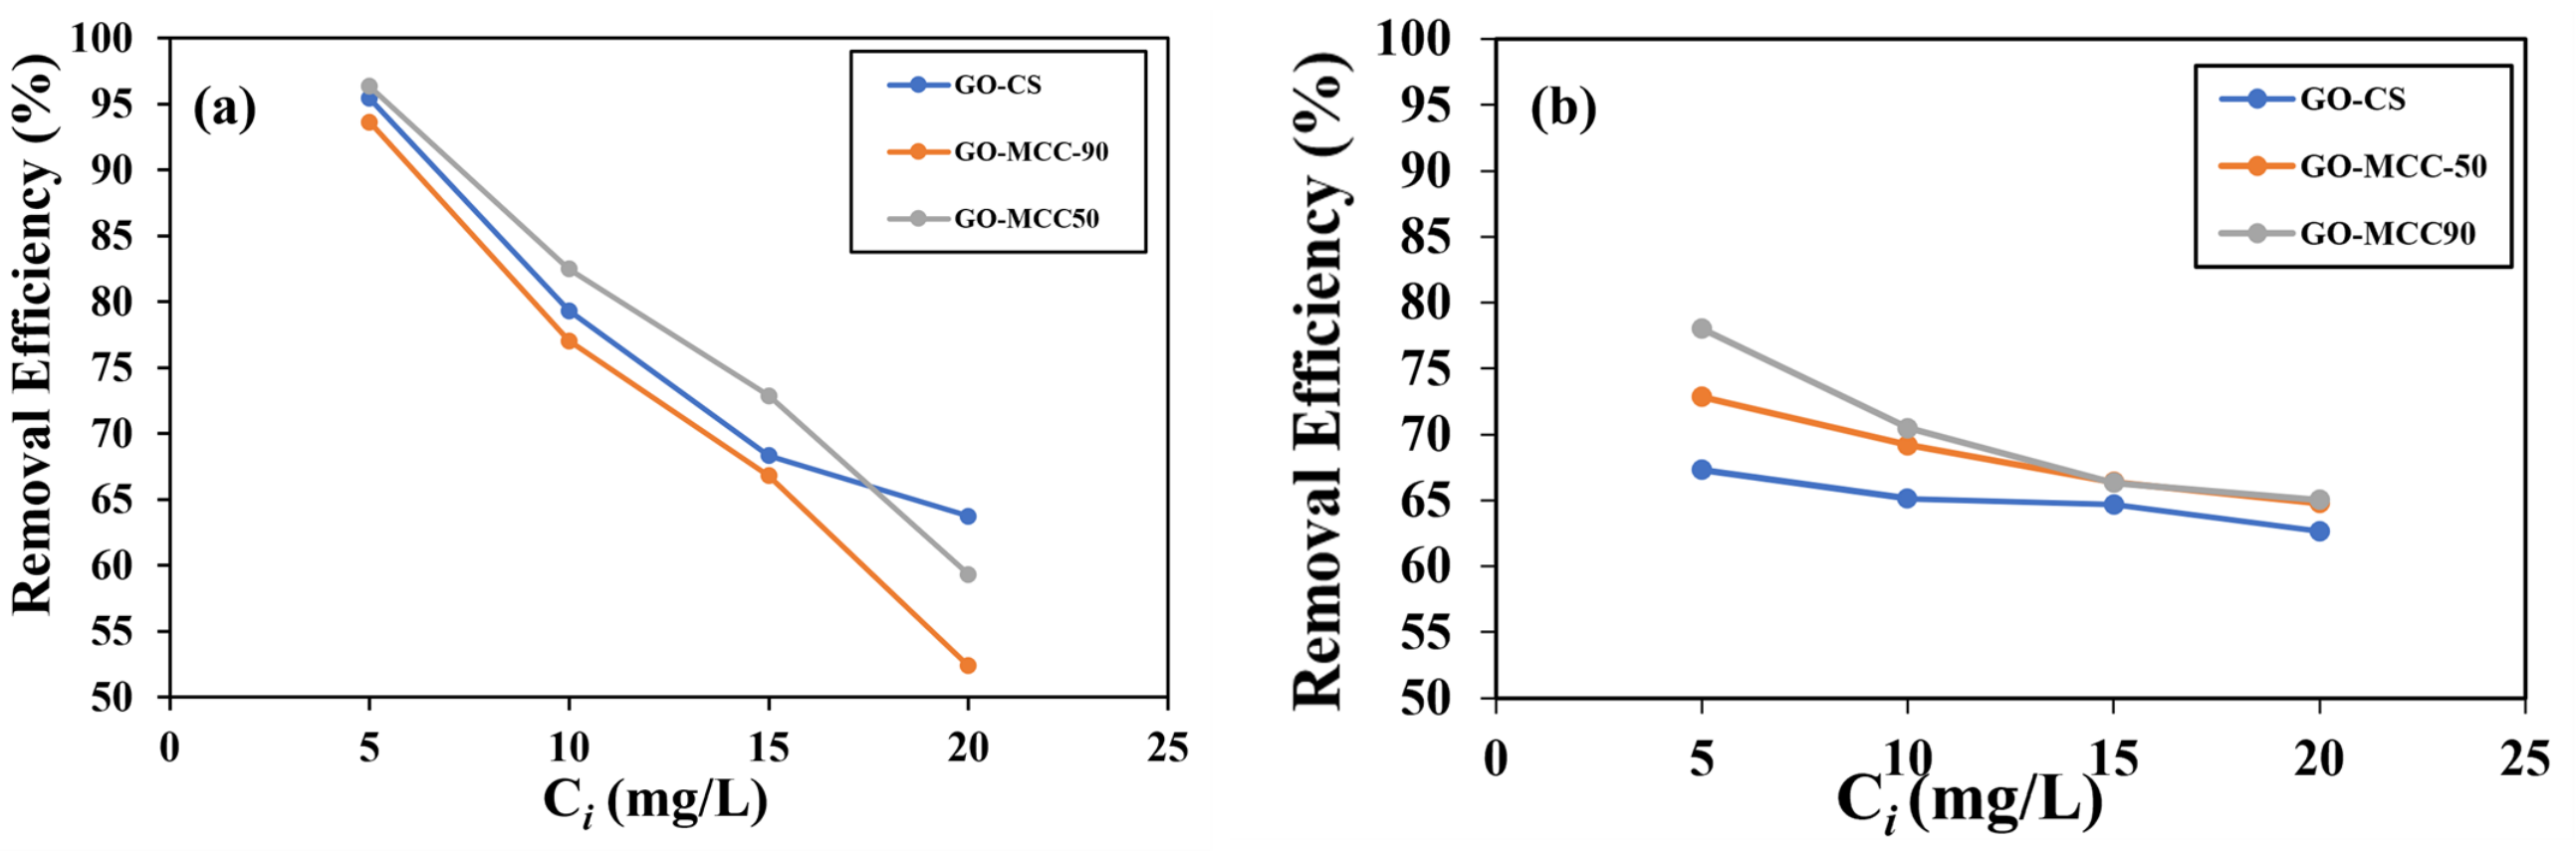
It is well known that removal efficiency greatly depends on the initial concentration. The adsorption efficiency of PET–NPs onto GO–CS (67.32%), GO–MCC50µm (72.87%), and GO–MCC90µm (78.01%) was greater for the lowest initial concentration, as the figure indicates. In the case of PS–NPs, adsorption efficiency onto GO–CS is 95.45%, for GO–MCC50µm, it is 96.36% and for GO–MCC90µm, it is 93.63% at 5 mg·L
−1, as shown in
Figure 6.
Moreover, the adsorption efficiency of both PET–NPs and PS–NPs reduced with increase in the initial concentration, suggesting that the amount of available adsorption sites in GO–CS, GO–MCC50µm, and GO–MCC90µm became limited at higher nanoplastic concentrations. At lower initial concentration, there were many adsorption sites available as compared to the nanoplastics, which made their removal easier. When the concentration was increased, more PET–NPs and PS–NPs were available to compete for adsorption sites; therefore, surface saturation and hence lower efficiency occurred. Furthermore, higher concentration could cause particle–particle interaction and agglomeration in solution, reducing the availability of nanoplastic particles and making adsorption difficult by the surface. Moreover, PS–NPs demonstrated higher removal efficiencies than PET–NPs from all three composites in the concentration range, showing the greater preference of PS towards GO–based adsorbents. This phenomenon was observed due to the aromatic nature of PS, which facilitated the hydrophobicity and π–π interaction of PS with GO. In contrast, the greater polarity of PET–NPs caused their stronger interaction with the aqueous phase.
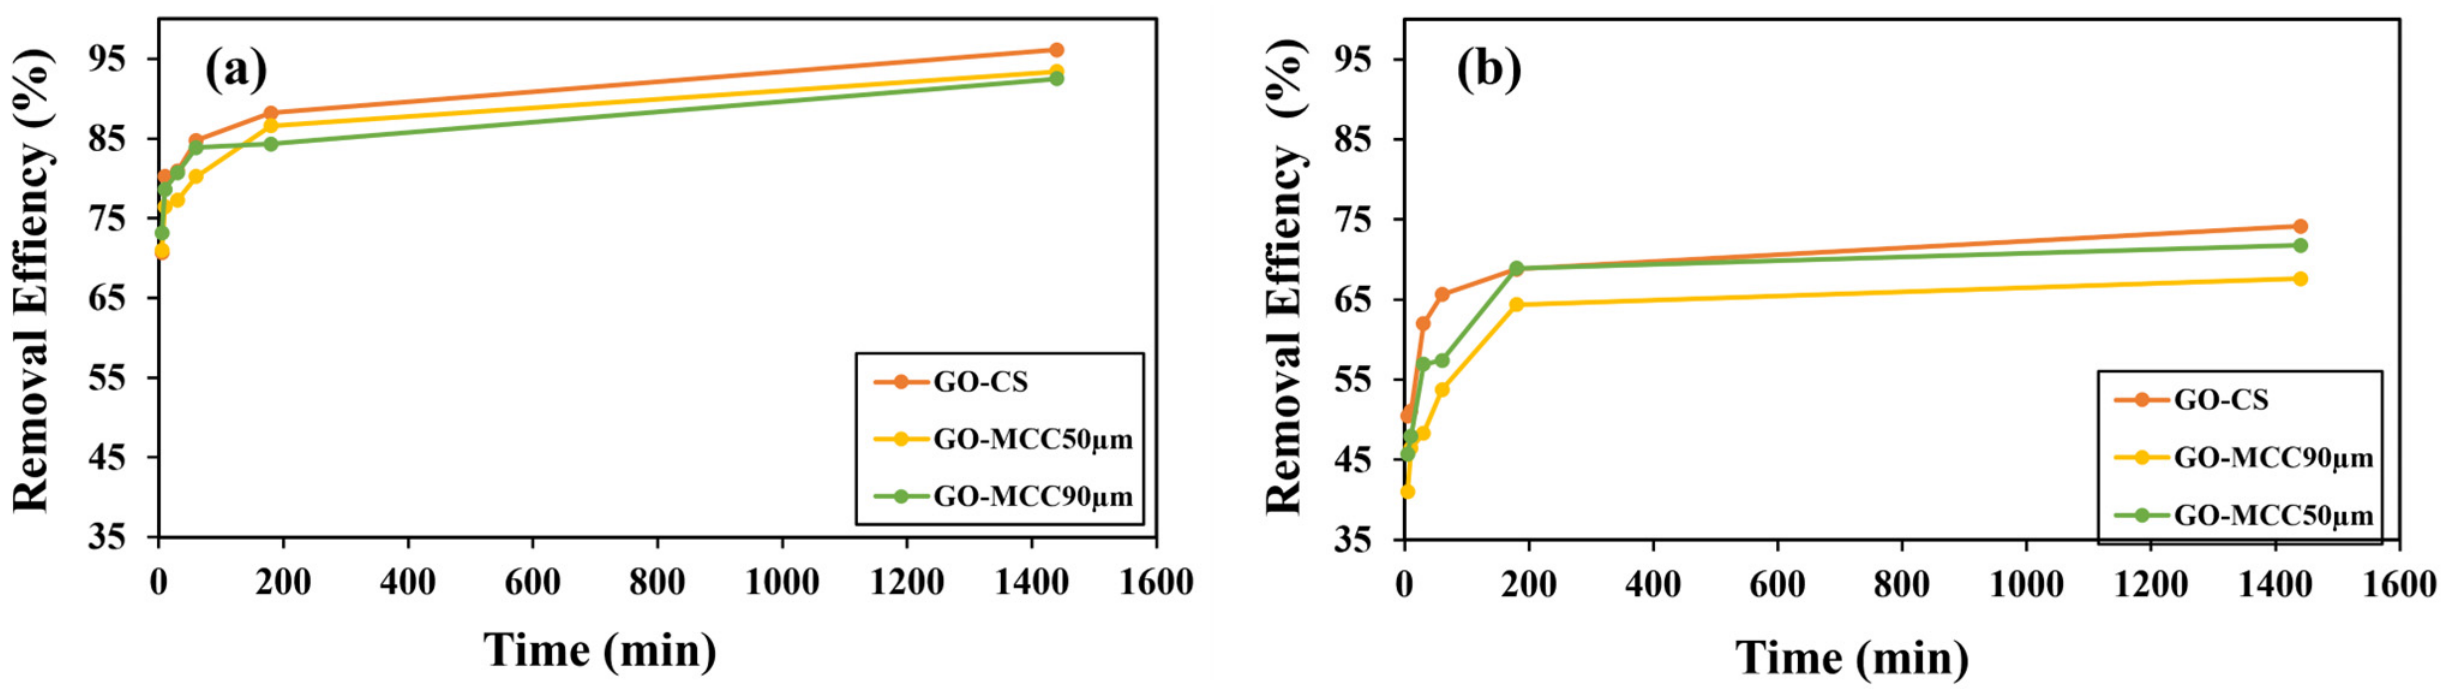
3.5.4. Effect of Contact Time
Contact time is an important factor for sorption processes [
47]. Consequently, the contact time was studied at 5, 10, 30, 60, 180 min and 24 h in order to study the effect of time on the sorption of PET–NPs and PS–NPs.
In the case of PS–NPs (
Figure 7a), the results show that maximum removal efficiency was seen in GO–CS of about 96.13%. This can be attributed to the higher presence of amine and hydroxyl groups in GO–CS than GO–MCC, as well as higher surface area and pore availability, thus enhancing adsorption. In the case of cellulose composites, GO–MCC50µm showed better removal efficiencies compared to GO–MCC90µm. Li et al. had previously noted that as initial concentration of the analyte increases, active site competition occurs, resulting in reduced removal efficiency [
48].
For PET–NPs (
Figure 7b), the findings show that the highest removal efficiency was demonstrated by GO–CS composites at 74.15%. On the other hand, regarding cellulose composites, GO–MCC50µm exhibited superior removal efficiency of 71.78% compared to GO–MCC90µm at 67.62%. The result is illustrated in
Figure 7, indicating an increase in the adsorption of PS–NPs onto the GO–CS, GO–MCC50µm, and GO–MCC90µm. However, in the case of PET–NPs, adsorption was negligible even after 180 min. The reason for maximum adsorption after 24 h is that all active sites were utilized [
49].
3.5.5. Effect of Temperature
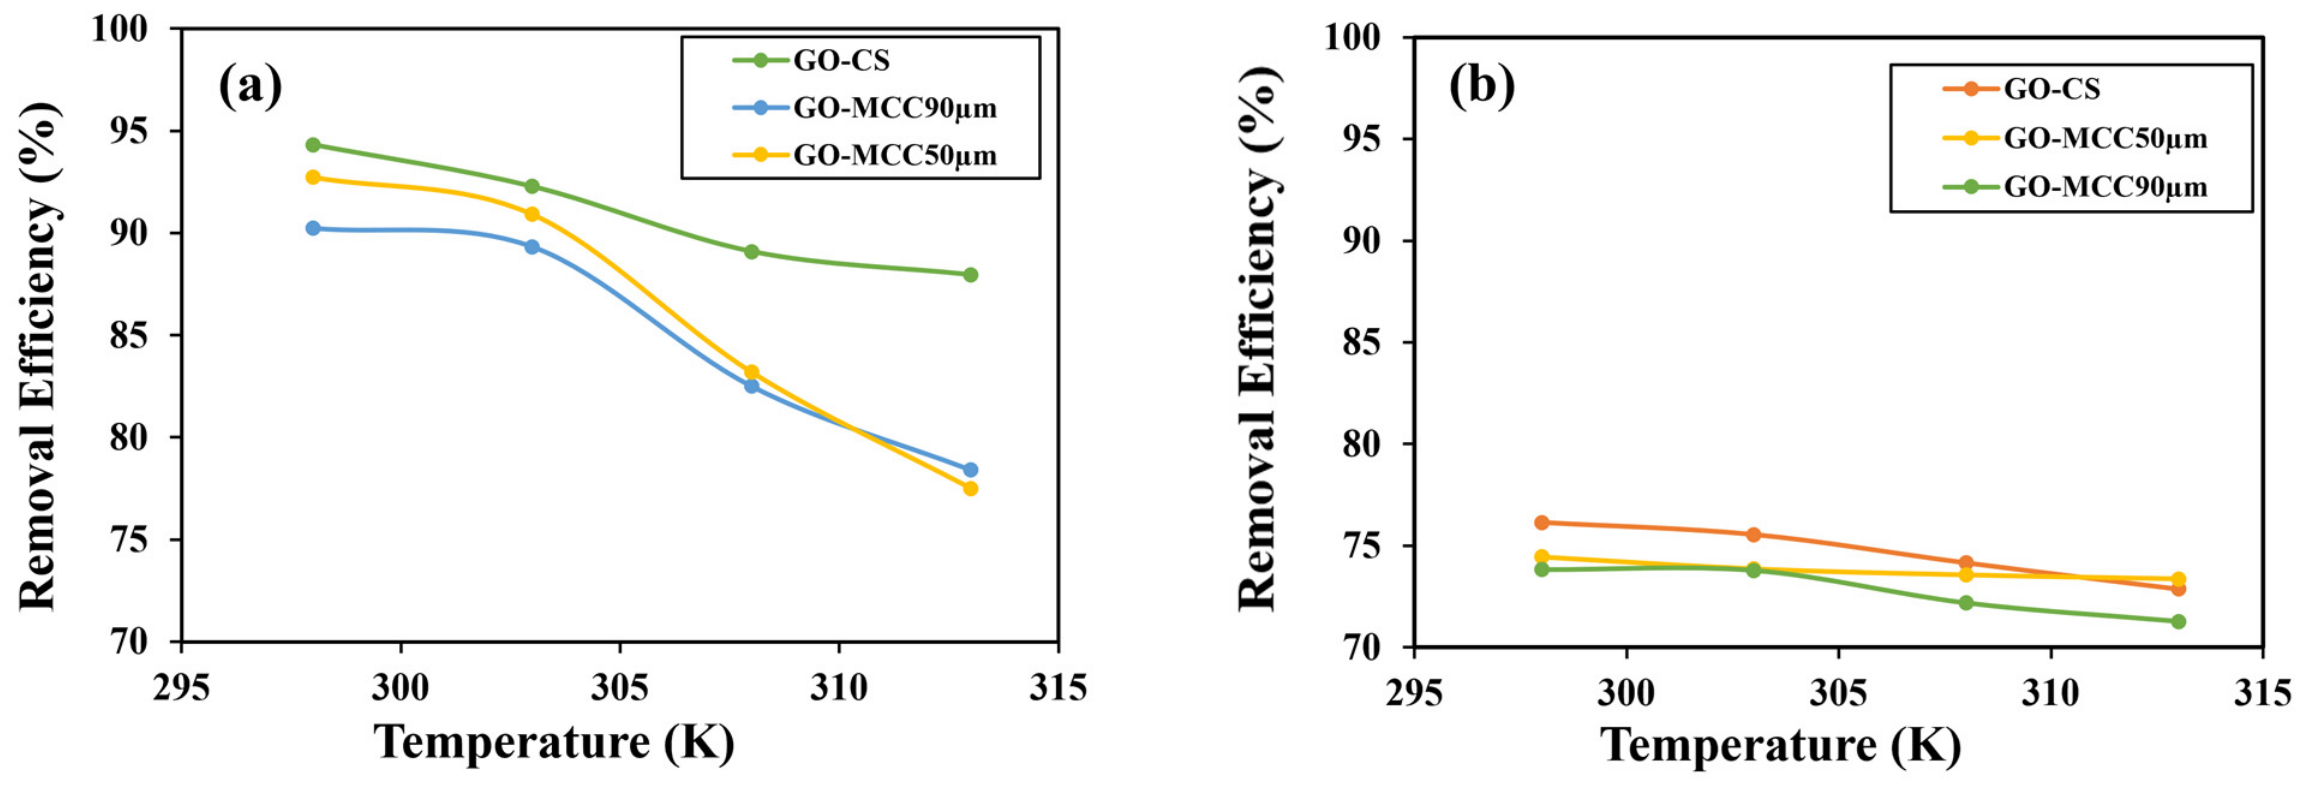
Temperature affects the process of adsorption significantly [
50]. Consequently, the adsorption of PS–NPs and PET–NPs on GO–CS, GO–MCC50µm, and GO–MCC90µm at 298–313 K is presented in
Figure 8 below. The percentage of GO composites in PS–NPs reduced from 94.31% to 87.95%. Meanwhile, the percentage of GO–MCC90µm composite reduced from 90.22% to 78.40%, and the percentage of GO–MCC50µm composite reduced from 92.72% to 77.5%. In the case of PET–NPs, a decline was noted from 76.13 to 72.87%. In the same way, for GO–MCC90µm, a decline was reported from 73.82 to 71.26% and for GO–MCC50µm, it declined from 74.45 to 73.36%.
As the temperature increases, PS–NPs and PET–NPs easily migrate from the surface of the composites into the solution due to thinning of the boundary layer thickness. Decrease in adsorption with increase in temperature shows that the reaction is an exothermic reaction since there is decrease in interactions between PS–NPs, PET–NPs, and composite surfaces with rise in thermal energy. The same trends were reported by other researchers, for example, Ebisike et al., who showed that with increase in temperature, there was a decrease in adsorption [
51].
3.6. Adsorption Isotherm Modeling
The adsorption isotherm depicts the surface interaction between the adsorbate and adsorbent at a particular temperature. Hence, adsorption isotherms are quite important when it comes to the optimum utilization of adsorbents. Plotting the adsorbate concentration in the solid phase against that in the liquid phase would be able to reveal the adsorption isotherm at equilibrium [
52]. Therefore, the isotherm adsorption behavior for PET–NPs and PS–NPs was fitted using the Freundlich and Langmuir equations.
One of the earliest established empirical expressions depicting constancy in an exponential distribution of adsorption sites in a heterogeneous medium is the Freundlich isotherm [
53]. Adsorption in multi-layers on a heterogeneous medium is commonly described by this isotherm. It can be described by Equation (3) as follows:
Here, q
e (mg·g
−1) is the amount of PET–NPs and PS–NPs adsorbed on the GO–MCC50µm, GO–MCC90µm, and GO–CS; K
F (mg·g
−1) is the adsorption capacity; C
e (mg·L
−1) is the equilibrium concentration of PET–NPs and PS–NPs; and 1/n is the adsorption intensity. It is worth mentioning that values of 1/n can provide details about the type of isotherms. For example, when 1/n < 0, it means that the isotherm is irreversible; if 1/n > 0, it should be considered necessary, while 1/n > 1 shows that the isotherm is unfavorable [
42].
The Langmuir model suggests that the adsorption process occurs as a monolayer over a homogenous surface with some active sites that have similarity among themselves [
54]. It should be mentioned that the degree of saturation of adsorptive active sites does not impact on the adsorption energy. The empirical equation for the given isotherm is presented by Equation (4) given below:
The concentration of adsorbed PET–NPs and PS–NPs onto the surface of GO–MCC50µm, GO–MCC90µm, and GO–CS materials is presented as q
e (mg·g
−1), the highest adsorption capacity is characterized by q
max (mg·g
−1), the concentration of PET–NPs and PS–NPs at equilibrium is represented as C
e (mg·L
−1), and the adsorption energy corresponds to K
L (L·mg
−1). The value R
L (separation factor), which is a dimensionless constant, can be used to show one of the main properties of the isotherm. The following empirical Equation (5) can be employed to calculate R
L values:
Here, the Langmuir constant is expressed as KL (L·mg−1), while the initial concentration for PET–NPs and PS–NPs is expressed as Ci (mg·L−1).
According to the Temkin isotherm model, the heat of adsorption depends linearly on the surface coverage, which is caused by adsorbate–adsorbent interaction effects. Unlike the Langmuir model, which ignores adsorbate–adsorbent interactions and considers only direct adsorbate interactions, the Temkin model takes into account indirect interactions between the adsorbates and non-homogeneity of the adsorption energies. Therefore, this model can be used to evaluate the effect of adsorbate–adsorbent interactions on adsorption. The equation for the Temkin isotherm in a linear form is written as in Equation (6):
where Q
e (mg·g
−1) is the adsorption capacity at equilibrium, C
e (mg·L
−1) is the equilibrium concentration of the adsorbate,
(L·g
−1) is the Temkin equilibrium constant, and B is a constant corresponding to the heat of adsorption. The constant B is computed by Equation (7):
where R = universal gas constant (8.314 J mol
−1 K
−1), T = absolute temperature (K), and B
T = Temkin constant related to the heat of adsorption. Temkin constants can be derived by plotting q
e vs. ln C
e. The Dubinin–Radushkevich (D-R) model, on the other hand, can be used to differentiate whether physical or chemical adsorption dominates in an adsorption process according to the mean free energy of adsorption obtained from the model, which does not assume a homogeneous surface unlike the Langmuir model.
The equation that describes the D-R isotherm in its linear form is as follows:
where Q
e (mg/g) represents the equilibrium adsorption, Q
m (mg/g) is the maximum adsorption capacity theoretically obtained, β (mol
2·J−2) represents the energy of interaction expressed as the activity coefficient, and ε represents the Polanyi potential. The parameters of the D-R isotherm can be obtained from a plot of lnQ against ε
2.
All the coefficients for each of the isotherms were determined based on the slopes and intercepts of the linearized graphs of the isotherms; the magnitude of the coefficients can be seen in
Table 2.
Since adsorption is said to be favorable when 0 < R
L < 1 [
53], the R
L values of both PET–NPs and PS–NPs obtained show that favorable adsorption occurred on all three composites. The R
L values obtained for the PS–NPs showed values within the range of 0.02–0.16, indicating highly favorable adsorption, compared to the R
L values of 0.23–0.88 observed for PET–NPs. For PS–NPs, the Freundlich isotherm was most appropriate for the adsorption on GO–CS, since the highest R
2 value was obtained at 0.97. However, for the GO–MCC50µm and GO–MCC90µm, the Langmuir and Freundlich isotherms gave appropriate descriptions, with R
2 values of 0.994 and 0.982, respectively. The q
max increased in the order GO–CS (13.60 mg.g
−1) > GO–MCC50µm (12.59 mg.g
−1) > GO–MCC90µm (11.19 mg.g
−1). When considering PET–NPs adsorption, the Freundlich isotherm demonstrated better fitting compared with the other isotherms. All the R
2 values of the Freundlich isotherm were found within the 0.996–0.999 range. The q
max obtained is in the order of GO–CS:56.17 > GO–MCC50µm: 33.33; GO–MCC90µm > 23.20 mg.g
−1. Moderate-high correlation coefficients (R
2 = 0.91–0.97) obtained using the Temkin equation revealed that interaction of adsorbate with the surface of adsorbents influenced PET–NPs adsorption. However, fitting accuracy decreased compared to the Freundlich isotherm while the D–R model showed relatively weak fits (R
2 = 0.82–0.92) compared with all the other models.
3.7. Adsorption Kinetics Modeling
Kinetics models based on adsorption can also be used to evaluate the adsorption process of nanoplastics. Also, these kinetics models facilitate analysis of different mechanisms involved in adsorption, such as mass transport, diffusion, and reaction [
49]. The extent to which the adsorbate gets adsorbed on the surface of the adsorbent is determined by the adsorption kinetics, which therefore determines how long the adsorbate takes at the interface of the adsorbent and the solution [
55]. For analysis of the adsorption process, three different models, including pseudo-first-order, pseudo-second-order, and intraparticle diffusion models, were employed in an effort to explore the nature of the control of the adsorption process on the PET–NPs and PS–NPs on GO–MCC-50µm, GO–MCC90µm composites, and GO–CS.
The pseudo-first-order kinetic model was first developed by Lagergren, where calculation of the rate constant is achieved based on the adsorption capacity. Based on this model, the rate of removal in contact time determines the adsorption capacity [
55]. In the case of the model above, the pseudo-first-order kinetic equation can be described by Equation (9) as follows:
The rate constant for the pseudo-first-order kinetic model is denoted as k1 (min−1), the equilibrium adsorption capacity is denoted as qe (mg.g−1), while the adsorption capacity at any time t is denoted as qt (mg.g−1).
The pseudo-second-order model developed by Ho and Mckay focuses on the predicted behavior of the adsorption system during the entire duration of the adsorption period. Moreover, the model assumes that the chemisorption process is driven by valence forces as a result of electron sharing between the active sites and the nanoplastics [
49]. The mathematical expression for the equation is represented by Equation (10):
Here, qe (mg·g−1) represents the adsorption capacity at equilibrium, qt (mg·g−1), the signifies adsorption capacity at time t, and k2 (g.mg−1 min−1) represents the rate constant of the pseudo-second-order kinetic model.
The intraparticle diffusion model, which was developed by Morris and Weber, is typically used to determine the diffusion mechanism of the adsorption process. The adsorption process involves a number of processes, including the transfer of adsorbate from the bulk solution to the exterior surface surrounding the adsorbent, the transfer of adsorbate from the exterior surface to its interior sites, and the transfer of adsorbate from the interior sites to the interior surface of the adsorbent pores [
53]. Additionally, intraparticle diffusion will be the rate-controlling step where the graph of qt versus t
1/2 yields a straight line whose intercept is equal to zero based on the study done by Morris and Weber. The above model can be formulated in the equation below:
Herein, K
id(g.mg
−1.min
−1/2) denotes the intraparticle diffusion constant whereas C (mg.g
−1) represents the boundary layer thickness. The Elovich model is based on the mechanism of chemisorption on surfaces with heterogeneous adsorption sites. This model can be represented by
Here, α (mg·g−1·min−1) shows the initial adsorption rate, while β (g·mg−1) stands for the Elovich constant, which is related to surface coverage.
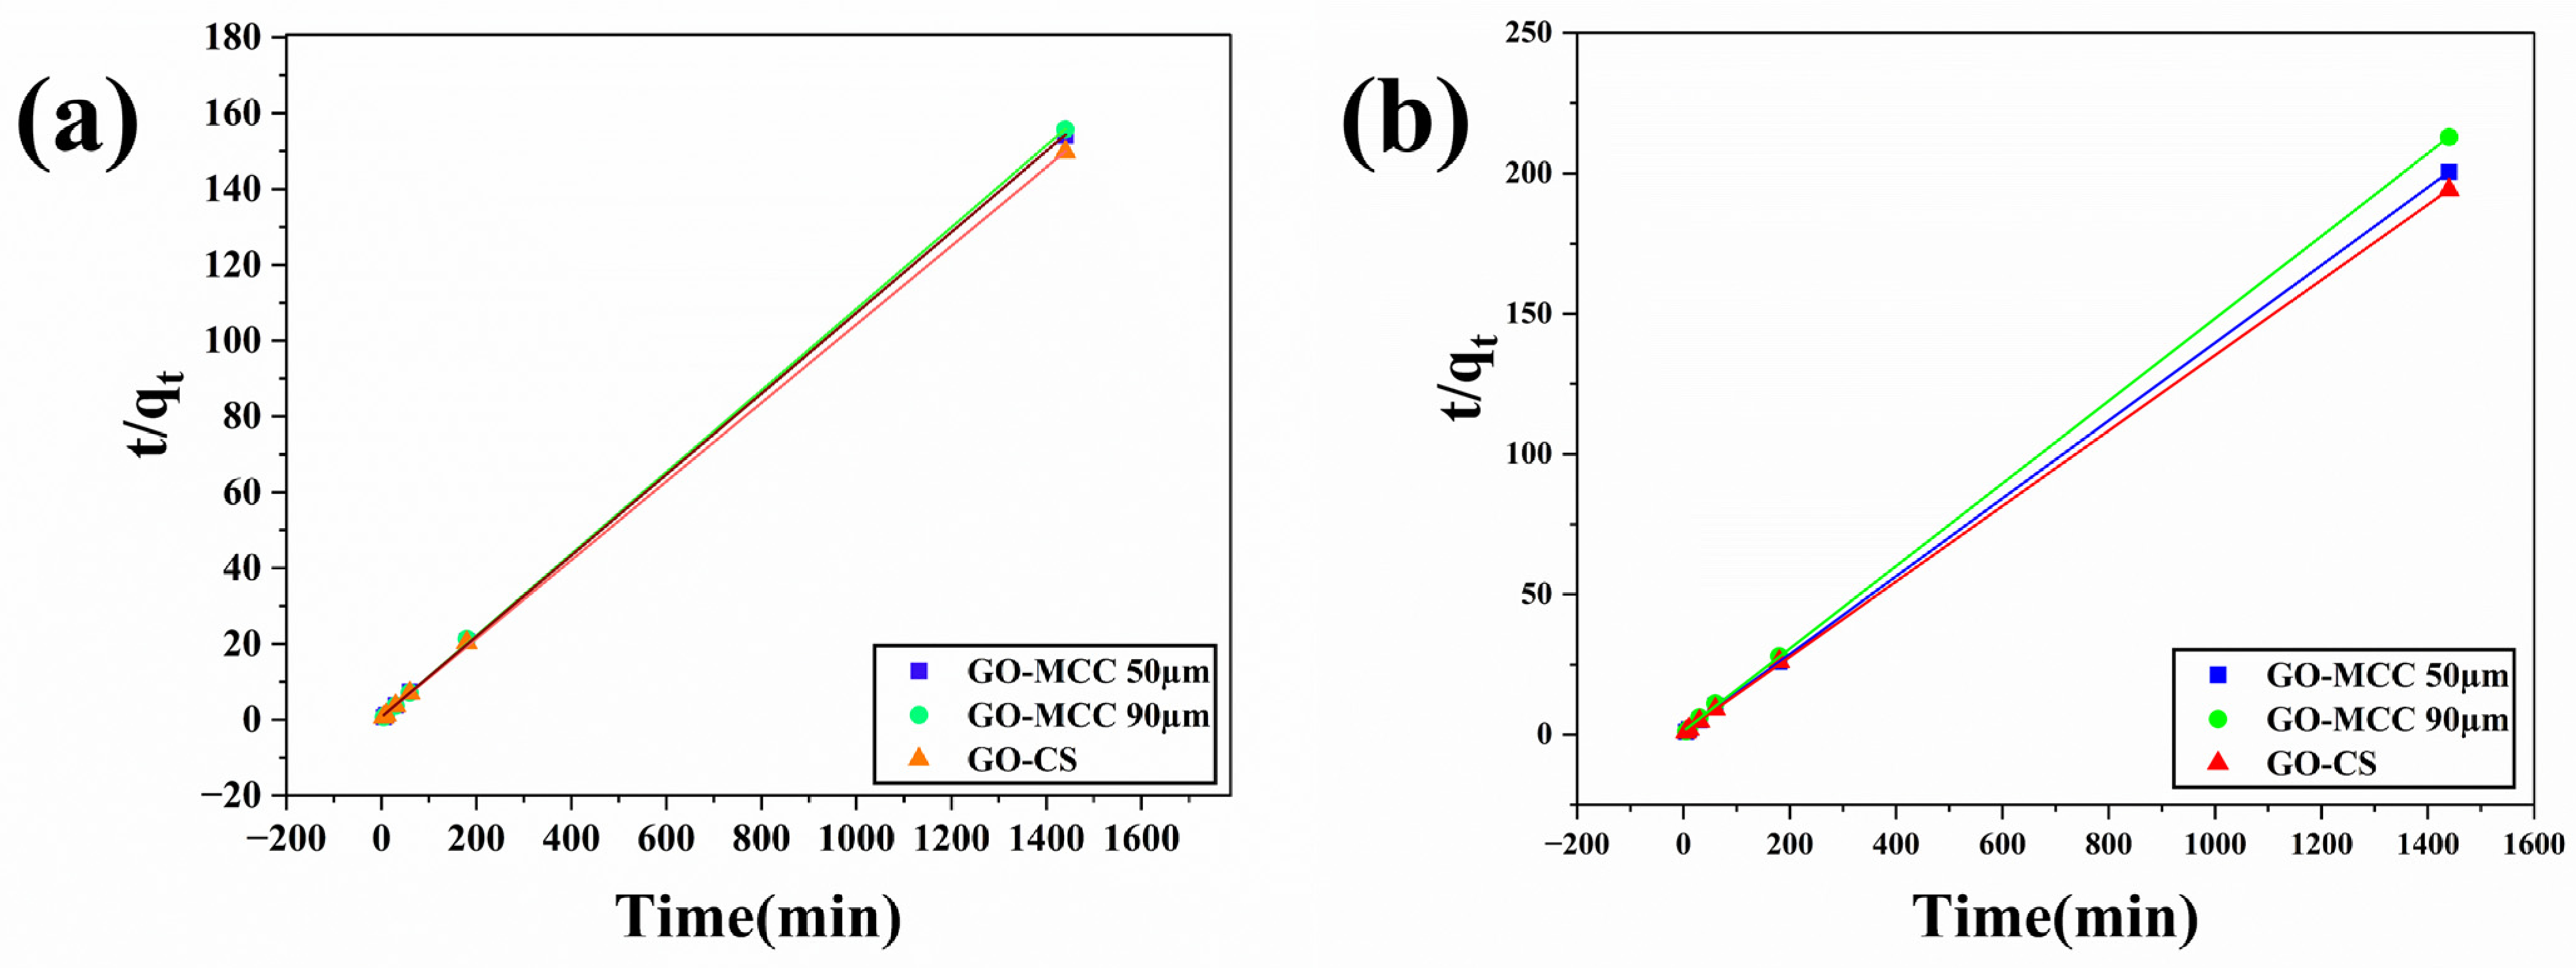
The kinetics data obtained based on the pseudo-first-order (PFO), pseudo-second-order (PSO), and intraparticle diffusion (ID) models are shown in
Table 3. Based on comparison of the correlation coefficients, it was found out that the PSO model better fits the PS–NPs and PET–NPs sorption into the GO–CS, GO–MCC50µm, and GO–MCC90µm composites, yielding correlation coefficient R
2 = 0.99 for all systems under study. On the contrary, the PFO model yielded lower correlation coefficient values ranging from 0.55 to 0.98. The PSO model predicted an adsorption capacity (qt) for PS–NPs adsorption of 9.65, 9.38, and 9.27 mg·g
−1 in the case of GO–CS, GO–MCC50µm, and GO–MCC90µm composites, respectively. Also, for PET–NPs, the predicted adsorption capacity values were 7.44, 7.21, and 6.80 mg·g
−1, correspondingly. Higher values of adsorption capacity observed for PS–NPs than for PET–NPs are confirmed by the experimental data; therefore, it can be said that PS–NPs exhibit better adsorption on GO-based materials. This can be explained by the higher affinity of PS–NPs compared to PET–NPs for GO-based materials. In addition, the correlation coefficients for the intraparticle diffusion model were less than those for the PSO model, with R
2 values between 0.64 and 0.95. In addition, the intercept value (C) was far from zero for all adsorbent types, implying that intraparticle diffusion alone does not control the rate of adsorption. Since the values of C were significantly large, there may have been boundary layer effects, confirming the occurrence of multiple steps such as external surface adsorption followed by intraparticle diffusion. Similarly, the Elovich equation showed high correlation coefficients (R
2 = 0.91–0.97) values, which suggested that surface heterogeneity played an important role in controlling the adsorption. High α values for the PET–NPS adsorption on GO–CS, as well as low values for β (2.01–3.24 g·mg
−1), implied fast initial adsorption owing to available active sites on the surface and gradual site saturation during the course of adsorption, resulting in slow adsorption rates with increasing surface saturation. As the R
2 values of the Elovich equation were smaller than those of the PSO equation, surface heterogeneity did not control the adsorption process. In summary, the kinetic data clearly indicate that the adsorption of both PET–NPs and PS–NPs on GO–C, GO–MCC50µm, and GO–MCC90µm adsorbents was best fitted by the pseudo-second-order model (
Figure 9a,b). Nevertheless, taking into account the weak adsorption energy found using the D-R isotherm model (<8 kJ.mol
−1), it can be concluded that the adsorption process may mostly involve physical interactions including hydrophobic interaction, hydrogen bond formation, van der Waals attraction, and π–π interactions rather than any chemical binding. The higher adsorption capacity for GO–CS and for PS–NPs adsorption implies a significant role of surface functional groups and aromatic interactions during nanoplastic adsorption.
3.8. Thermodynamic Study
The adsorption mechanism and nature can be analyzed by determining the thermodynamic parameters. The following thermodynamic parameters were calculated with help of the Van’t Hoff Equation: Entropy, Free Energy, and Enthalpy [
56]. The thermodynamic parameters indicate the extent of disorderliness of the system, the energy of interaction if it is a standard entropy (ΔS°), spontaneity if it is a standard free energy (ΔG°), and the heat of interaction if it is standard enthalpy (ΔH°) [
51]. The above thermodynamic parameters were calculated using the following Equations (13)–(15):
Here, K
d is the thermodynamic equilibrium constant; C
e (mg·L
−1) is the equilibrium concentration of PET–NPs and PS–NPs; q
e (mg/g) is the adsorption capacity; temperature T in Kelvin, and gas constant R = 8.314 J·K
−1·mol
−1. From the slope of the graph, the value of ΔH° is calculated, whereas the value of ΔS° is calculated from the intercept of the ln K
d vs. 1/T graph. The values of the thermodynamic parameters associated with nanoplastic adsorption on the surfaces of GO–CS, GO–MCC50µm, and GO–MCC90µm composites is summarized in
Table 4. The negative ΔG° values calculated at all temperatures (298–313 K) imply that the adsorption process was spontaneous in all cases [
57]. Nevertheless, the absolute values of ΔG° decreased with increase in temperature, thus signifying a reduction in the favorability of the adsorption process at higher temperatures. Such behavior corresponds well with the negative ΔH° values recorded for GO–CS (−44.21 kJ mol
−1), GO–MCC50µm (−71.74 kJ mol
−1), and GO–MCC90µm (−52.21 kJmol
−1) and suggests that the process under consideration was exothermic [
58]. In addition, the negative ΔS° values denote a reduction in the entropy of the system due to the ordered arrangement of nanoplastics at the solid–liquid interface [
42]. Of the three materials considered, the strongest interactions between the adsorbate and adsorbent were achieved using the GO–MCC50µm composite with the most negative value of ΔH°. Based on the values of ΔG° close to zero (from −3 to −7 kJmol
−1), the adsorption process should be mainly physical in nature.
Table 5 contains the thermodynamic parameters calculated for PET–NPs adsorption onto GO–CS, GO–MCC50µm, and GO–MCC90µm adsorbents. All negative values of ΔG° obtained in the studied temperature range (298–313 K) prove the spontaneous nature of PET–NP adsorption on the surfaces of all used adsorbents. With increase in temperature, the magnitude of ΔG° decreased slightly. The same tendency is observed in the negative values of enthalpy changes (ΔH°) found to be equal to −9.13, −2.88, and −7.21 kJmol
−1 for GO–CS, GO–MCC50µm, and GO–MCC90µm composites, respectively, proving the exothermic nature of PET–NPs adsorption. Furthermore, negative values of entropy change (ΔS°) indicate the lower randomness at the solid–solution interface during PET–NPs adsorption. Therefore, the obtained results show the increased orderliness of the system during the process under study. It should be mentioned that among all the adsorbents examined, GO–CS shows the best thermodynamic parameters of PET–NPs adsorption, since it demonstrates the most negative values of both ΔG° and ΔH°. Moreover, taking into account the relatively low magnitude of both parameters (in absolute value), the adsorption process can be assumed to proceed mainly due to physical forces (hydrophobic forces, van der Waals forces, hydrogen bonds).
In general, from a thermodynamic perspective, it appears that both PET–NPs and PS–NPs adsorption processes on the graphene oxide-based materials were spontaneous and exothermic. Based on the negative entropy values, it is clear that there was a higher level of ordering of nanoplastics when adsorbed onto the solid surfaces. Moreover, it is evident that the low thermodynamic constants show that physical interactions dominated the adsorption process.
4. Discussion
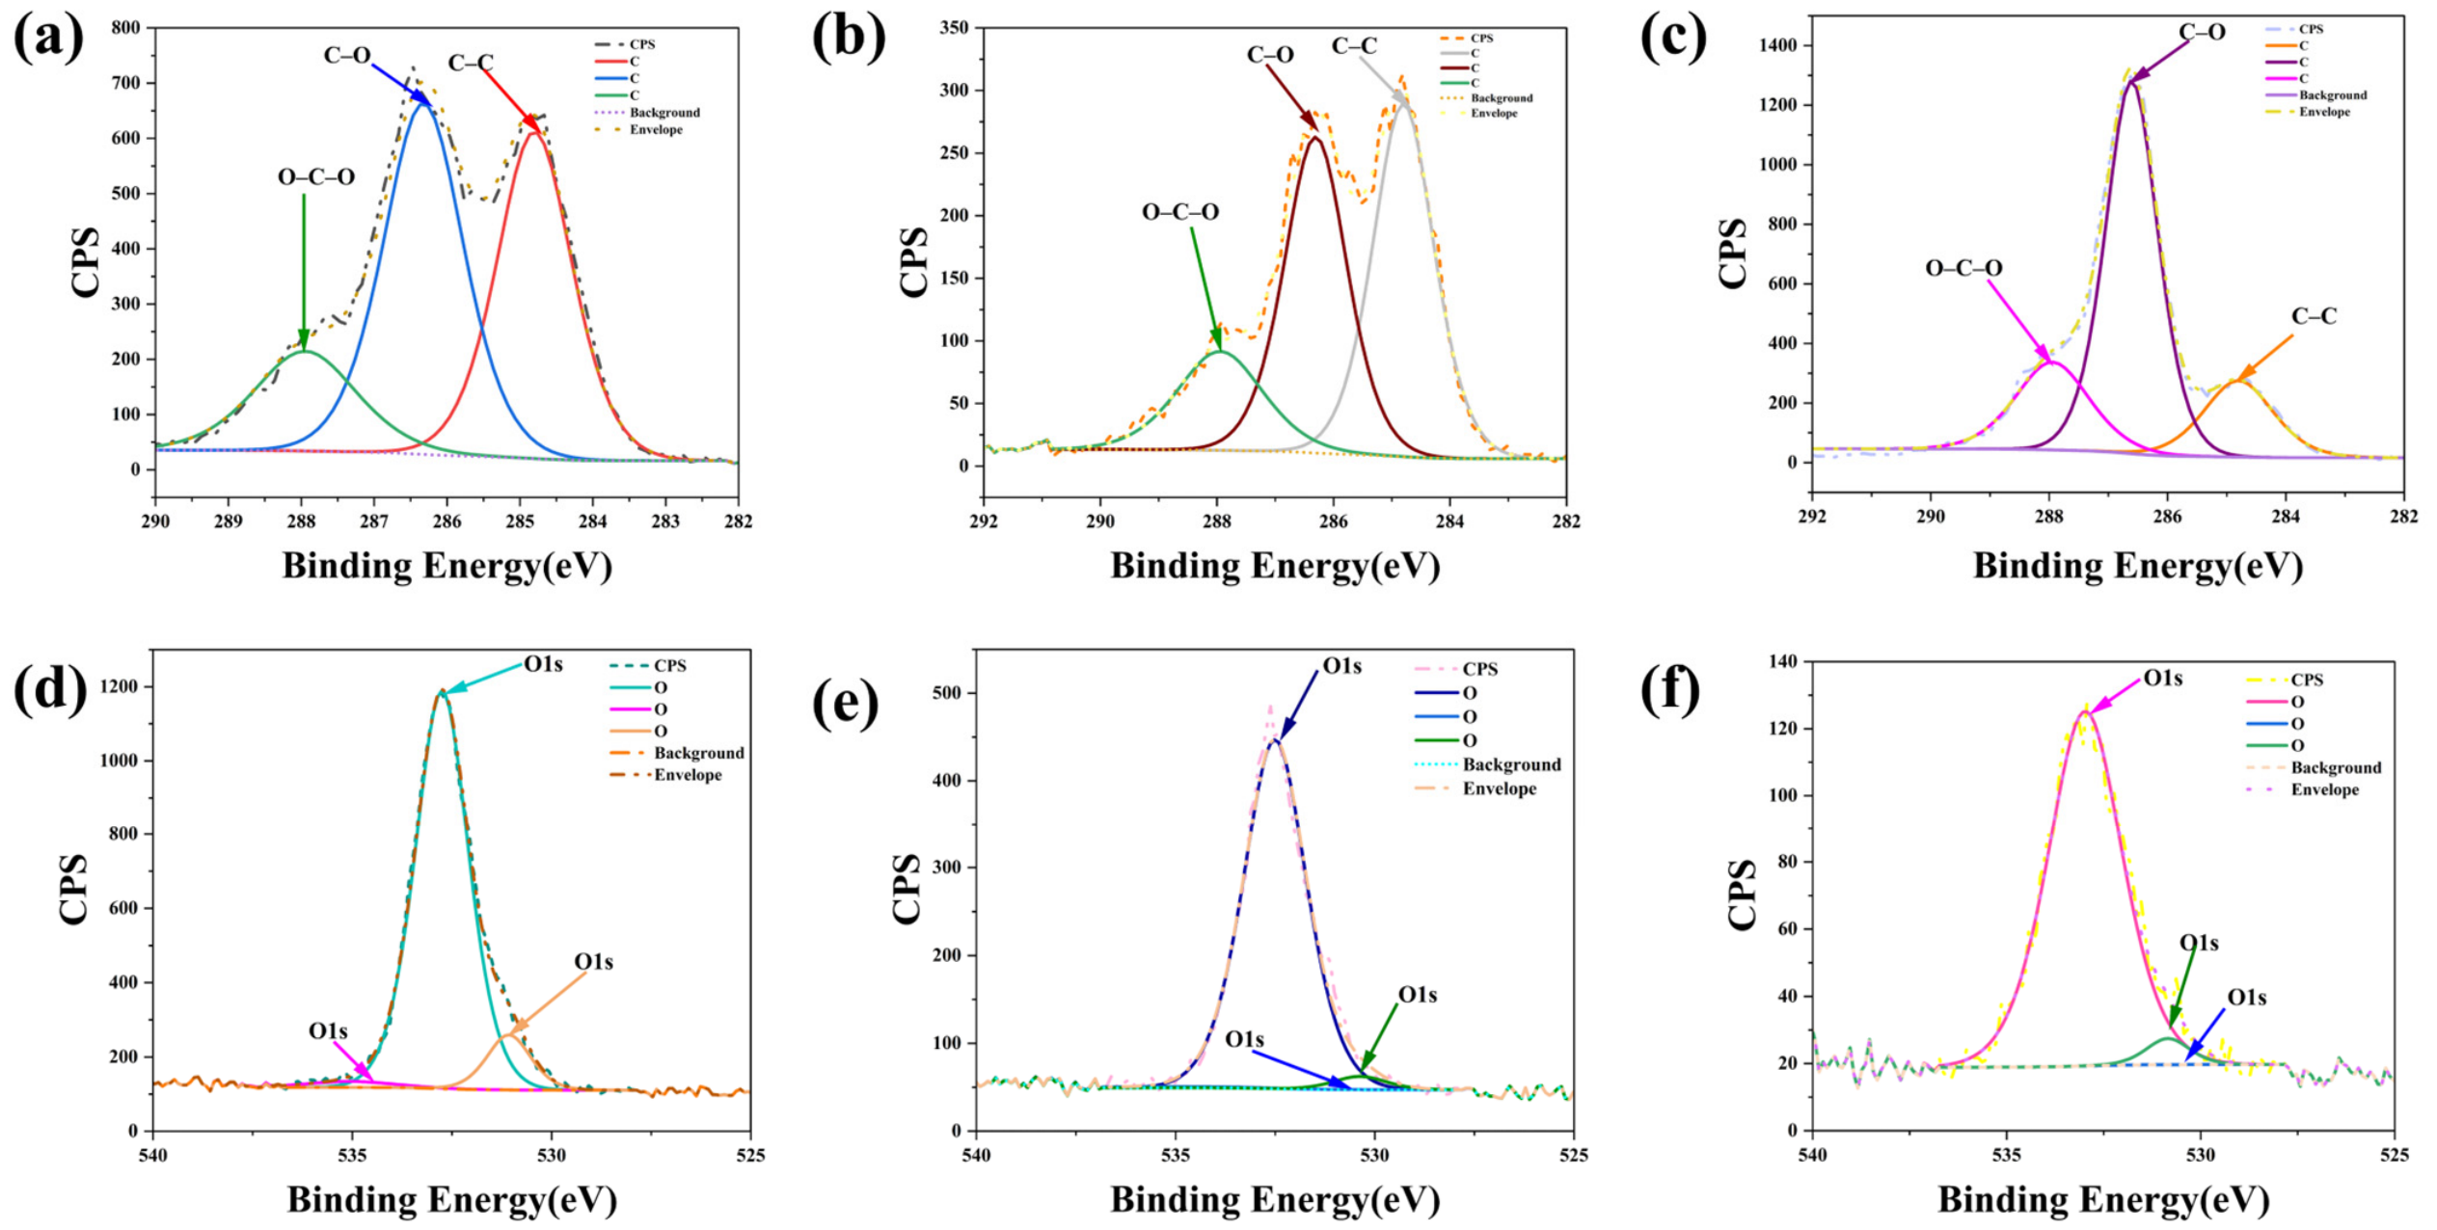
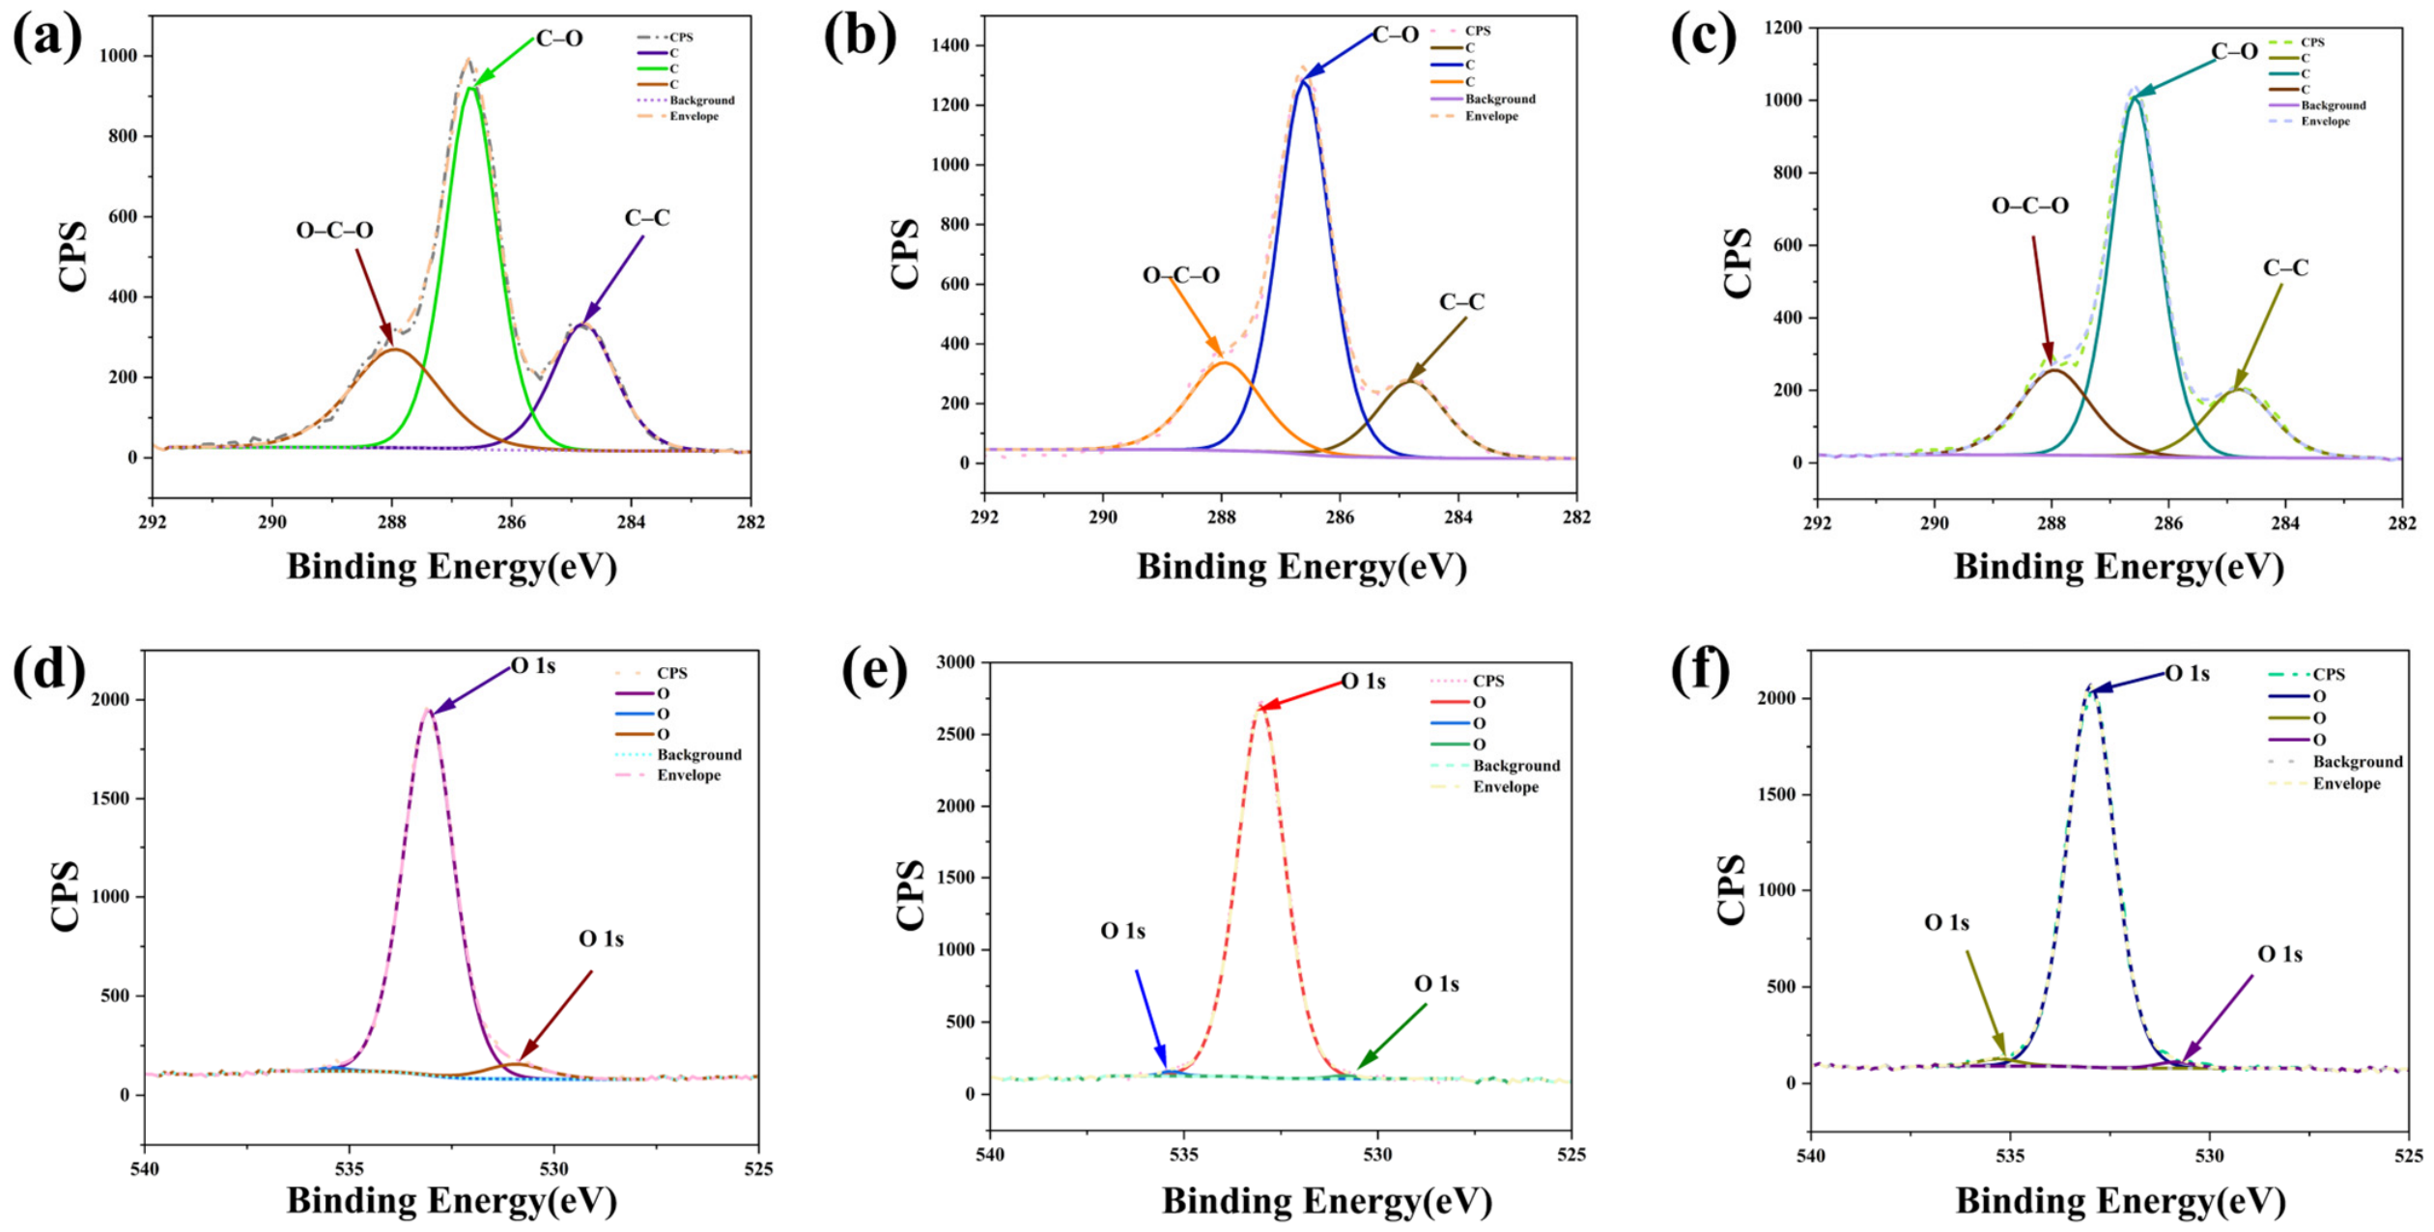
High-resolution XPS spectra show that the surface chemical environments of GO–CS, GO–MCC50µm, and GO–MCC90µm are altered after adsorption of PET–NPs and PS–NPs. The C 1s spectra for GO–CS (
Figure 10a) shows a strong component at about 284.8 eV attributed to C–C/C=C, as well as components at approximately 286.2–286.6 eV and 288.3–288.8 eV belonging to C–O/C–N and C=O/O–C–O environments, respectively. These contributions are derived from GO’s graphitic domains as well as chitosan’s hydroxyl, amino, carbonyl, and carboxylic functionalities. The accompanying O 1s spectrum (
Figure 10d) supports the presence of carbonyl/carboxyl oxygen and C–O/OH species [
59].
Changes occur during PET–NPs adsorption (
Figure 10b,e), particularly in the oxygen-containing C 1s and O 1s components. Because PET contains repeated ester groups, –O–C(=O)–, changes in the C–O and C=O/O–C–O environments suggest that adsorption affects the electronic environment of hydroxyl, carboxyl, and amino functionalities on GO–CS. These modifications correspond to interactions between PET–NPs ester groups and the composite’s polar locations. In contrast, after PS–NPs adsorption (
Figure 10c,f), the primary spectrum reaction occurs in the carbon-rich C–C/C=C region, while changes in the oxygen-containing components are less evident. This distinction reflects PS’s mainly hydrocarbon and aromatic nature, as well as the increased involvement of GO’s graphitic carbon domains in PS adsorption [
60].
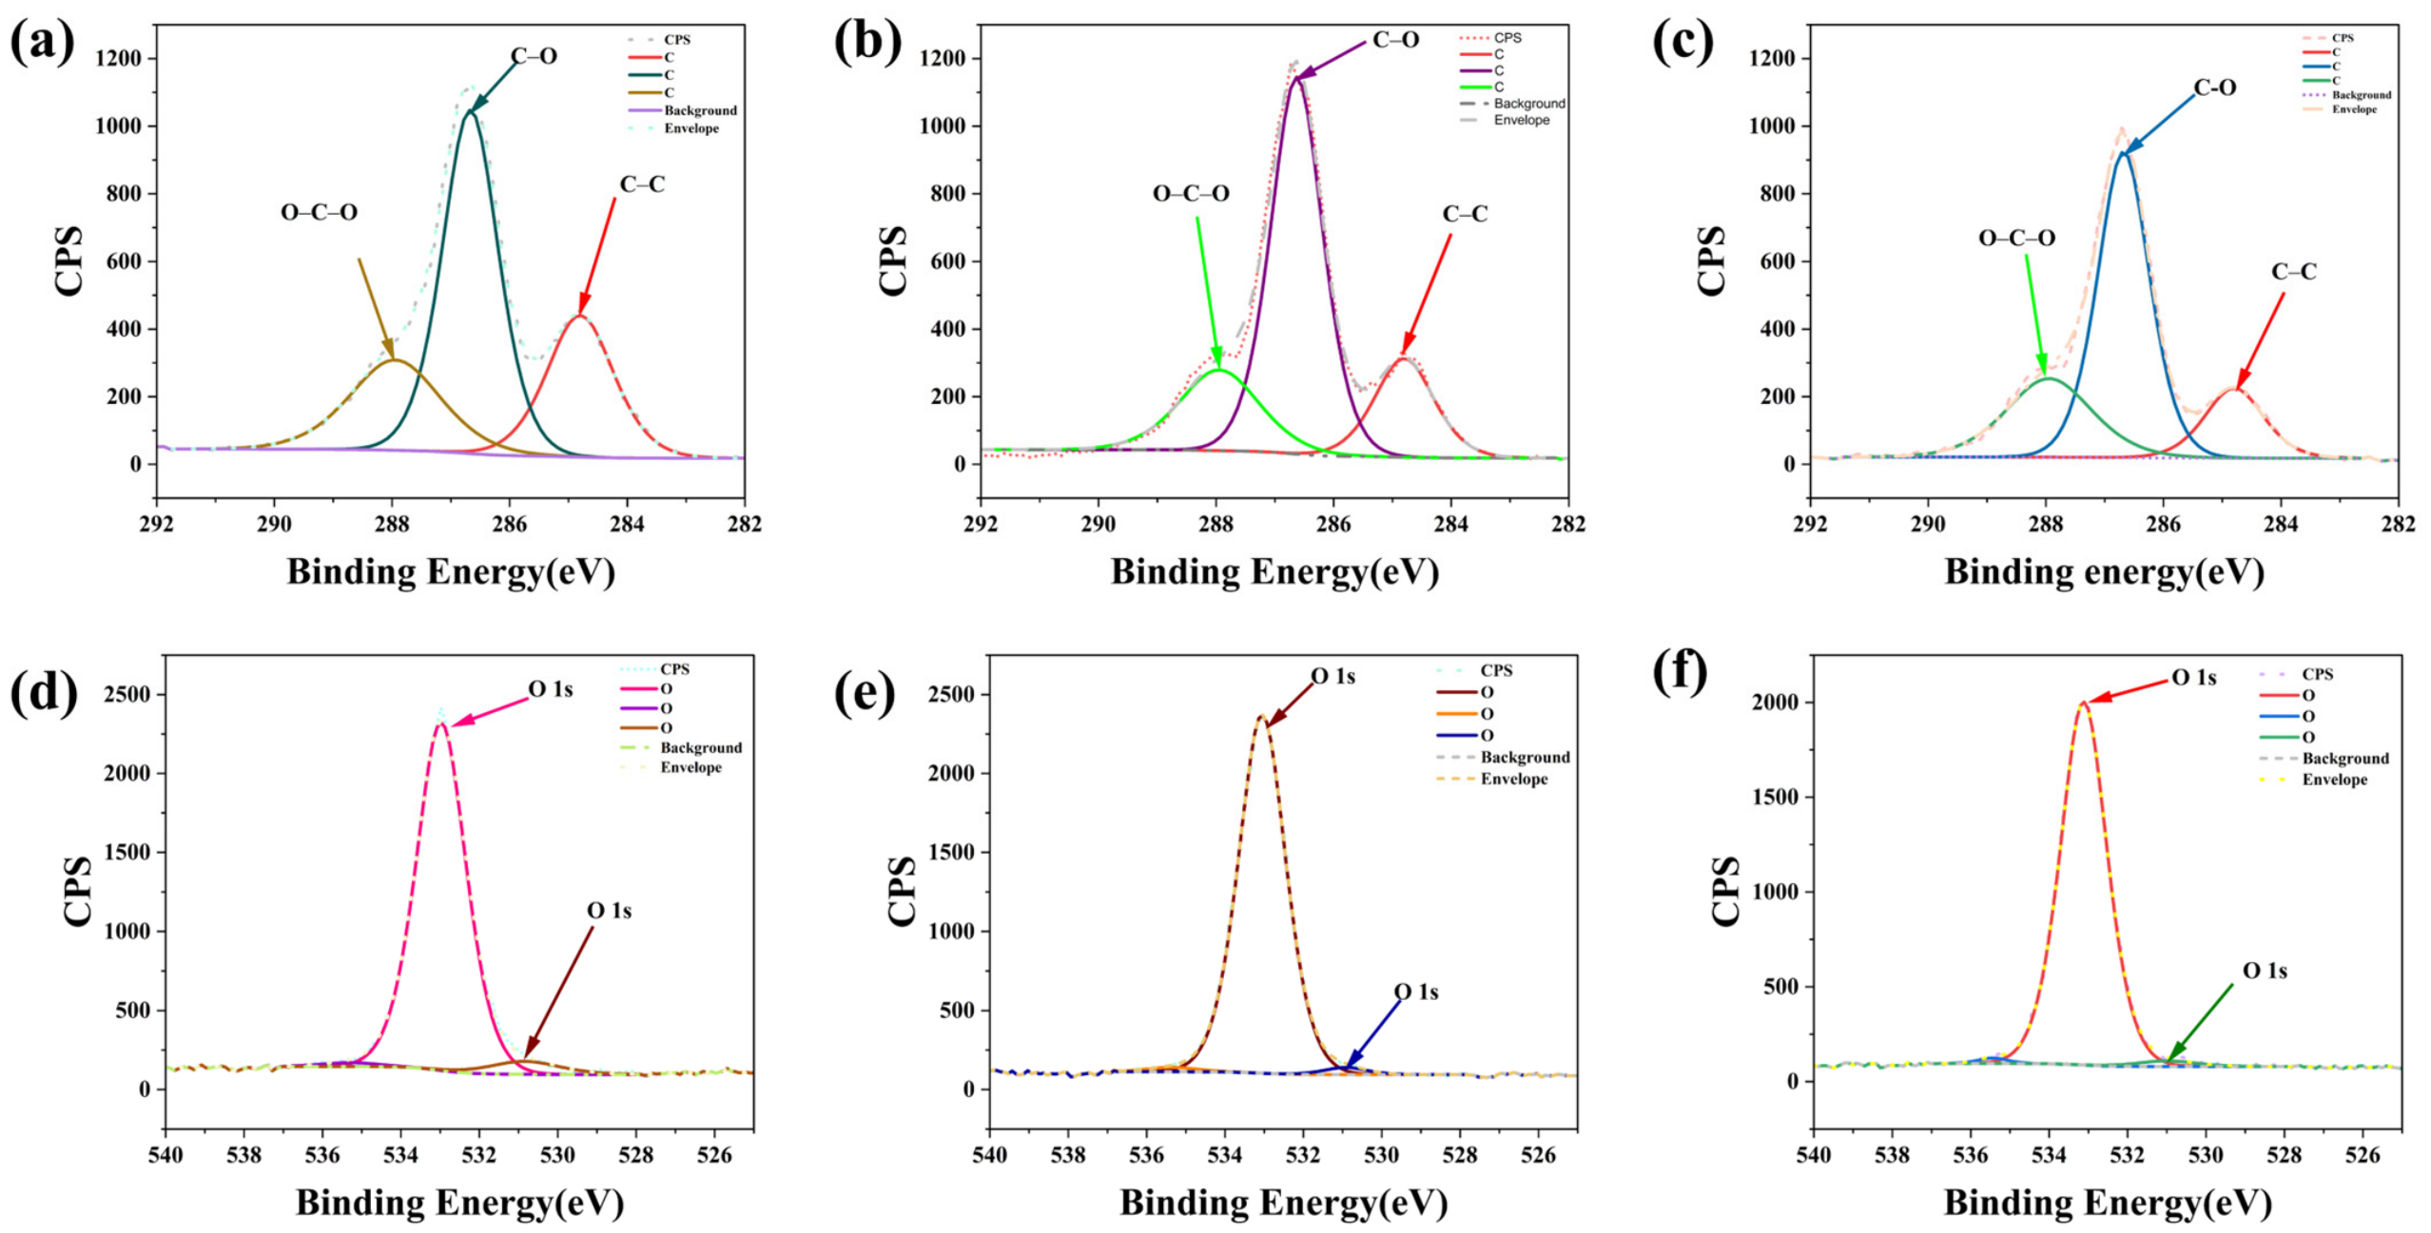
Figure 11a,d depicts a similar polymer-dependent response for GO–MCC50µm. This composite has C–C/C=C, C–O, and O–C–O/C=O components, with a significant C–O contribution from the hydroxyl- and ether-rich cellulose structure, as well as the oxygenated functions of GO. Changes in both C 1s and O 1s spectra are most noticeable in the C–O and O–C–O/C=O environments following PET–NPs adsorption (
Figure 11b,e). The ester functionality of PET–NPs enables binding to surface groups on GO–MCC50µm, including –OH, C–O–C, carbonyl, and carboxyl. As a result, PET–NPs cause more significant disturbance of the oxygen-containing surface environment.
Following PS–NPs adsorption (
Figure 11c,f), change is more closely related with the C–C/C=C region, whereas oxygen-containing components are less substantially altered. PS’s interaction with GO–MCC50µm is more strongly related to the carbon-rich and aromatic domains, as it lacks polar oxygen-containing groups and instead has pendant phenyl rings along a hydrocarbon backbone [
60]. Thus, while both polymers modify the composite surface, PET–NPs predominantly influence oxygen-containing chemical environments, whereas PS–NPs cause a response reminiscent of interactions with the material’s aromatic/graphitic fractions.
Figure 12a,d display the XPS spectra of GO–MCC90µm, revealing the same chemical difference. Before adsorption, the C 1s spectrum contains components attributable to C–C/C=C at approximately 284.8 eV, C–O at about 286.2–286.6 eV, and C=O/O–C=O at approximately 288.0–288.8 eV, whereas the O 1s spectrum is dominated by oxygen-containing functionalities characteristic of cellulose and GO. Following PET–NP adsorption (
Figure 12b,e), the relative contributions of C–O and C=O/O=O shift, as does the O 1s profile. Such alterations are consistent with the ester-containing PET–NPs surface perturbing the local electrical environment around its hydroxyl, ether, carbonyl, and carboxyl groups.
PS NPs adsorption, on the other hand (
Figure 12c,f), keeps a strong C–C/C=C character while producing relatively little modification in the oxygen-containing area. Following PS–NPs adsorption, no large new oxygen-containing XPS component is formed. Taken together, the spectra of the three composites show that PET–NPs and PS–NPs interact differently with the same GO-based surfaces: PET–NPs produces a relatively stronger modification of oxygen-containing environments, whereas PS–NPs adsorption is more strongly reflected in carbon-rich and aromatic environments [
61]. Importantly, these spectrum alterations suggest modifications to existing chemical environments rather than the development of new covalent surface functions.
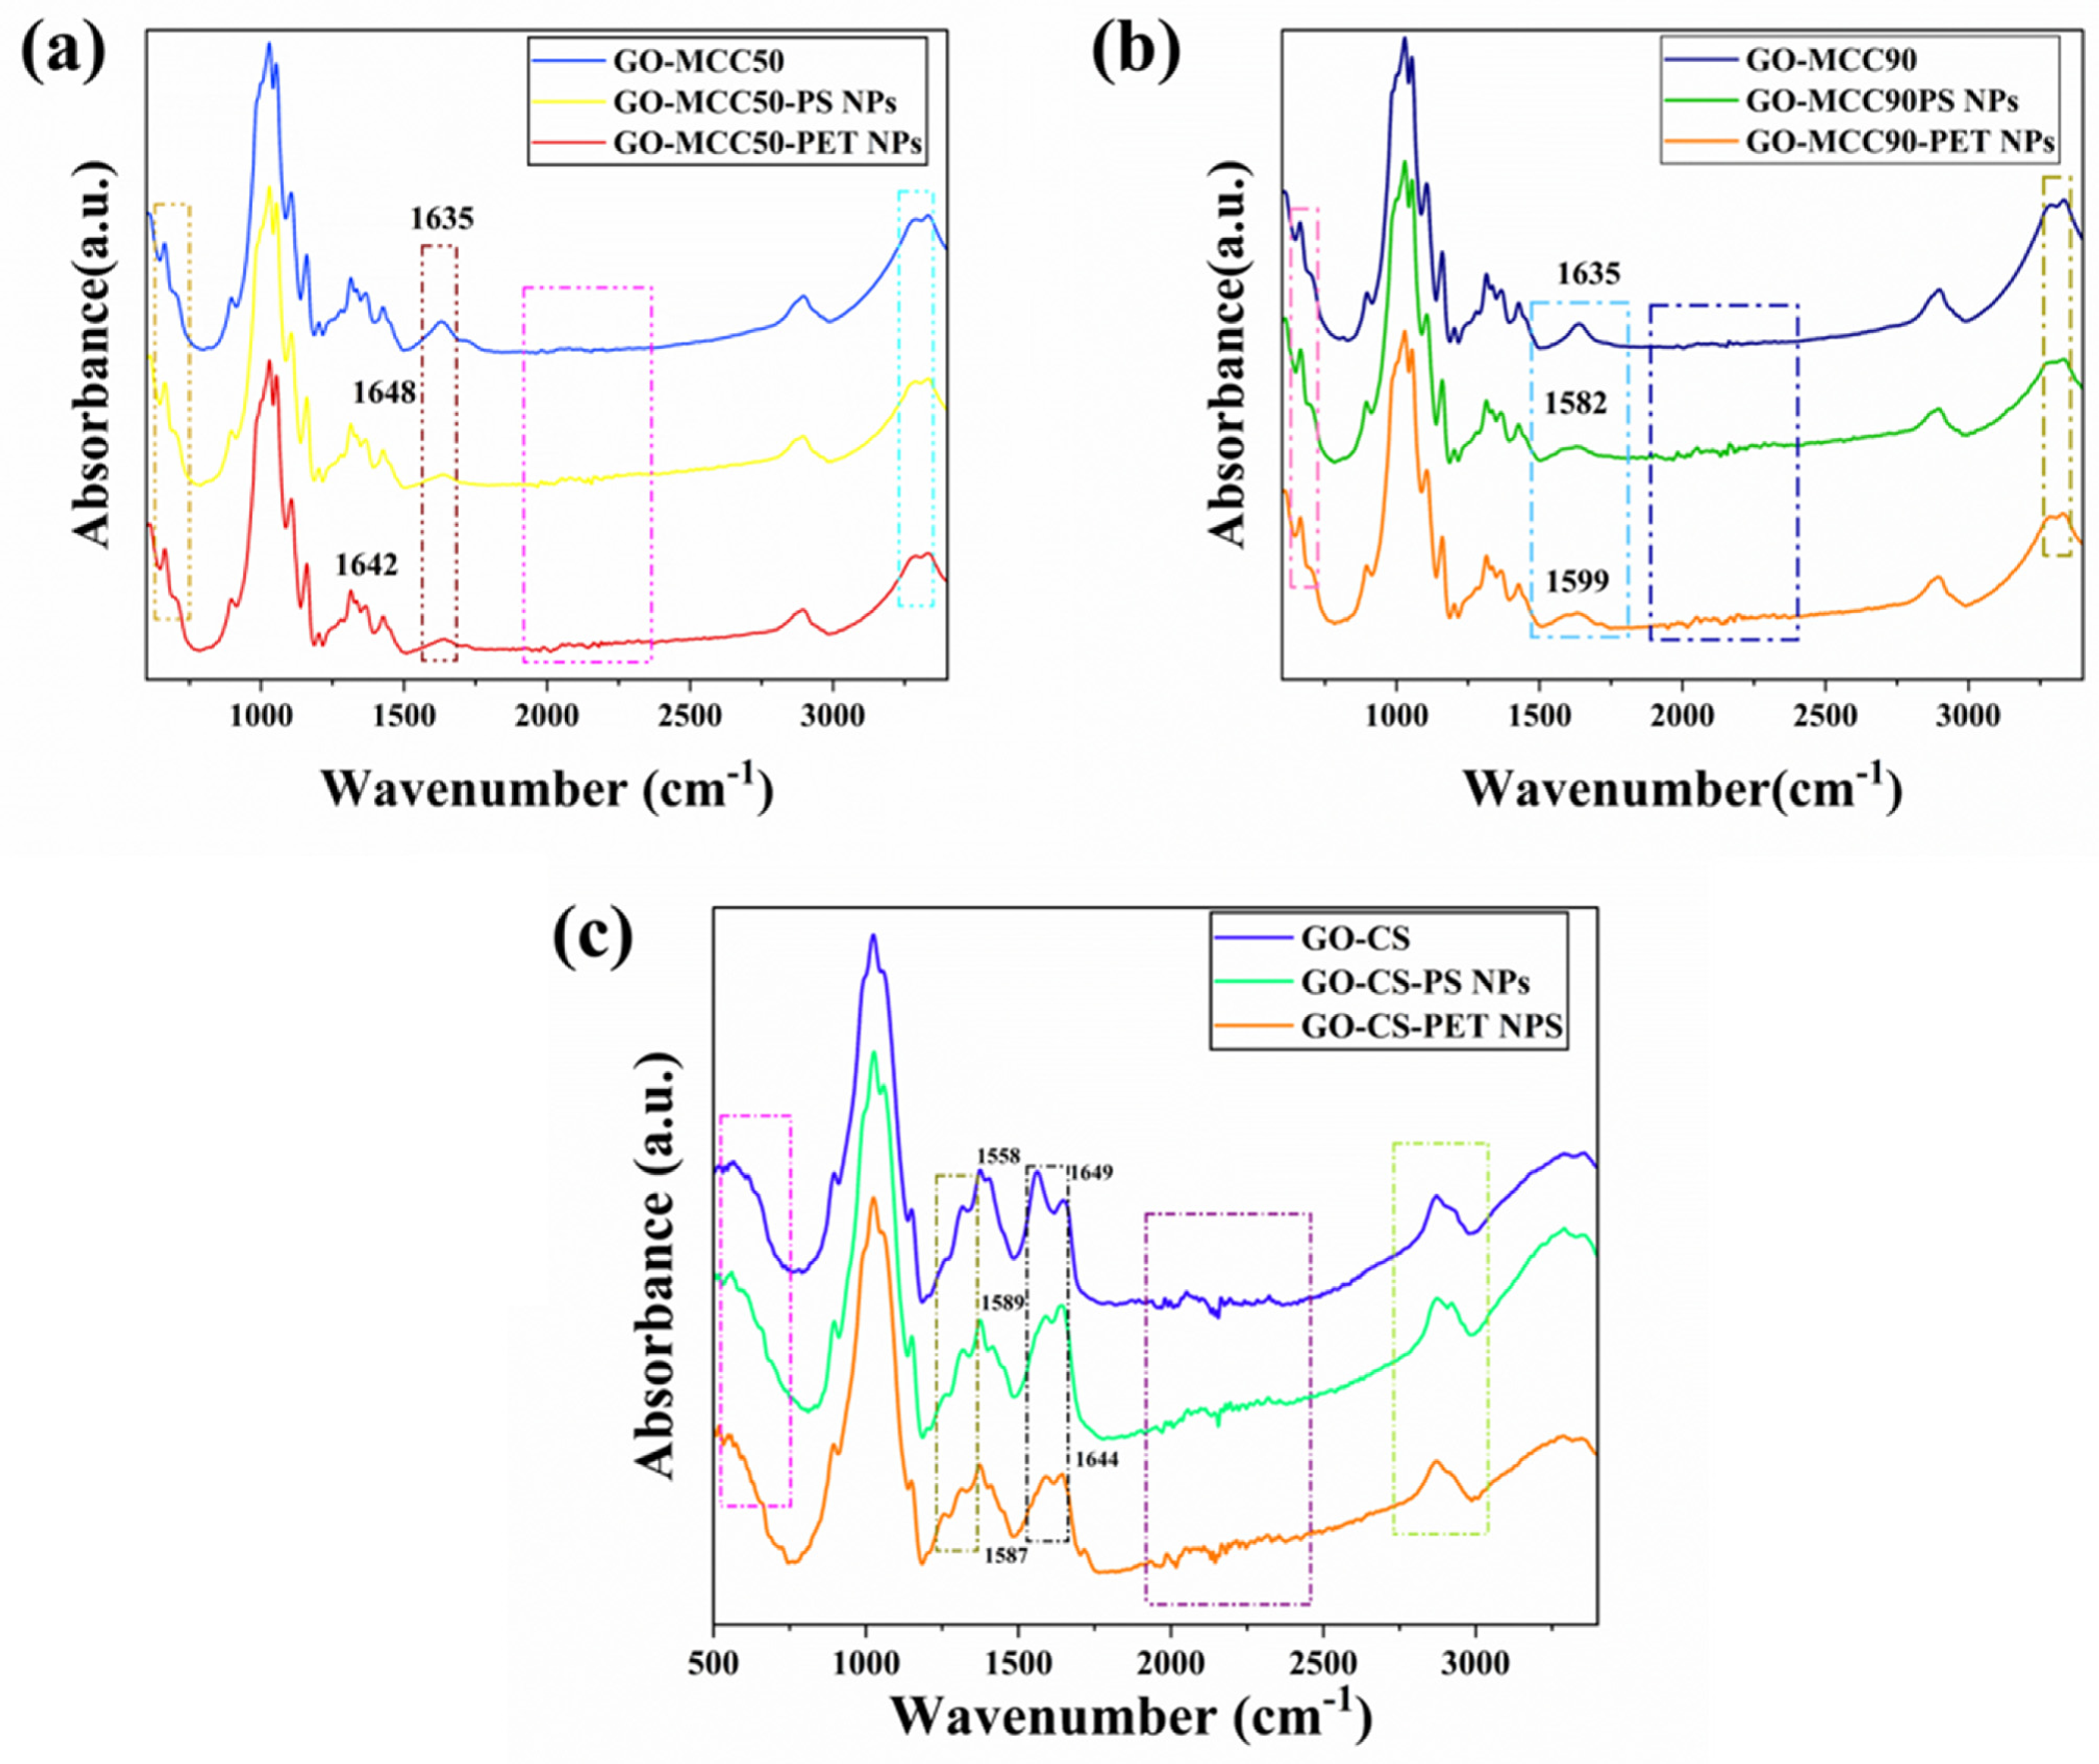
FTIR observations for GO–MCC50µm, GO–MCC90µm, and GO–CS support the XPS interpretation. After adsorption, decreases in intensity and slight shifts of the broad O–H band, together with changes in C=O and C–O–C bands, indicate participation of the hydroxyl and oxygen-containing groups of GO–MCC50µm, GO–MCC90µm, and GO–CS (
Figure 13a,
Figure 13b, and
Figure 13c, respectively) [
62]. For GO–CS (
Figure 13c), variations in N–H and amide-related bands additionally suggest involvement of amino groups. Changes associated with carbonyl and oxygen-containing groups were more evident for PET–NPs, consistent with interactions involving PET ester groups [
60], whereas PS–NP adsorption was more strongly associated with hydroxyl-containing and aromatic regions [
61]. Importantly, no new FT–IR bands appeared after adsorption, indicating that the basic chemical structures of the composites remained unchanged.
Considering the XPS and FTIR results together, adsorption can therefore be interpreted as a combination of non-covalent interactions whose relative contribution depends on the molecular structure of the nanoplastic and the chemistry of the adsorbent surface. In the case of PET, each repeating unit contains a relatively polar ester linkage, –C(=O)–O–, together with an aromatic ring. At the molecular level, the carbonyl oxygen of the PET ester can act as a hydrogen-bond acceptor toward hydroxyl groups located on GO and cellulose and toward –OH and –NH/–NH2 groups associated with chitosan. Thus, an interaction of the type, surface –OH···O=C–PET is chemically reasonable. The ester single-bond oxygen may also act as a hydrogen-bond acceptor, giving interactions of the type, surface –OH···O–C(=O)–PET. On GO–CS, N–H groups can similarly act as hydrogen-bond donors toward the PET carbonyl oxygen. Formation of these interactions changes the electron density and vibrational environment of both the adsorbent oxygen-containing groups and the PET ester functionality, explaining why alterations are detected in the C–O, C=O/O–C–O, O 1s, O–H, and amide-related spectral regions without the appearance of new chemical bonds.
The XPS and FT–IR data together reveal a polymer-dependent, non-covalent adsorption mechanism. PET–NPs can form hydrogen bonds and dipole–dipole interactions through their ester groups, and their aromatic units can interact with GO’s sp2 domains via π–π interactions.
Adsorption of PS–NPs, which lack polar ester groups, is likely to be more dependent on interactions involving the aromatic and hydrocarbon structures. PS’s phenyl rings connect with graphitic sp2 domains of GO via π–π interactions, whereas intimate contact between the nonpolar PS surface and carbon-rich regions of GO promotes hydrophobic association and van der Waals forces. PET–NPs adsorption relies more on hydrogen bonding and dipolar contacts, while PS–NPs rely more on π–π, hydrophobic, and van der Waals interactions.
Surface chemistry has an additional impact on these interactions. The extra amino groups in GO–CS provide hydrogen bonding and, depending on protonation, electrostatic interaction sites, whereas hydroxyl-rich GO–MCC composites provide polar interaction sites in conjunction with GO’s graphitic domains. Differences in pH-dependent surface charge might thus influence electrostatic attraction or repulsion without affecting other intermolecular forces. The kinetic and equilibrium results lend support to this multi-interaction mechanism: nonzero intraparticle-diffusion intercepts indicate contributions from both boundary-layer transport and intraparticle diffusion, while the relatively low D–R adsorption energies indicate a significant contribution from weak intermolecular interactions. Adsorption occurs as a result of PET–NPs and PS–NPs being transported to accessible composite surfaces, interfacial attachment via complementary non-covalent interactions, and subsequent diffusion into accessible porous regions.
5. Conclusions
In this research work, it is shown that the adsorption process of nanoplastics from PET–NPs and PS–NPs by graphene oxide-polysaccharide composites is determined by the synergistic effect of physical and chemical parameters of the nanoplastics, adsorbent surface chemistry, and solution conditions. PET–NPs and PS–NPs were successfully obtained through the nanoprecipitation technique without affecting the distinct chemical composition of the polymers. The presence of sub-micrometric primary particles was established using TEM, while larger hydrodynamic diameter values were observed using DLS.
The pH-dependent adsorption behavior of the nanoplastics and composites was consistent with their respective zero charge points. PET–NPs and PS–NPs had pHpzc values of 4.83 and 4.91, compared to 6.50 for GO–CS, 3.30 for GO–MCC50µm, and 3.04 for GO–MCC90µm. As a result, optimum adsorption occurred at pH 6 for GO–CS and pH 4 for GO–MCC composites, revealing that surface charge controls adsorption although non-electrostatic interactions remain essential.
Equilibrium modeling revealed that both nanoplastics adsorb well onto all three composites. PS–NPs had exceptionally low RL values of 0.02–0.16, whereas PET–NPs had values of 0.23–0.88. The Freundlich model offered the best overall description of PET–NP adsorption (R2 = 0.996–0.999), highlighting the importance of heterogeneous adsorption sites, whereas the Langmuir and Freundlich models properly reflected PS–NP adsorption, depending on the composite. On GO–CS, GO–MCC50µm, and GO–MCC90µm, PS–NPs had Langmuir maximum capacities of 13.60, 12.59, and 11.19 mg·g−1, while PET–NPs had capacities of 56.17, 33.33, and 23.20 mg·g−1. For all adsorption interactions, the pseudo-second-order model (R2 = 0.99) provided the best description of the kinetics. However, the non-zero intercepts produced from the intraparticle-diffusion model revealed that intraparticle diffusion was not the only rate-controlling process, with contributions from external mass transfer, surface adsorption, and subsequent diffusion. The adsorption of PET–NPs and PS–NPs was spontaneous (ΔG° < 0) and exothermic (ΔH° < 0), with adsorption favorability decreasing with temperature. Negative ΔS° values suggest more ordered nanoplastic particles at the solid–liquid interface.
Finally, XPS and FT–IR were used to correlate macroscopic adsorption patterns with the chemistry of the adsorbent–nanoplastic interface. These observations, along with the equilibrium, kinetic, pH-dependent, and thermodynamic results, support a predominantly non-covalent adsorption mechanism involving hydrogen bonding, π–π interactions, hydrophobic association, van der Waals forces, and pH-dependent electrostatic interactions. The typically stronger removal of PS–NPs, as well as the differences observed between GO–CS and the two GO–MCC composites, show that adsorption affinity is influenced by both polymer chemistry and adsorbent composition. In several experimental circumstances, GO–MCC50µm outperformed GO–MCC90µm, indicating that the size of the cellulose-based adsorbent affects adsorption site accessibility. Overall, a direct comparison of PET–NPs and PS–NPs on the same GO–polysaccharide platform indicates that nanoplastic removal cannot be determined only by adsorption capacity or particle size; rather, polymer chemistry, aggregation state, surface charge, and adsorbent functionality all influence adsorption behavior. These findings give support to GO–CS and GO–MCC composites as promising nanoplastic removal materials, as well as a mechanistic basis for developing adsorbents for chemically varied nanoplastics in aqueous environments. These findings highlight the potential of GO–polysaccharide composites for nanoplastic removal; however, their practical applicability should be further evaluated at environmentally relevant nanoplastic concentrations and in complex aqueous matrices containing dissolved organic matter and varying ionic strengths. Future studies should also include control experiments with the individual composite components to clarify their respective contributions, together with adsorption–desorption and regeneration studies to establish material reusability, stability, and long-term performance under realistic water-treatment conditions. These findings highlight the potential of GO–polysaccharide composites for nanoplastic removal; however, their practical applicability should be further evaluated at environmentally relevant nanoplastic concentrations and in complex aqueous matrices containing dissolved organic matter and varying ionic strengths. Future studies should also include control experiments with the individual composite components to clarify their respective contributions, together with adsorption–desorption and regeneration studies to establish material reusability, stability, and long-term performance under realistic water-treatment conditions.




 ,
,