Article

Comparative Evaluation of Mesophilic and Thermophilic Anaerobic Digestion for Microbrewery Waste Streams: Process Integration, Internal Neutralization, and CO2 Scrubbing


1
Department of Environmental Science, Zhejiang University, Hangzhou 310058, China
2
Department of Agricultural and Biological Engineering, University of Florida, Gainesville, FL 32611, USA
3
Innovation Center of Yangtze River Delta, Zhejiang University, Jiaxing 314100, China
4
Institute of Zhejiang University-Quzhou, Quzhou 324000, China
*
Author to whom correspondence should be addressed.
Clean Technol. 2026, 8(2), 47; https://doi.org/10.3390/cleantechnol8020047
Submission received: 23 January 2026 / Revised: 5 March 2026 / Accepted: 19 March 2026 / Published: 1 April 2026

Highlights

What are the main findings?
  • Microbreweries generate alkaline cleaning-in-place wash water (pH about 12) that can be used to effectively neutralize acidic organic waste blends (pH about 4.16) to a stable pH of 7 prior to anaerobic digestion. The surplus wash water serves as a highly efficient, in situ carbon dioxide scrubber to upgrade biogas from anaerobic digestion to 100% methane content on a dry basis.
  • Organic waste streams produced in a microbrewery can be efficiently biogasified in an anerobic digester operating at mesophilic temperature (38 °C), producing 500 mL of methane/g VS. However, the presence of hops in the organic waste stream inhibits anaerobic digestion at thermophilic temperature (55 °C).
What are the implications of main findings?
  • Enhanced Energy Independence: Mesophilic anaerobic digestion of the neutralized waste blend produces enough renewable energy to offset up to 20% of a facility’s fossil fuel requirements for process heat.
  • Circular Bioeconomy and Waste Valorization: The integrated approach enables a “zero-waste” closed-loop model that eliminates external chemical additives and diverts high-strength organic wastes and corrosive cleaning fluids from municipal sewers, significantly reducing the environmental footprint and operational costs of microbrewing.

Abstract

This study explores a circular bioeconomy strategy for microbrewery waste by characterizing and valorizing its primary waste streams: sugar mash water (A), spent yeast with hops (B), spent yeast without hops (C), and alkaline cleaning wastewater (D). The biochemical methane potential of the acidic organic blend (E, from A-C) was assessed under mesophilic (38 °C) and thermophilic (55 °C) conditions, revealing significant substrate-specific temperature sensitivity. The highly acidic blend E (pH 4.16) was effectively neutralized to pH 7.0 using the on-site alkaline wash water (D, pH 12.03). Mesophilic anaerobic digestion of the neutralized blend achieved a high methane yield of approximately 500 mL/g VS. Furthermore, the alkaline wash water successfully served as an in situ CO2 scrubber, upgrading biogas to ~100% methane content. This integrated approach demonstrates a viable, closed-loop pathway for microbreweries to achieve simultaneous energy recovery from organic wastes and chemical-free treatment of acidic and alkaline effluents. The findings also highlight the importance of substrate-specific thermal management and provide a robust framework for microbreweries to achieve energy independence and internal CO2 neutralization–wastewater treatment.

1. Introduction

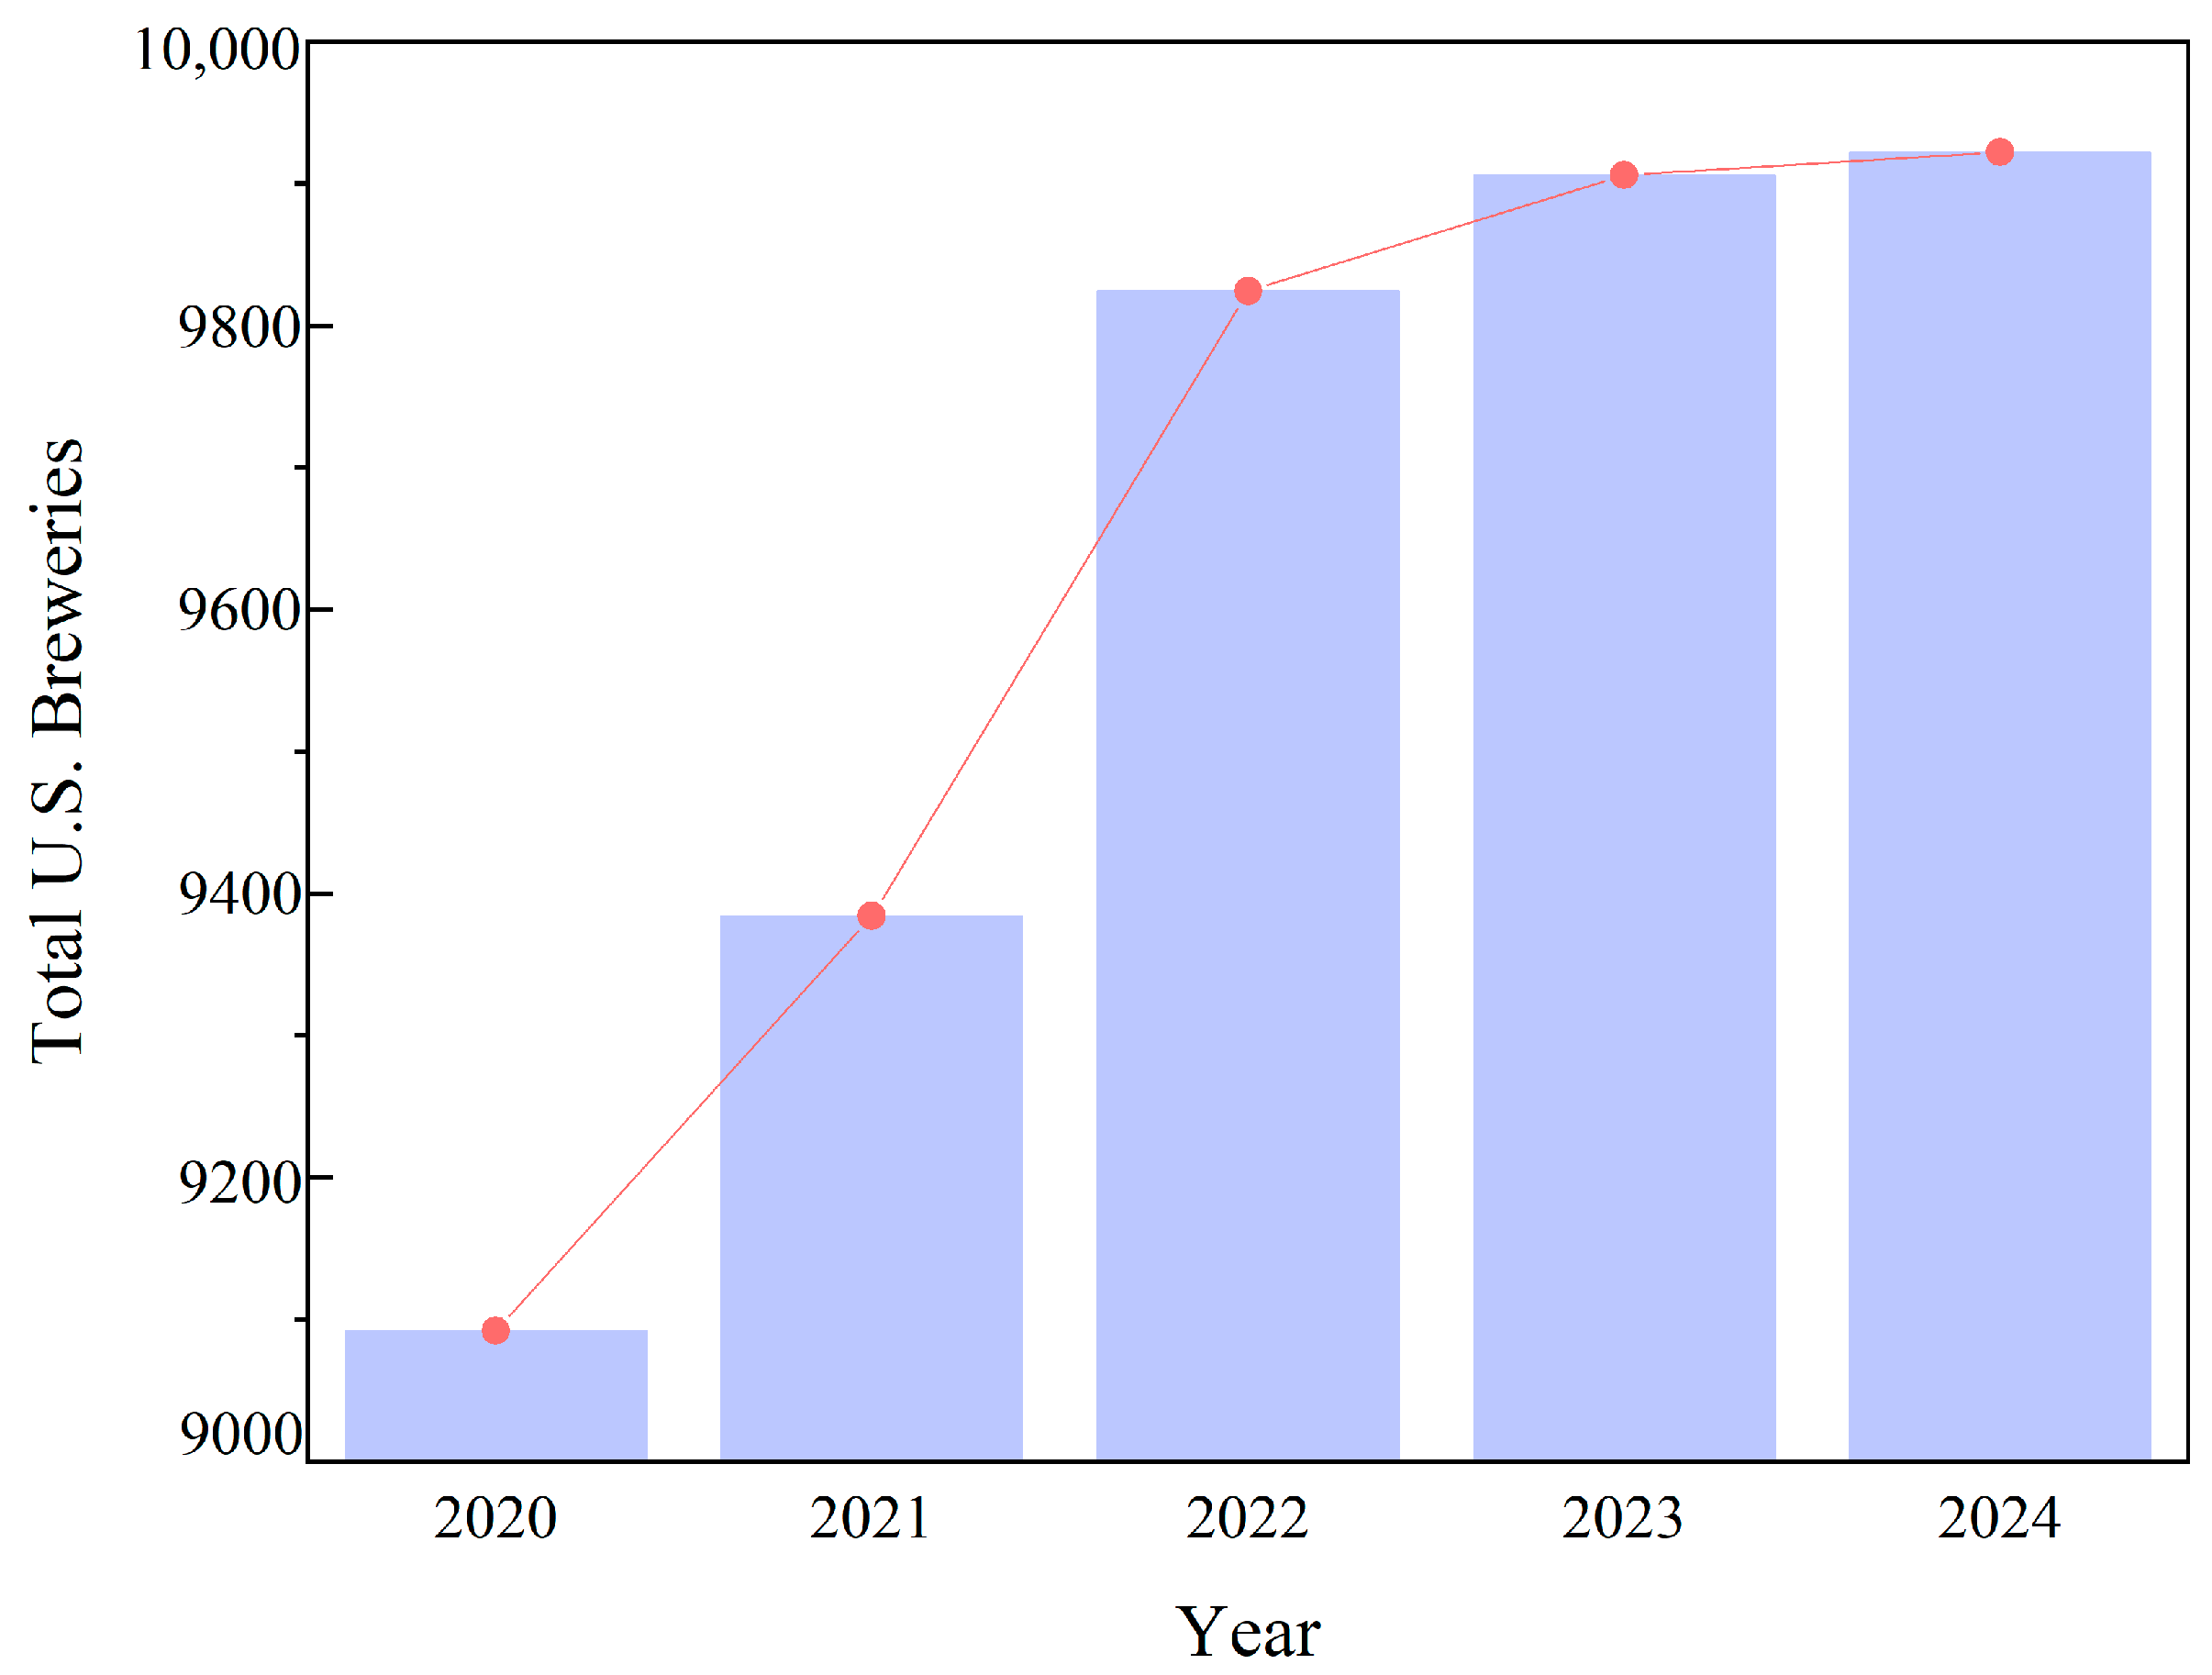
Beer stands as one of the most globally produced beverages. According to the Food and Agriculture Organization of the United Nations (FAO) Statistics Division, approximately 222 million tons of beer were produced worldwide in 2023 [1]. The microbrewing sector, particularly in the United States, has experienced robust growth. The total number of breweries in the United States has increased from 9092 in 2020 to 9922 in 2024 [2] (Figure 1).
While this expansion contributes to local economies, it also results in the generation of substantial waste streams that present environmental challenges. Microbrewery operations produce several distinct waste streams, including sugar mash water from the mashing step, spent yeast (with or without hops) separated after fermentation, and highly alkaline cleaning wastewater used for cleaning-in-place (CIP) operations [3]. While the brewing process also generates significant solid phase by-products, most notably brewers’ spent grain (BSG), the insoluble residue from mashing constitutes about 85% of brewing waste [4,5]. These streams contain high organic loads and varying chemical properties that make them suitable candidates for value-added product recovery rather than simple disposal. Typically, BSG is frequently hauled away to landfills but can also be directly used as feed for ruminant animals [6]. Each ton of BSG landfilled can produce 513 kg of carbon dioxide equivalent greenhouse gas emissions, posing a potential environmental threat [7]. While other waste streams, including cleaning-in-place (CIP) wastewater, are discharged into drainage systems and retained in holding tanks or lagoons prior to final disposal. Currently, many microbreweries dispose of these wastes directly into municipal sewer systems without prior treatment, imposing burdens on public infrastructure [8]. However, microbrewers are generally environmentally conscious and are increasingly enthusiastic about green initiatives that can lower their carbon emissions.
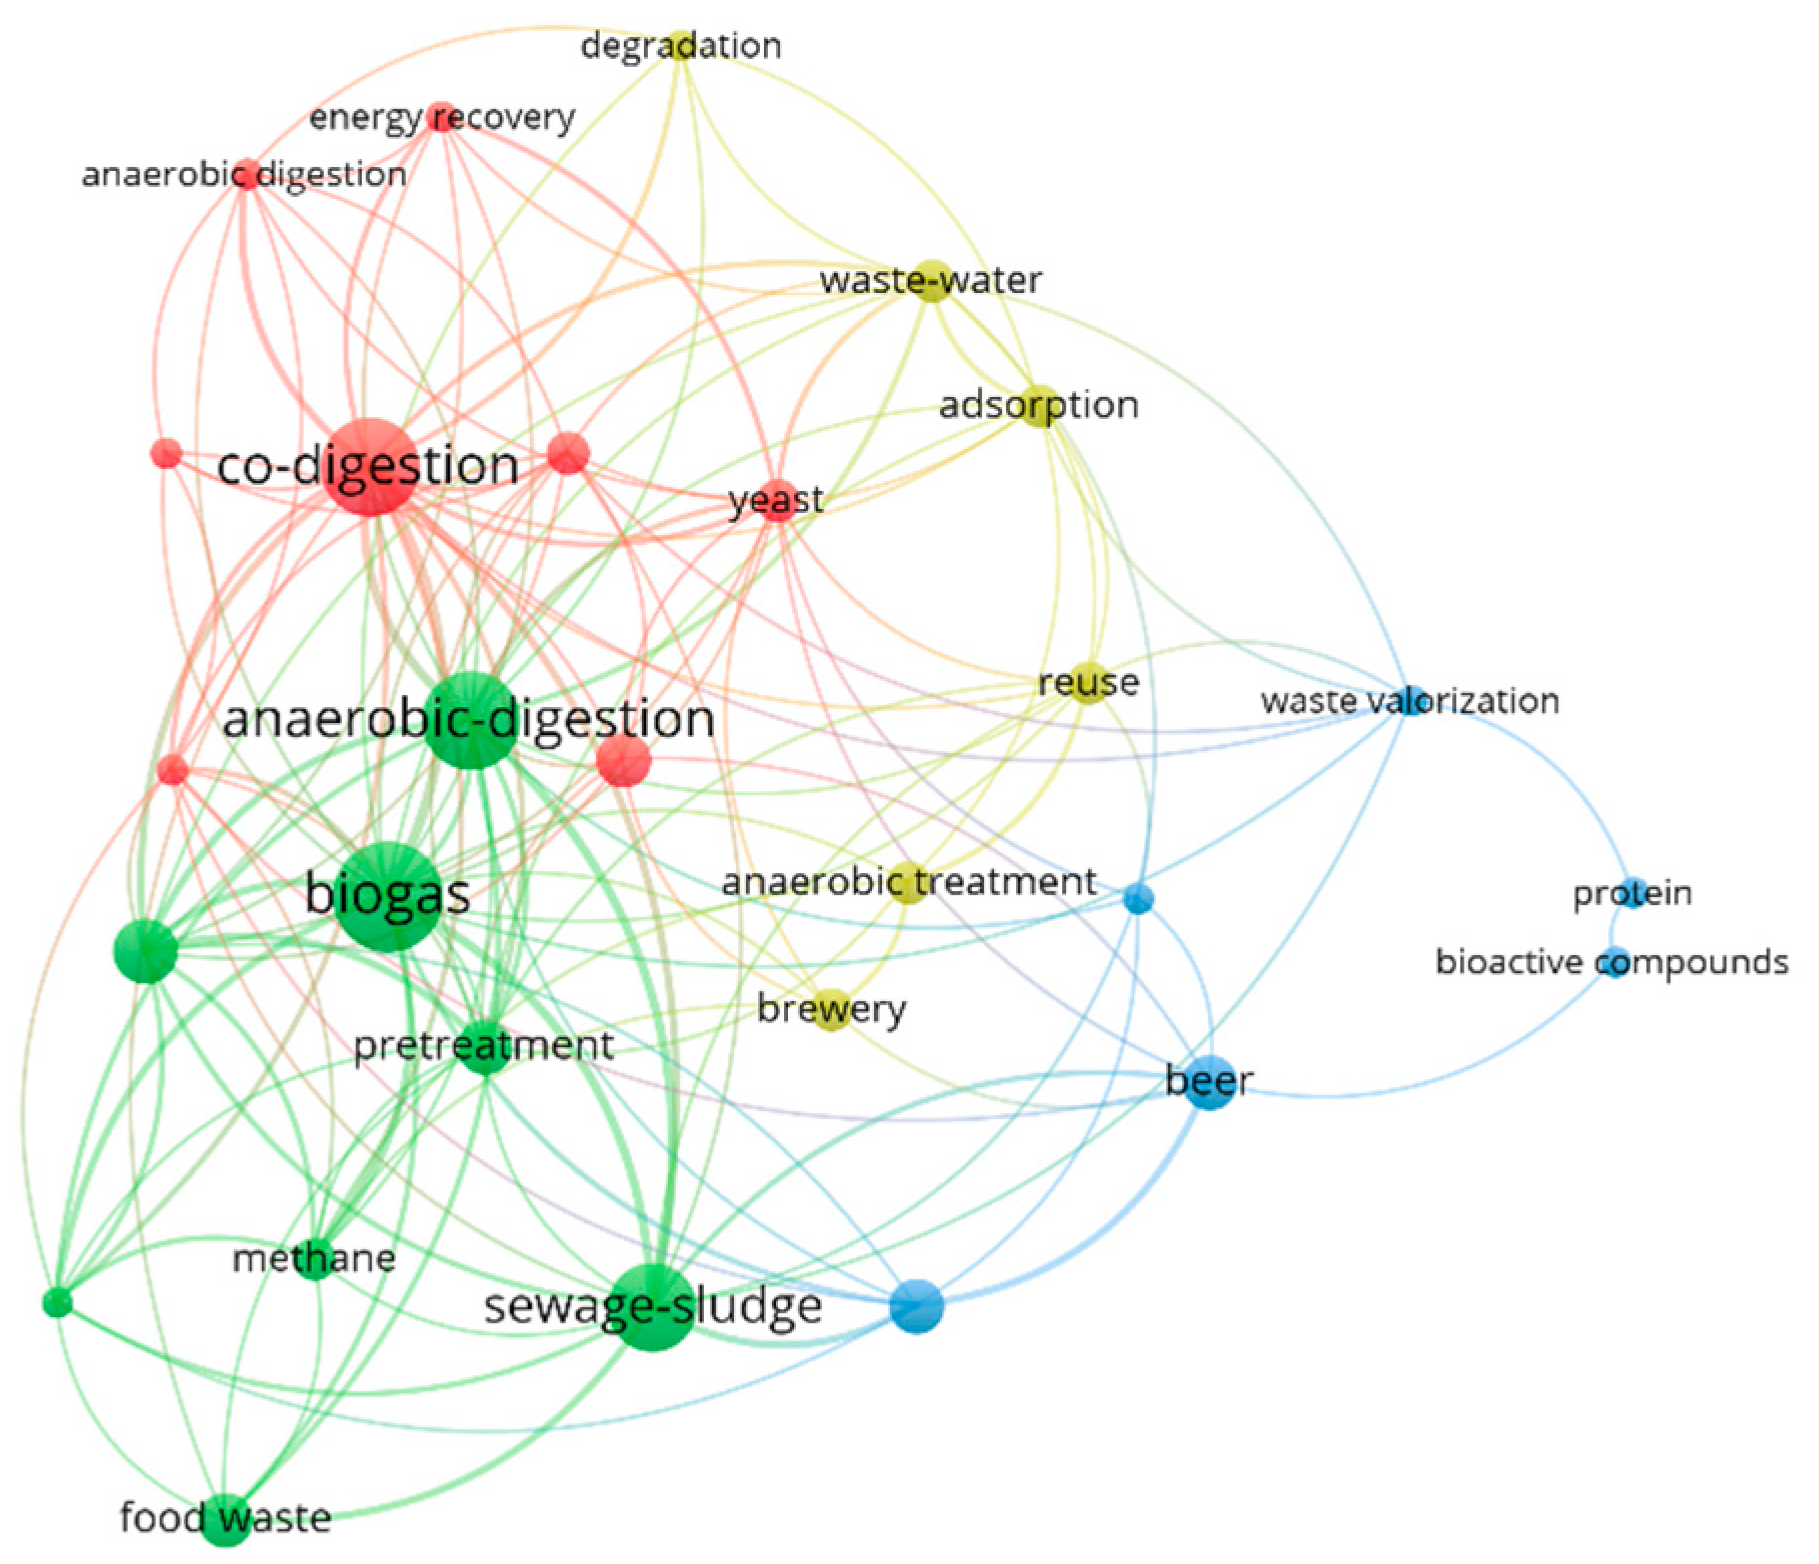
One promising management strategy is anaerobic digestion (AD), a biological process that converts organic matter into biogas. Biogas, primarily composed of methane (CH4) and carbon dioxide (CO2), can be utilized on-site as a sustainable fuel for process heat [9]. Many microbrewery facilities, especially large ones, utilize on-site anaerobic digestion to treat this effluent, recovering biogas to offset approximately 10–20% of the fossil fuels required for boiler operations [10]. Despite its potential, AD of brewery waste often faces challenges such as the high acidity of organic blends with a pH of 4.6–5.2 [11], which can inhibit microbial activity. Its application to brewery waste streams often encounters other technical hurdles, like choice of temperature regime for anaerobic digestion and the need for cost-effective biogas upgrading (CO2 removal) to enhance fuel quality [12]. The comparative strategies for managing microbrewing wastewater and solid waste are summarized in Figure 2. Anaerobic digestion is the most commonly used method for treating wastewater and solid waste. The efficiency of anaerobic digestion in treating wastewater and solid waste is shown in Table 1.
In the context of microbrewery-integrated clean technologies, evaluating the distinction between mesophilic and thermophilic anaerobic digestion is essential for optimizing both energy recovery and process stability. Mesophilic digestion (typically 35–40 °C) is characterized by a high degree of microbial resilience and lower energy requirements, making it a robust choice for the “spiky” organic loading rates typical of batch-based brewing schedules. The optimal organic loading rate under mesophilic conditions was 1.5 g VS/(L·d) [22]. Conversely, thermophilic digestion (typically 50–55 °C) offers accelerated biochemical kinetics and the potential for higher throughput in smaller reactor volumes; the organic loading rate was maintained at 2.6 ± 0.2 g VS/(L·d) [23]. Understanding these two regimes allows researchers to determine whether the increased methane production rate of a thermophilic system outweighs its higher sensitivity to temperature fluctuations and increased thermal energy demand.
Furthermore, this distinction is critical for the overall energy balance of the facility—a core pillar of sustainable engineering. Microbreweries generate significant amounts of waste heat from boiling and cooling cycles [24]; therefore, the choice between temperature regimes determines how effectively this waste heat can be repurposed to maintain the digester temperature. By justifying the selection of one regime over the other, a study can demonstrate a more sophisticated application of circular economy principles, ensuring that the biogas produced is maximized for process heat rather than being consumed by the digester’s own internal heating requirements. This comparison is vital for developing a scalable, carbon-neutral waste management infrastructure tailored to the specific thermal and organic profiles of the brewing industry.
For biogas to be used effectively as a high-quality fuel, the CO2 must be removed to increase the energy density of the gas. Conventional CO2 scrubbing methods often rely on external chemical inputs, which can increase operational costs and complexity [25]. Techno-economic analysis of biomass gasification and polymer production both indicated that CO2 capture induced an integrated environmental assessment and benefit [26,27]. This study explores a circular economy approach by utilizing the alkaline cleaning wastewater generated on-site to serve as both a neutralizing agent for acidic organic feeds and a scrubbing medium for biogas upgrading. By integrating these processes, microbreweries can move toward a zero-waste model that produces clean energy while minimizing the environmental burden on local infrastructure.
This study investigates an integrated, circular approach specifically tailored for microbrewery operations. It first identifies an appropriate temperature regime for anaerobic digestion and then proposes synergistically using the alkaline CIP wastewater, an on-site by-product, to fulfill two critical functions: (1) neutralizing the acidic organic waste blends to optimize AD process stability, and (2) serving as a chemical absorbent for in situ biogas scrubbing to remove CO2. This strategy aims to advance microbreweries towards a zero-waste model by closing internal resource loops, producing renewable energy, and alleviating environmental impacts. This manuscript details the characterization of typical microbrewery waste streams and presents experimental results to compare anaerobic digestion of waste streams at mesophilic and thermophilic temperature regimes and to validate the performance of this combined AD and biogas upgrading system.

2. Materials and Methods

2.1. Sample Collection and Preparation

Four primary waste streams from a local microbrewery were characterized: sugar mash water (Sample A), spent yeast with and without hops (Samples B and C), and alkaline cleaning wastewater (Sample D). These waste streams were collected on-site from First Magnitude Brewery, Gainesville, FL, USA, in 5-gallon buckets, and were then stored in a cold chamber at 4 °C. The samples are labeled as follows:
  • Sample A: Sugar mash water generated during the washing of spent grain.
  • Sample B: Spent yeast with hops separated after fermentation.
  • Sample C: Spent yeast without hops separated after fermentation.
  • Sample D: Wash water generated from CIP operations using 1% NaOH.
  • Sample E: A composite organic waste stream, which was prepared in the laboratory by blending Samples A, B, and C in a volume ratio of 30:3:1, representing relative weekly generation rates at the brewery.

2.2. Analytical Procedures

  • pH Measurement: The pH of each waste stream was determined using an Orion 3 Star pH benchtop probe (Thermo Fisher Scientific, Waltham, MA, USA) at room temperature.
  • Solids Content: Total solids (TS) were measured by drying well-mixed samples (25–60 g) in crucibles at 105 °C until reaching a constant weight. Volatile solids (VS) were subsequently determined by igniting the dried samples in a furnace at 550 °C for two hours.
  • Chemical Oxygen Demand (COD): Soluble COD (SCOD) was analyzed by centrifuging samples and filtering the supernatant through 0.45 µm filter paper. The filtrate was analyzed using COD reagents (HACH, Loveland, CO, USA), a digestion kit, and a DR/890 Colorimeter (HACH, Loveland, CO, USA).
  • Analysis conducted at the brewery indicated typical ethanol contents of 6% (v/v) and 7.3% (v/v) for Sample B and Sample C, respectively, while no ethanol was detected in Sample A. Because ethanol is lost via volatilization during the thermal drying of samples for total solids (TS) and volatile solids (VS) analysis, and since it contributes significantly to the organic fraction, an ethanol correction was applied. This correction was necessary for accurately reporting proximate characteristics and calculating specific methane yields from mesophilic anaerobic digestion. The mass of lost ethanol was determined using a density of 0.789 g/mL.

2.3. pH Neutralization Experiments

Titration experiments were conducted to evaluate the feasibility of using the alkaline cleaning wastewater (Sample D) to neutralize the acidic blend (Sample E). Various volumes of Sample E (25, 50, and 100 mL) were titrated with Sample D to reach target pH levels of 6.0, 6.8, 7.0, and 7.5. The required volume of Sample D per ml of Sample E was calculated to determine if brewery-generated quantities were sufficient for full-scale neutralization.

2.4. Anaerobic Digestion Setup

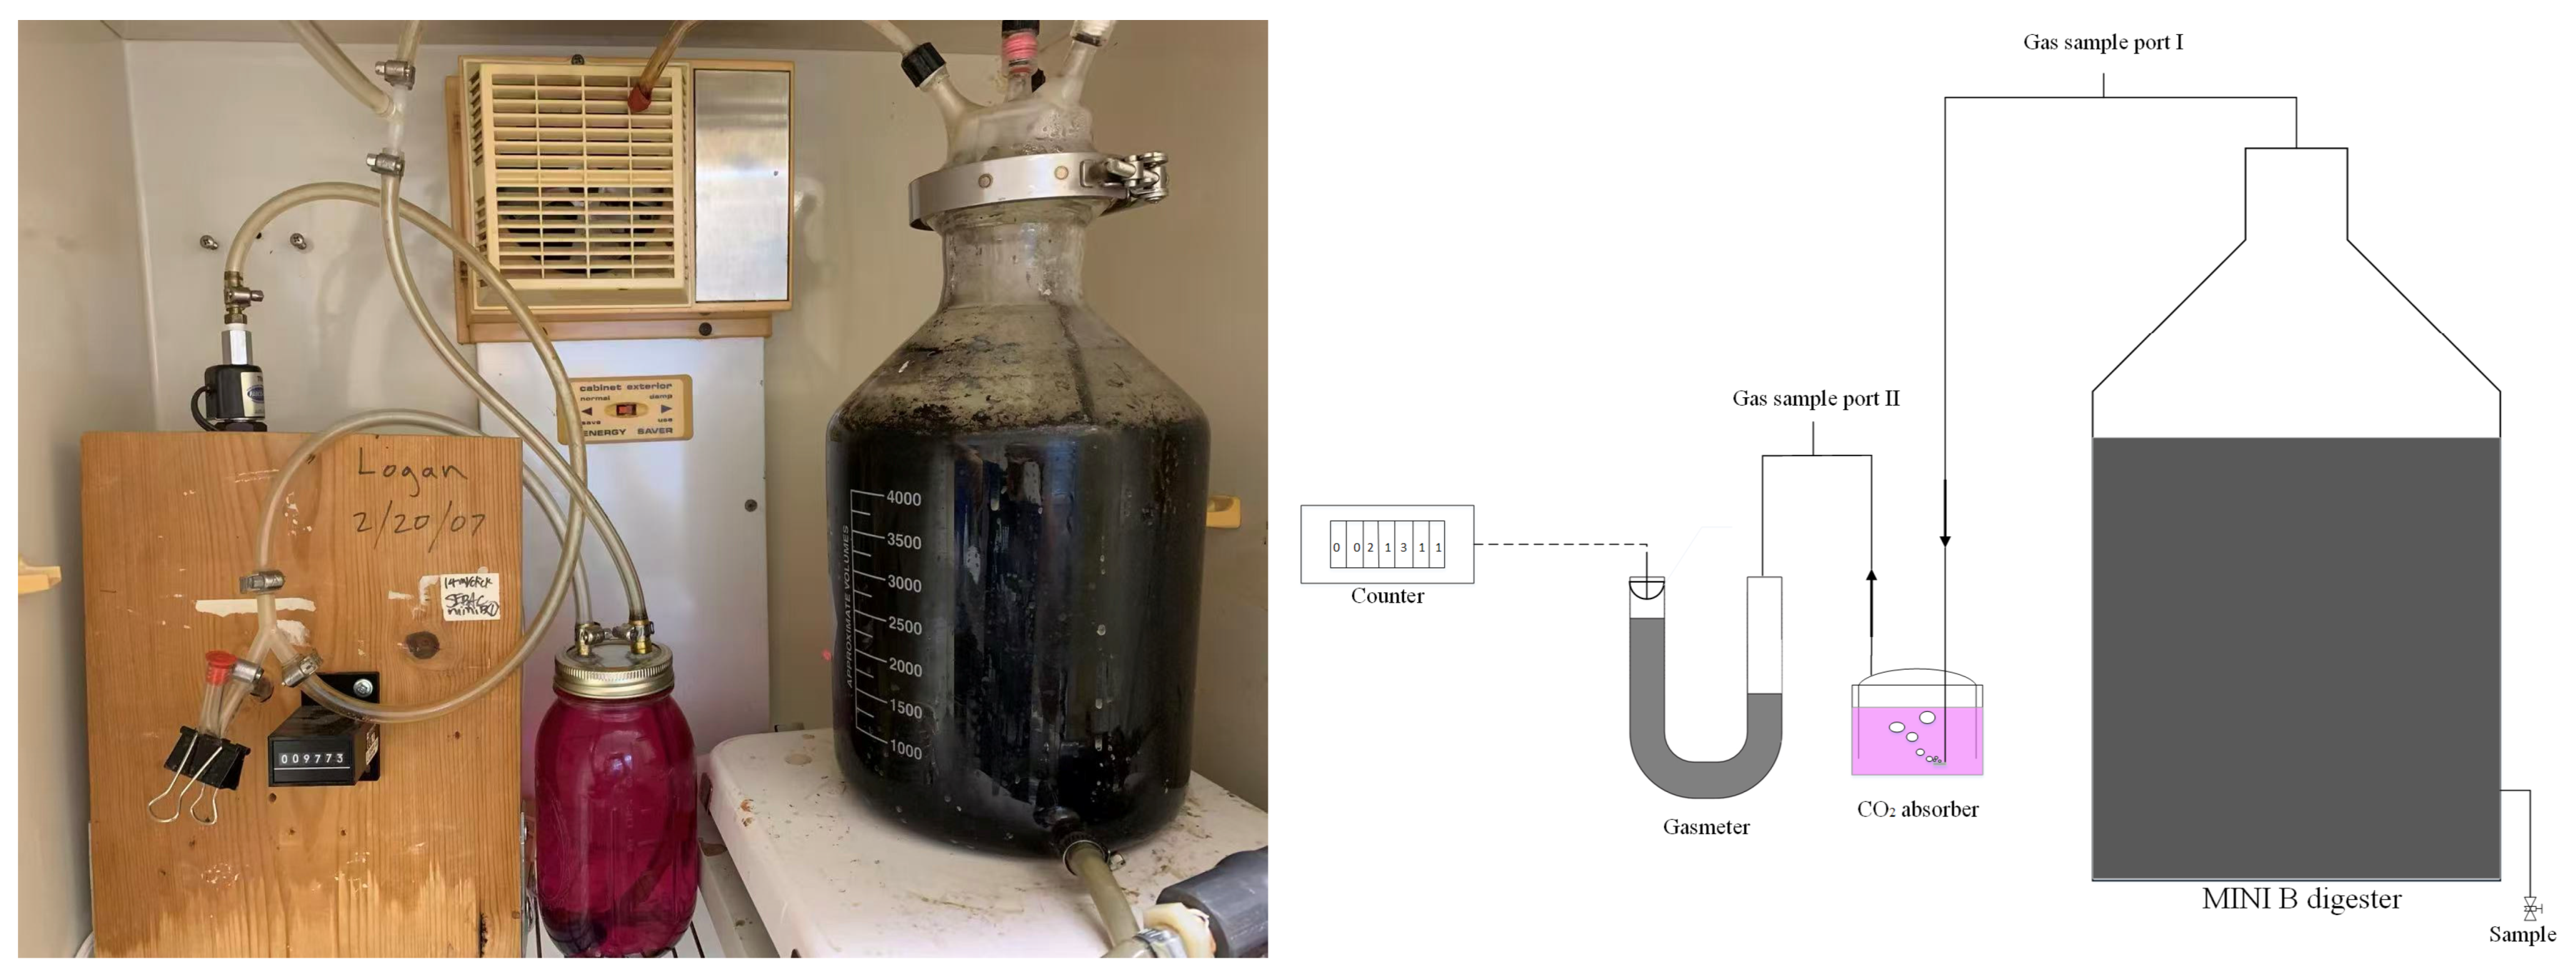
Three sets of anaerobic digestion experiments were conducted. The first set of experiments compared the effect of mesophilic and thermophilic temperatures on anaerobic digestion of Samples A, B and C. These experiments were conducted in 200 mL sealed serum bottles. The second set of experiments evaluated the anaerobic digestibility of Sample E and was conducted in duplicate in 4.5 Liter digester vessels fabricated from glass jars. The contents of the digesters were gently stirred at a speed of 60 rpm by a magnetic stirrer on which the vessel was placed. A detailed description of this apparatus is provided in [28]. These anaerobic digesters are referred to as MINI-digesters. The third set of experiments evaluated the efficacy of using the Sample D solution for scrubbing and upgrading biogas and were conducted in one of the MINI-digesters modified to incorporate a gas scrubbing apparatus as follows. A mason jar filled with sample D was used for scrubbing the biogas from the MINI-digester. A glass tube passing through the lid of the mason jar, with one end submerged in the solution and the other end connected to the biogas outlet of the MINI-digester. A second glass tube passing through the lid of the mason jar was connected to the gas meter. A schematic diagram of this arrangement is shown in Figure 3.

2.5. Biogas Measurements

For serum bottle experiments, biogas volume and composition were measured as follows. The headspace pressure of serum bottles was monitored daily using a digital manometer. If sufficient pressure (at least 1 kPa gauge) was built up, the pressure was recorded, 1 mL of sample was withdrawn for compositional analysis, and the pressure was reset to 0 kPa gauge by removing biogas using a syringe. Biogas composition (methane, carbon dioxide, nitrogen and oxygen) was measured using a GOW-MAC gas chromatograph (GC) (Gow-Mac series 580, Bethlehem, PA, USA) fitted with a thermal conductivity detector.
The biogas (in the second experimental set and upgraded biogas in the third experimental set) was measured by a gas displacement custom-built device. This setup employed a PVC U-tube (Formufit, Gainesville, FL, USA) filled with ethylene glycol solution, while a float switch (Cole-Parmer, Vernon Hills, IL, USA) and time-delay relay (Magnecraft, Chicago, IL, USA) regulated the cycle. Data was logged by a Redington counter (Trumeter, Windsor, CT, USA) and gas flow controlled by a solenoid valve (Fabco-Air, Gainesville, FL, USA) [28,29]. The gas meter was calibrated in line to determine the volume of biogas required to trigger a count. Biogas volumetric production was recorded daily, and methane content was monitored throughout the digestion period. Biogas composition was measured using a methane sensor described in [30,31] and the GC described above.
Digesters in all experimental sets were placed in incubators maintained at appropriate temperatures, 38 °C for mesophilic and 55 °C for thermophilic. Each experiment or run was conducted until biogas production ceased from the added substrate.

2.6. Seed Inoculum

The characterization of inoculum sludge was determined prior to use. TS, VS, pH, and alkalinity were measured to ensure stable methanogenic activity. The seed inoculum for mesophilic digestion was sludge collected from an active pilot-scale mesophilic anaerobic Induced Bed Reactor (IBR) fed daily with dairy manure and operating stably for over two years. Thermophilic seed inoculum was sludge collected from an active laboratory-scale thermophilic upflow anaerobic sludge blanket reactor that had been digesting various waste streams like cellulosic ethanol stillage, citrus processing wastewater, and sugarbeet processing raffinate for many years. The inoculum to substrate ratio (ISR) of 1.0 was identified as optimal because it maintained stable pH and total volatile fatty acid (TVFA)/total acid (TA) ratios throughout digestion, ensuring process stability without acidification, while still allowing effective methane production and substrate degradation [32]. Nutrient stock solution was prepared according to Owens’ [33], as shown in Table 2.

2.7. Batch AD Experiments Under Mesophilic (35 °C) and Thermophilic (55 °C)

Table 3, Table 4 and Table 5 list the details of the three sets of experiments that were conducted for this study. Details of the first set of experiments conducted in serum bottles are provided in Table 3. Serum bottles were incubated at mesophilic (M) and thermophilic (T) temperatures, conducted in duplicate (_1 and _2), and samples A, B, and C were separately investigated. MCon(−) and TCon(−) represent control experiments in which no substrate was added, and they contained only inoculum. The control assays quantified the biogas and methane released from residual substrates in the inoculum and from endogenous metabolism. To simulate the process of scale-up microbrewery operation, Sample E was prepared with Samples A, B, and C in a volume ratio of 30:3:1, so Sample A was 300 mL, Sample B 30 mL, and Sample C 10 mL, with an additional 10 mL of rising DI water, which made Sample E a total of 350 mL. Table 4 describes the second set of experiments conducted in batch MINI-digesters at mesophilic temperature. Two runs were conducted in parallel (Run 1A and Run 1B) for each addition of 350 mL of Sample E. Once biogas production ceased from Run 1, another aliquot of 350 mL of Sample E was added to each digester, after removing 350 mL of mixed liquor, to initiate Runs 2A and 2B. For the third set of experiments, Digester A in the second set was modified to incorporate a biogas scrubbing device, and Samples A and B were serially added to the digester as shown in Table 5. The digester was maintained at constant volume by removing mixed liquor prior to adding substrate. After three serial additions of substrate, the microbial activity was checked by adding sugar solution, before performing three more serial additions. The order of addition was A → B → B, and after sugar addition, the order was B → A → B.

2.8. Biogas Upgrading via CO2 Scrubbing Using CIP Wash Water

The CO2 absorption capacity of CIP wash water (Sample D) was evaluated using two methods. (1) Batch Absorption: Pure CO2 was injected into 200 mL of wash water in a sealed serum bottle until saturation was reached. (2) In situ Scrubbing: Conducted using the third experimental setup shown in Figure 3. The Mason jar contained 1 L of Sample D and phenolphthalein indicator. The scrubbing efficiency was verified by monitoring CO2 breakthrough at the outlet. The composition of the gas was monitored at the absorber inlet and outlet.

3. Results and Discussion

3.1. Waste Characterization

The proximate characterization of microbrewery waste streams revealed high organic content and significant variability in chemical properties. The organic waste streams (A, B, and C) were acidic, with pH values ranging from 4.55 to 5.06. The blended Sample E was the most acidic at pH 4.16 ± 0.025. Conversely, the CIP wash water (Sample D) was highly alkaline with a pH of 12.03 ± 0.15. Sample C (spent yeast without hops) exhibited the highest organic solids content (TS = 17.99%) and soluble COD (124.17 g/L). Sample A (sugar mash water) was a dilute organic stream with only 1.53% TS. Organic content of all samples was over 92% of dry weight, indicating high potential for biological conversion. On the other hand, from microbrewery operations, the wash water (Sample D) only demonstrated minimal VS, which indicated there is barely any organics in it [34].
The details of the characterization of waste stream samples are listed in Table 6. An additional component of samples B and C was ethanol. At the end of the fermentation process, the yeast and hops were allowed to settle before being drained. Therefore, Samples B and C contained ethanol, which would not have been included in the VS and COD values, as it would have volatilized in these tests due to high temperatures. Typical ethanol content of Sample B was 6% by volume, and Sample C was about 7.3% by volume as measured by the brewery. No ethanol was detected in Sample A. Based on the ethanol content, the proximate characteristics of Samples B and C can be calculated. After including ethanol, the TS and VS of Sample B were 13.79% g/g and 94.79% TS, respectively, and the TS and VS of Sample C were 23.76% g/g and 93.98% TS, respectively. In addition, using a mass balance based on proximate characteristics of Samples A, B and C results in a TS value of 2.68% g/g and a VS of 94.74% TS for Sample E. This is in good agreement with the measured values of TS and VS for Sample E listed in Table 6.

3.2. Neutralization and Process Integration

The organic waste blend (Sample E, a blend of samples A, B and C) was found to be highly acidic (pH of 4.16). A critical finding of this study is the synergy between the acidic organic waste and the alkaline cleaning wastewater. Titration data showed that 0.017 mL of Sample D is required per ml of Sample E to reach a neutral pH of 7.0, indicating that the alkaline cleaning wastewater (pH of 12.03), containing approximately 37.2 g/L of residual caustic soda (NaOH), was produced in sufficient quantities to neutralize the organic blend to a pH of 7.0 prior to digestion.
  • Volume Balance: The brewery generates approximately 1360 gallons of organic waste and 40 gallons of cleaning wastewater weekly.
  • Feasibility: Calculations indicate that 1360 gallons of Sample E require only 24 gallons of Sample D for neutralization. Thus, the brewery produces a surplus of alkaline waste sufficient to stabilize the AD process without external chemical additives.

3.3. Anaerobic Digestion Performance and Methane Yield

3.3.1. Anaerobic Digestion of Samples A, B and C

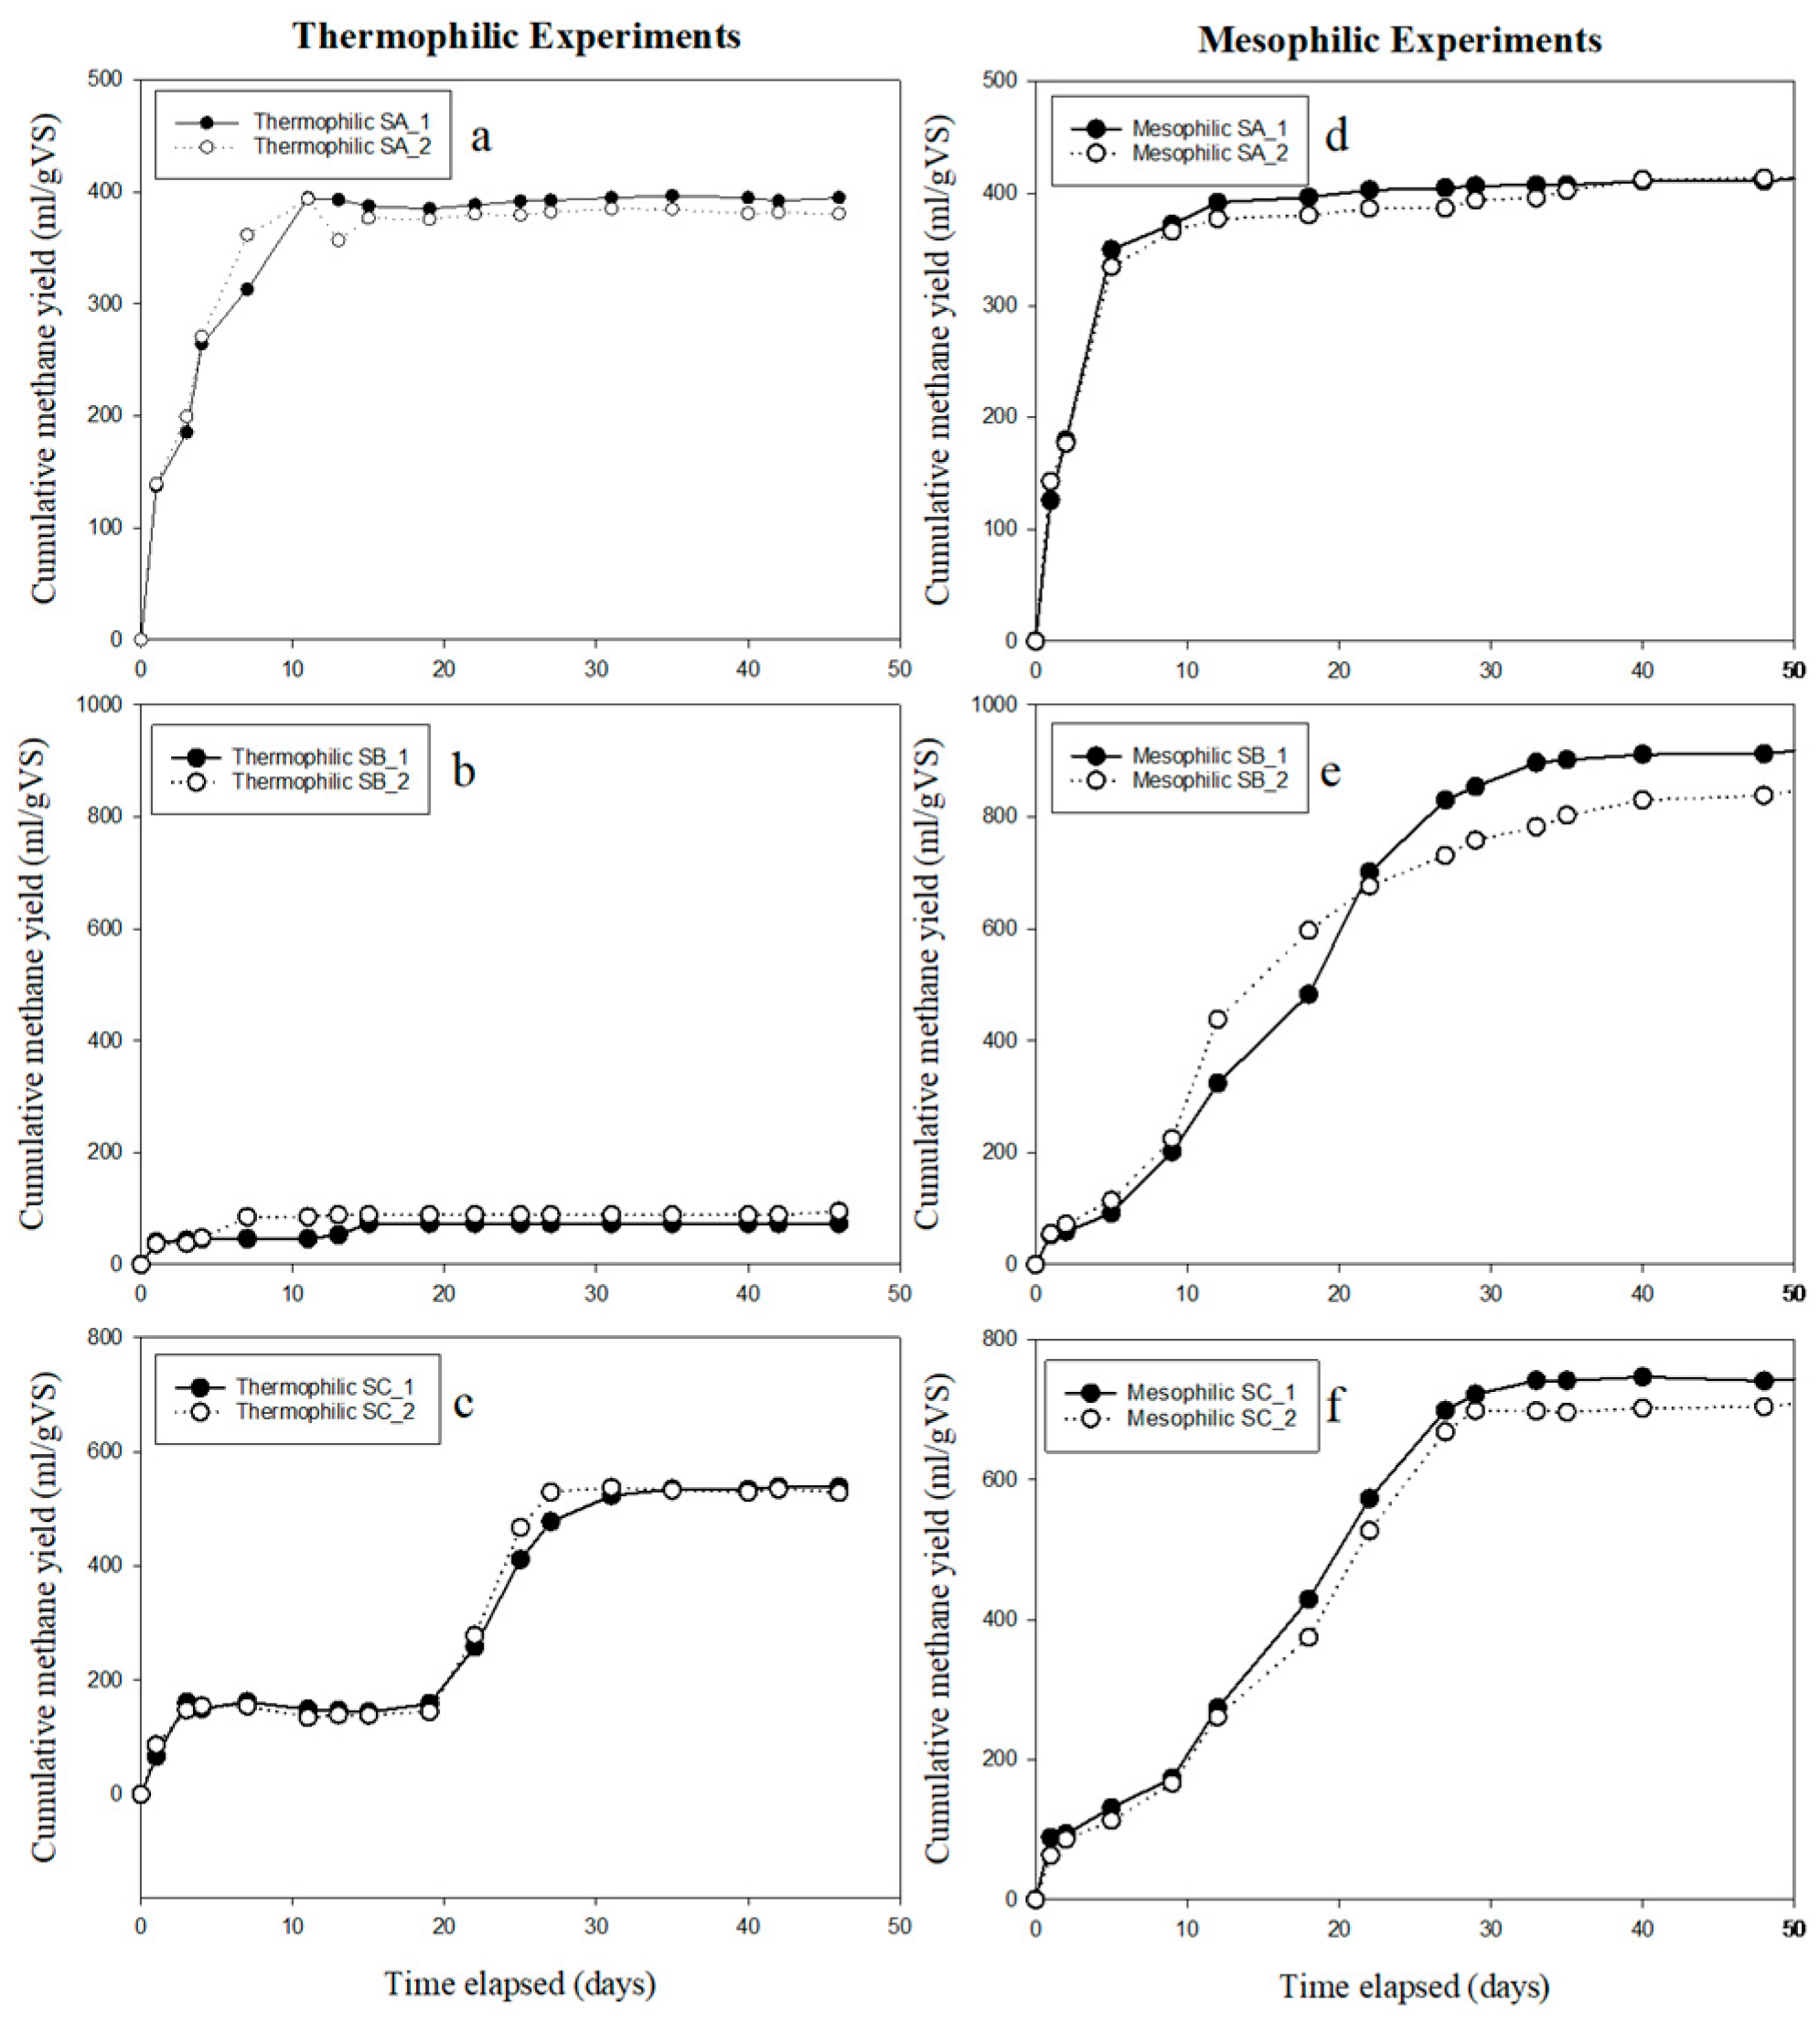
Cumulative methane production over the duration of incubation on a mL/g VS basis for each sample at thermophilic and mesophilic conditions is plotted in Figure 4a–f. Also indicated in each plot is the corresponding methane yield on a mL/mL of sample basis. Experimental replicates demonstrated high reproducibility. Methane production was observed under both temperature regimes for all samples; however, the nature of methane evolution was different. For Sample A (Figure 4a,d), the methane yield at thermophilic conditions was about 7% lower than that at the mesophilic temperature, even though the rate of methane production was similar. The thermophilic temperature did not provide any clear advantages over the mesophilic temperature.
For Sample B (Figure 4b,e), methane evolution at both thermophilic and mesophilic temperatures showed a bi-phasic profile. In both cases, methane production quickly increases upon incubation due to the breakdown of readily degradable components in samples, and then plateaus, followed by an increase as slowly degradable components are digested. Methane yield at mesophilic temperature was an order of magnitude greater than that at thermophilic temperature.
Methane evolution from Sample C (Figure 4c) at thermophilic temperature showed a very pronounced biphasic profile. After the initial increase, the methane profile plateaued for 15 days before the next increase. Methane yield from Sample C was more than the yield from Sample B at thermophilic temperature. Methane profile at mesophilic temperature also showed a bi-phasic behavior; however, the duration of the initial plateau was very short, about a day, before methane production began to increase. Methane yield at mesophilic temperature was more than at thermophilic temperature.
Samples B and C contained yeast cells and ethanol in addition to unfermented components of the wort. These substrates were more readily degraded by the mesophilic inoculum, as it is likely to have contained a more diverse microbial population requiring less acclimation period than the thermophilic inoculum. This was observed as a short plateau period after an initial increase compared to the long lag phase at thermophilic temperatures. The methane yield from Samples B and C was abnormally high on a VS basis, 881 and 718 mL/g VS. This can be attributed to the presence of ethanol in these samples, which would have volatilized when the samples were dried prior to VS measurement, thereby underestimating the degradable organic content of the samples. So, there was more “VS” in the sample than that listed in Table 6. If the ‘ethanol’ corrected values of TS and VS were used, the methane yield of Samples B and C would be 561.5 mL/g VS and 532.24 mL/g VS, respectively. These values are typical of expected methane yields of degradable substrates containing a mixture of carbohydrates, proteins and fats. There are reports in the literature that the methane yield from g VS of fat (1.014 L/g VS) is approximately twice that of protein (0.496 L/g VS) and carbohydrates (0.415 L/g VS) [35]. It should also be noted that ethanol, being an energy-dense reduced substrate, yields more methane than carbohydrates when anaerobically digested. Theoretical methane yield from ethanol is 730 mL/g compared to 373 mL/g for glucose. Another observation from Figure 4c is that the methane yield from Sample C at thermophilic conditions is considerably lower than the corresponding methane yield for the sample at mesophilic conditions. This could be attributed to the volatilization of most of the ethanol at the higher temperature before it could be degraded. If all ethanol introduced to the thermophilic digester through Sample C were biogasified, then the methane yield would have been 788 mL/g VS, or using an ‘ethanol’ corrected VS value, the yield would have been 584.2 mL/g VS. These values agree with yield values from the mesophilic digester. Another surprising observation from this experiment is the low methane yield from Sample B compared to Sample C at thermophilic conditions. The difference between Samples B and C is the presence of hops in Sample B. It is possible that extractives (or hydrolysates) from hops may have inhibited the thermophilic community. The low methane yield in Sample B, containing hop extractives, is likely due to hop α-acids, β-acids, and prenylated flavonoids such as xanthohumol. These compounds inhibit methanogenesis by disrupting cell membrane integrity, interfering with key enzymes like methyl-coenzyme M reductase, and altering the thermophilic microbial community. Previous studies have shown that these hop-derived compounds can significantly inhibit methane production in thermophilic conditions [36]. The higher temperature (compared to mesophilic conditions, which did not show any suppression of methanogenic activity) would have extracted more inhibitors, and the reduced microbial diversity may have exacerbated the inhibitory effects. Therefore, a mesophilic temperature regime would be optimal for anaerobically digesting microbrewery wastes. Subsequent experiments were conducted at mesophilic temperatures.

3.3.2. Anaerobic Digestion of Sample E in Mini-Digester at Mesophilic Temperature

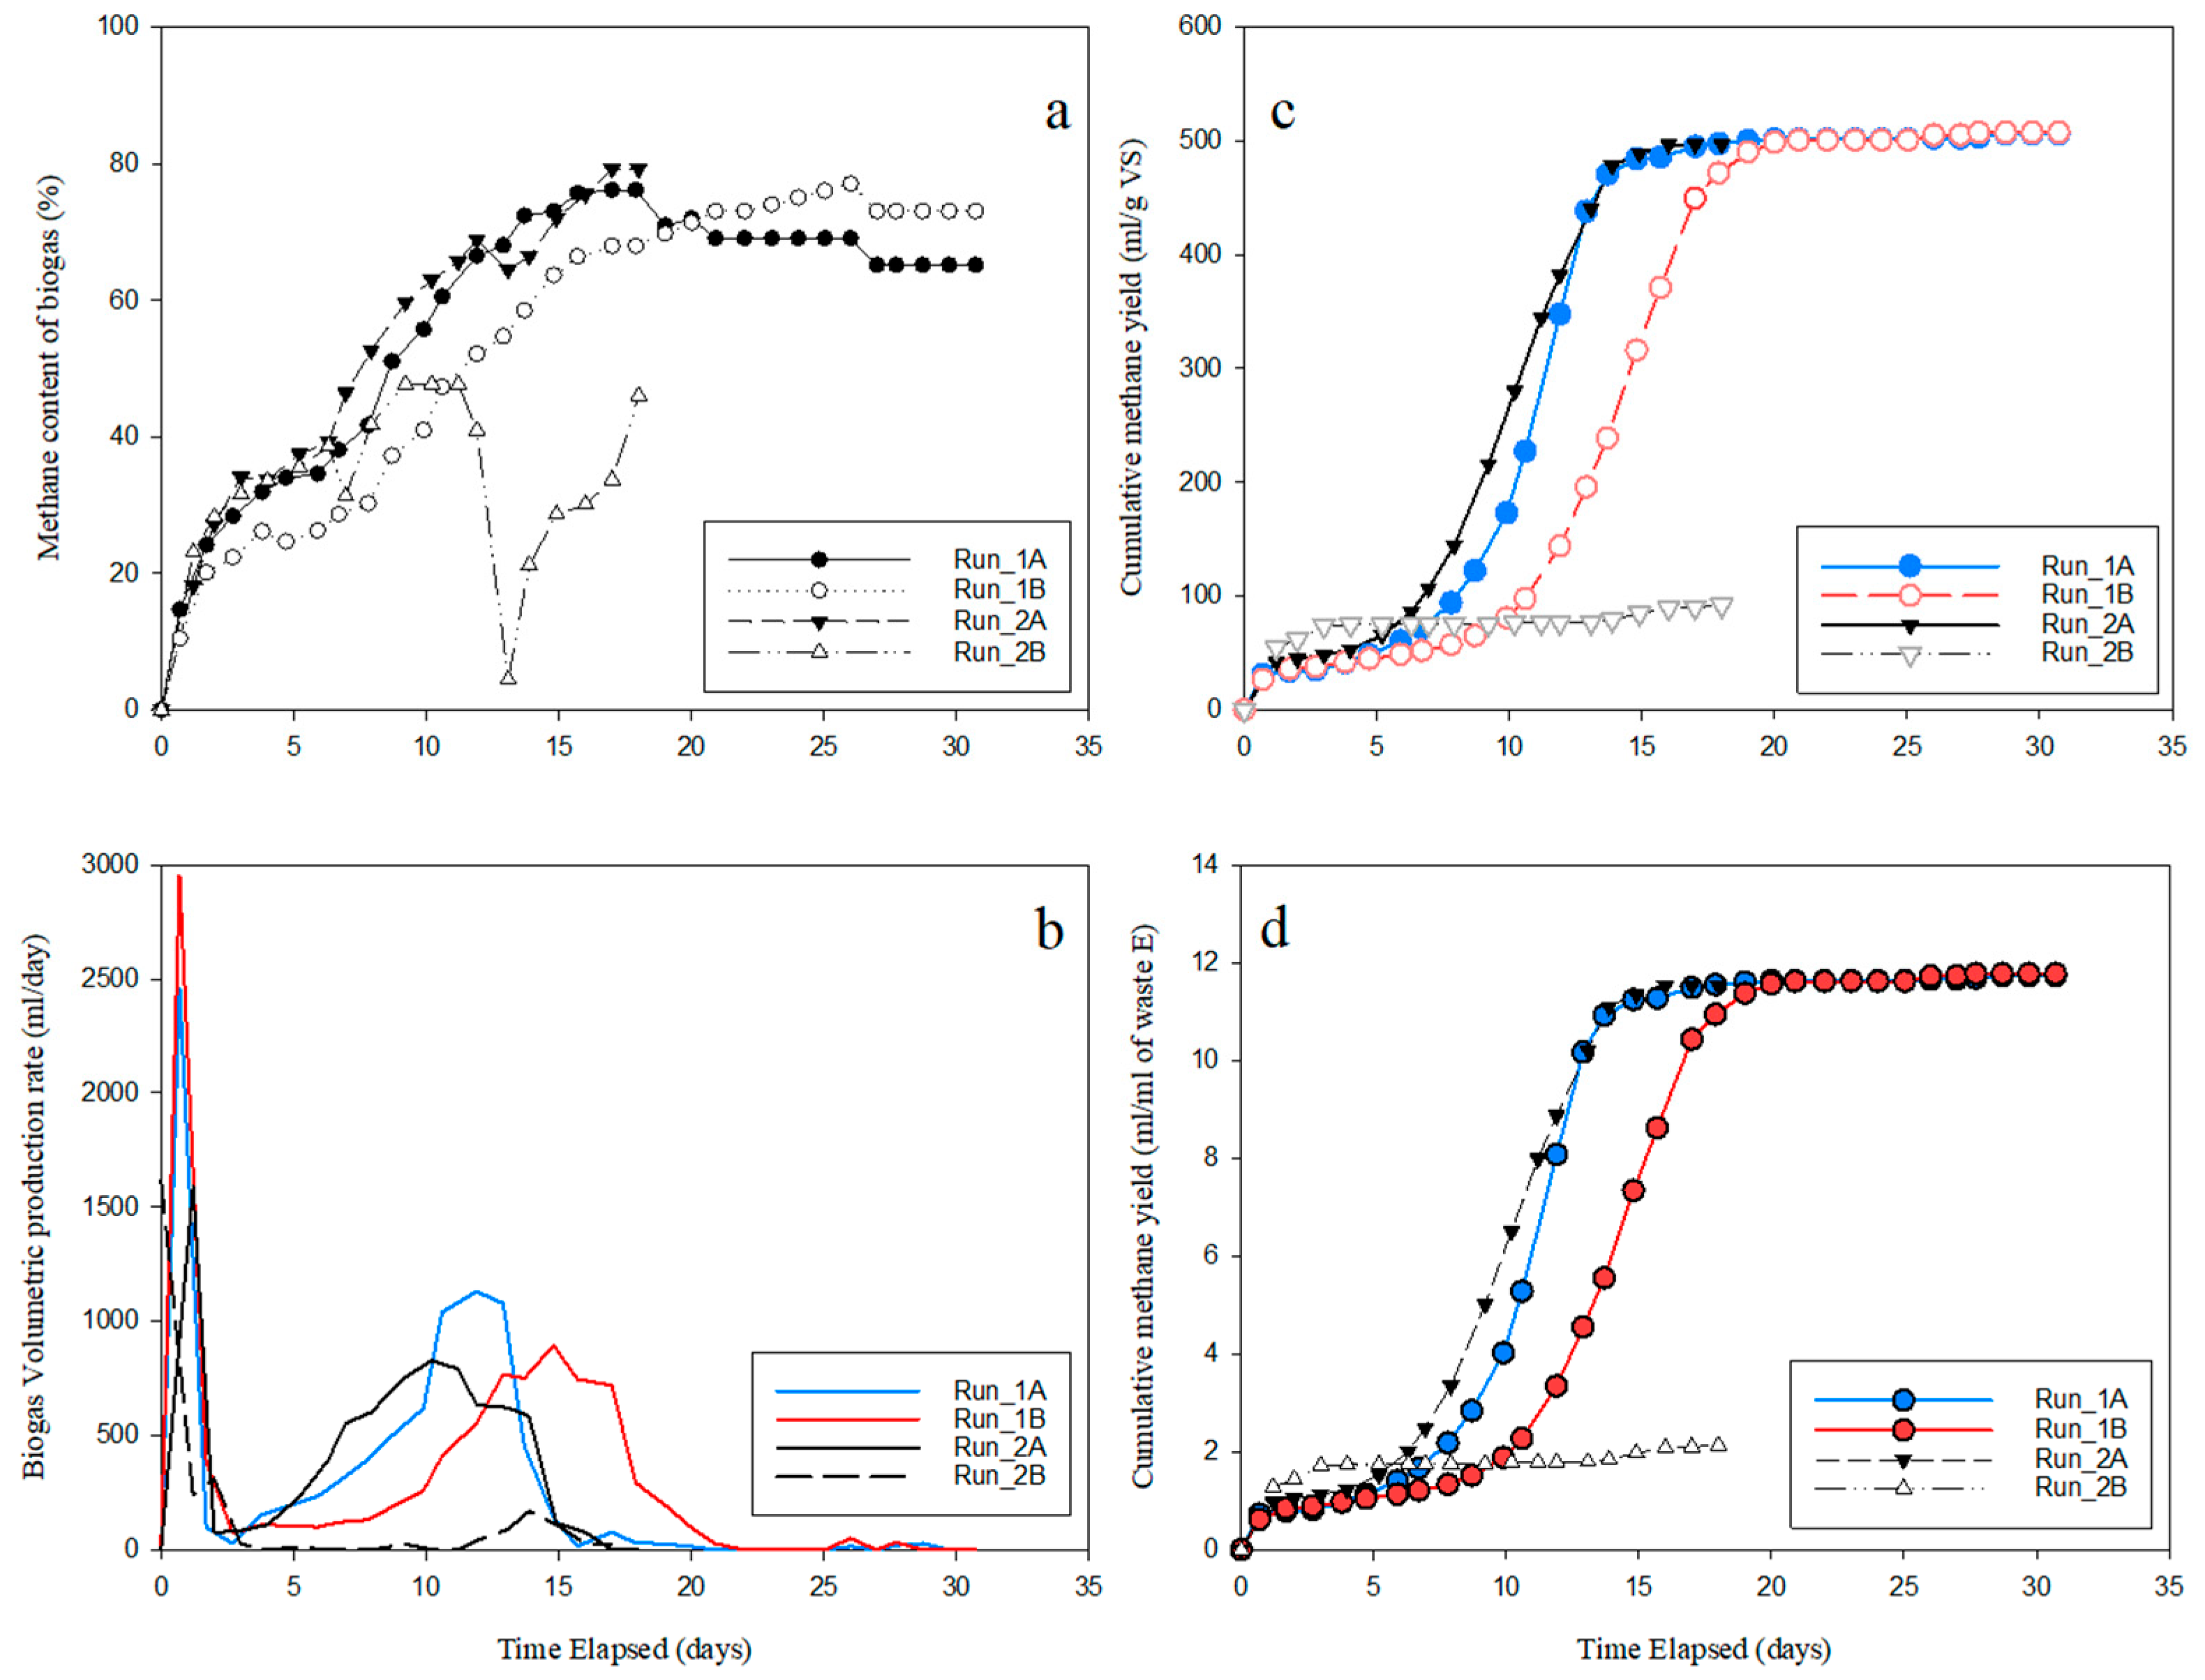
Figure 5 shows data from experiments conducted in the MINI-digester at mesophilic conditions. These experiments showed robust performance. Run 2B sprung a gas leak, and its outcomes could not be compared with other runs. It was confirmed that Run 2B was affected by a leak, as a mixed liquor analysis after 20 days of incubation did not show an accumulation of volatile organic acids, and pH and sCOD values were comparable to values measured after completion of other runs. The degradation pattern in all runs showed a biphasic curve. Upon addition of substrate, there is a rapid increase in methane production for about a day or two, and then methane production drops to zero, and from day 5 begins to increase again in Runs 1A and 2A, and begins to increase after about 10 days in Run 1B. After 12 days, methane production in Runs 1A and 2A ceased, whereas it took about 20 days for methane production to cease in Run 1B. Methane production in two stages can also be seen in the daily biogas volumetric production plot (Figure 5b), where there is an initial peak followed by a more gradual increase in biogas production. Methane yield from all runs was very similar and ranged between 496.74 mL/g VS for Run 2A and 507.4 mL/g VS for Run 1B. The average methane yield was 503.3 mL/g VS. The theoretical methane yield for Sample E, estimated from its constituent components (Samples A, B, and C), is 494.3 mL/g VS. This is in good agreement with the experimentally measured value. Methane composition in biogas for all runs varied between 70 and 80% (Figure 5a). The lag phase that follows the initial methane production may be due to the acclimatization of the microbial community to substrates in Sample E. The duration of this lag phase decreased in Run 2A from the duration in Runs 1A and 1B.
Other observations from these runs were that the digesters operated in a stable manner. This was concluded from mixed liquor characteristics measured at the end of each run. Post-digestion mixed liquor maintained a stable pH between 7.45 and 8.05. Bicarbonate alkalinity ranged between 4067.5 and 4214.5 mg CaCO3/L in all Runs. The total volatile organic acid concentration measured as acetic acid at the end of digestion ranged between 6.22 and 9.81 mM from all runs, including 2B. Although the use of Sample D, which contains 1% NaOH, may induce sodium inhibition in methanogens, the pH, volatile fatty acid (VFA), and bicarbonate data all proved that, within a limited amount of sodium dosage, the performance of anaerobic digestion at mesophilic conditions was not affected.

3.3.3. Biogas Upgrading and CO2 Scrubbing Efficiency

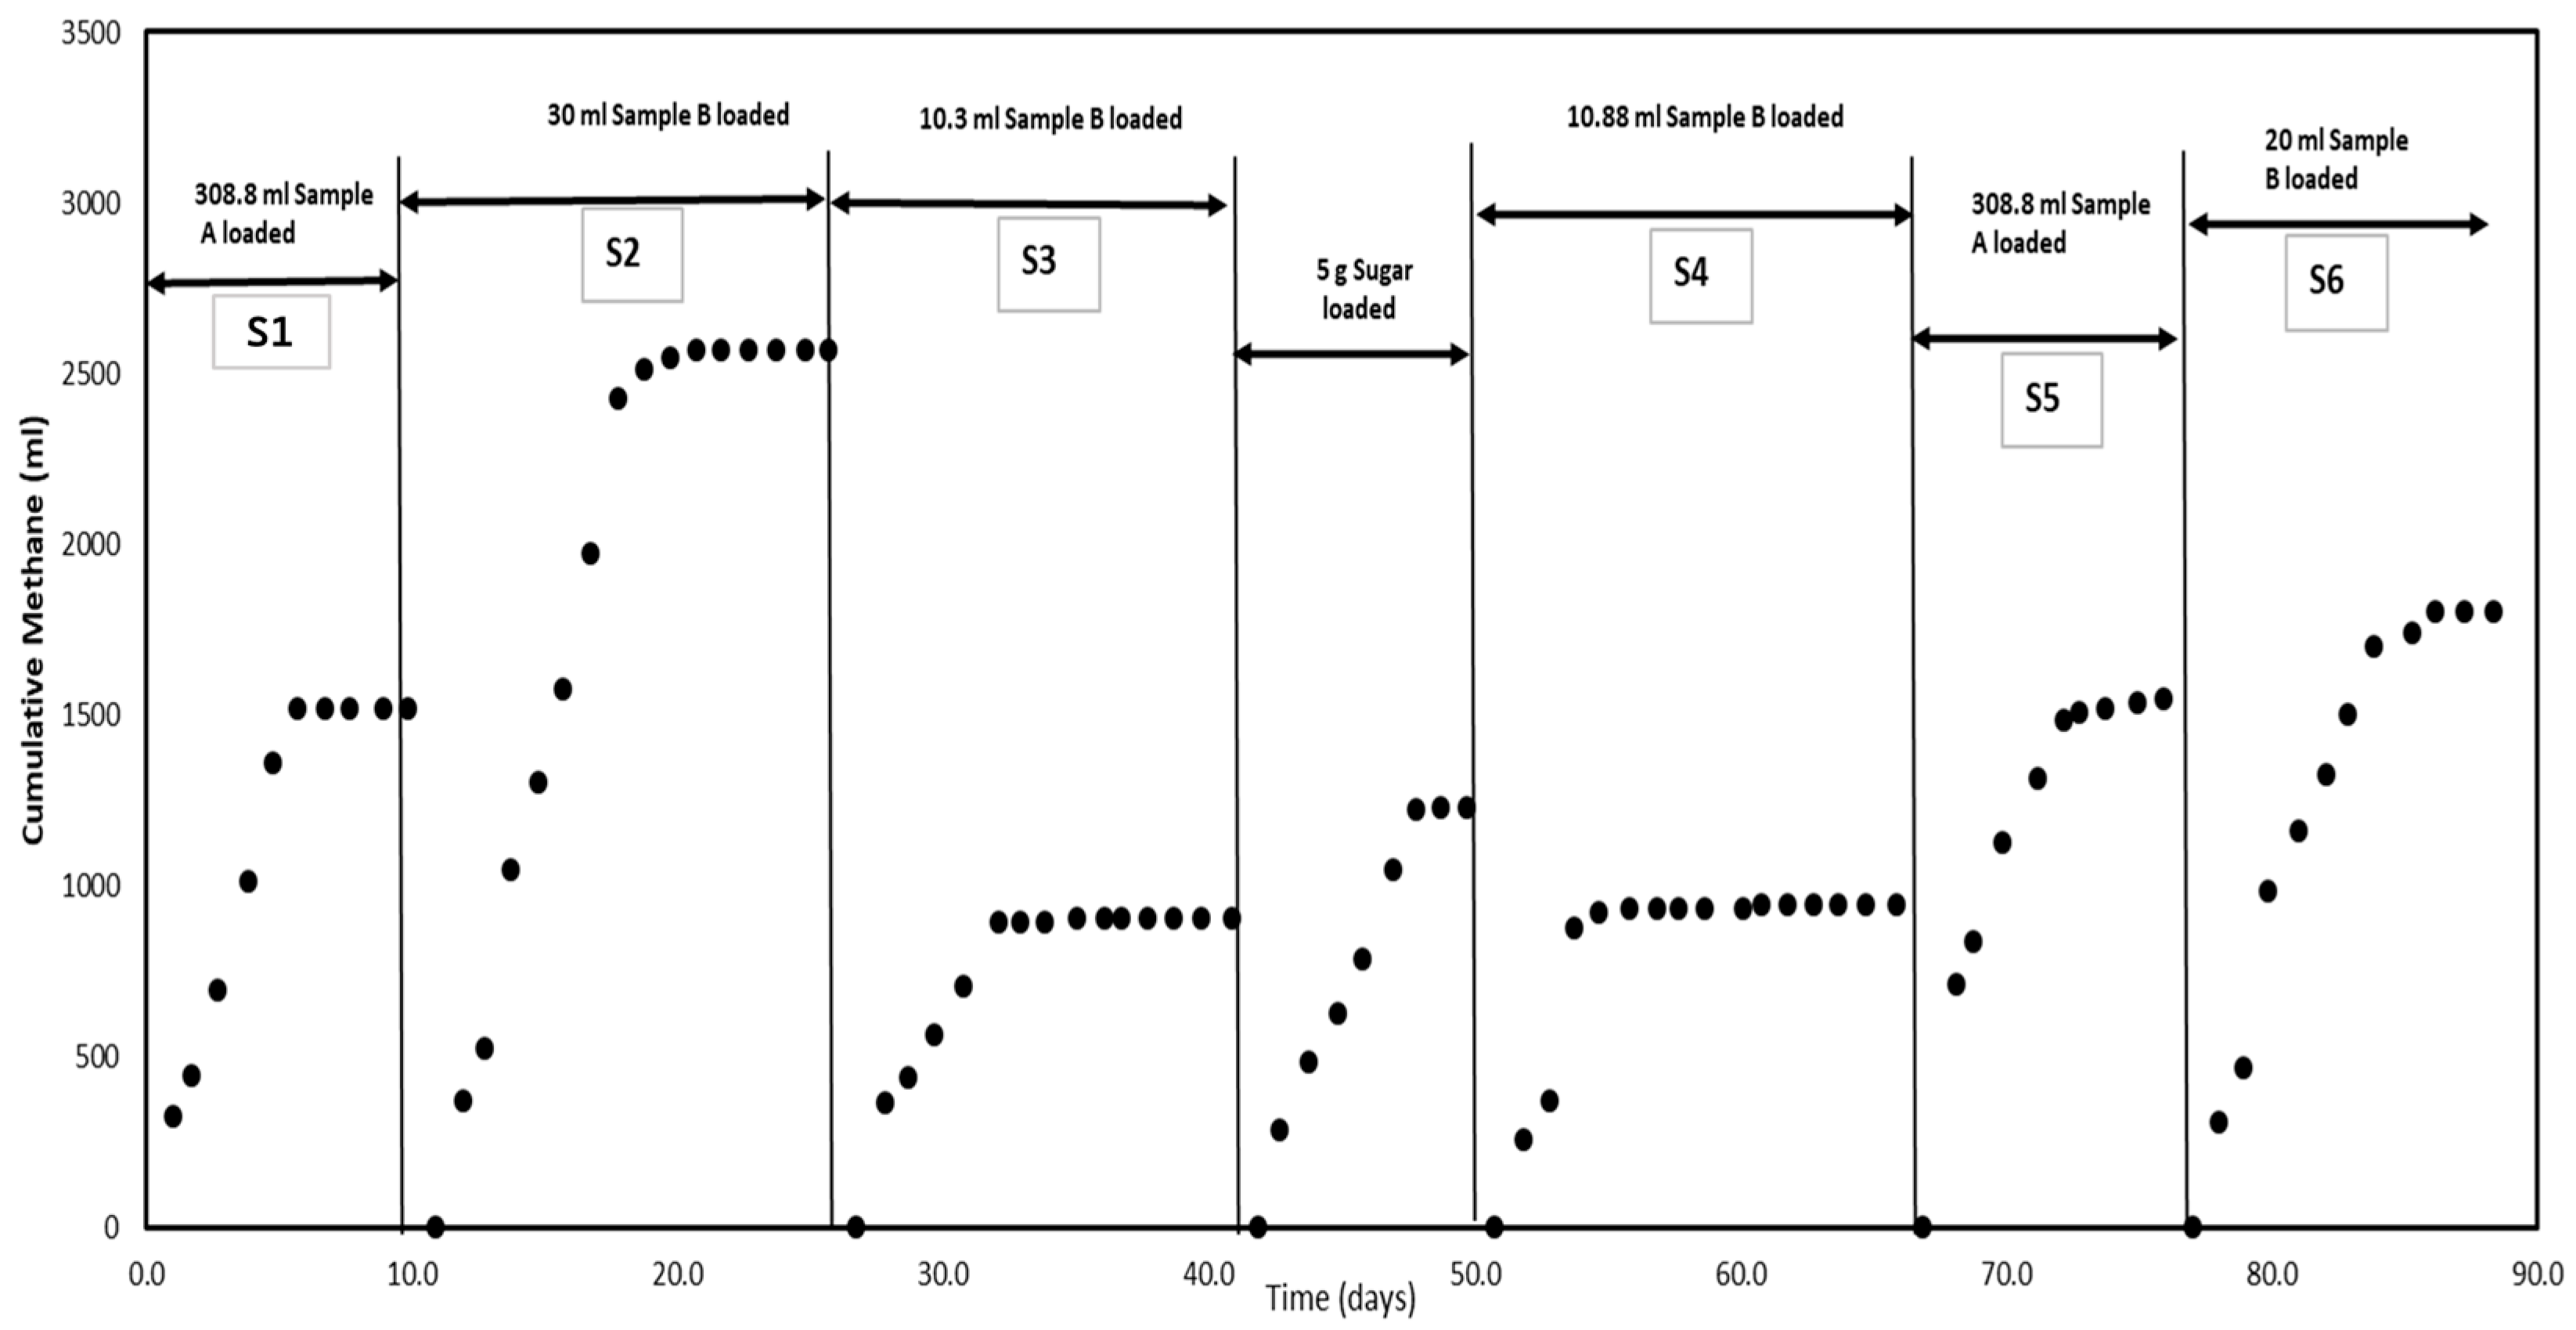
The use of caustic wash water (Sample D) as a carbon dioxide scrubber proved highly effective. Batch testing revealed that 200 mL of wash water could absorb 2.26 L of pure CO2. This capacity corresponds to a residual caustic concentration of approximately 10 g/L (1% g/g) in the wash water. This caustic concentration is within the range of caustic CIP solutions. Figure 6 shows cumulative methane data obtained from serial addition of various volumes of Samples A and B into the digester fitted with a CO2 scrubbing system. No lag phase occurred with any addition, showing the microbes were already acclimated to the substrate from earlier experiments. No CO2 breakthrough was detected throughout the duration of the trials (S1 through S6), confirming the high efficiency of the alkaline waste for biogas purification. Sample B, previously found potentially inhibitory during thermophilic digestion, was added multiple times here to assess possible inhibition under mesophilic conditions. Methane yields from Sample A were 5.1 (S1) and 5.2 (S5) mL/mL, which were about 16% lower than the value of 6.24 mL/mL discussed in Section 3.3.1 and shown in Figure 4d. Methane yields from Sample B were 86.67 (S2), 87.38 (S3), 82.72 (S4) and 87.5 (S6) mL/mL, yielding an average value of 86.07 mL/mL, which was about 4.6% higher than the value of 82.25 mL/mL discussed in Section 3.3.1 and shown in Figure 4e. Methane yield from the 4.5 L (working volume) Mini-digester agrees well with values obtained at a smaller scale in 200 mL (working volume) serum bottles. Inhibition was not observed in these experiments.
The integration of these processes—using alkaline waste for biogas upgrading and for feed neutralization—represents a highly efficient circular model for microbrewery operations.
Biogas upgrading is critically important for microbreweries primarily because it enables the production of Renewable Natural Gas (RNG) with a heating value comparable to non-renewable Natural Gas (NG). This key characteristic means that existing boiler and burner systems can handle RNG with NG without requiring costly modifications or replacements, leading to direct and significant capital expenditure savings. Furthermore, when the crucial step of carbon dioxide removal is achieved at the source—during the upgrade process itself—it generates substantial economic benefits across the entire system. Removing CO2 upstream dramatically reduces the volume of gas that needs to be stored, transported, and utilized, thereby lowering handling and infrastructure costs. It also results in a purified, energy-dense fuel that burns more efficiently and reliably.
This study also simulated some economic scenarios based on utilizing biomethane produced from the waste streams of the microbrewery. A microbrewery producing 100 barrels of beer per week was used as a basis. Data on the weekly volumes of waste generated, as well as fuel consumption, were provided by the brewery.
Three cases were examined. In cases 1 and 2, RNG from anaerobic digestion of waste was used to displace propane and NG, respectively. In case 3, RNG was used to generate electricity. The calculations are shown in Table 7.
There are significant savings of about $109.09 per week if RNG is used to displace propane gas. About 20% of the fuel requirements of the microbrewery can be supplied by RNG produced on-site. If there is a penalty for effluent discharged into the sewer based on pH and BOD, the microbrewery can accrue additional savings by neutralizing the pH of wash water and lowering the BOD of effluent.

4. Conclusions

Microbial Ecology: This study identified substrate-specific temperature sensitivities within a single industrial waste portfolio. While most anaerobic digestion studies focus on a single temperature regime, this work revealed that anaerobic digestion of microbrewery streams responds differently to thermal conditions: specifically, spent yeast with hops exhibits a significant reduction in methane yield under thermophilic conditions compared to mesophilic digestion, whereas sugar mash water maintains consistent performance across both regimes.
Process Synergy: The high alkalinity of the CIP wastewater served a dual purpose, acting first as an effective CO2 scrubbing medium to produce high-purity biomethane (100% CH4) and subsequently as a neutralizing agent for the acidic organic waste blend. This integrated solution not only streamlines waste management but also reduces operational expenses associated with conventional biogas upgrading technologies.
Energy Recovery: Anaerobic digestion of the neutralized brewery waste achieved high methane yields of approximately 500 mL/g VS, compared to the un-neutralized brewery waste water with 13.8–212.35 mL/g VS. This significant improvement for the energy recovery represented almost 30 times higher efficiency. This biogas can be utilized on-site for process heat, directly lowering the carbon footprint of the facility.
Environmental Impact: This integrated management strategy reduced the BOD of high-strength organic waste and neutralized corrosive cleaning fluids to reduce the burden on sewers and foster a more sustainable brewing industry.
Limitation: This study was conducted on a small scale with a single microbrewery’s waste streams, which may not fully represent larger, industrial-scale systems. Additionally, the long-term stability and economic feasibility of the integrated process require further investigation to assess its scalability and performance under varying operational conditions. Although microbial community analysis was not within the scope of the present study, future work incorporating molecular techniques (e.g., 16S rRNA sequencing) would provide deeper insight into community dynamics and inhibition mechanisms.

Author Contributions

Conceptualization, P.P. and S.Y.; methodology, S.Y. and N.W.; resources, S.Y. and P.P.; data curation, N.W. and S.Y.; writing—original draft preparation, S.Y., N.W. and P.P.; writing— review and editing, P.P. and S.Y.; supervision, N.W. and P.P.; project administration, S.Y. and P.P.; funding acquisition, P.P. All authors have read and agreed to the published version of the manuscript.

Funding

The authors gratefully acknowledge financial support provided by Blue Earth Industries, Clearwater, FL, USA, and First Magnitude Brewing Company, Gainesville, FL, USA for providing samples.

Data Availability Statement

The original contributions presented in this study are included in the article. Further inquiries can be directed to the corresponding author.

Conflicts of Interest

The authors declare no conflicts of interest.

References

  1. Faostat. Food and Agriculture Data. Available online: https://www.fao.org/faostat/en/#data.2026 (accessed on 12 January 2026).
  2. Brewers Association. National Beer Sales & Production Data. Available online: https://www.brewersassociation.org/statistics-and-data/national-beer-stats (accessed on 3 March 2026).
  3. Serviss, M.T.; Van Hout, D.; Britton, S.J.; Macintosh, A.J. Brewing for the Future: Balancing Tradition and Sustainability. J. Am. Soc. Brew. Chem. 2025, 84, 121–139. [Google Scholar] [CrossRef]
  4. Yang, W.; Zeng, X.; Lin, Y.; Huang, D. Hordein reclaimed from brewer’s spent grains (spent malt) for fabrication of plant oil based pork fat tissue analogues. Food Hydrocoll. 2026, 173, 112278. [Google Scholar] [CrossRef]
  5. Pérez-Alva, A.; Martín-Del-Campo, S.T.; Baigts-Allende, D.K. Brewer’s spent grain (BSG) as an ingredient for leavened bread making: Challenges and opportunities. J. Cereal Sci. 2025, 124, 104223. [Google Scholar] [CrossRef]
  6. Davison, N.; Christodoulou, C.; Humphries, D.; Kliem, K.; Stergiadis, S.; Smith, L. Environmental and economic impacts of using brewers spent grains for animal feed and anaerobic digestion. J. Clean. Prod. 2026, 538, 147365. [Google Scholar] [CrossRef]
  7. Baiano, A.; Fiore, A. Development and characterization of brewers’ spent grain-based materials. Circ. Econ. 2025, 4, 100158. [Google Scholar] [CrossRef]
  8. Amenorfenyo, D.K.; Huang, X.; Zhang, Y.; Zeng, Q.; Zhang, N.; Ren, J.; Huang, Q. Microalgae Brewery Wastewater Treatment: Potentials, Benefits and the Challenges. Int. J. Environ. Res. Public Health 2019, 16, 1910. [Google Scholar] [CrossRef] [PubMed]
  9. Kabeyi, M.J.B.; Olanrewaju, O.A. Biogas Production and Applications in the Sustainable Energy Transition. J. Energy 2022, 2022, 8750221. [Google Scholar] [CrossRef]
  10. Rao, M.N. The Operational Viability of Implementing Anaerobic Digestion Technology to Pre-Treat Craft Brewery Wastewater in Western Australia. Ph.D. Thesis, Murdoch University, Perth, Australia, 2018. [Google Scholar]
  11. Cheah, Y.-K.; Vidal-Antich, C.; Dosta, J.; Mata-Álvarez, J. Volatile fatty acid production from mesophilic acidogenic fermentation of organic fraction of municipal solid waste and food waste under acidic and alkaline pH. Environ. Sci. Pollut. Res. 2019, 26, 35509–35522. [Google Scholar] [CrossRef]
  12. Ahmed, S.F.; Mofijur, M.; Tarannum, K.; Chowdhury, A.T.; Rafa, N.; Nuzhat, S.; Kumar, P.S.; Vo, D.-V.N.; Lichtfouse, E.; Mahlia, T.M.I. Biogas upgrading, economy and utilization: A review. Environ. Chem. Lett. 2021, 19, 4137–4164. [Google Scholar] [CrossRef]
  13. Bougrier, C.; Dognin, D.; Laroche, C.; Cacho Rivero, J.A. Use of trace elements addition for anaerobic digestion of brewer’s spent grains. J. Environ. Manag. 2018, 223, 101–107. [Google Scholar] [CrossRef]
  14. Świechowski, K.; Rasaq, W.A.; Syguła, E. Anaerobic digestion of brewer’s spent grain with biochars—Biomethane production and digestate quality effects. Front. Energy Res. 2023, 11, 1141684. [Google Scholar] [CrossRef]
  15. Malakhova, D.V.; Egorova, M.A.; Prokudina, L.I.; Netrusov, A.I.; Tsavkelova, E.A. The biotransformation of brewer’s spent grain into biogas by anaerobic microbial communities. World J. Microbiol. Biotechnol. 2015, 31, 2015–2023. [Google Scholar] [CrossRef]
  16. Dickson Nganyira, P.; Mahushi, D.J.; Balengayabo, J.G.; Namwel Shao, G.; Emmanuel, J.K. Quantity of biogas produced through co-digestion of Brewer’s spent grain and cattle dung. Biofuels 2025, 16, 1116–1122. [Google Scholar] [CrossRef]
  17. Ganuza, M.; Jaramillo Mejia, S.; Albertó, E. Reutilization of Brewer’s Spent Grain as Spent Mushroom Substrate for the Generation of Biogas in a Semi-Continuous Digester. Waste Biomass Valorization 2024, 15, 2961–2971. [Google Scholar] [CrossRef]
  18. Xiang, J.; Zhou, Z.; Liu, Z.; Ren, C.; Xu, Y. Constructing simplified microbial consortia that couple lactic acid and ethanol utilization to highly produce caproic acid from liquor-making wastewater. Water Res. 2025, 284, 123973. [Google Scholar] [CrossRef] [PubMed]
  19. He, H.; Zeng, Y.; Dong, H.; Cui, P.; Lu, W.; Xu, H.; Qiu, B.; Sun, D.; Ma, J.; Dang, Y. Enrichment of Methanothrix species via riboflavin-loaded granular activated carbon in anaerobic digestion of high-concentration brewery wastewater amidst continuous inoculation of Methanosarcina barkeri. Water Res. 2025, 268, 122739. [Google Scholar] [CrossRef]
  20. Chen, X.; Jiang, Q.; Cui, Y.; Deng, H.; Mao, H.; Wang, Z.; Huang, L.; Shen, P. Lipid-extraction of Tribonema minus avoids foaming facilitating anaerobic co-digestion with molasses vinasse. J. Clean. Prod. 2024, 448, 141660. [Google Scholar] [CrossRef]
  21. Li, J.; Wu, S.; Zhang, W.; Pan, B.; Hua, M. Enhanced anaerobic digestion for energy recovery from brewery wastewater employing nano zero-valent iron loaded biochar prepared by residual sludge. Chem. Eng. J. 2024, 499, 156466. [Google Scholar] [CrossRef]
  22. Zhang, X.; Jiao, P.; Wang, Y.; Dai, Y.; Zhang, M.; Wu, P.; Ma, L. Optimizing anaerobic digestion: Benefits of mild temperature transition from thermophilic to mesophilic conditions. Environ. Sci. Ecotechnol. 2024, 21, 100440. [Google Scholar] [CrossRef]
  23. Rocha-Meneses, L.; Zannerni, R.; Inayat, A.; Abdallah, M.; Shanableh, A.; Ghenai, C.; Kamil, M.; Kikas, T. Current progress in anaerobic digestion reactors and parameters optimization. Biomass Convers. Biorefin. 2025, 15, 29573–29596. [Google Scholar] [CrossRef]
  24. Sueza Raffa, L.; Bennett, N.S.; Clemon, L.M. Opportunities for Energy Efficiency Improvements in Craft and Micro-Breweries. In Proceedings of the ASME 2022 International Mechanical Engineering Congress and Exposition Columbus, Columbus, OH, USA, 30 October–3 November 2022; p. 6. [Google Scholar]
  25. Hepburn, C.; Adlen, E.; Beddington, J.; Carter, E.A.; Fuss, S.; Mac Dowell, N.; Minx, J.C.; Smith, P.; Williams, C.K. The technological and economic prospects for CO2 utilization and removal. Nature 2019, 575, 87–97. [Google Scholar] [CrossRef]
  26. Wu, N.; Lan, K.; Yao, Y. An integrated techno-economic and environmental assessment for carbon capture in hydrogen production by biomass gasification. Resour. Conserv. Recycl. 2023, 188, 106693. [Google Scholar] [CrossRef]
  27. Wu, N.; Demchuk, Z.; Voronov, A.; Pourhashem, G. Sustainable manufacturing of polymeric materials: A techno-economic analysis of soybean oil-based acrylic monomers production. J. Clean. Prod. 2021, 286, 124939. [Google Scholar] [CrossRef]
  28. Wiegel, J.; Ljungdahl, L.G.; Demain, A.L. The Importance of Thermophilic Bacteria in Biotechnology. Crit. Rev. Biotechnol. 1985, 3, 39–108. [Google Scholar] [CrossRef]
  29. Koppar, A.; Pullammanappallil, P. Anaerobic digestion of peel waste and wastewater for on site energy generation in a citrus processing facility. Energy 2013, 60, 62–68. [Google Scholar] [CrossRef]
  30. Yang, S.; Liu, Y.; Wu, N.; Zhang, Y.; Svoronos, S.; Pullammanappallil, P. Low-cost, Arduino-based, portable device for measurement of methane composition in biogas. Renew. Energy 2019, 138, 224–229. [Google Scholar] [CrossRef]
  31. Yang, S.; Svoronos, S.A.; Pullammanappallil, P. Development of Inexpensive, Automatic, Real-Time Measurement System for On-Line Methane Content and Biogas Flowrate. Waste Biomass Valorization 2022, 13, 4839–4849. [Google Scholar] [CrossRef]
  32. Raposo, F.; Borja, R.; Martín, M.A.; Martín, A.; De La Rubia, M.A.; Rincón, B. Influence of inoculum–substrate ratio on the anaerobic digestion of sunflower oil cake in batch mode: Process stability and kinetic evaluation. Chem. Eng. J. 2009, 149, 70–77. [Google Scholar] [CrossRef]
  33. Owens, J.M.; Chynoweth, D.P. Biochemical Methane Potential of Municipal Solid Waste (MSW) Components. Water Sci. Technol. 1993, 27, 1–14. [Google Scholar] [CrossRef]
  34. Enitan-Folami, A.; Swalaha, F.; Adeyemo, J.; Bux, F. Assessment of Brewery Effluent Composition from A Beer Producing Industry in Kwazulu—Natal, South Africa. Fresenius Environ. Bull. 2014, 23, 693–701. [Google Scholar]
  35. Kobayashi, T.; Xu, K.-Q.; Li, Y.-Y.; Inamori, Y. Evaluation of hydrogen and methane production from municipal solid wastes with different compositions of fat, protein, cellulosic materials and the other carbohydrates. Int. J. Hydrogen Energy 2012, 37, 15711–15718. [Google Scholar] [CrossRef]
  36. Blaxland, J.A.; Watkins, A.J.; Baillie, L.W.J. The Ability of Hop Extracts to Reduce the Methane Production of Methanobrevibacter ruminantium. Archaea 2021, 2021, 5510063. [Google Scholar] [CrossRef]
Figure 1. The rising trend of craft units in the United States (2020–2024).
Cleantechnol 08 00047 g001
Figure 2. The comparative treatment strategies for microbrewing wastewater and solid waste.
Cleantechnol 08 00047 g002
Figure 3. Schematic diagram of MINI-digester with CO2 scrubbing.
Cleantechnol 08 00047 g003
Figure 4. Methane yield from samples A, B, and C at thermophilic (55 °C) and mesophilic (38 °C) conditions. (a) TA_1 and TA_2; (b) TB_1 and TB_2; (c) TC_1 and TC_2; (d) MA_1 and MA_2; (e) MB_1 and MB_2; (f) MC_1 and MC_2.
Cleantechnol 08 00047 g004
Figure 5. Anaerobic digestion of sample E in batch MINI-digester at mesophilic conditions (38 °C) (a) Biogas methane content; (b) Daily volumetric biogas production rate; (c) Cumulative methane yield (mL/g VS); (d) Cumulative methane yield (mL/mL waste).
Cleantechnol 08 00047 g005
Figure 6. Cumulative methane from CO2 removal with samples A and B continuously loaded.
Cleantechnol 08 00047 g006
Table 1. The recycling technologies using anaerobic digestion for BSG and wastewater.
IngredientsProductYieldReferences
BSG + Trace Elements + Anaerobic sludgeBiogas (CH4/CO2)The COD removal rate is 60–65%, and the methane yield was between 220 and 350 L/kg.[13]
BSG + BSG biochar + Anaerobic sludgeMethaneThe biogas production was 264 to 325 L/kg.[14]
BSG + Jerusalem artichoke + Animal manure + Anaerobic sludgeBiogasThe methane production rate was 60 L/kg[15]
BSG + Cow dung + WaterBiogasThe biogas production at a 3:1 ratio was 7.58 ± 0.5 L/kg.[16]
BSG + Anaerobic sludge + Spent mushroom substrateBiogasThe gas yield was 265.495 L/kg.[17]
Wastewater from liquor brewing processHigh-value-added medium-chain fatty acids such as caproic acidIn the 3 L fermentation tank, the yield of caproic acid reached 22.13 g/L.[18]
Beer wastewaterMethaneThe methane production rate was 13.8 L/kg.[19]
Syrup alcohol wastewater + lipid extracted microalgae (Tribonema sp.)MethaneThe maximum methane production potential of fresh lipid extracted Tribonema sp. was 158.9 ± 2.9 L/kg[20]
Wastewater from the brewery + biochar loaded with nano zero-valent iron (NZVI@EPSBC)MethaneThe methane production of 100 mg/L NZVI@EPSBC was 212.35 ± 16.54 L/kg[21]
Table 2. Composition of nutrient stock solution.
Serial NumberReagentConc (g/L) 1
S1sample2
S2Resazurin1
S3(NH4)H2PO426.7
S4S4-1CaCl2∙2H2O16.7
NH4Cl26.6
MgCl2∙6H2O120
KCl86.7
MnCl2∙4H2O1.33
CoCl2∙6H2O2
S4-2(X10)H3BO30.38
CuCl2∙2H2O0.18
Na2MoO4∙2H2O0.17
ZnCl20.14
NiCl2∙6H2O0.05
NaVO3∙nH2O0.05
S4-3(X100)H2WO40.007
S5(X0.1)FeCl2∙4H2O370
S6(X0.1)Na2S∙9H2O500
S7S7-1Biotin0.002
Folic Acid0.002
Pyridoxine hydrochloride0.01
Riboflavin0.005
Thiamin0.005
Nicotinic acid0.005
Pantothenic acid0.005
p-aminobenzoic acid0.005
Thioctic acid0.005
S7-2B120.0001
1 Total concentration of each chemical was cited from the original method (not the concentrated stock solution we use).
Table 3. Batch AD experiments under mesophilic (35 °C) and thermophilic (55 °C) conditions in 200 mL serum bottles.
SubstrateMesophilic (35 °C)Experiment Duration (Days)Thermophilic (55 °C)Experiment Duration (Days)
Control BlankMCon(-)_148TCon(-)_140
MCon(-)_248TCon(-)_240
Sample AMA_148TA_140
MA_248TA_240
Sample BMB_148TB_140
MB_248TB_240
Sample CMC_148TC_140
MC_248TC_240
Table 4. Batch AD experiment under Mesophilic (35 °C) in 4.5 L in MINI-digester.
Substrate or FeedDigester AExperiment Duration (Days)Digester BExperiment Duration (Days)
Sample E, 350 mLRun 1A31Run 1B31
Run 2A18Run 2B
(leak detected so no biogas measurement, but final digester mixed liquor analyzed)
18
Table 5. Biogas scrubbing trials in MINI-digester (4.5 L with gas scrubbing using Sample D).
SubstrateMesophilic Anaerobic Digestion with Biogas Scrubbing Trials
Sample A, 308.8 mL, 11 daysS1
Sample B, 30 mL, 14 daysS2
Sample B, 10.3 mL, 15 daysS3
Sugar 5 g, 9 daysControl (+)
Sample B, 10.88 mL, 16 daysS4
Sample A, 308.8 mL, 11 daysS5
Sample B, 20 mL, 13 daysS6
Table 6. Characteristics of microbrewery waste stream samples.
SubstrateTS
(% g/g)
VS
(% TS)
COD
(g/L)
pH
Sample A1.53 ± 0.0197.59 ± 0.2514.47 ± 0.645.06 ± 0.02
Sample B9.05 ± 1.8392.06 ± 0.21102.50 ± 5.004.55 ± 0.09
Sample C17.99 ± 0.1992.05 ± 0.12124.17 ± 3.824.85 ± 0.06
Sample D2.74 ± 0.094.17 ± 3.260.98 ± 0.0112.03 ± 0.15
Sample E2.44 ± 0.1695.15 ± 0.5925.22 ± 1.674.16 ± 0.03
Table 7. Scale up of Anaerobic digestion in a microbrewery.
Operations Factors
Sugar mash water, A (gal/week)1200
Spent yeast with hops, B (gal/week)93
Spent yeast without hops, C (gal/week)30
Total Methane Potential (m3 STP/week)51.72
Energy Potential (BTU/week)1,813,600
Biogas Utilization Options
CaseRetail price
(USD)
Savings per week
(USD)
1. Propane Displacement20/tank109.09
2. Natural gas Displacement3/MMBtu5.44
3. Electricity equivalents0.10/kWh15.94
Disclaimer/Publisher’s Note: The statements, opinions and data contained in all publications are solely those of the individual author(s) and contributor(s) and not of MDPI and/or the editor(s). MDPI and/or the editor(s) disclaim responsibility for any injury to people or property resulting from any ideas, methods, instructions or products referred to in the content.