Article

Energy Systems in Transition: A Regional Analysis of Eastern Europe’s Energy Challenges

by
Robert Santa
1,2,*,
Mladen Bošnjaković
3,
Monika Rajcsanyi-Molnar
4 and
Istvan Andras
4
1
Department of Mechanical Engineering and Material Sciences, Institute of Engineering Sciences, University of Dunaujvaros, Tancsics Mihály 1/A, 2400 Dunaujvaros, Hungary
2
Aziz Sanjar Food Safety Laboratory, Azerbaijan State University of Economics (UNEC), 6 Istiglaliyyat Str., AZ1001 Baku, Azerbaijan
3
Technical Department, University of Slavonski Brod, Ulica 108. Brigade ZNG 36, 35000 Slavonski Brod, Croatia
4
Institute of Social Sciences, University of Dunaujvaros, 2400 Dunaujvaros, Hungary
*
Author to whom correspondence should be addressed.
Clean Technol. 2025, 7(4), 84; https://doi.org/10.3390/cleantechnol7040084
Submission received: 16 August 2025 / Revised: 4 September 2025 / Accepted: 10 September 2025 / Published: 2 October 2025

Abstract

This study presents a comprehensive assessment of the energy systems in eight Eastern European countries—Bulgaria, Croatia, the Czech Republic, Hungary, Poland, Romania, Slovakia, and Slovenia—focusing on their energy transition, security of supply, decarbonisation, and energy efficiency. Using principal component analysis (PCA) and clustering techniques, we identify three different energy profiles: countries dependent on fossil fuels (e.g., Poland, Bulgaria), countries with a balanced mix of nuclear and fossil fuels (e.g., the Czech Republic, Slovakia, Hungary), and countries focusing mainly on renewables (e.g., Slovenia, Croatia). The sectoral analysis shows that industry and transport are the main drivers of energy consumption and CO2 emissions, and the challenges and policy priorities of decarbonisation are determined. Regression modelling shows that dependence on fossil fuels strongly influences the use of renewable energy and electricity consumption patterns, while national differences in per capita electricity consumption are influenced by socio-economic and political factors that go beyond the energy structure. The Decarbonisation Level Index (DLI) indicator shows that Bulgaria and the Czech Republic achieve a high degree of self-sufficiency in domestic energy, while Hungary and Slovakia are the most dependent on imports. A typology based on energy intensity and import dependency categorises Romania as resilient, several countries as balanced, and Hungary, Slovakia, and Croatia as vulnerable. The projected investments up to 2030 indicate an annual increase in clean energy production of around 123–138 TWh through the expansion of nuclear energy, the development of renewable energy, the phasing out of coal, and the improvement of energy efficiency, which could reduce CO2 emissions across the region by around 119–143 million tons per year. The policy recommendations emphasise the accelerated phase-out of coal, supported by just transition measures, the use of nuclear energy as a stable backbone, the expansion of renewables and energy storage, and a focus on the electrification of transport and industry. The study emphasises the significant influence of European Union (EU) policies—such as the “Clean Energy for All Europeans” and “Fit for 55” packages—on the design of national strategies through regulatory frameworks, financing, and market mechanisms. This analysis provides important insights into the heterogeneity of Eastern European energy systems and supports the design of customised, coordinated policy measures to achieve a sustainable, secure, and climate-resilient energy transition in the region.

1. Introduction

Energy systems and their development have become a key factor in the economic, environmental, and security challenges facing countries around the world. Energy plays a central role in several aspects of the European Union’s (EU) foreign and security policy. EU Member States are highly dependent on energy imports and obtain more than half of their energy needs from abroad, even though renewable energy sources have also gained a significant share in recent years [1]. Energy imports have a significant economic impact as they influence the functioning of national economies and the EU economy as a whole, as well as energy prices in general. Therefore, the security of energy supply is fundamental to stability and economic growth and therefore remains an important issue for the Common Foreign and Security Policy (CFSP) [2].
The availability and price of energy are of paramount importance in shaping international relations and the geopolitical environment [3]. Disruptions in energy supply can lead to economic, political, environmental, and social instability, which has a direct impact on national security and regional stability and can increase the risk of conflict. Ensuring a reliable and secure energy supply is therefore also a central task of the CFSP. What is meant by energy security depends on a country’s geographical location, its economic conditions, its access to resources, and the prevailing political environment and will. For an energy producer, a transit country, and an importer, energy security can mean very different things. National interests therefore characterise energy strategies, leading to different perspectives even among EU Member States. Furthermore, the interests and priorities of energy exporters, importers, and transit countries are often at odds with each other. The production, export, and transport of energy resources have therefore become strategic issues, making the stability of energy-producing countries and regions crucial to maintaining the balance between supply and demand—a factor that is reflected in the CFSP [4]. Within international organisations, it is often difficult for member states to reach a consensus on what constitutes a threat and to whom. This hinders both internal decision-making and cross-organisational cooperation in the field of energy security.
As part of its fight against climate change, the EU has set itself ambitious targets for the energy transition and increasing the share of renewable energy sources [5,6]. Achieving these goals requires a strong commitment from the member states. However, as mentioned above, differences in available energy resources, geographical location, and historical and geopolitical conditions lead to different perceptions of energy security and energy policy [7]. The Russian–Ukrainian war forced the EU to accelerate its strategic goals to achieve climate neutrality and bring forward its implementation. The war has thus accelerated the ongoing energy transition and the spread of renewable energies. In addition, the issue of the EU’s dependence on Russian energy imports shifted from the EU’s energy policy agenda to the foreign and security policy agenda, highlighting how vulnerable the Union has become due to its dependence on fossil fuels [8]. In the coming decades, the transition to renewable energy systems will coexist with geopolitics based on oil and gas. Several scenarios describe possible ways to achieve global climate neutrality by 2050. The results show that oil and gas will remain part of the energy mix after 2050, albeit in significantly reduced proportions. This means that economies dependent on oil and gas exports will not disappear completely from the geopolitical stage and could even benefit from the uncertainties associated with the energy transition [9].
The energy transition entails significant geopolitical changes that reorganise the balance of power, create new forms of competition, and—as in the past—make geographical location a decisive factor [10]. This issue divides the EU member states into two groups, along a line between older and newer members [11]. The states that joined between 1958 and 1995 and have better developed energy markets and modern infrastructures see the rise in renewable energy as an economic opportunity to reduce dependence on imports and greenhouse gas emissions. For them, the integrated market enables a collective response to the challenges, and the energy transition is driven by internal societal processes, with public support for climate policy measures [12]. In contrast, the Member States that joined the EU after 2004 have an outdated energy infrastructure that is not suited to ensuring much better interconnection to guarantee security of supply. Their energy markets are less resilient, the introduction of renewables is slower, and they view the energy transition and market integration primarily as risks. Modernisation in all areas of the energy sector would require significant investment.
They are therefore focusing on the diversification of gas supply and the expansion of gas infrastructure within the EU [11]. In these Central and Eastern European countries, climate change is not a political priority, and public demand for action is low. Nevertheless, they have committed to the EU climate targets, mainly due to external pressure. Dependence on energy imports has a strong influence on external relations, as Member States retain sovereignty over their energy mix and, in general, security of supply. Again, the gap between older and newer members is evident: the former Eastern Bloc countries remain highly dependent on Russian gas imports, while Germany sourced gas directly from the Russian Federation via the Nord Stream pipeline and built a second pipeline (Nord Stream 2), which ultimately never became operational [12].
So, in Eastern Europe, the diversity of energy production structures, consumption patterns, and import dependency makes it difficult to formulate a harmonised regional policy. This heterogeneity results from the different levels of domestic primary energy resources, energy infrastructure, and economic factors that influence energy intensity and emissions. In recent years, scientific research has increasingly focused on the complexity of energy systems in Europe, emphasising the challenges of energy transition, decarbonisation, and security in different regional contexts. Kuzemko et al. [13] examine the different pace of policy convergence between EU member states under frameworks such as the Green Deal and emphasise the crucial role of national interests. They find that such interests have a strong influence on how EU-wide policies are implemented in individual countries. Doig et al. [14] assess the willingness of EU member states to step up their climate action by evaluating their ambition and progress on emission reduction, renewable energy, and energy efficiency compared to the goals of the Paris Agreement. Their results show that the level of commitment varies and that some Member States definitely need to step up their efforts. Tian Mengxuan et al. [15] analyse the bidirectional causal relationship between technological innovation and energy efficiency in Central and Eastern European countries. They find that innovation significantly improves energy efficiency in some countries (e.g., the Czech Republic, Latvia, Lithuania), while energy efficiency also drives innovation in Estonia, Hungary, and Slovakia. Lamb et al. [16] identify countries with consistent long-term emission reductions and describe the pace, depth, and sectoral patterns of these reductions in order to understand the trajectory of effective climate action.
Mitić et al. [17] examine Southeast European countries and discover a short-term bidirectional causality between CO2 emissions and employment and a causal relationship between available energy and employment and Gross Domestic Product (GDP) growth, emphasising the interlinked relationships between the economy and the environment.
Nichifor et al. [18] use spatial econometrics to evaluate investments in renewable energy and government environmental spending to reduce CO2 emissions in the region. They conclude that renewable energy investments have positive but localised effects, while government spending has diminishing returns and significant spill-over effects on neighbouring countries.
Ioan et al. [19] analyse Bulgaria, Poland, Romania, and Hungary to understand the factors influencing energy efficiency and to address the “green dilemma” of reconciling efficiency gains with economic development. Their analysis shows that energy consumption patterns, the share of renewable energy, and investments have a decisive influence on efficiency outcomes.
Apata [20] investigates multi-energy systems (MES) as a driver of decarbonisation through the integration of different energy sources using the Complex Adaptive Systems Framework. The study proposes an Adaptive Decarbonisation Pathway Framework and identifies three main pathways —renewable energy integration, energy storage, and sector coupling—which have been validated in Denmark, Germany, and China.
Alabi et al. [21] provide an overview of zero-carbon multi-energy systems (ZCMES), focusing on the challenges in technology, system design, and modelling to achieve carbon neutrality. They highlight current research gaps and suggest future research directions to improve the feasibility of ZCMES as a primary strategy for decarbonisation.
These research findings emphasise the need for a comprehensive and multidimensional assessment of Eastern European energy systems, including production, consumption, emissions, and policy factors specific to this geographical context. The research context is framed by important directives and strategic frameworks of the European Union that significantly influence national and regional energy policy. The European Green Deal [22] commits member states to attain net-zero greenhouse gas emissions by 2050, guiding national energy and climate plans. The Renewable Energy Directive (EU) [23] sets binding renewable targets, while the Energy Efficiency Directive [24] mandates sectoral improvements in energy use.
Regulation (EU) 2018/842 of the European Parliament and of the Council [25] obliges EU Member States to reduce greenhouse gas emissions annually from 2021 to 2030, thereby contributing to climate action to meet the obligations of the Paris Agreement. The Clean Energy for All Europeans Package [22] seeks to empower consumers and enhance market integration, and the more recent Fit for 55 package (2021) [26] aims to reduce emissions by 55% by 2030, advancing measures across taxation, emissions trading, and infrastructure. These directives form an essential political background that influences the national energy strategies in the Eastern European region. They drive both harmonisation efforts and ongoing challenges related to energy infrastructure modernisation, fossil fuel phase-out, and regional cooperation.
Energy systems in Eastern Europe are undergoing a complex transformation driven by ambitious EU climate targets, security concerns, and differing national circumstances. While many studies have addressed aspects of the European energy transition, this study advances the field in several ways that set it apart from previous literature.
First, this study adopts a comprehensive multidimensional approach by including energy production, sectoral consumption, CO2 emission patterns, and novel composite indicators such as the Decarbonisation Level Index (DLI). In contrast to many previous works, which often focus on single dimensions—such as the integration of renewable energy or emissions trends—our analysis combines these dimensions to capture the structural heterogeneity in eight Eastern European countries. This enables a holistic assessment of the energy transition landscape, revealing nuanced interdependencies and trade-offs between energy security, decarbonisation, and economic factors.
Second, the study applies advanced multivariate statistical techniques, including Principal Component Analysis (PCA), cluster analysis, and regression modelling, to analyse complex datasets provided by Eurostat, the International Energy Agency (IEA), and the European Environment Agency (EEA) over several years. This methodological rigour facilitates the identification of underlying patterns and country groupings that are not apparent through univariate analyses. For example, PCA and clustering quantitatively validate the distinction between countries where fossil fuels dominate and countries where nuclear and renewables dominate. Such data-driven classification supports the formulation of targeted policy recommendations tailored to specific country profiles, an improvement over the generic “one-size-fits-all” frameworks often found in the literature.
Third, this study introduces and operationalises the novel indicator of Decarbonisation Level Index (DLI), which captures a country’s ability to meet its energy needs from domestic sources, while balancing security of supply and sustainability. While previous studies have examined import dependency or the share of renewable energies individually, the DLI combines these into a single indicator that is aligned with the decarbonisation targets. By linking the DLI to sectoral emissions intensity and future energy investments, the study provides policy makers with a practical benchmarking tool to simultaneously monitor resilience and climate performance.
Furthermore, the work is characterised by the fact that it explicitly links EU policy packages—such as “Clean Energy for all Europeans” and “Fit for 55”—with national energy strategies in Eastern Europe. This contextualisation illustrates how regulatory frameworks drive heterogeneous energy transformations that are shaped by historical infrastructures and geopolitical realities. In contrast to some studies that focus on Western Europe or summarise EU-level trends, our regional focus fills a critical knowledge gap by addressing the ‘multi-tempo’ nature of the energy transition and highlighting the different challenges faced by the newer EU members.
Finally, the inclusion of quantified projections through 2030, based on planned investments in nuclear expansion, renewable energy deployment, coal phase-out, and efficiency improvements, provides an actionable outlook on the expected reduction in CO2 emissions and improvement of energy security. This forward-looking analysis—coupled with policy scenario discussions—goes beyond the static assessments typical of the existing literature and provides a decision support framework that can evolve with new technological and geopolitical developments.
The article is organised as follows: first, we describe the datasets and variables used in the analysis; then, we present the results of the multivariate analyses and regression models on energy consumption, emissions, and independence; finally, we draw conclusions on the policy implications of regional energy systems.

2. Materials and Methods

The aim of this research is to develop a structured understanding of similarities and differences among selected countries based on their energy consumption and emission data, and to rank these countries by introducing a new indicator—the Decarbonisation Level Index (DLI). The analyses employ multivariate statistical methods, with a particular focus on Principal Component Analysis (PCA), clustering, and linear regression models.
Principal Component Analysis (PCA) is a dimensionality reduction method that reduces large datasets to fewer variables while retaining important data trends. It simplifies the data by identifying uncorrelated components that capture most of the variance, making the analysis faster and more efficient [27]. Clustering is an unsupervised learning technique that groups similar data points into clusters based on their inherent patterns. It does not require labelled data but identifies structures in the dataset and groups them accordingly [28]. A linear regression model is a statistical tool that describes the relationship between a dependent variable (or response) and one or more independent variables by fitting a straight line to the data [29].

2.1. Data Preparation and Normalisation

The dataset was sourced from the publicly available databases of Eurostat and the International Energy Agency (IEA), covering the period from 2000 to 2023. The selected countries include the Czech Republic, Croatia, Poland, Hungary, Romania, Slovakia, Slovenia, and Bulgaria.
After normalisation, the data matrix elements are calculated as shown in Equation (1) [30]:
x i j n o r m = x i j μ j σ j
where
x i j is the value of the j t h variable for the i t h country;
μ j is the mean of the j t h variable;
σ j is the standard deviation of the j t h variable.

2.2. Principal Component Analysis (PCA)

To reduce dimensionality and identify the key structural factors underlying the data, PCA was applied. This method transforms the correlated input variables into new, orthogonal variables (principal components), facilitating dimensionality reduction. PCA compresses a large number of correlated variables into a smaller set of orthogonal principal components as shown in Equation (2) [30]:
Z = X W
where
X = R n · p is the normalised input matrix (n: number of countries, p : number of variables);
W = R p · k is the weight matrix containing principal component directions;
Z = R n · k is the principal component matrix with k < p .
The principal components were derived from the eigenvalue decomposition of the covariance matrix, as shown in Equation (3):
= X T X , w i = λ i w i
The eigenvectors corresponding to the largest eigenvalues λ i were selected as principal components.

2.3. Cluster Analysis

To identify groups of countries with similar energy and emission profiles, cluster analysis was conducted. The optimal number of clusters was determined using the elbow method and silhouette coefficient evaluation. Both K-means and hierarchical clustering algorithms were employed, and their results were compared. The energy mix and CO2 intensity of countries within each cluster were analysed in detail, and their positions in the principal component space were visualised.
The objective function minimised in K-means clustering is shown in Equation (4) [30]:
J = i = 1 k x C i x μ i 2
where
C i is the i t h cluster;
μ i is the centroid of cluster C i .

2.4. Regression Analysis

To explore the impact of various factors (e.g., share of renewables, fossil fuel dependency, and role of nuclear energy) on CO2 intensity, a linear multiple regression model was developed. Explanatory variables included the structural shares of energy sources, while the dependent variables were per capita CO2 emissions and GDP-related CO2 intensity. Model significance was assessed using the F-test, and variable importance was evaluated through standardised regression coefficients. The relationship between the principal components and the new DLI indicator was analysed using linear regression, as shown in Equation (5) [31]:
Y = β 0 + i = 1 k β i Z i + ϵ
where
Y is the DLI value;
Z i are the principal component scores;
β i are regression coefficients;
ϵ is the error term.
Model fit was evaluated by R2 and standard error.

2.5. Data and Time Period

The data used for the analysis were sourced from multiple reliable international databases:
  • IEA (International Energy Agency) [32]: Primarily energy balances, primary energy sources, and electricity mix data.
  • Eurostat [33]: Detailed statistics on energy consumption broken down by sector (industry, households, transport, services).
  • EEA (European Environment Agency) [34]: Annual reports on CO2 emissions and their sources.
Following harmonisation of the sources, the data were structured in a unified format by country and indicator for use in the analysis.
The data collection period corresponds to the year 2023, except for carbon dioxide emissions, where the latest available year was 2022. This temporal approximation is necessary but justified based on the energy and emission profiles of the countries involved. Trends in the energy mix of the examined countries were also analysed over the period from 2000 to 2023.
The analysis covers the following Central and Eastern European countries, which share similar historical and economic backgrounds and face common challenges in energy transition and decarbonisation:
  • Bulgaria (BG);
  • Croatia (CRO);
  • Czech Republic (CZ);
  • Hungary (HU);
  • Poland (PL);
  • Romania (RO);
  • Slovakia (SK);
  • Slovenia (SI).
The selection of these countries is justified by their geographic proximity, EU membership, and structurally similar energy profiles and economic development levels.

2.6. Analysed Data Types

The main energy indicators characterising the countries can be classified by the IEA (International Energy Agency) [32]. In our study, we considered the energy characteristics of the eight countries as input data:
  • Total energy supply (domestic energy production, energy import and exports, energy transformation, electricity generation, final energy consumption, energy consumption by sector).
The total energy supply (TES) is the energy produced in a country or imported into a country minus the energy stored or exported from the country. It is therefore the energy required to supply end consumers. Some of the energy sources are used directly, while most are converted into fuels or electricity for final consumption [32].
  • Total CO2 emissions from energy (share of global emissions, CO2 emissions from fuel combustion, per capita CO2 emissions, CO2 emissions by fuel, CO2 emissions by sector, electricity and heat producers).
The burning of fossil fuels is one of the main sources of greenhouse gas emissions that contribute significantly to climate change. Despite efforts to reduce global greenhouse gas emissions, measurements show that they are still increasing [32].
  • Sources of electricity generation (total electricity production, electricity imports and exports, CO2 emissions from power generation, per capita electricity consumption, final consumption of electricity).
Electricity can be generated by burning fossil fuels, by using nuclear fuels, or by utilising renewable energy sources (hydropower, solar energy, wind energy, ocean energy, and biomass) [32].
  • Share of renewables in energy consumption (share of modern renewables in final energy consumption, biofuels and waste, renewable electricity generation, hydro, renewable heat)
Renewable energy sources are becoming a strategically important source of energy as they contribute significantly to the reduction in greenhouse gas emissions but also reduce the country’s dependence on imported fossil fuels. Renewable energy sources are mainly used for electricity generation and, to a lesser extent, for the production of thermal energy (for heating buildings and for technological purposes in industry). Renewable energy sources (hydrogen, electricity) are also a strategic solution for the decarbonisation of transport [32].

2.7. Indicators and Derived Metrics

To enable a comprehensive comparative assessment of the energy and climate performance of different countries, several key indicators and derived metrics were defined. These indicators provide insights into the carbon intensity of energy consumption, energy efficiency, energy import dependence, and the role of low-carbon energy sources in electricity generation.

2.7.1. Carbon Intensity (CO2 Intensity)

The CO2 intensity of final energy consumption represents the amount of carbon dioxide emitted per unit of final energy used, as calculated in Equation (6) [32]:
C O 2 i n t e n s i t y = E C O 2 E f i n a l g C O 2 M J
where
E C O 2 —annual CO2 emissions (grams);
E f i n a l —final energy consumption (MJ).

2.7.2. Energy Intensity

Energy intensity measures the amount of final energy consumed to produce one unit of economic output, as calculated in Equation (7) [33]:
E n e r g y   I n t e n s i t y = E p r i m a r y G D P T J m i l l i o n   E U R
where
E p r i m a r y —primary energy consumption (TJ);
GDP—gross domestic product (in million euros).
This is a proxy for energy efficiency. Lower energy intensity generally indicates a more energy-efficient economy.

2.7.3. Import Ratio

The import ratio captures the share of energy that is imported compared to the total energy supply, as calculated in Equation (8) [1]:
I m p o r t   R a t i o = N e t   E n e r g y   I m p o r t s G r o s s   A v a i l a b l e   E n e r g y 100 %
High import ratios can signal dependency on foreign energy sources and potential energy security risks.

2.7.4. Share of Renewables in Electricity Generation

This indicator shows the contribution of renewable energy sources (wind, solar, hydro, biomass, etc.) to electricity production, as calculated in Equation (9) [32]:
R e n e w a b l e   S h a r e = E l e c t r i c i t y   f r o m   R e n e w a b l e s T o t a l   E l e c t r i c i t y   G e n e r a t i o n 100 %
It reflects the transition to low-carbon and sustainable energy systems.

2.7.5. Nuclear Energy Share and Coal Share in Electricity Generation

Similarly, the nuclear share and coal share are calculated as the proportion of electricity generated from nuclear and coal sources, respectively [33]. Equations (10) and (11) show these calculations:
N u c l e a r   S h a r e = E l e c t r i c i t y   f r o m   N u c l e a r   e n e r g y T o t a l   E l e c t r i c i t y   G e n e r a t i o n 100 %
R e n e w a b l e   S h a r e = E l e c t r i c i t y   f r o m   C o a l   e n e r g y T o t a l   E l e c t r i c i t y   G e n e r a t i o n 100 %
These values indicate reliance on specific generation technologies with very different environmental footprints.

2.7.6. Novel Composite Indicator: Decarbonization Level Index (DLI)

To support multidimensional assessment and ranking, a new composite indicator was developed: the Decarbonization Level Index (DLI). This index integrates multiple aspects of energy sustainability and import dependency into a single value:
D L I = w 1 C O 2 F i n a l   E n e r g y + w 2 I m p o r t   S h a r e w 3 R e n e w a b l e s w 4 N u c l e a r
where
w 1 ,   w 2 ,   w 3 ,   w 4 are weighting coefficients.
Weights can be determined either by Principal Component Analysis (PCA) or expert judgement.
A lower DLI value indicates a more favourable position in terms of decarbonization potential and energy independence.
The DLI thus combines emission intensity, energy security, and the share of low-carbon technologies, offering a synthetic measure of a country’s strategic leverage for decarbonization.

2.7.7. Calculation Basis for the Planned Developments in the Energy Mix

To quantify the impacts of the planned developments, a consistent calculation framework is required. Equations (13) and (14) describe how to determine the annual change in energy production and consumption, as well as the associated CO2 savings. This approach expresses the expected annual change in energy production or consumption in terawatt-hours (TWh). If the capacity change is known (e.g., newly installed power plants or decommissioned capacity), the expected annual energy change can be calculated as follows [33]:
E = P · C F · 8760
where
ΔE = Annual energy change (in Megawatt-hour (MWh) or TWh);
P = Capacity change (in Megawatt (MW));
CF = Capacity factor (e.g., 0.4 for 40%);
8760 = Number of hours in one year (24 × 365).
To convert from MWh to TWh, it is divided by 106 (since 1 TWh = 1,000,000 MWh).
Annual CO2 savings are usually calculated by multiplying the annual energy change by the CO2 emission factor of the displaced energy source:
C O 2 = E · E F
where
ΔCO2 = CO2 savings (in tons or million tons);
ΔE = Energy change (MWh or TWh);
EF = Emission factor (tons CO2 per MWh).
Then, it is converted to million tons (Mt) by dividing by 106.

3. Results

The following text assesses the energy autonomy, structural efficiency, and decarbonisation potential of selected Eastern European countries by integrating several indicators—namely the Decarbonisation Level Index (DLI), energy intensity, net import dependency, and the planned development of the energy mix until 2030. This approach enables a holistic evaluation of each country’s resilience, sustainability, and alignment with EU climate targets.

3.1. The Distribution of the Energy Mix (Production + Consumption)

The study analysed the energy consumption and production structures of eight Central and Eastern European countries. The analysis considered the production shares of primary energy sources (coal, crude oil, natural gas, nuclear energy, renewable energies) and the energy sources used in final energy consumption by sector (coal, crude oil, natural gas, electricity, biowaste).
Based on the results of the principal component analysis (PCA) shown in Figure 1, the first two principal components explain more than 75% of the total variance, allowing a clear distinction between the countries.
The first principal component (PC1) primarily reflects the dominance of fossil fuels (coal, oil, gas), while the second component (PC2) indicates the presence of renewable and nuclear energy sources.
PC1 also has a clear interpretation in the context of economic sectors: higher PC1 scores are associated with energy structures dominated by fossil fuels, which in industry implies higher process-related emissions and an increased need for low-carbon technology deployment, and in transport indicates a strong reliance on fossil-based fuels, making electrification and fuel switching essential. Conversely, countries with lower PC1 scores—where renewables or nuclear power account for a greater share—start the decarbonisation process from a more favourable position in terms of both greenhouse gas reduction potential and energy efficiency improvements.
Based on the analysis, the countries can be divided into three main categories:
Countries that rely heavily on fossil fuels (e.g., Poland, Bulgaria);
Countries with a more balanced energy mix based on nuclear energy (e.g., the Czech Republic, Slovakia);
Countries with an energy profile focusing on renewable energies (e.g., Slovenia, Croatia).
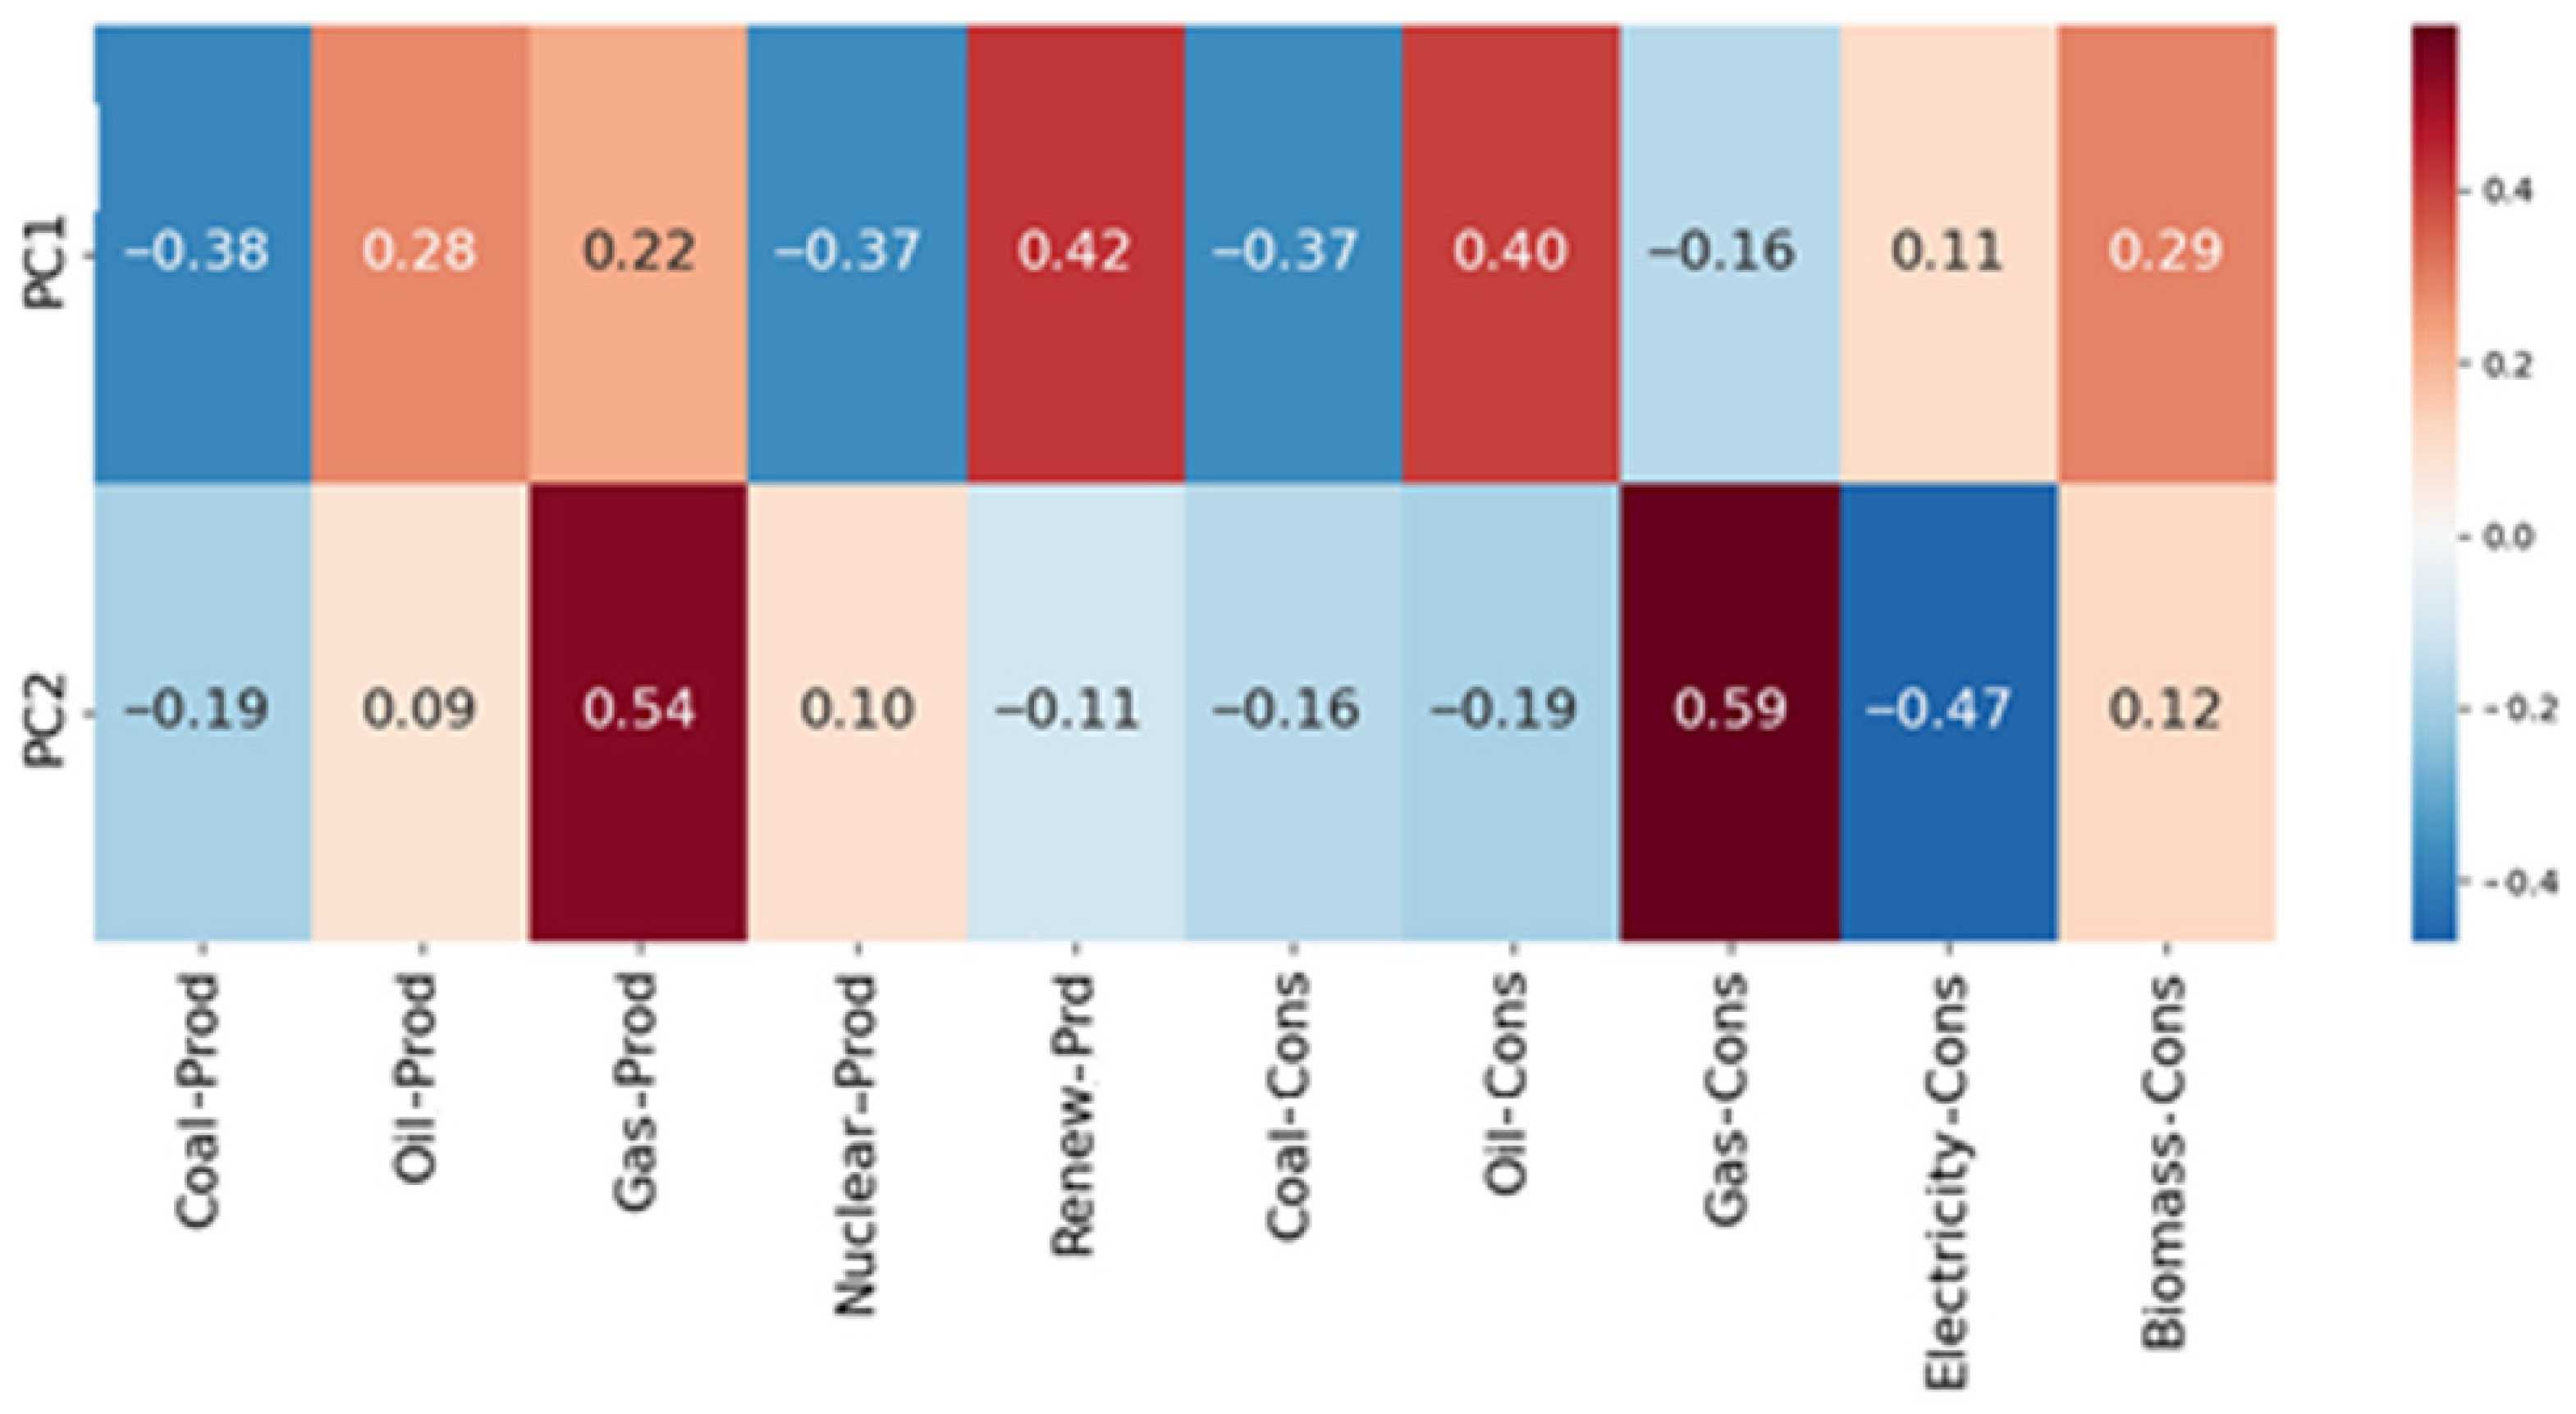
The load map in Figure 2 shows that the direction of PC1 is mainly determined by the consumption of crude oil and natural gas, while in PC2, the production of nuclear energy and renewable energies has the greatest influence. Electricity consumption makes a moderate contribution to all components but does not dominate any of them.
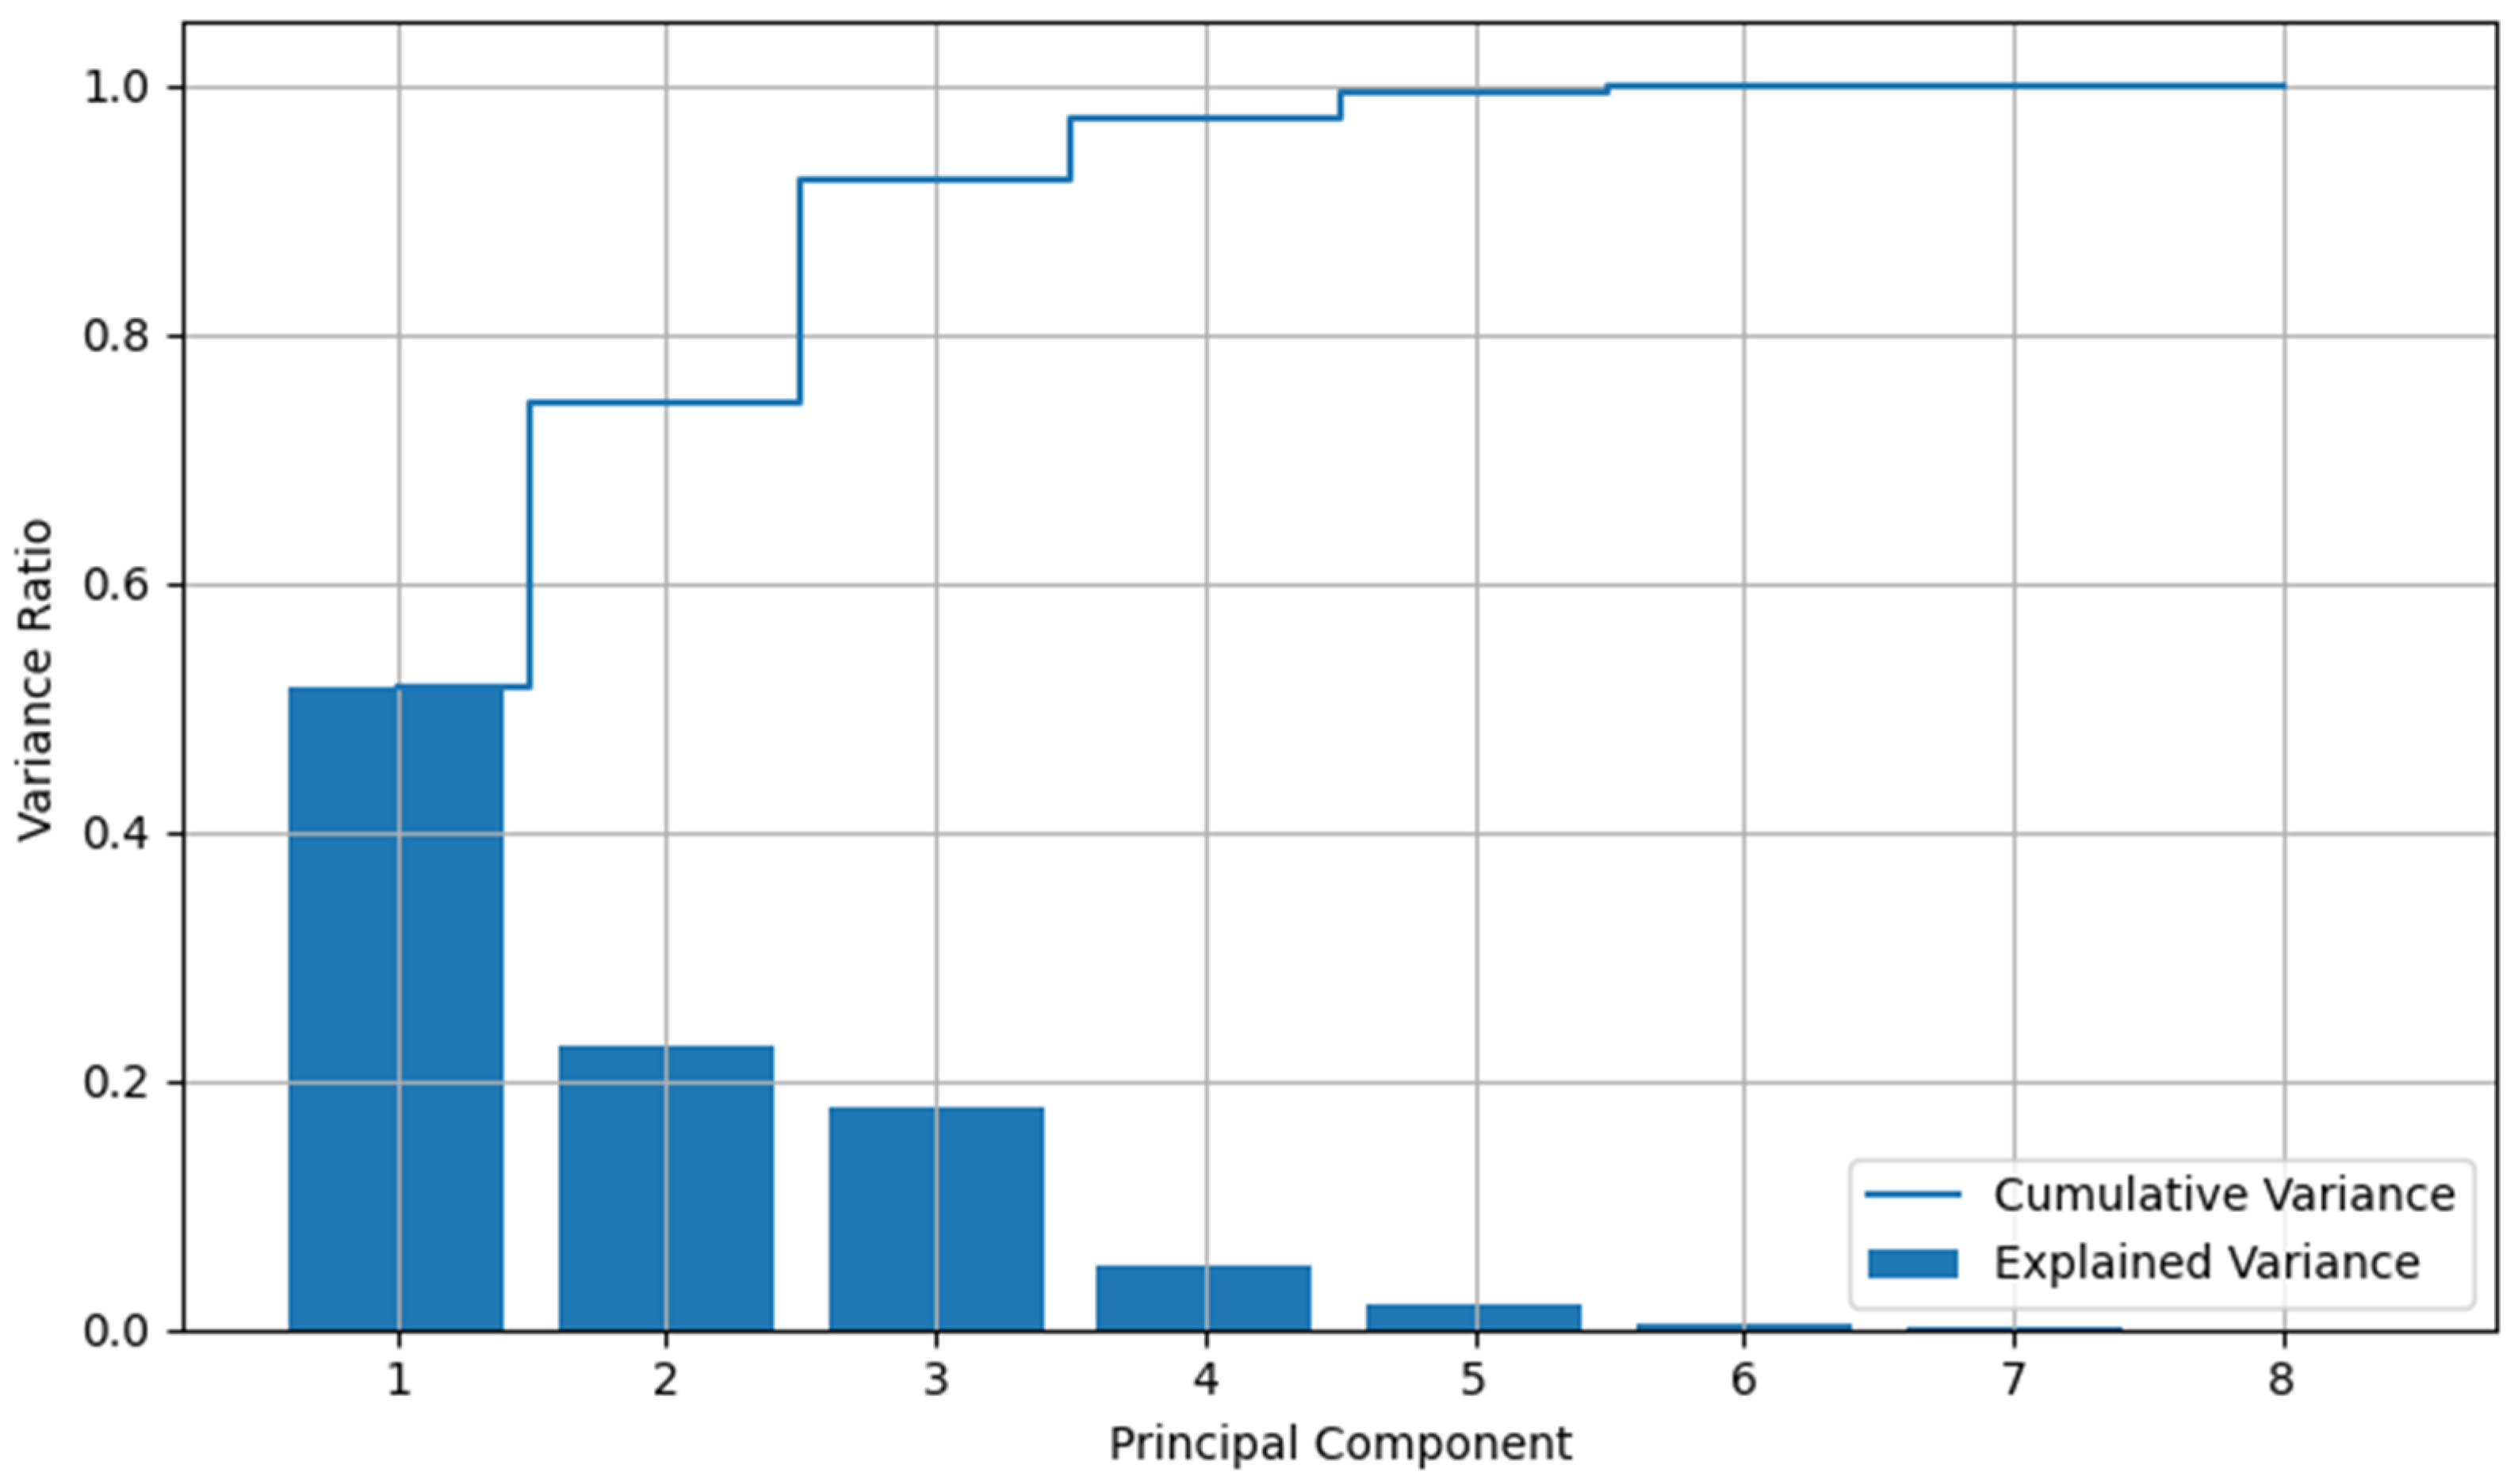
Figure 3 shows that the first two components together capture about 76% of the information contained in the original dataset, which indicates that dimensionality reduction does not lead to a significant loss of information.
Therefore, PCA proves to be a suitable tool for revealing structural differences in the energy mix. However, in the case of per capita electricity consumption models, electricity use per inhabitant is influenced by additional drivers—such as GDP per capita, climate conditions, industrial structure, digitalisation levels, and household consumption patterns—which are not captured by the current predictors (Table 1). Similar observations are found in IEA (2022) [32] and Eurostat (2023) [33], confirming that electricity demand responds more strongly to socio-economic and behavioural factors than to the composition of the national energy balance.
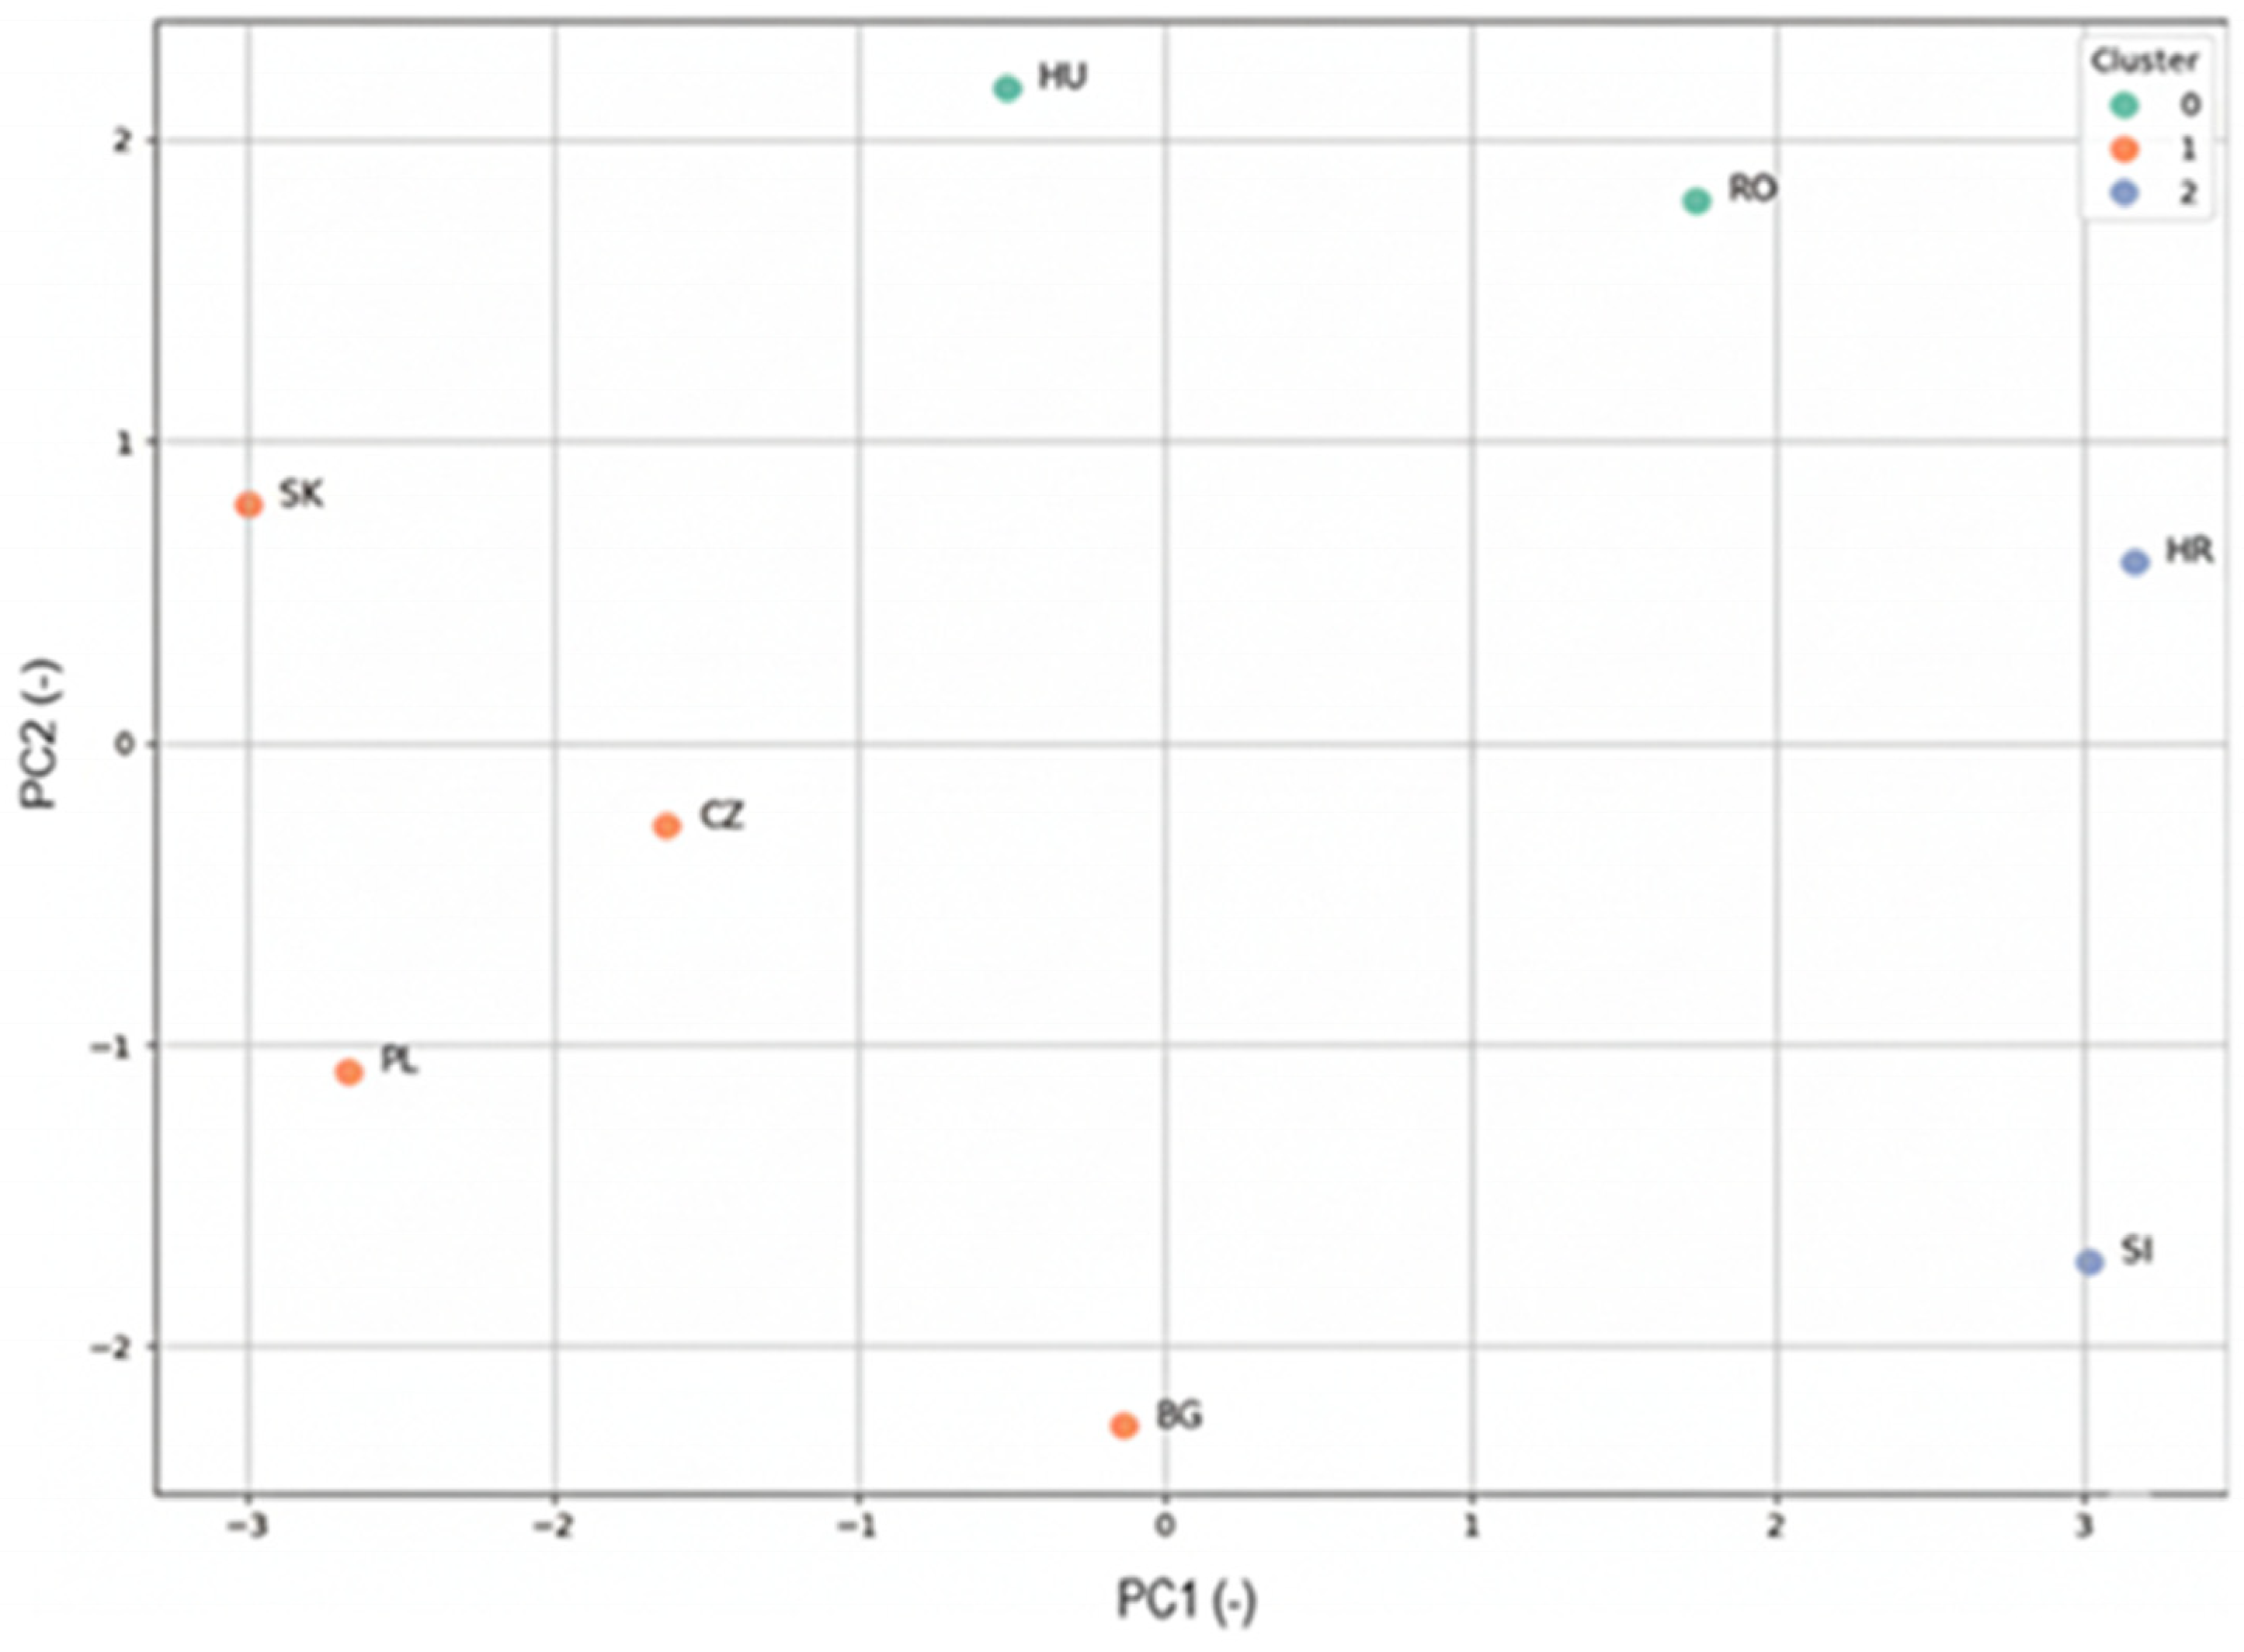
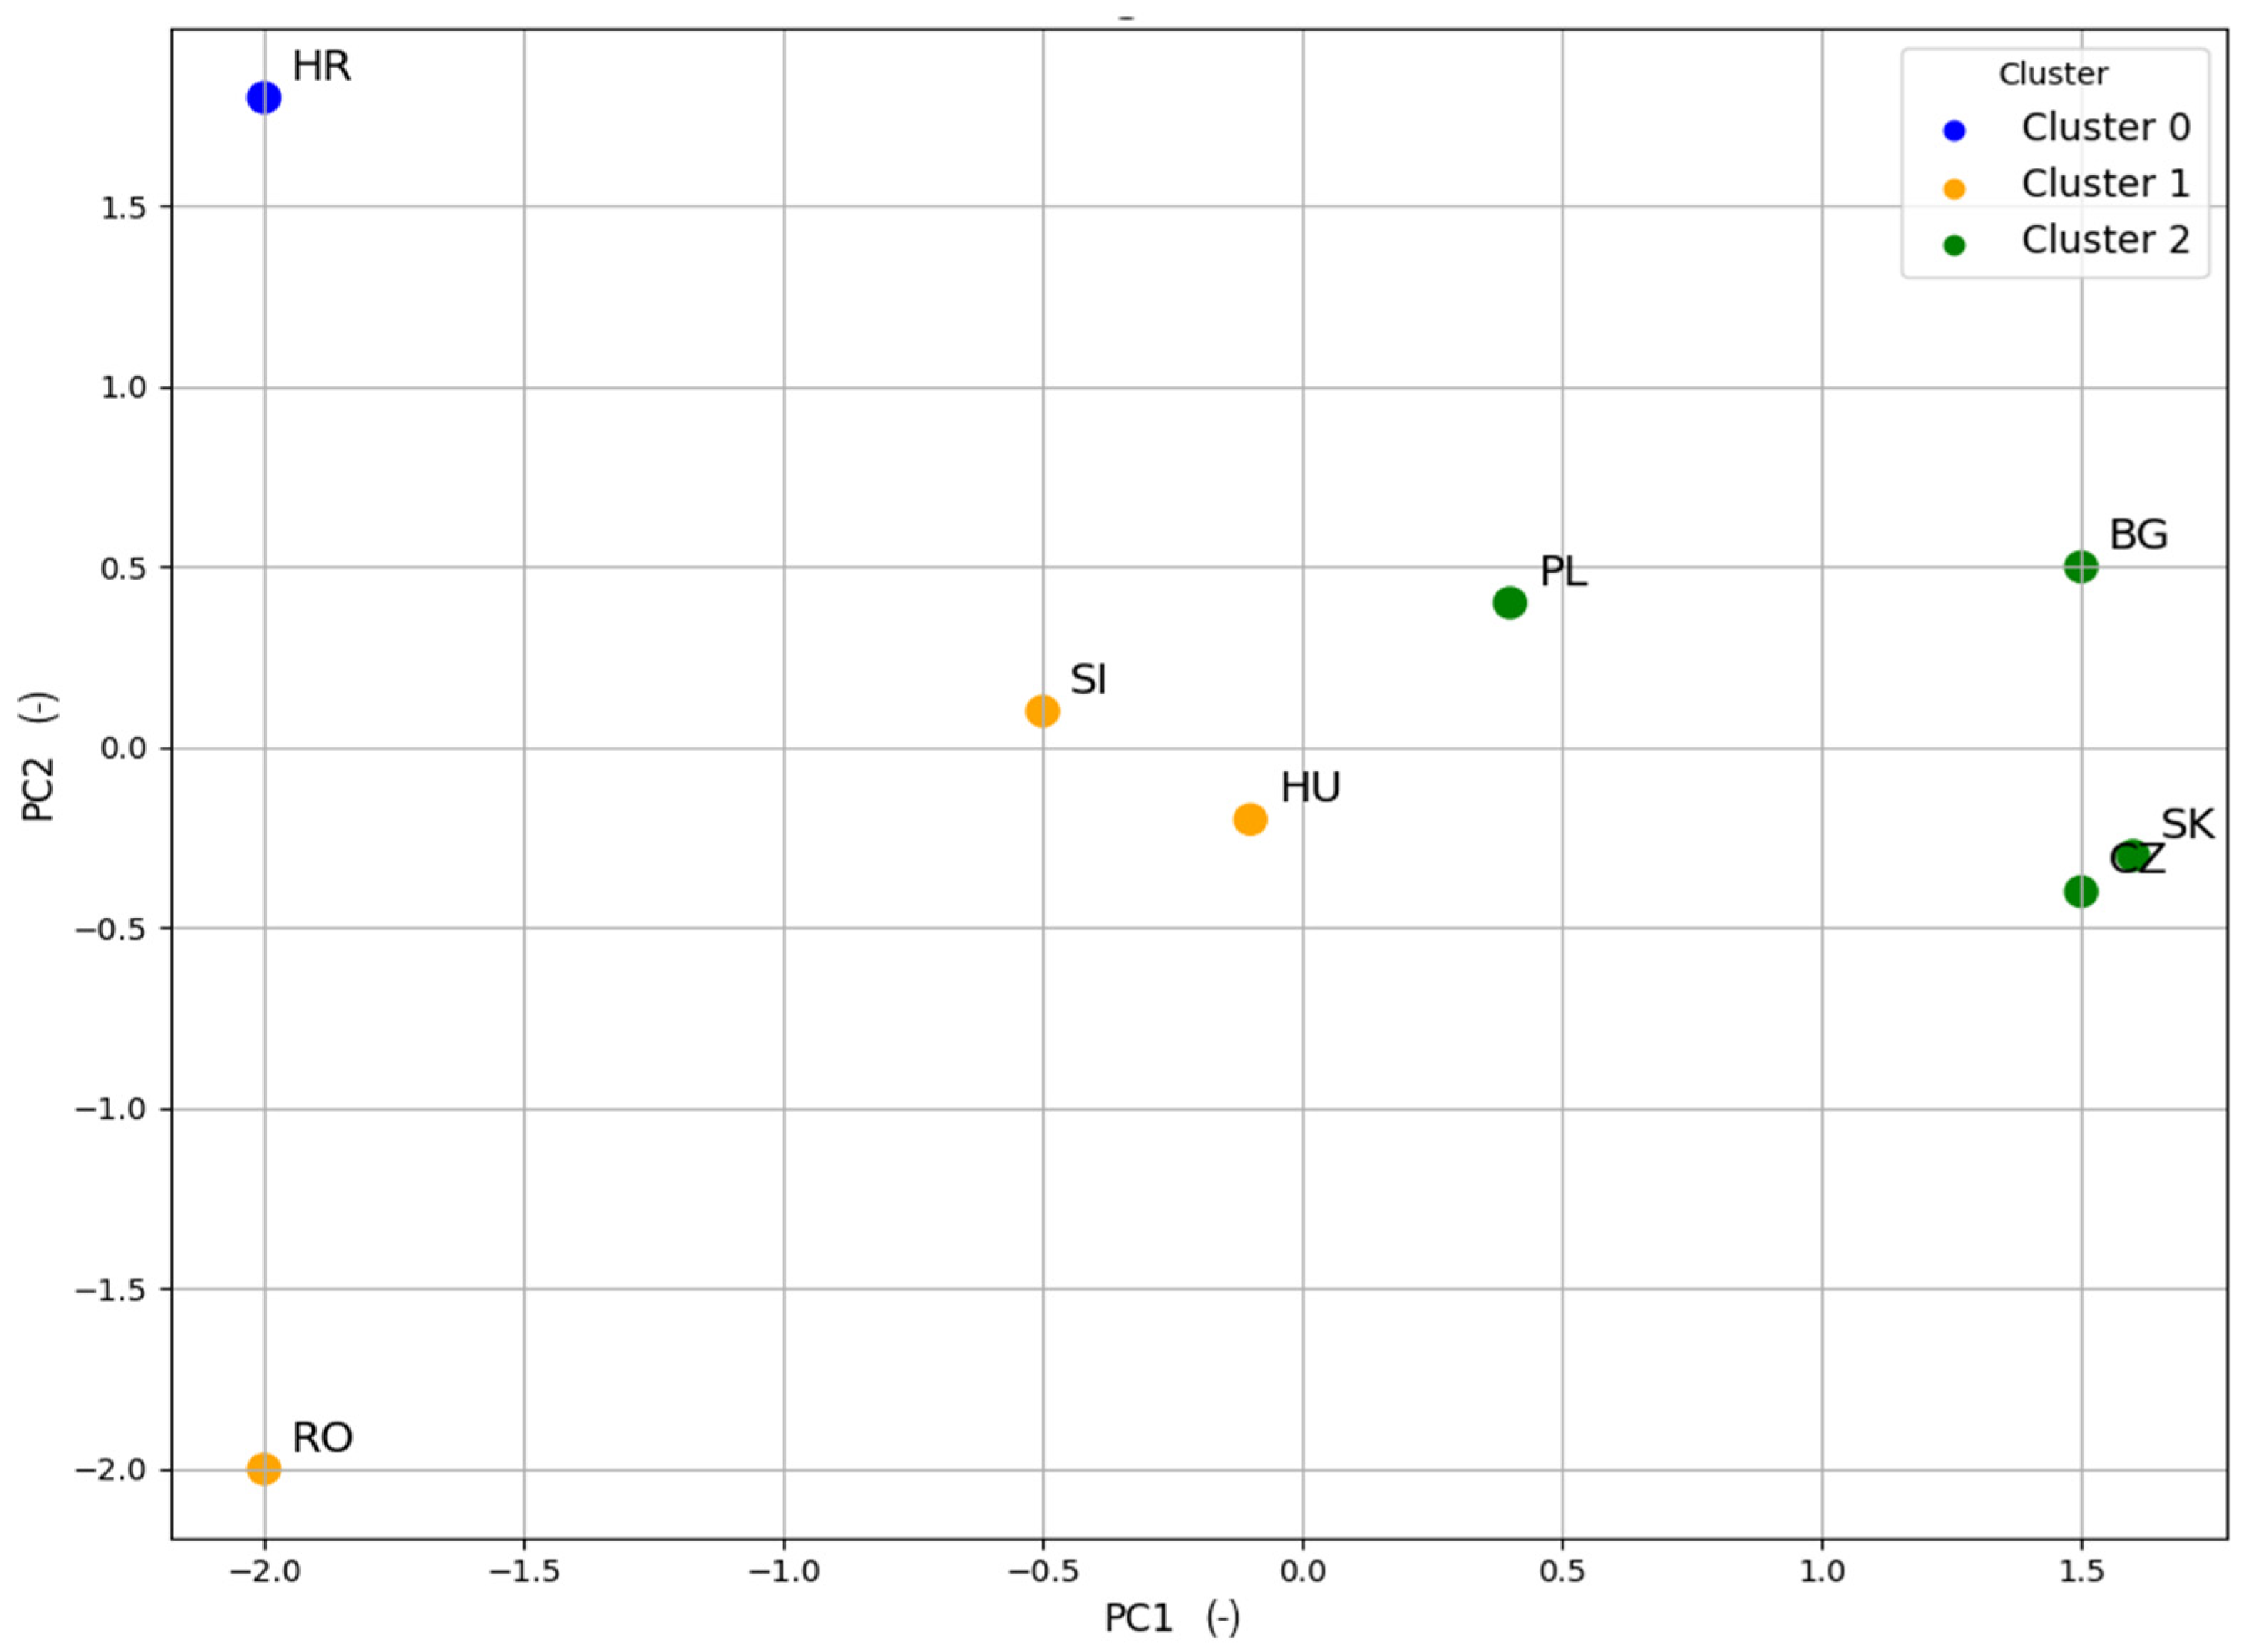
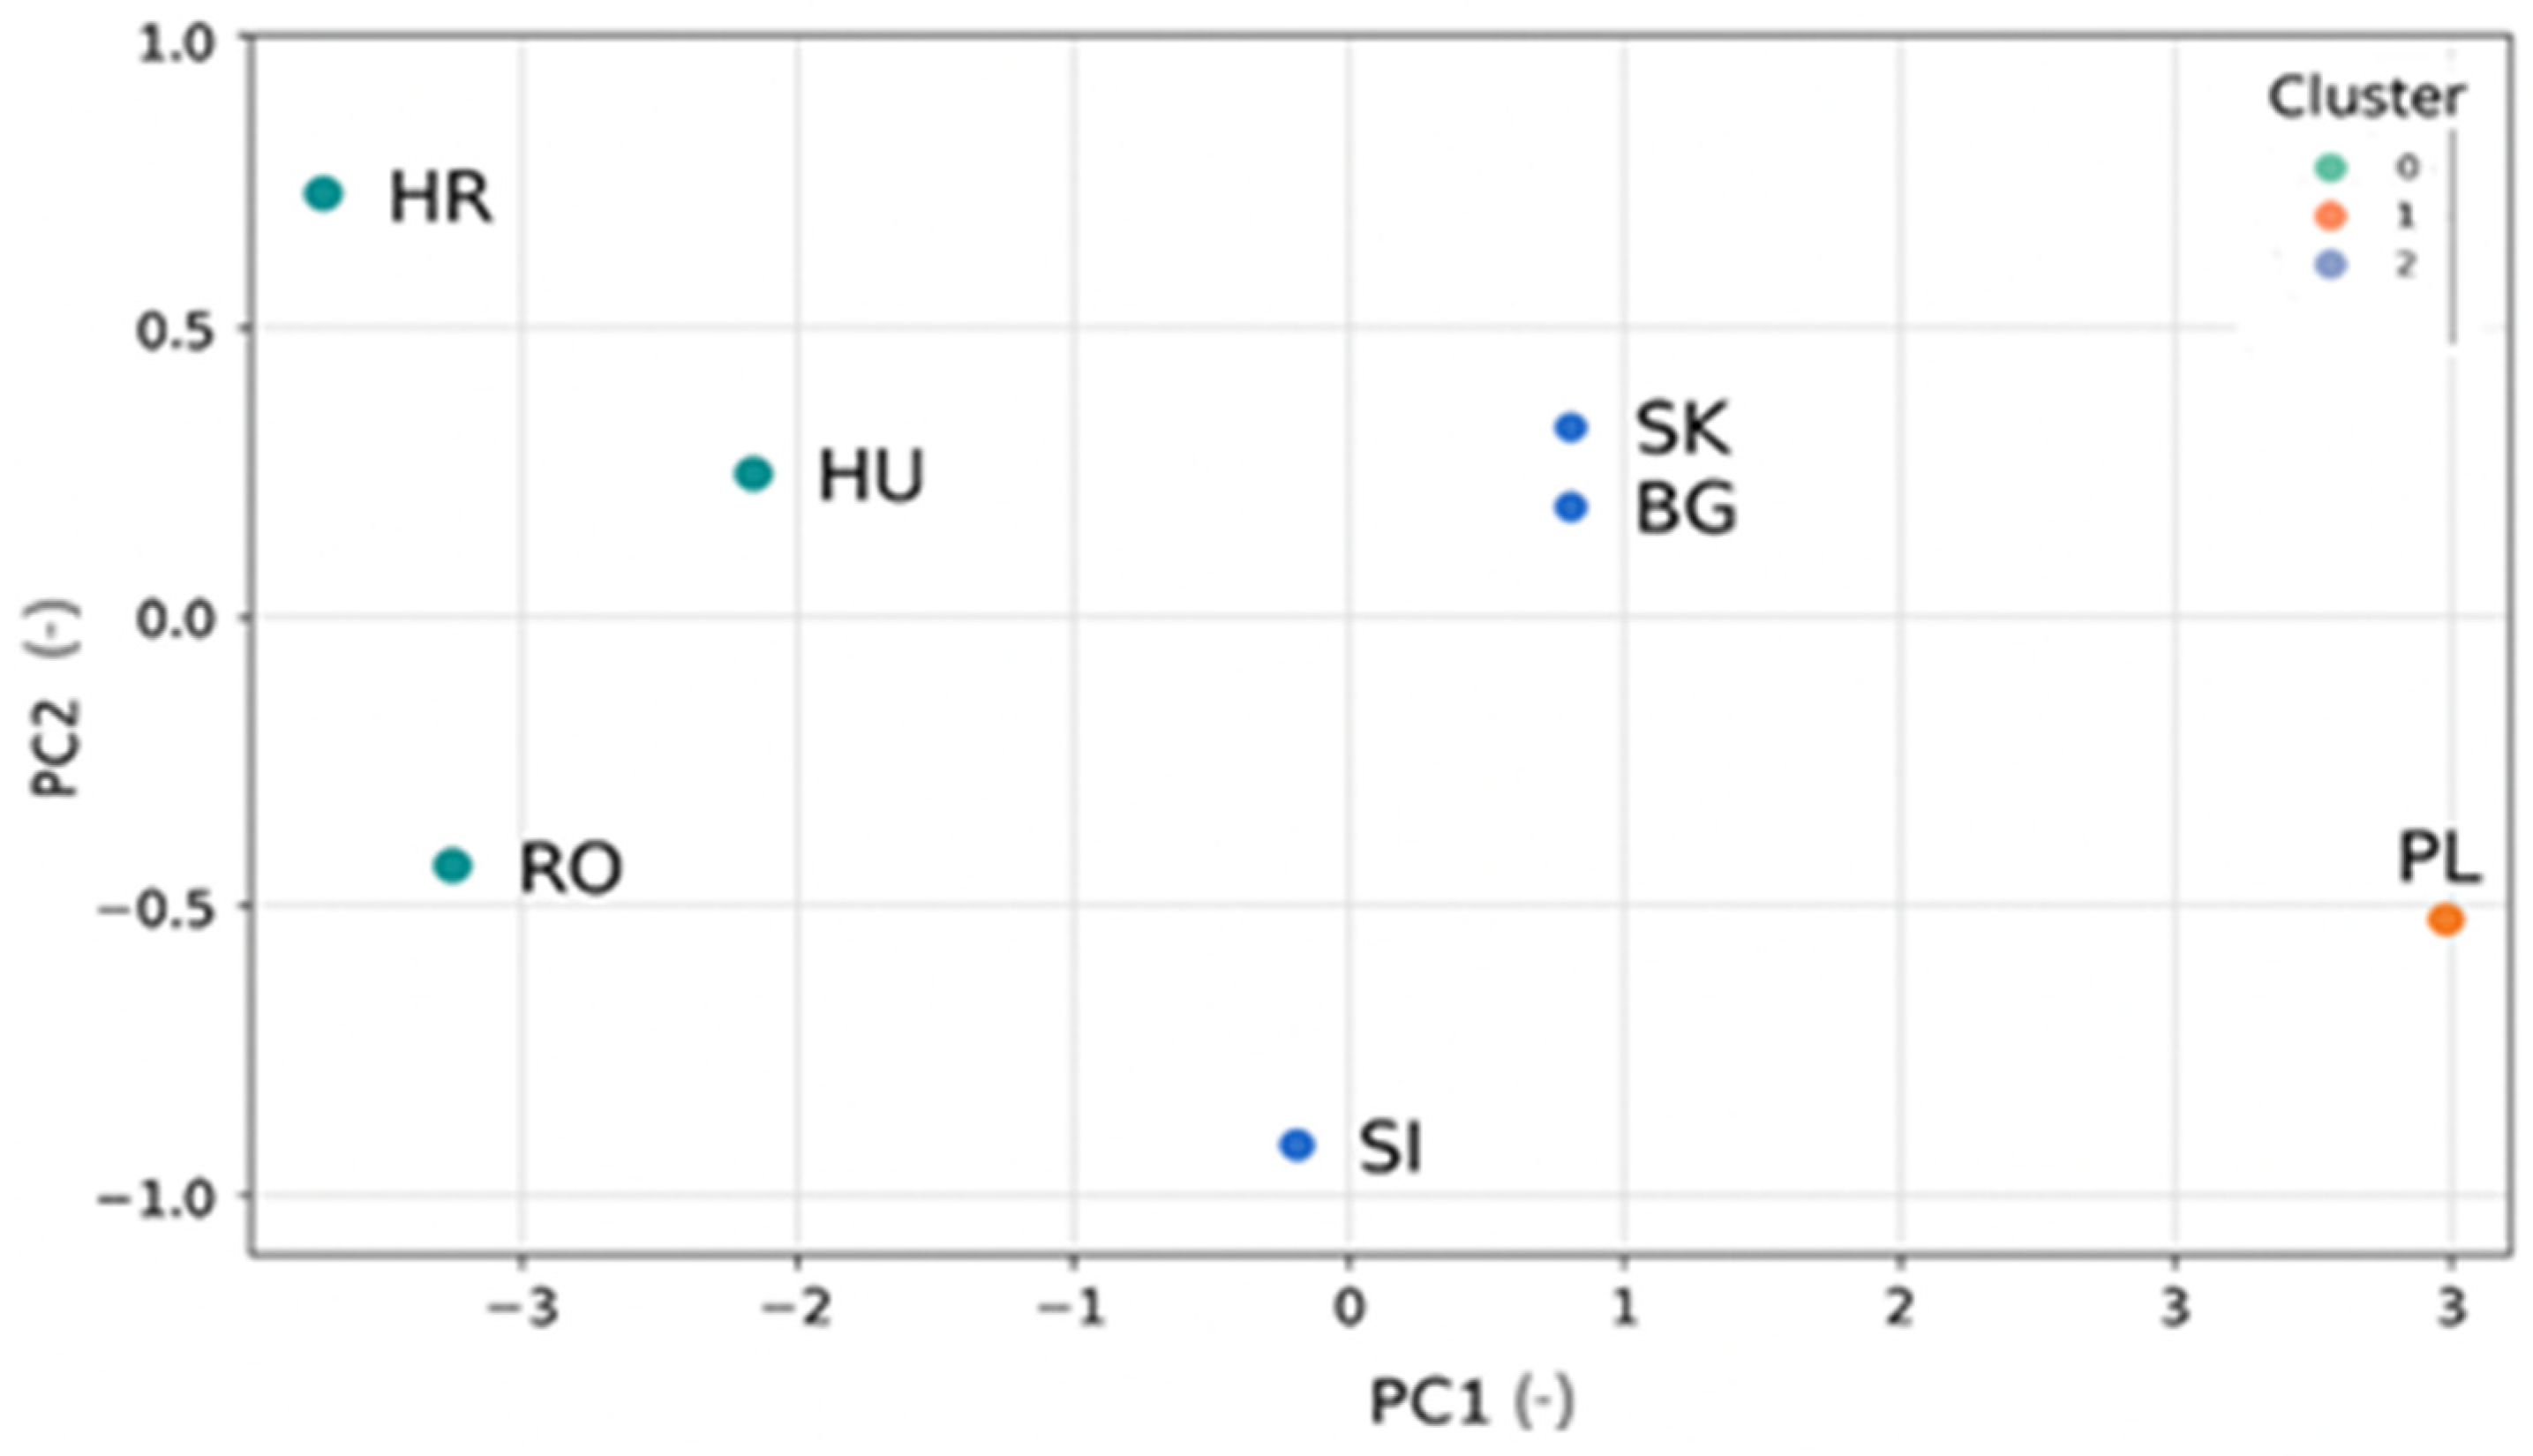
K-Means clustering based on the principal components shown in Figure 4 identified three well-separated clusters:
  • Cluster 1: High fossil-based production and consumption (BG, PL).
  • Cluster 2: Combined nuclear and fossil energy mix (CZ, SK, HU).
  • Cluster 3: Primarily renewable-based energy mix (SI, HR, partially RO).
This classification illustrates the differences in national energy strategies and provides valuable insights for policy design, particularly in energy independence and decarbonisation. It also reveals a structural grouping—nuclear + fossil mix—less emphasised in the previous literature [32,34], underscoring nuclear power’s role as both a baseload provider and an enabler for integrating variable renewable sources.
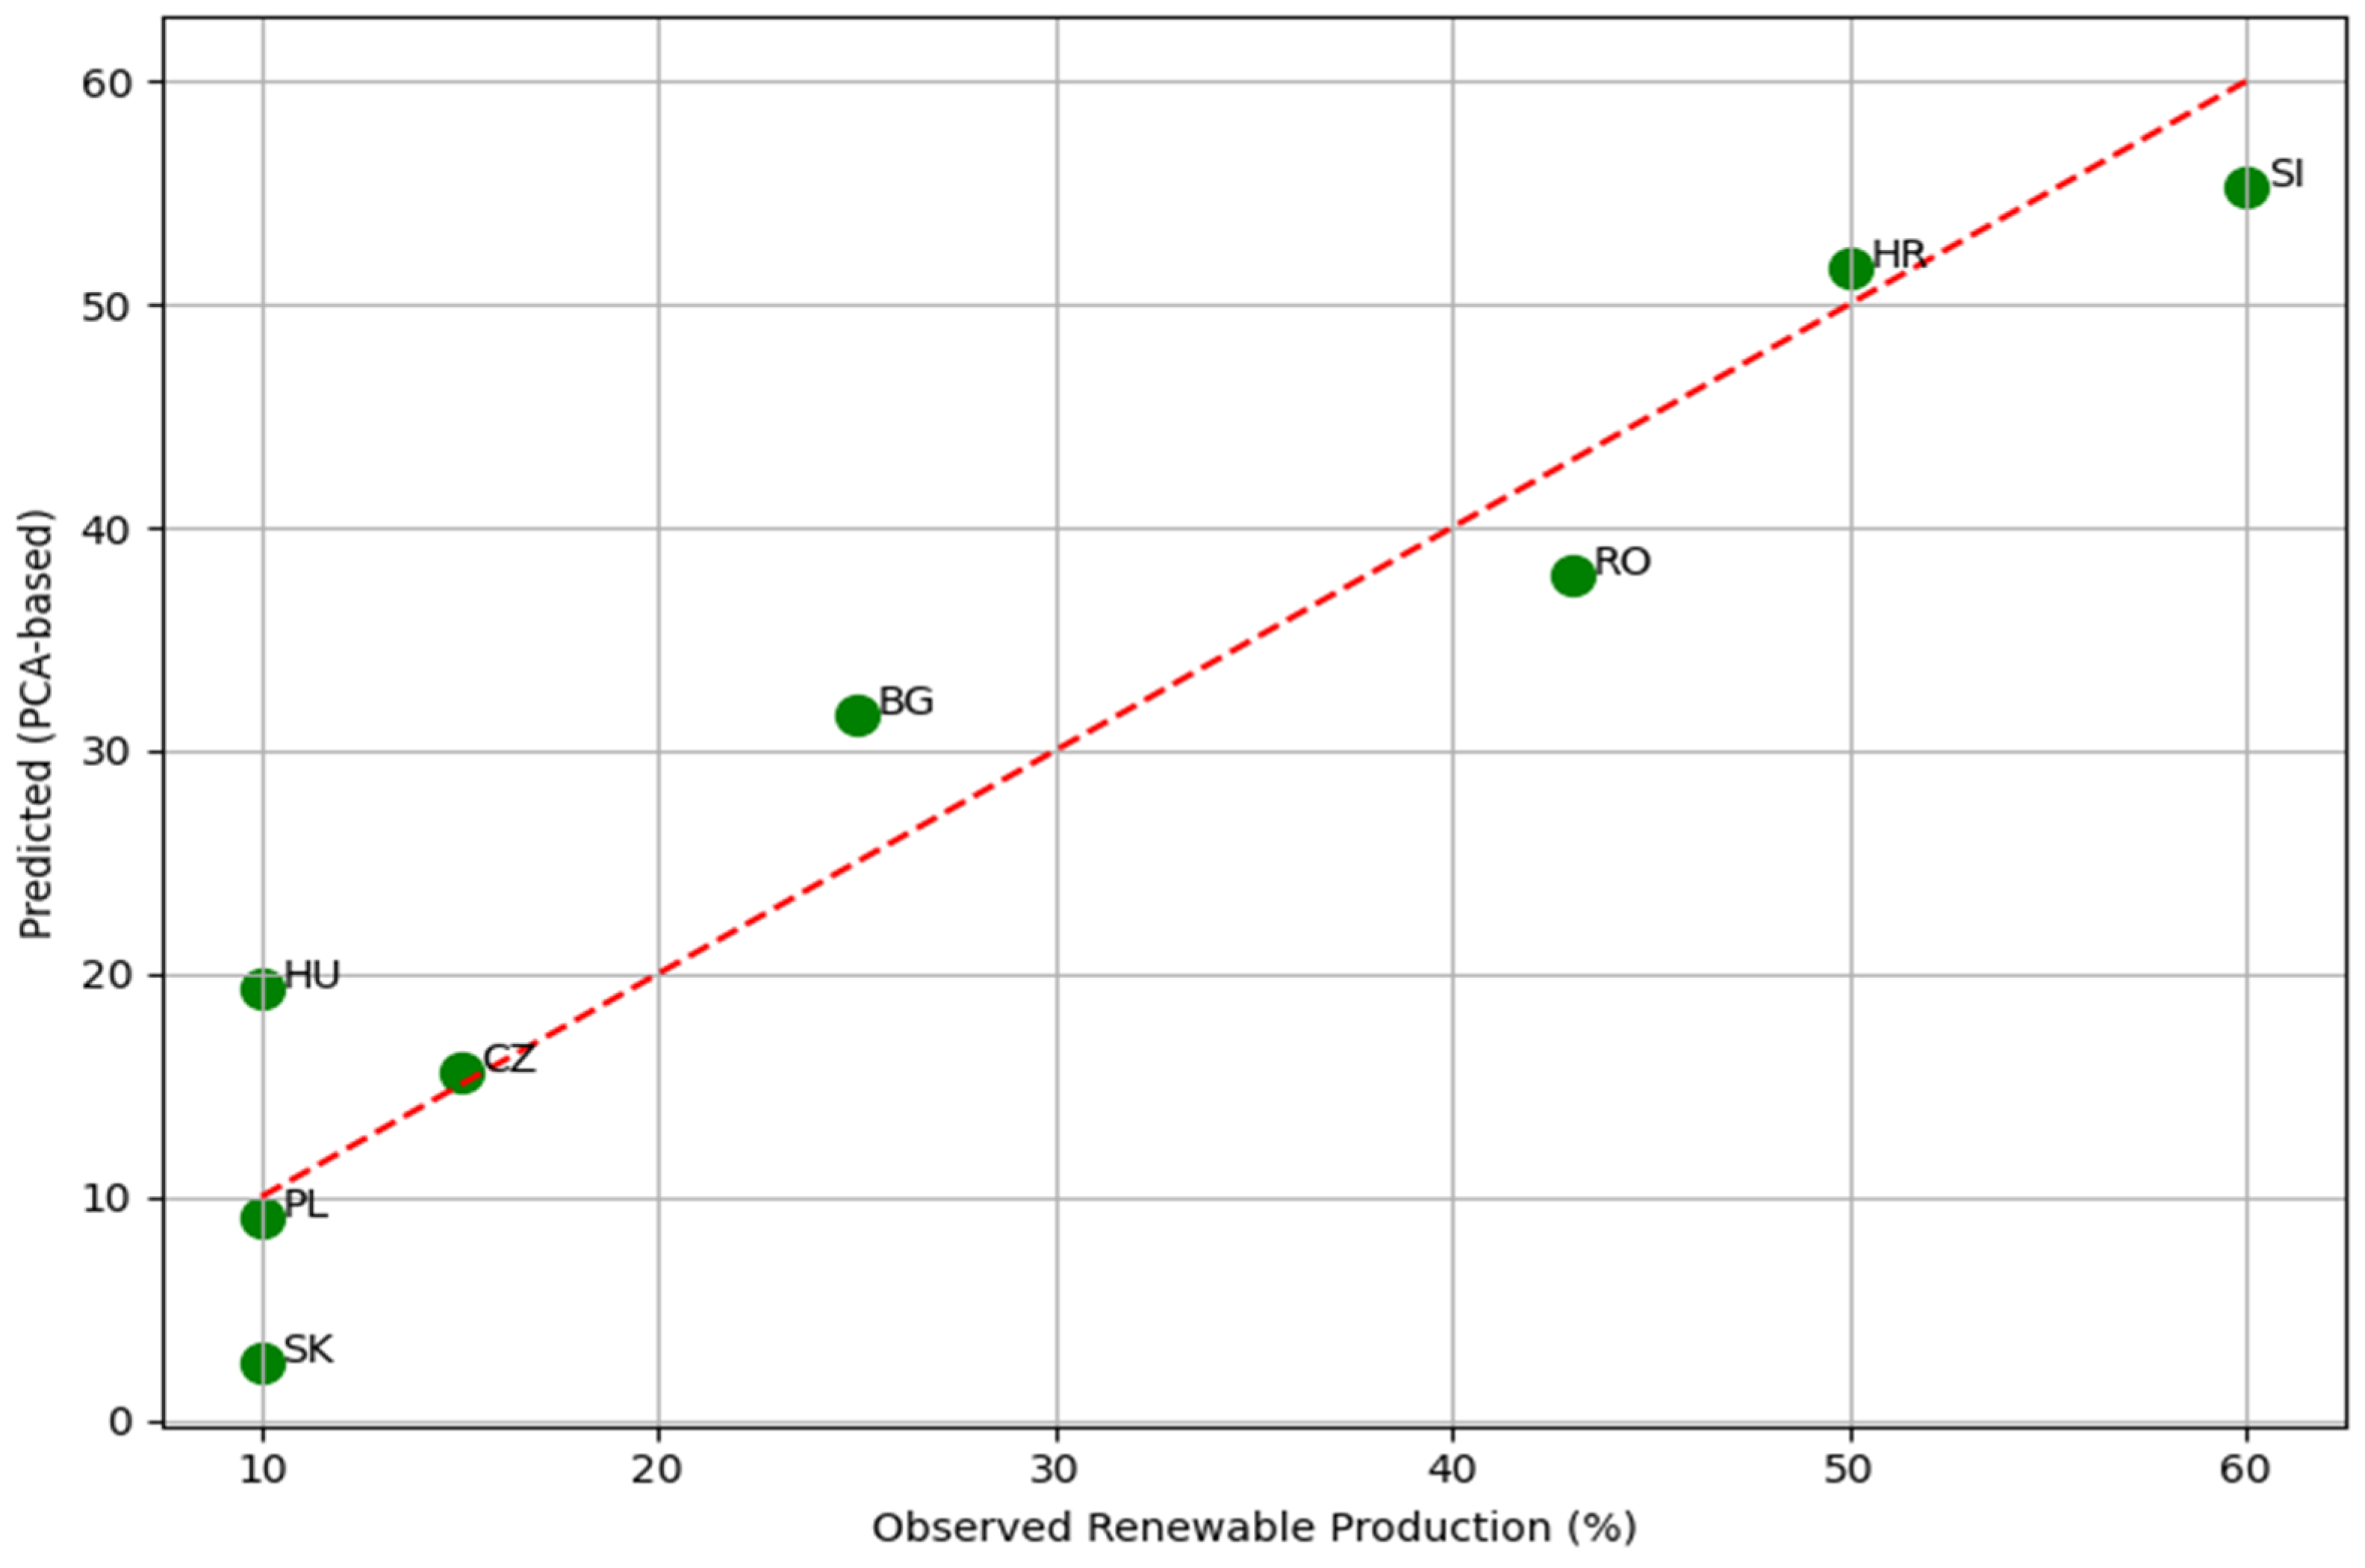
The linear regression model based on PCA (Figure 5 and Table 1) aimed to predict renewable energy production from the principal components.
The model showed a high explanatory power (R2 = 0.918, Adjusted R2 = 0.885), indicating that the structural characteristics of the energy mix—captured by PC1 and PC2—have a strong influence on renewable shares. In particular, PC1 had a positive and significant effect (β = 7.89; p = 0.001), confirming that moving away from fossil fuel dependence and increasing bioenergy shares strongly support renewable deployment.
Despite the model’s strong fit, some variations remain unexplained. These may stem from political and regulatory differences (renewable subsidies, carbon pricing, grid access rules), fluctuations in global energy markets affecting fuel prices, and disparities in energy infrastructure. Cross-border energy trade and commitments under international climate agreements may also shape national outcomes in ways not directly reflected in the PCA variables.
The dominance of PC1 highlights the central role of fossil fuel dependence in shaping industrial and transport sector decarbonisation challenges. The modest explanatory power for per capita electricity consumption suggests that socio-economic and policy-related variables should be incorporated into future models. The observed patterns are broadly aligned with existing research while also revealing region-specific structural categories, providing policy-relevant insights for the energy transition in Central and Eastern Europe.

3.2. Sectoral Breakdown of Final Energy Consumption

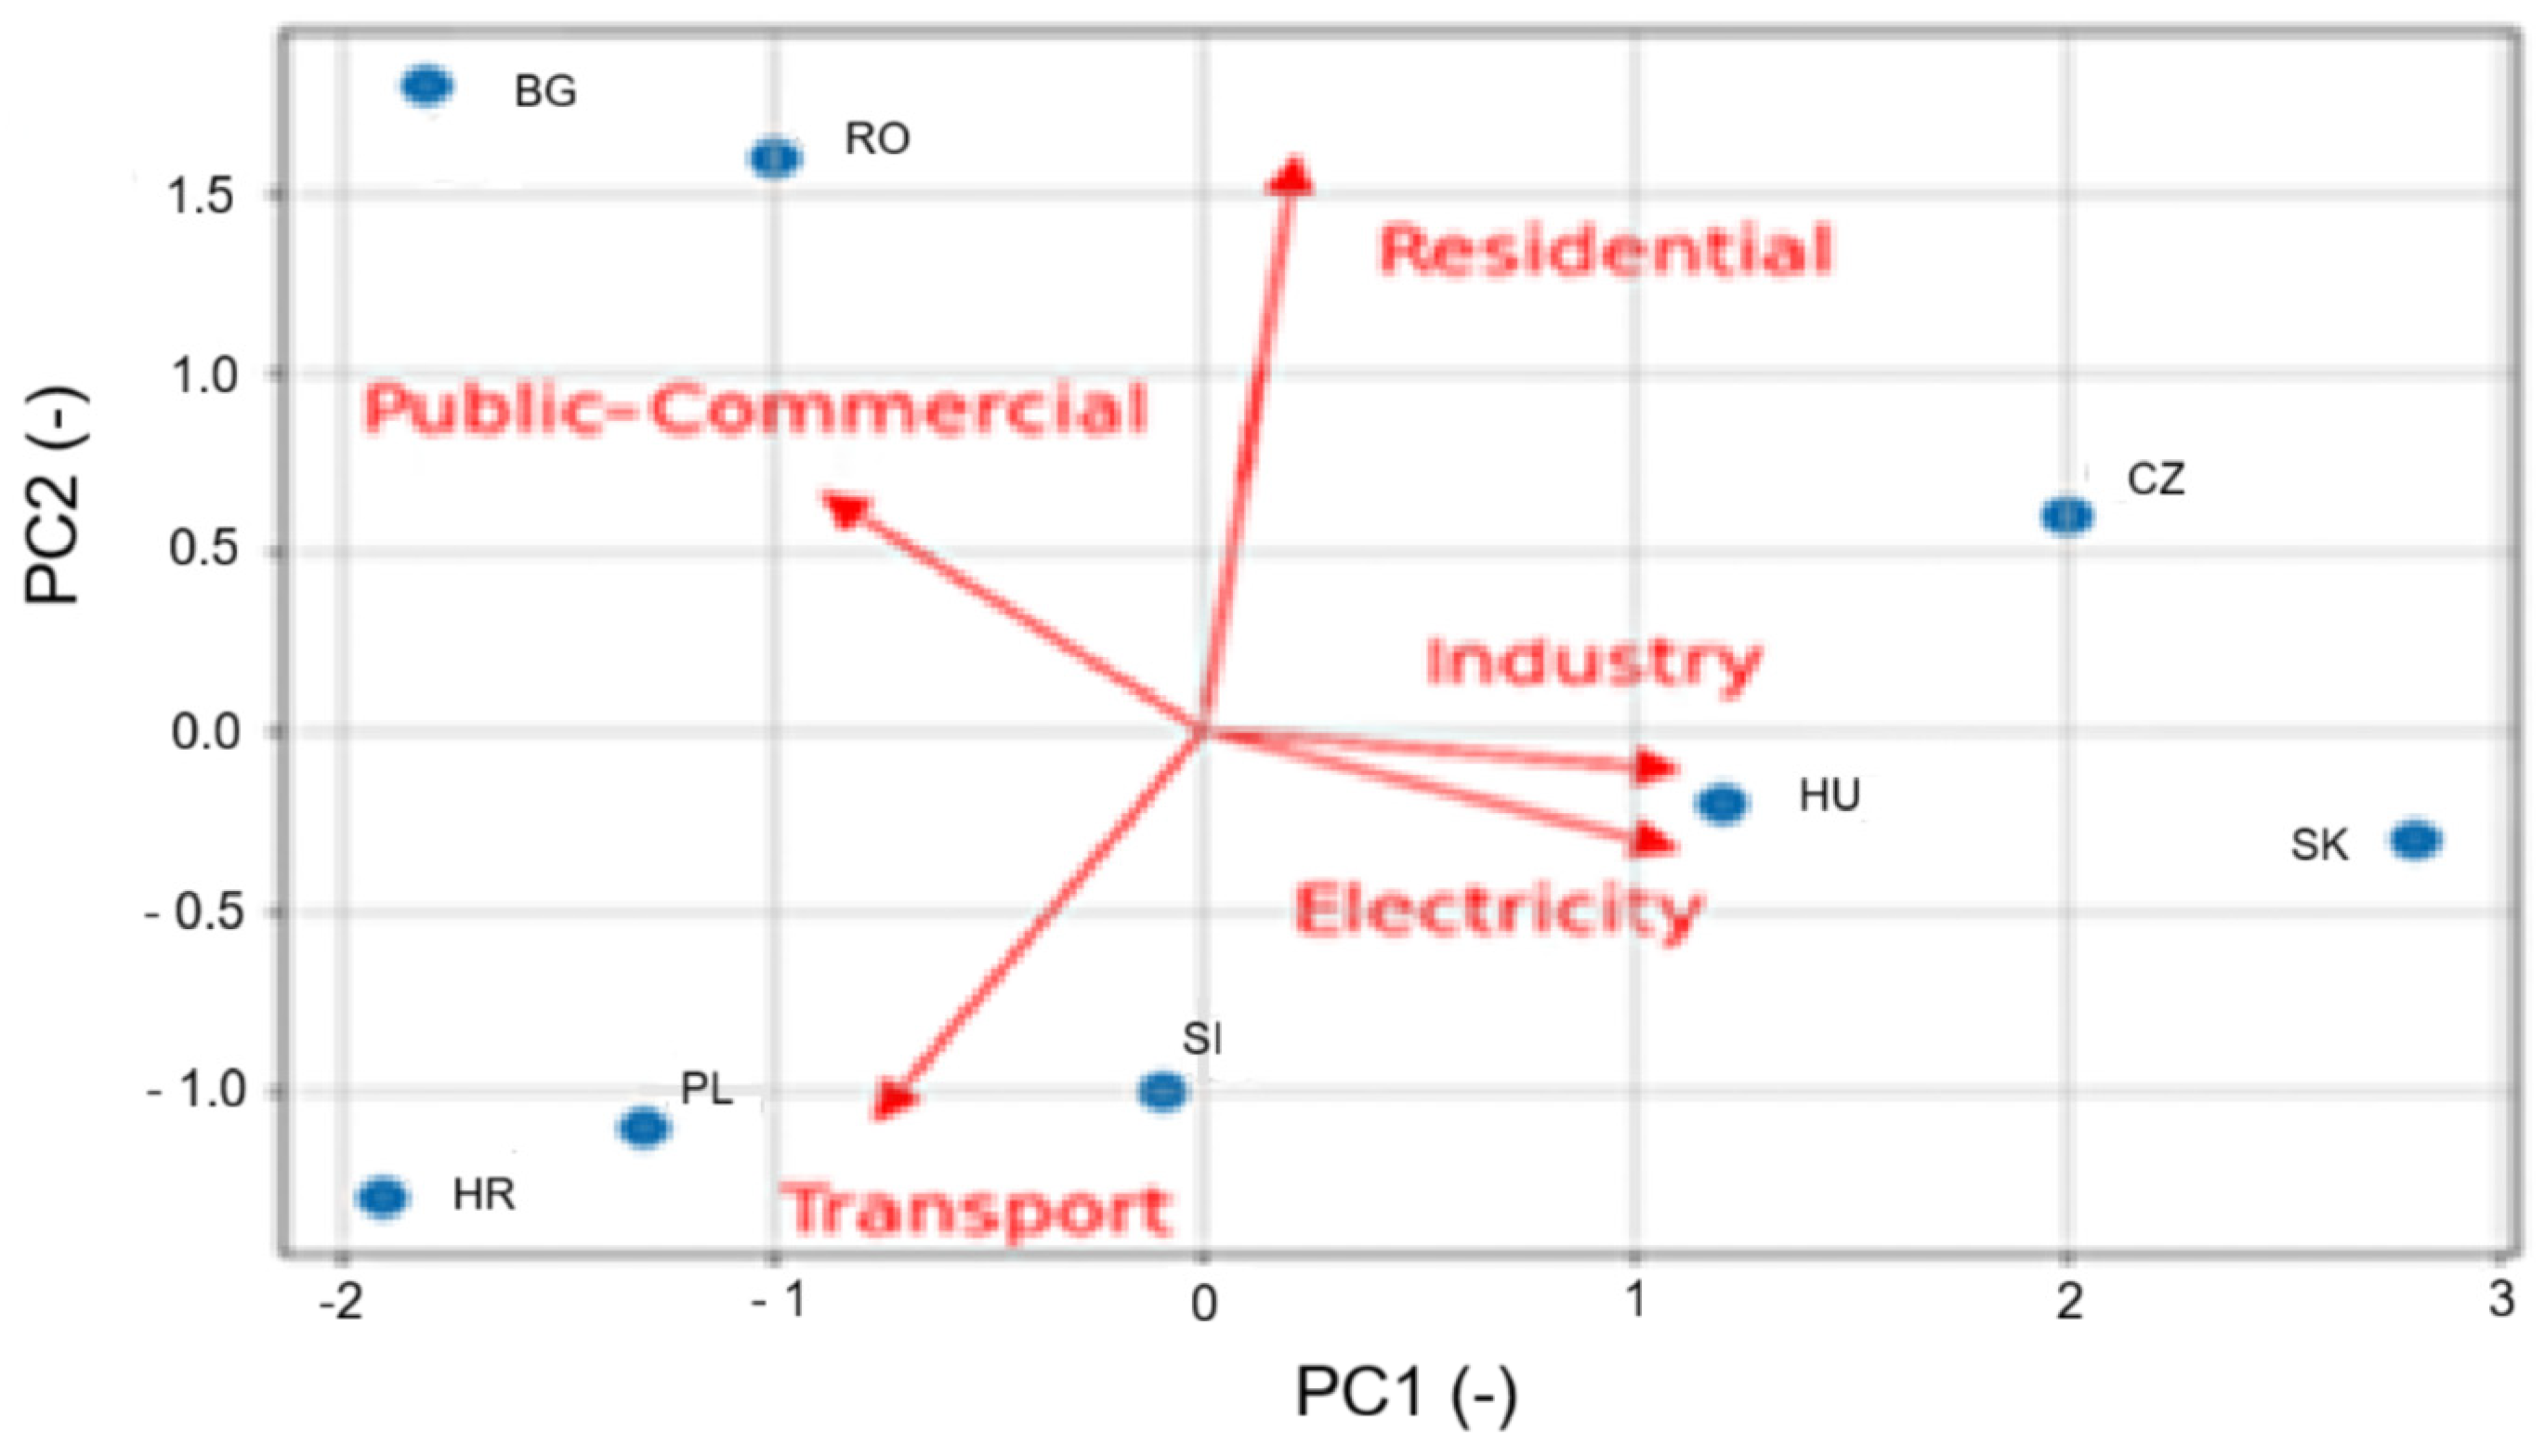
In order to analyse the sectoral structure of energy consumption, principal component analysis (PCA) was applied to the sectoral shares of total energy consumption and electricity consumption. This makes it possible to determine which sectors are most strongly associated with energy consumption in the individual countries. The variables analysed are the shares of industry, transport, households, and public/commercial facilities in total final energy consumption, optionally extended by the sectoral breakdown of electricity consumption.
The first two principal components explain a substantial proportion of the total variance (Figure 6), which makes PCA suitable for dimensionality reduction and visualisation.
PC1 captures the largest differences between countries, driven primarily by energy use in industry and transport. PC2 reflects the variance associated with the residential and public/commercial sectors.
The PCA biplot (Figure 6) shows the positions of countries along PC1 and PC2, together with the sector vectors. The direction and length of each vector indicate its contribution to the principal components.
The biplot clearly separates countries with industry/transport-dominated energy consumption from those with residential-sector dominance. Countries with similar profiles cluster closely in the plot, indicating nearly identical consumption structures. The angles between vectors provide correlation insights—e.g., industry and transport point in similar directions, suggesting a positive relationship in their consumption shares.
From a policy perspective, the dominance of PC1 highlights that industrial and transport sectors are the primary drivers of cross-country differences in energy use. This has clear implications for decarbonisation strategies:
  • In industry-heavy countries (high PC1 scores), deep decarbonisation will require large-scale process electrification, adoption of low-carbon fuels (e.g., hydrogen), and efficiency upgrades.
  • In transport-intensive countries, the focus will need to be on accelerating vehicle electrification, improving public transit infrastructure, and expanding alternative fuel deployment.
In both cases, the PC1 pattern also influences energy efficiency: higher fossil-based industrial and transport use generally correlates with lower efficiency gains unless targeted measures are implemented.
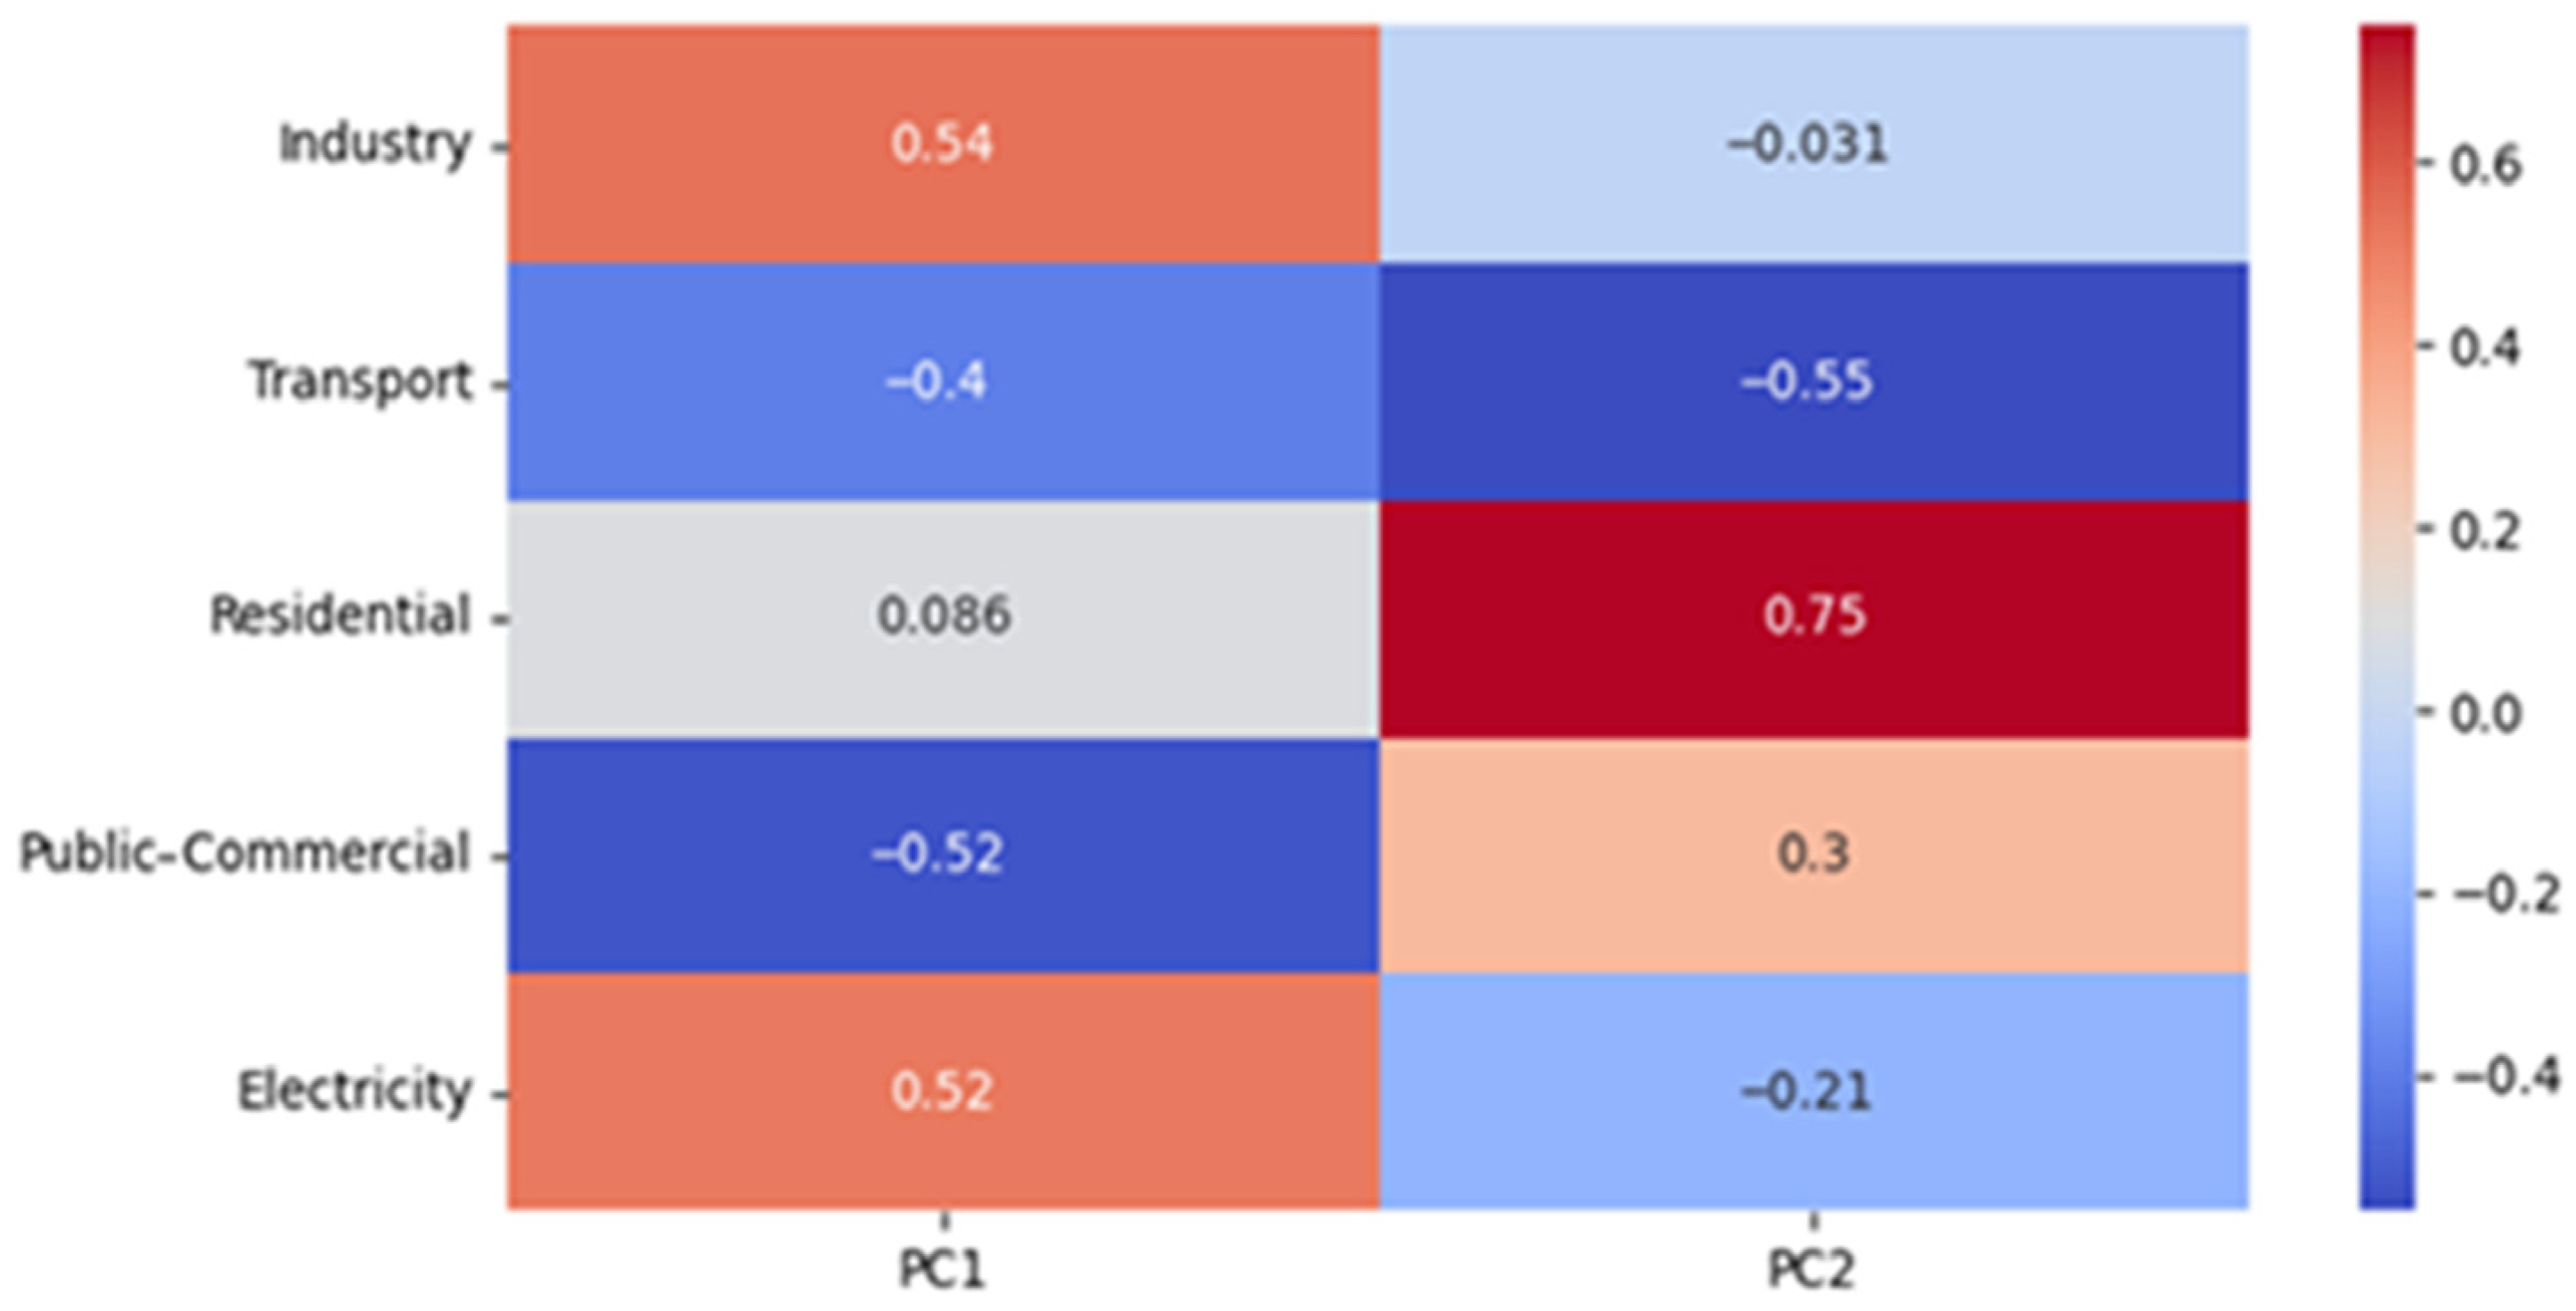
Figure 7 Visualises variable loadings for each component as a heatmap.
For PC1, the highest positive loadings are associated with industry and transport, while the residential sector has a negative loading, indicating a trade-off along an industry–housing axis. PC2 has higher positive loadings for electricity consumption and the public/commercial sector, capturing differences in institutional and service-related energy demand.
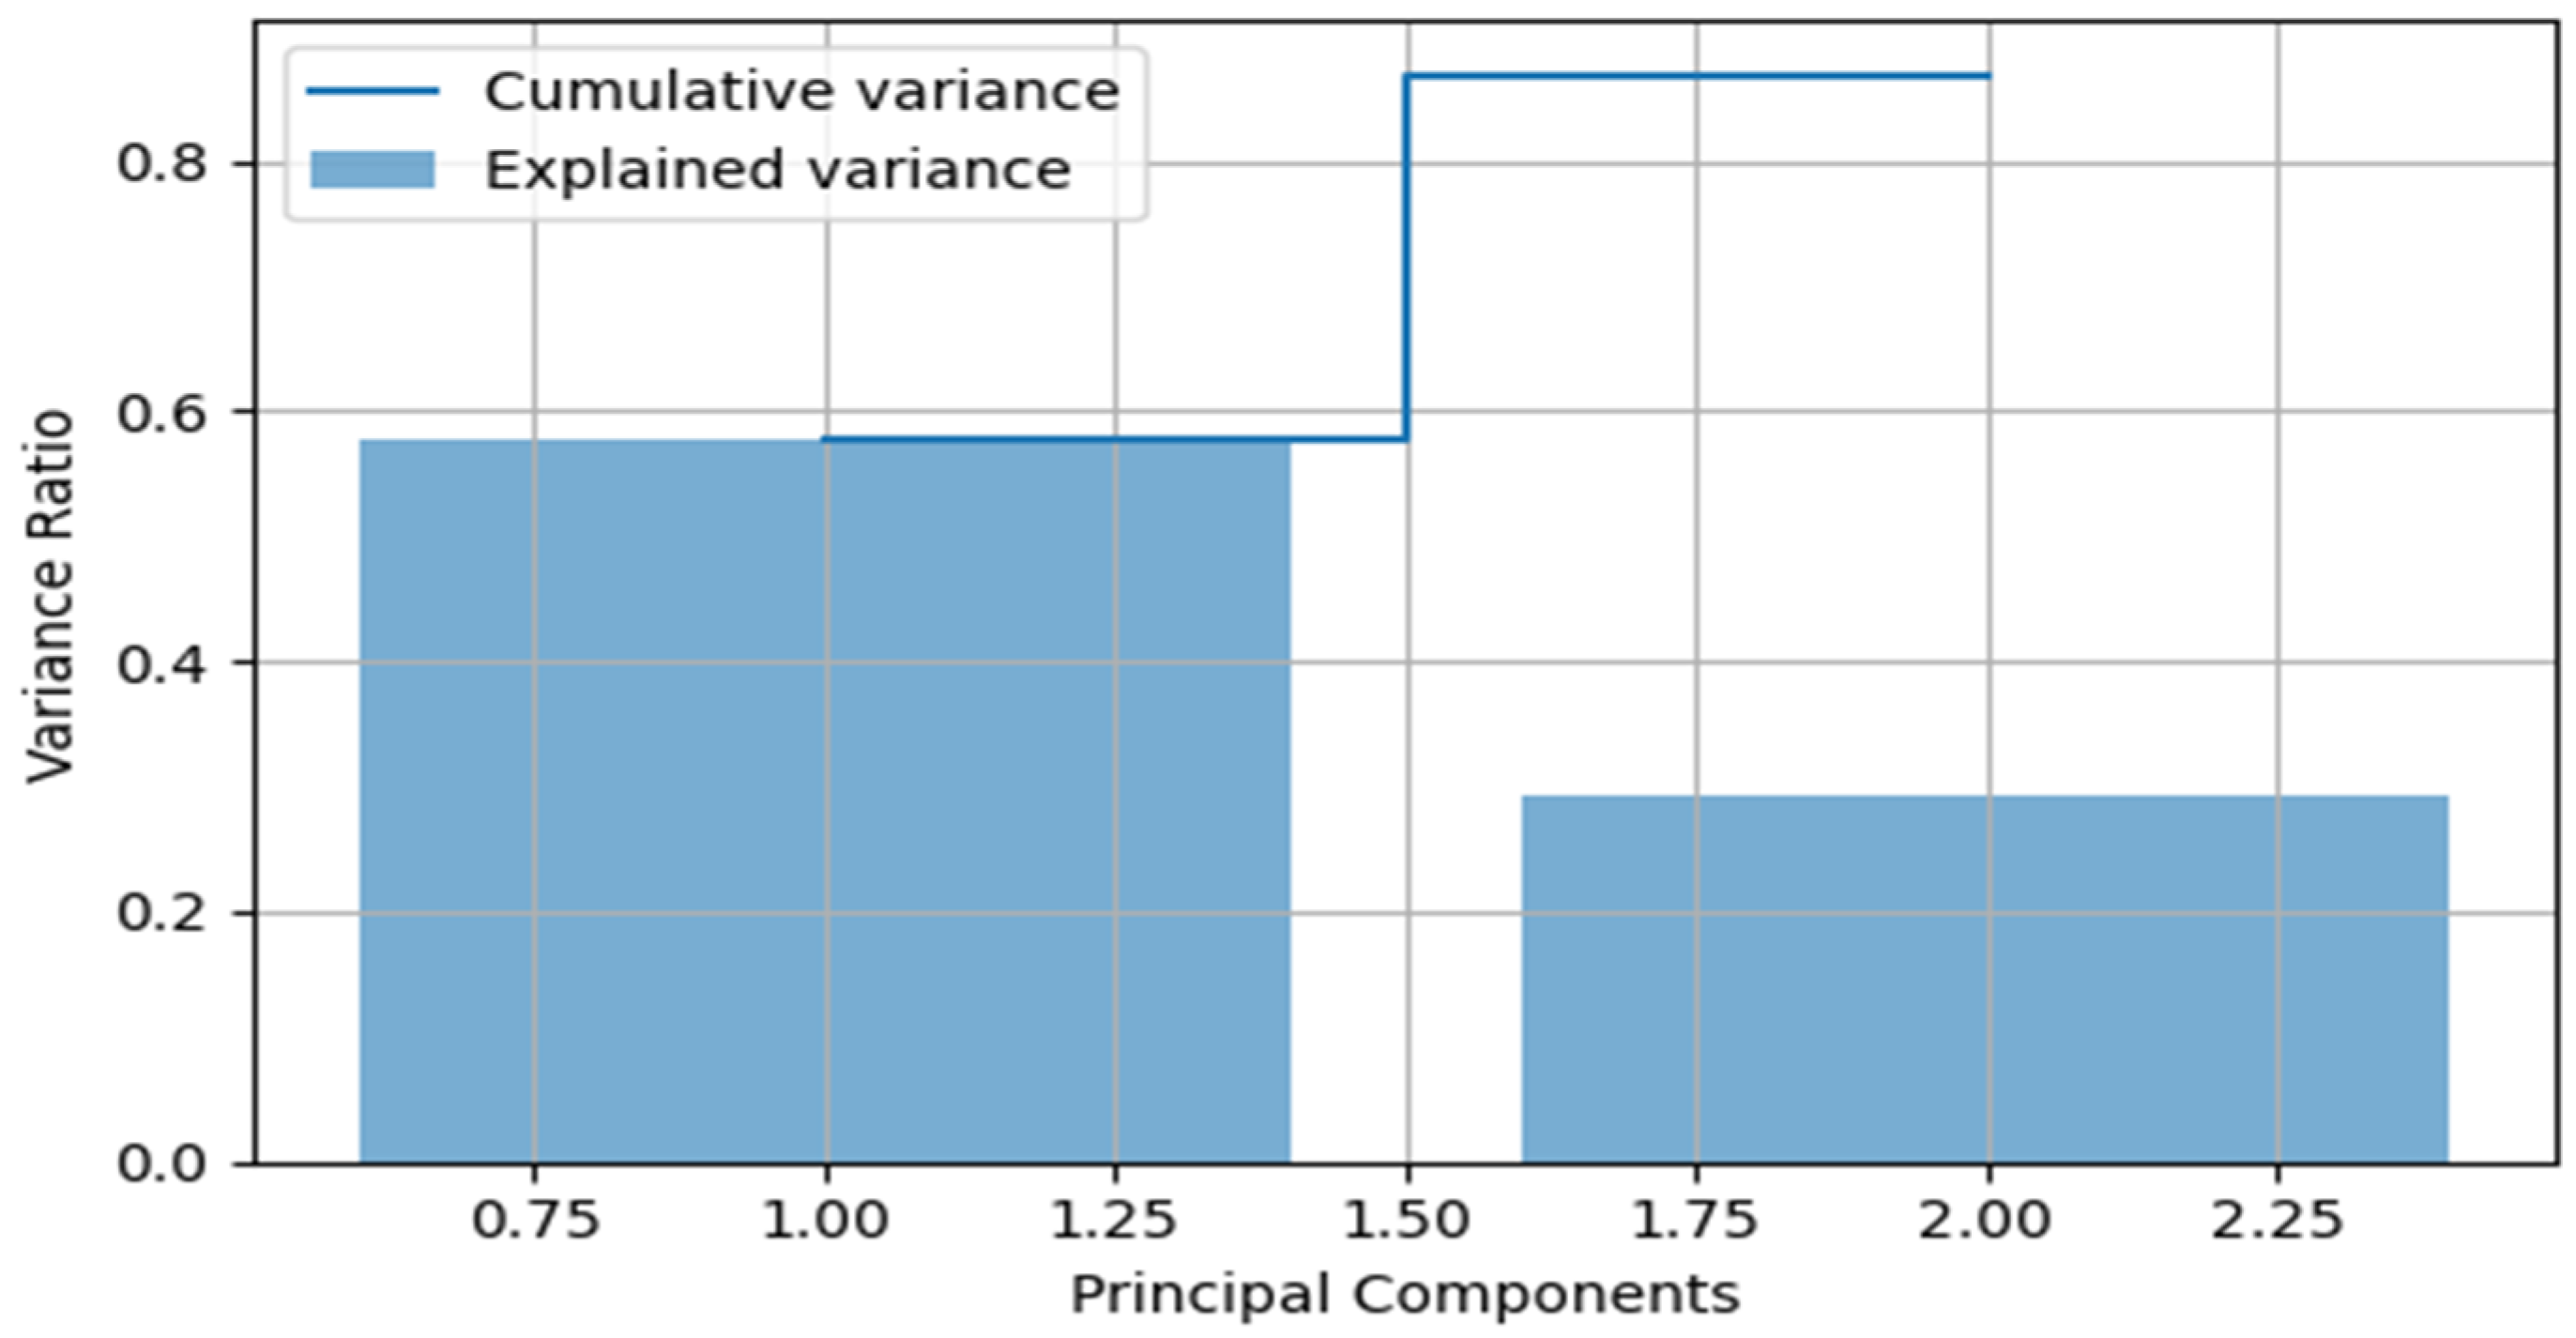
The scree plot in Figure 8 confirms that PC1 alone explains 40–50% of the total variance, while PC1 + PC2 combined explain 70–80%, meaning that most structural information is retained in these two dimensions.
We applied K-Means clustering to the PCA-transformed data, resulting in three distinct groups:
  • Transport + Residential-dominated countries.
  • Industry-dominated countries.
  • Countries with balanced sectoral distribution.
The clear separation in Figure 9 confirms that PCA + K-Means is effective for mapping regional energy consumption types, which can guide sector-specific policy interventions.
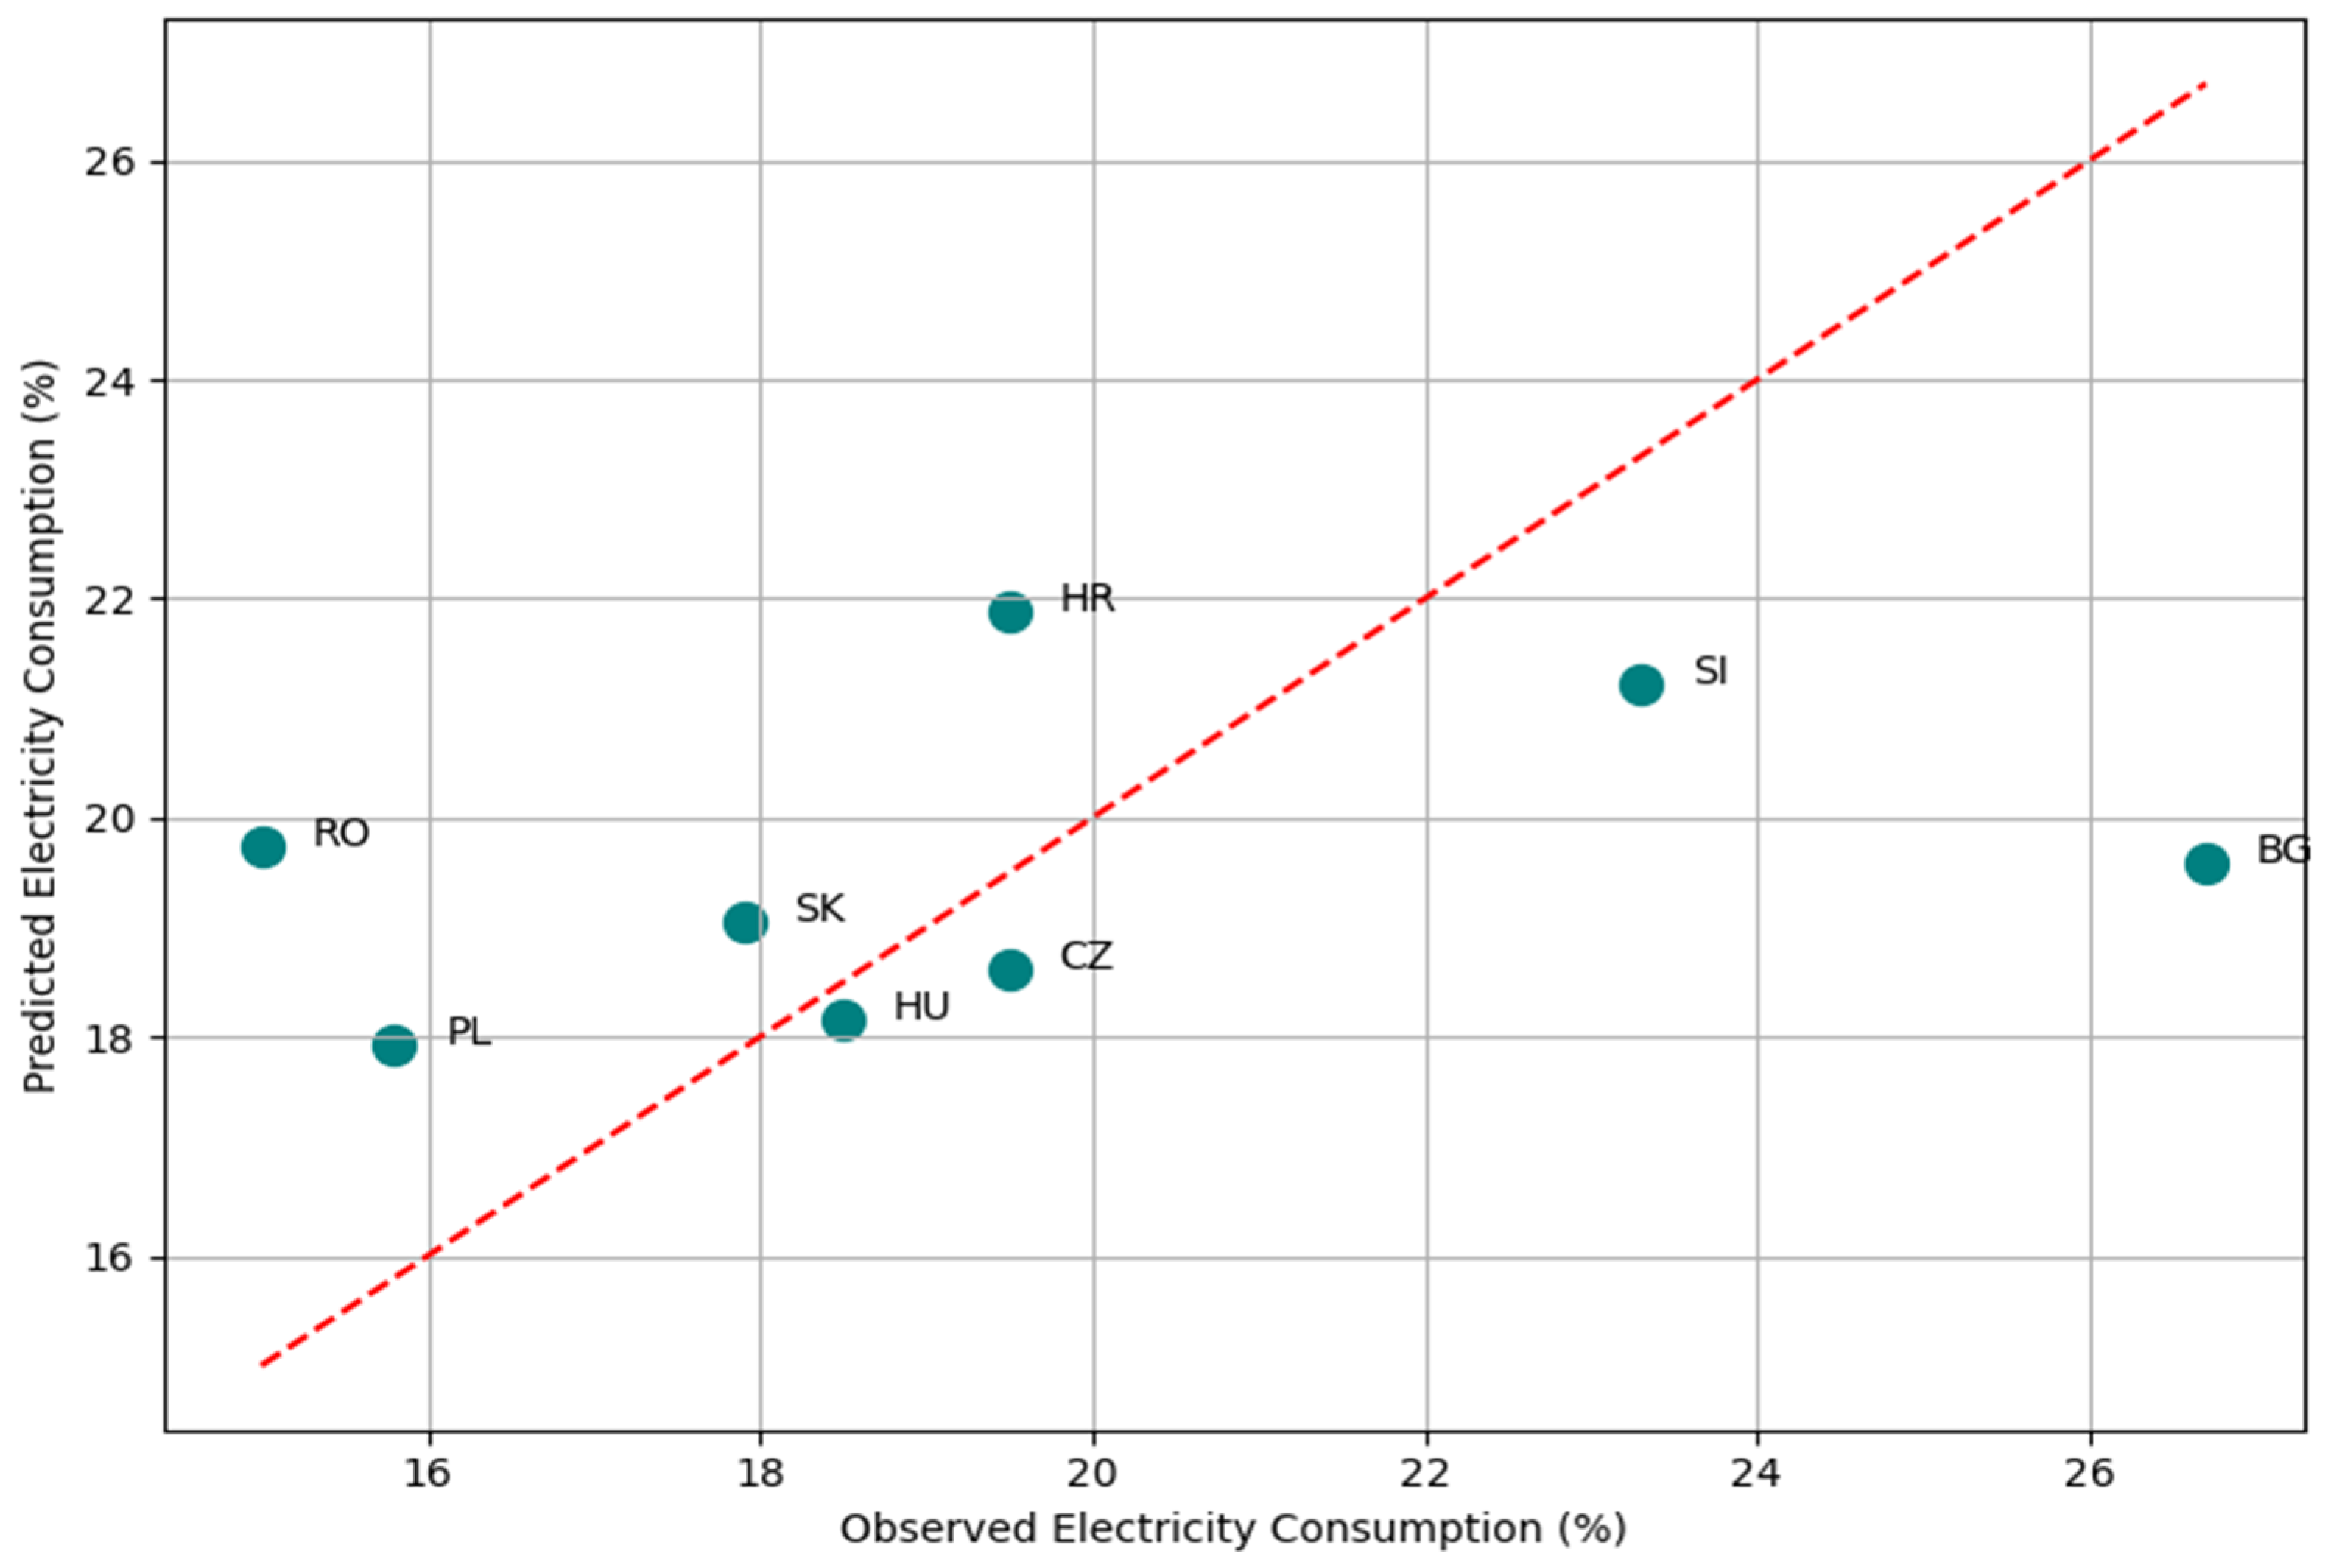
To assess the impact of sectoral patterns on electricity consumption, we used principal components regression (Figure 10, Table 2).
The model achieved a high fit (R2 = 0.841), with PC1 showing a positive and significant effect on electricity consumption (β = 0.9724, p = 0.004), while PC2 was not significant (β = −0.3879, p = 0.219).
This result underscores that the industry/transport profile represented by PC1 strongly influences national electricity consumption levels.
However, when applying similar models to per capita electricity consumption, the R2 values drop substantially, indicating that sectoral structure alone cannot fully explain per-person electricity use. This aligns with previous findings, IEA, 2022 [32], and Eurostat, 2023 [33], showing that socioeconomic factors—GDP per capita, climate, digitalisation, lifestyle—play a major role.
Our findings are consistent with existing literature [34]; IEA, 2022 [32], identifies fossil-intensive industry and transport as critical decarbonisation challenges. However, our cluster analysis also reveals a unique balanced-energy group in the region, less emphasised in prior work, where electricity demand patterns are influenced by a combination of public/commercial demand and moderate industrial load.
Some unexplained variations in the models likely arise from:
  • Political factors (e.g., renewable subsidies, fuel taxation).
  • Energy market volatility (e.g., oil/gas price shocks).
  • Infrastructure disparities (grid capacity, interconnectivity).
  • International trade in energy (import/export dependency).
The large role of PC1 in the analysis emphasises that decarbonisation and efficiency gains depend heavily on targeted strategies for industry and transport. The relatively lower explanatory power for per capita electricity consumption highlights the need to integrate socioeconomic and policy variables into future models.

3.3. Breakdown of Electricity Generation by Energy Source

The aim of this chapter is to compare energy profiles based on electricity generation. The variables are as follows:
  • Electricity generation by fuel type: coal, gas, nuclear, hydro, solar photovoltaic, wind—electricity generation sources.
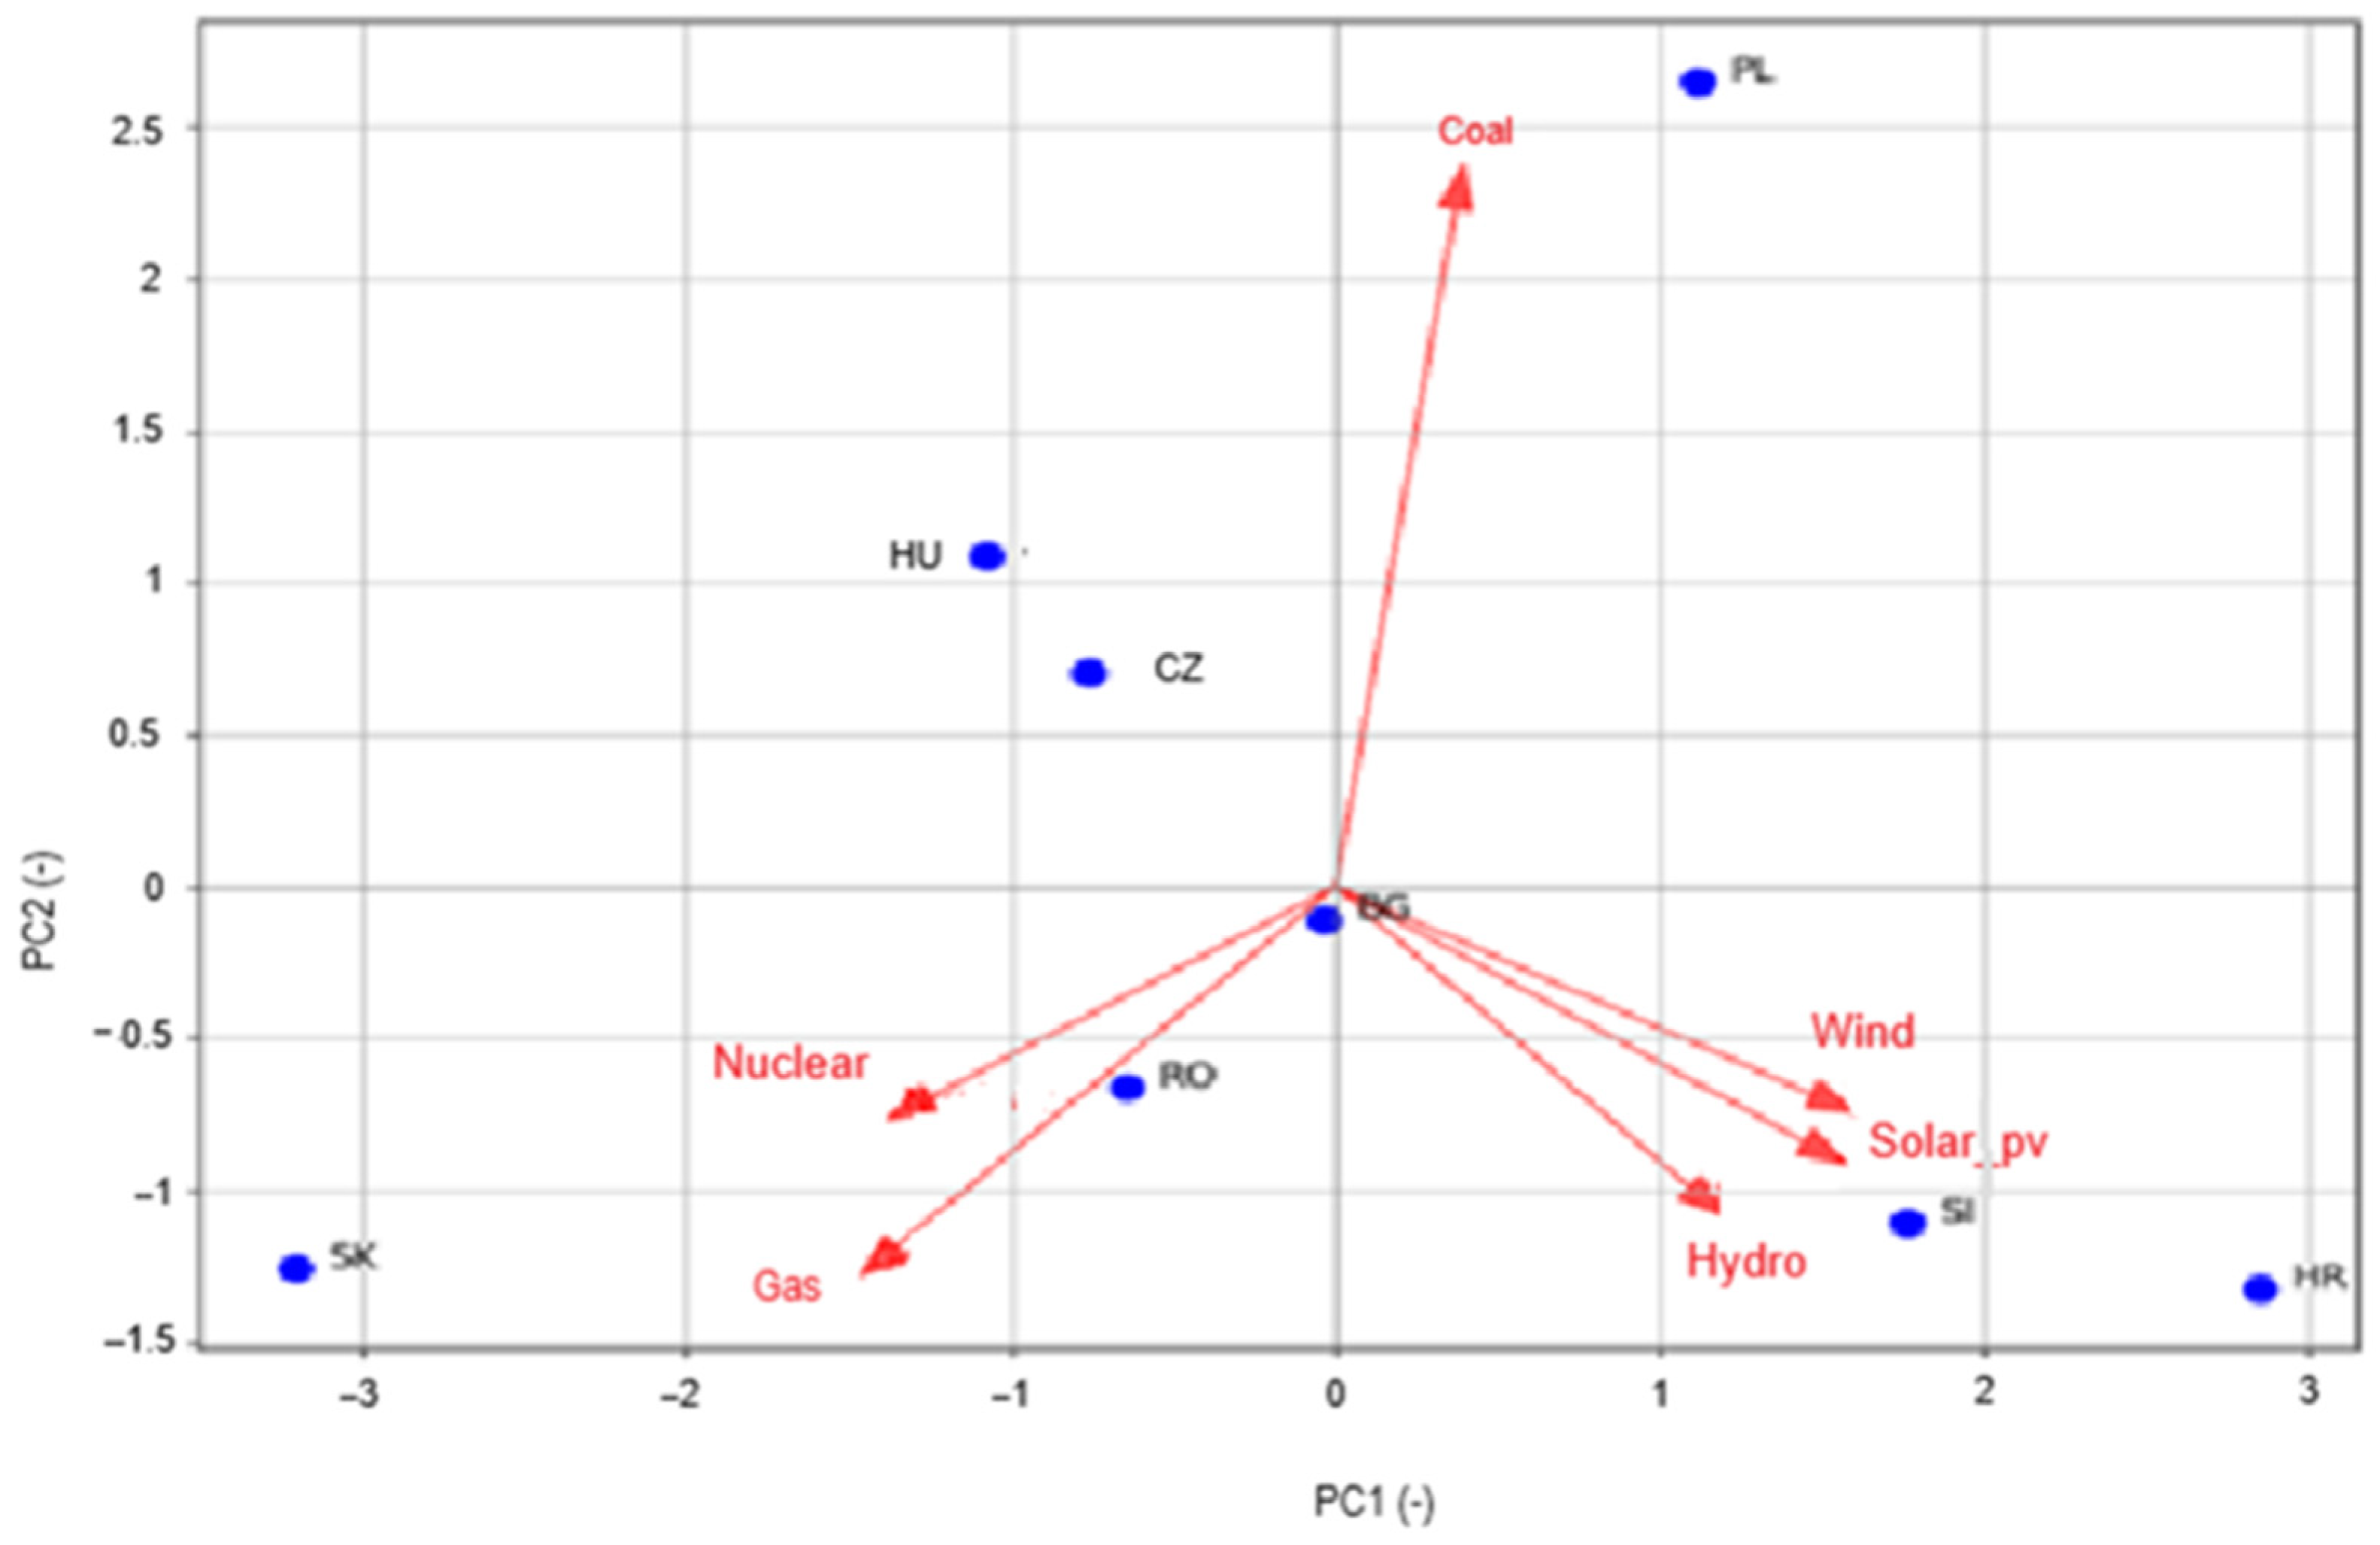
Figure 11 shows the electricity generation profiles of eight countries in the plane defined by the first two main components of the principal component analysis (PCA).
The shares of coal, gas, nuclear power, hydropower, solar energy, and wind energy are taken into account. The countries are represented by dots, while the energy sources are represented by vectors. The length and direction of the vectors indicate the extent to which each energy source contributes to the corresponding main component. This biplot simultaneously enables the visualisation of similarities between the samples (countries) and the relationships between the energy sources and shows structural differences in the region’s energy mix.
The heat map of the variable loadings in Figure 12 shows in detail how strongly, and with what sign, each energy source contributes to the main components.
For example, the first principal component is strongly positively correlated with electricity generation from coal and gas, while the second component emphasises the role of renewable energy sources such as hydropower and wind power. This heat map provides a deeper insight into the underlying physical meaning of the main components and the relationships between the individual energy sources.
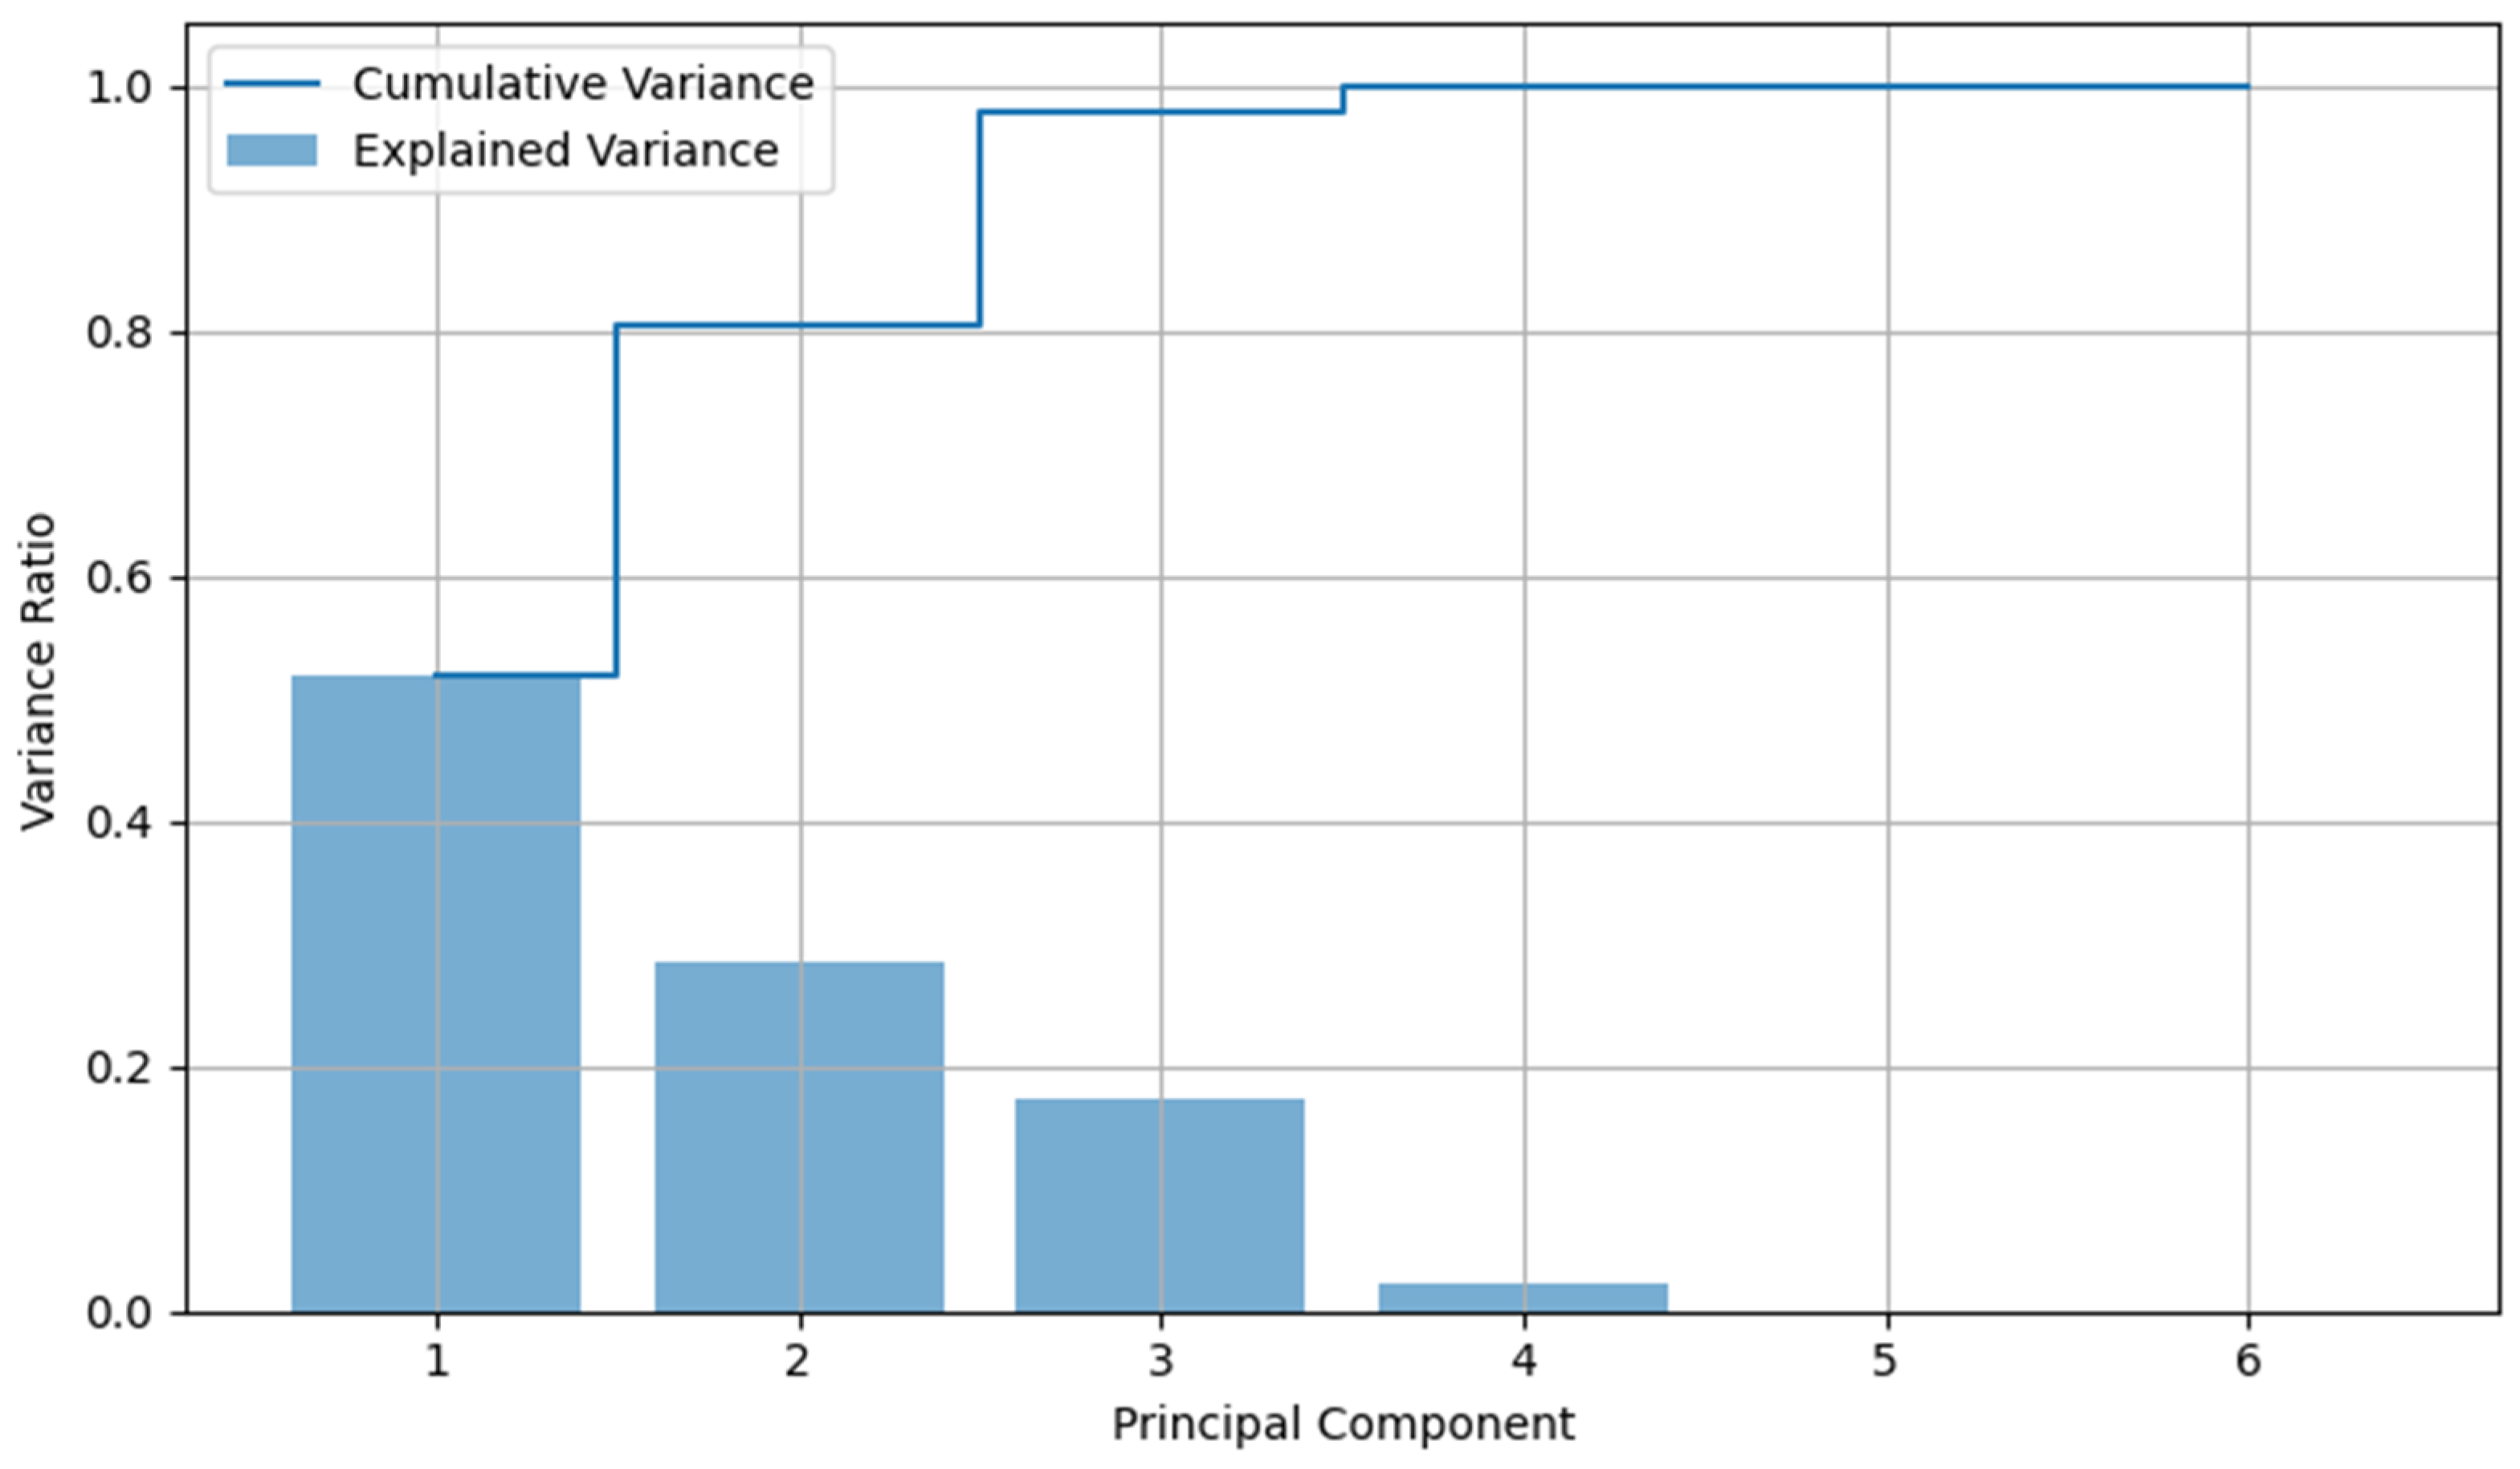
The first two main components explain a considerable part of the data variance (together about 70–80%) and allow a simplified visualisation of the most important dimensions of the energy source profiles, as shown in Figure 13.
The cumulative variance curve shows that the inclusion of additional components brings only marginal gains. Therefore, the analysis based on the first two components provides a suitable basis for further analyses, such as clustering.
Figure 14 shows the identification of three well-separated groups in the low-dimensional space defined by the principal components using K-Means clustering.
These clusters categorise countries based on their electricity generation profiles and distinguish between countries dominated by traditional fossil fuels and nuclear energy and countries rich in renewable energy. The clustering results help to understand regional differences in energy policy strategies and support targeted interventions.
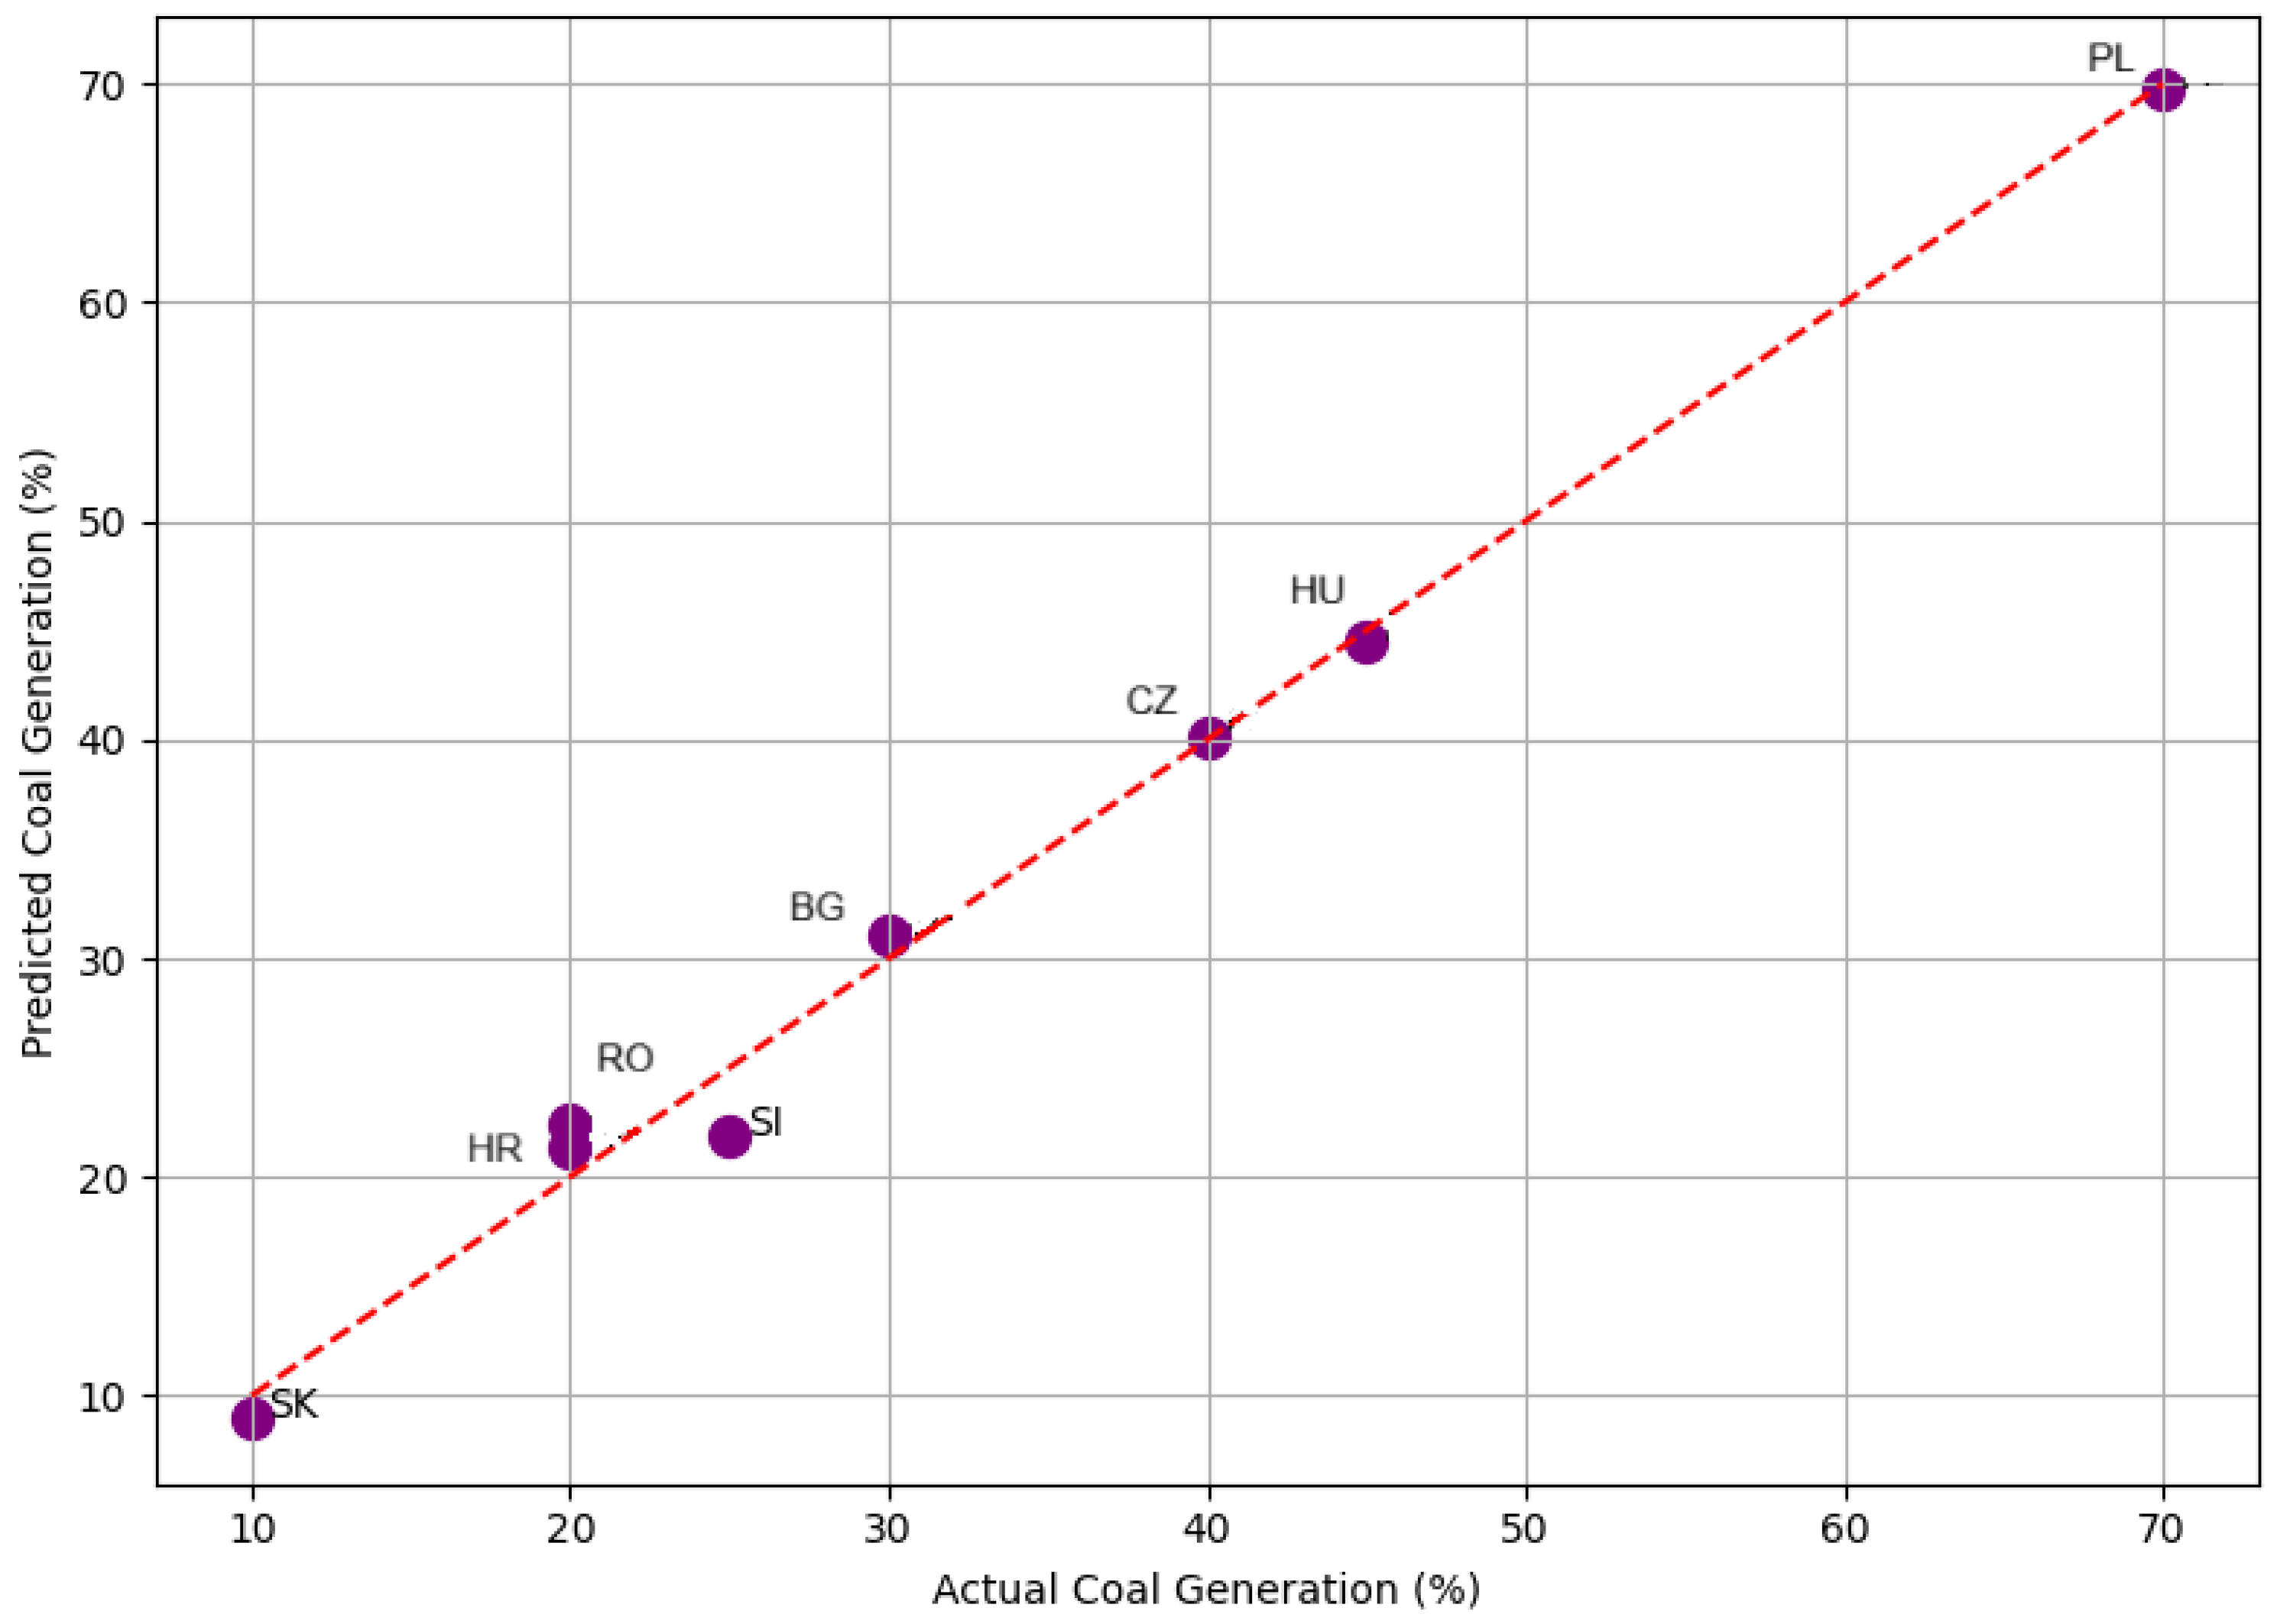
The linear regression model based on the principal components was used to predict the percentage of coal-based electricity generation, as shown in Figure 15.
The model showed strong agreement, supporting the conclusion that the principal components effectively summarise the information content of the generation structures. This approach allows for a simplified yet meaningful modelling of complex energy data that can help decision makers in the field of sustainable energy management.
The regression model shown in Table 3 aims to explain the share of coal-based electricity generation (coal) using the main components. With an R2 value of 0.992 and an adjusted R2 value of 0.989, the model is an excellent fit. This clearly shows that the independent variables—the first two main components (X1, X2)—explain more than 98% of the variance in the data.
The result of the F-test (F = 303.6, p < 0.00001) indicates an extremely high statistical significance and confirms that at least one of the components is a significant predictor of coal-fired power generation. The interpretation of the coefficients is as follows:
The constant term (Const) has a value of 32.5, representing the estimated baseline coal generation share when the principal components approach zero.
The coefficient for the first principal component is 2.18, indicating a significant positive relationship between this component and coal-based generation (p = 0.003). This suggests that an increase in the energy consumption pattern represented by the first component significantly raises the share of coal-based electricity generation.
The second principal component shows an even stronger positive effect (β = 13.14, p < 0.001), indicating that it also plays a key role in determining the proportion of coal energy.
The normality of the residuals is confirmed by the omnibus test (p = 0.576) and the Jarque–Bera test (p = 0.873), and the Durbin–Watson statistic (1.519) indicates that there is no significant autocorrelation.
Overall, the model shows that the principal components derived from the PCA effectively summarise and explain the differences in coal-fired power generation between countries. This is strong evidence that the complex distribution of energy sources is informative and suitable for reliable predictions, even in a dimensionally reduced form.

3.4. Energy Independence and Intensity

The objective of this chapter is to identify which sectors are most strongly associated with final energy consumption in each country. The analysis considers the shares of industry, transport, residential, and public/commercial sectors in total final energy consumption. In some cases, the analysis is extended to include the sectoral breakdown of final electricity consumption.
To examine the sectoral structure of energy consumption, principal component analysis (PCA) was applied to the shares of sectoral energy consumption. We applied PCA to the matrix of sectoral energy shares X (n = 8 countries × m = 4 sectors: Industry, Transport, Residential, Public/Commercial). The covariance matrix of X was diagonalized to obtain eigenvectors (vi) and eigenvalues (λi): C(X)vi = λi vi.
PC1 and PC2 were retained because they together explain 81.4% of the total variance (PC1: 54.7%, PC2: 26.7%). This high proportion confirms PCA’s suitability for dimensionality reduction and visualisation. Despite the small sample, the structure of sectoral contributions is clear and aligns with sectoral energy shares observed in the data (Figure 16).
The first principal component (PC1) captures the largest variation in the data, driven primarily by energy consumption in industry and transport. The second principal component (PC2) mainly reflects the variance associated with residential and public/commercial sectors. The PCA biplot displays both the positioning of countries in the PC1–PC2 space and the sector vectors, where the direction and magnitude of each vector indicate its contribution to the components. Countries close to each other exhibit highly similar sectoral energy profiles, while the relative vector orientations reveal correlations between sectors. The large role of PC1 has important implications for decarbonisation strategies. Countries positioned high on PC1 tend to rely more heavily on industry and transport, sectors which are traditionally more energy- and carbon-intensive. This finding suggests that targeted energy efficiency measures, electrification of transport, and industrial process optimisation would have the greatest impact in these cases.
The loadings heatmap (Figure 17) illustrates the contribution of each sector to PC1 and PC2.
For PC1, industry and transport have high positive loadings, whereas residential shows a negative loading—indicating an inverse relationship between industrial activity and household energy shares. PC2 is dominated by public/commercial energy use and electricity consumption.
The explained variance plot (Figure 18) shows that PC1 alone typically explains 40–50% of the total variance, while PC1 and PC2 together capture 70–80%, confirming that the essential structure of sectoral energy use can be represented in two dimensions without significant information loss.
Using the PCA scores, K-means clustering was performed to categorise countries (Figure 19). Three distinct clusters were identified:
  • Countries dominated by transport and residential sectors.
  • Countries with high industrial energy consumption.
  • Countries with a more balanced and diversified sectoral profile.
These clusters reveal clear regional patterns and could inform differentiated policy approaches for decarbonisation.
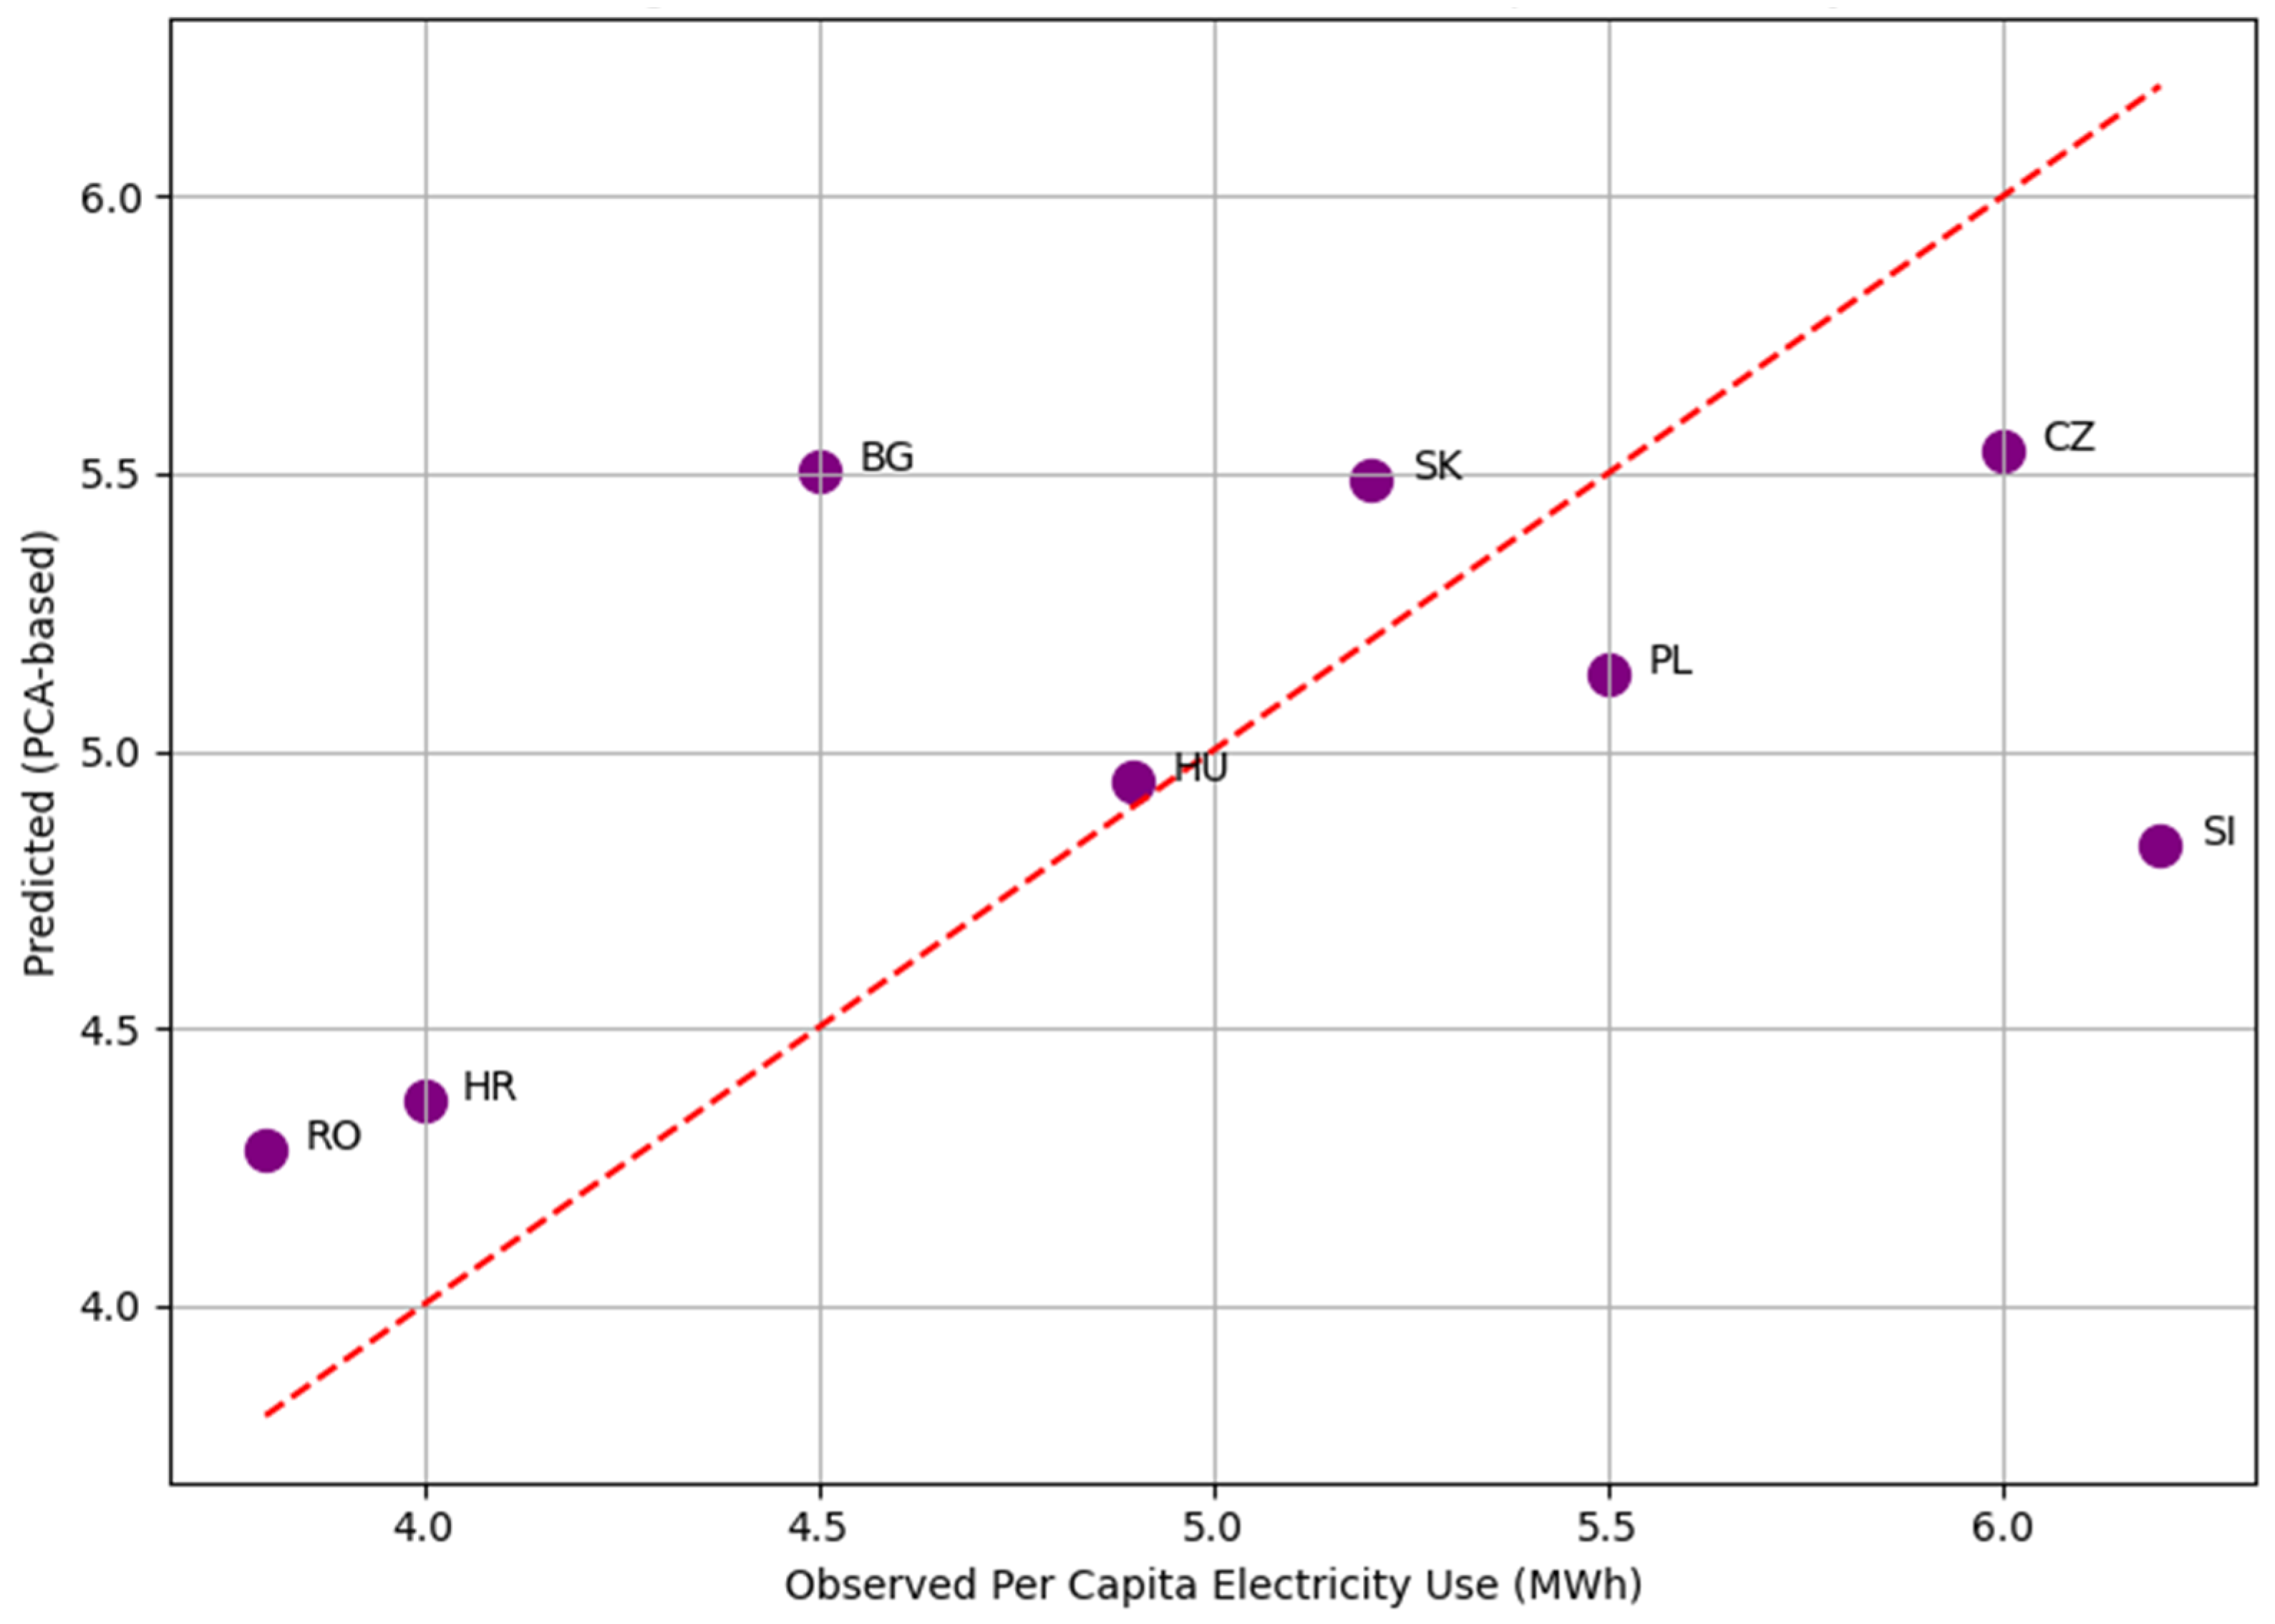
Figure 20 shows the results of a linear regression fitted to the PCA components to examine how well the principal components explain per capita electricity consumption.
The model showed a significant relationship with a high R2 value, indicating that the selected principal components effectively capture the differences in consumption levels. A visual comparison of the predicted and actual values further confirms the reliability of the model.
To quantify the relationship between sectoral patterns and electricity consumption, a PCA-based regression was conducted (Figure 20). The first two principal components served as predictors of the share of final electricity consumption. The regression results (Table 4) indicate that PC1 has a positive and statistically significant impact (β = 0.9724, p = 0.004), while PC2 is not significant. The model explains 84% of the variance (R2 = 0.841), indicating a strong fit.
However, in line with the reviewer’s observation, the relatively lower R2 values in electricity consumption models per capita suggest that additional explanatory variables—such as policy frameworks, energy pricing structures, and market liberalisation levels—may play a role but are not captured in the sectoral breakdown. The existing literature (e.g., IEA, 2022 [32]; Eurostat, 2023 [33]) supports this view, showing that political and institutional factors often have a measurable effect on energy demand patterns.

3.5. CO2 Emission Profiles

This section compares CO2 emission patterns based on sectoral distributions. The analysis considers the following variables:
  • Total CO2 emissions from fuel combustion (per capita or in Mt).
  • CO2 emissions by sector: industry, transport, and electricity and heat generation.
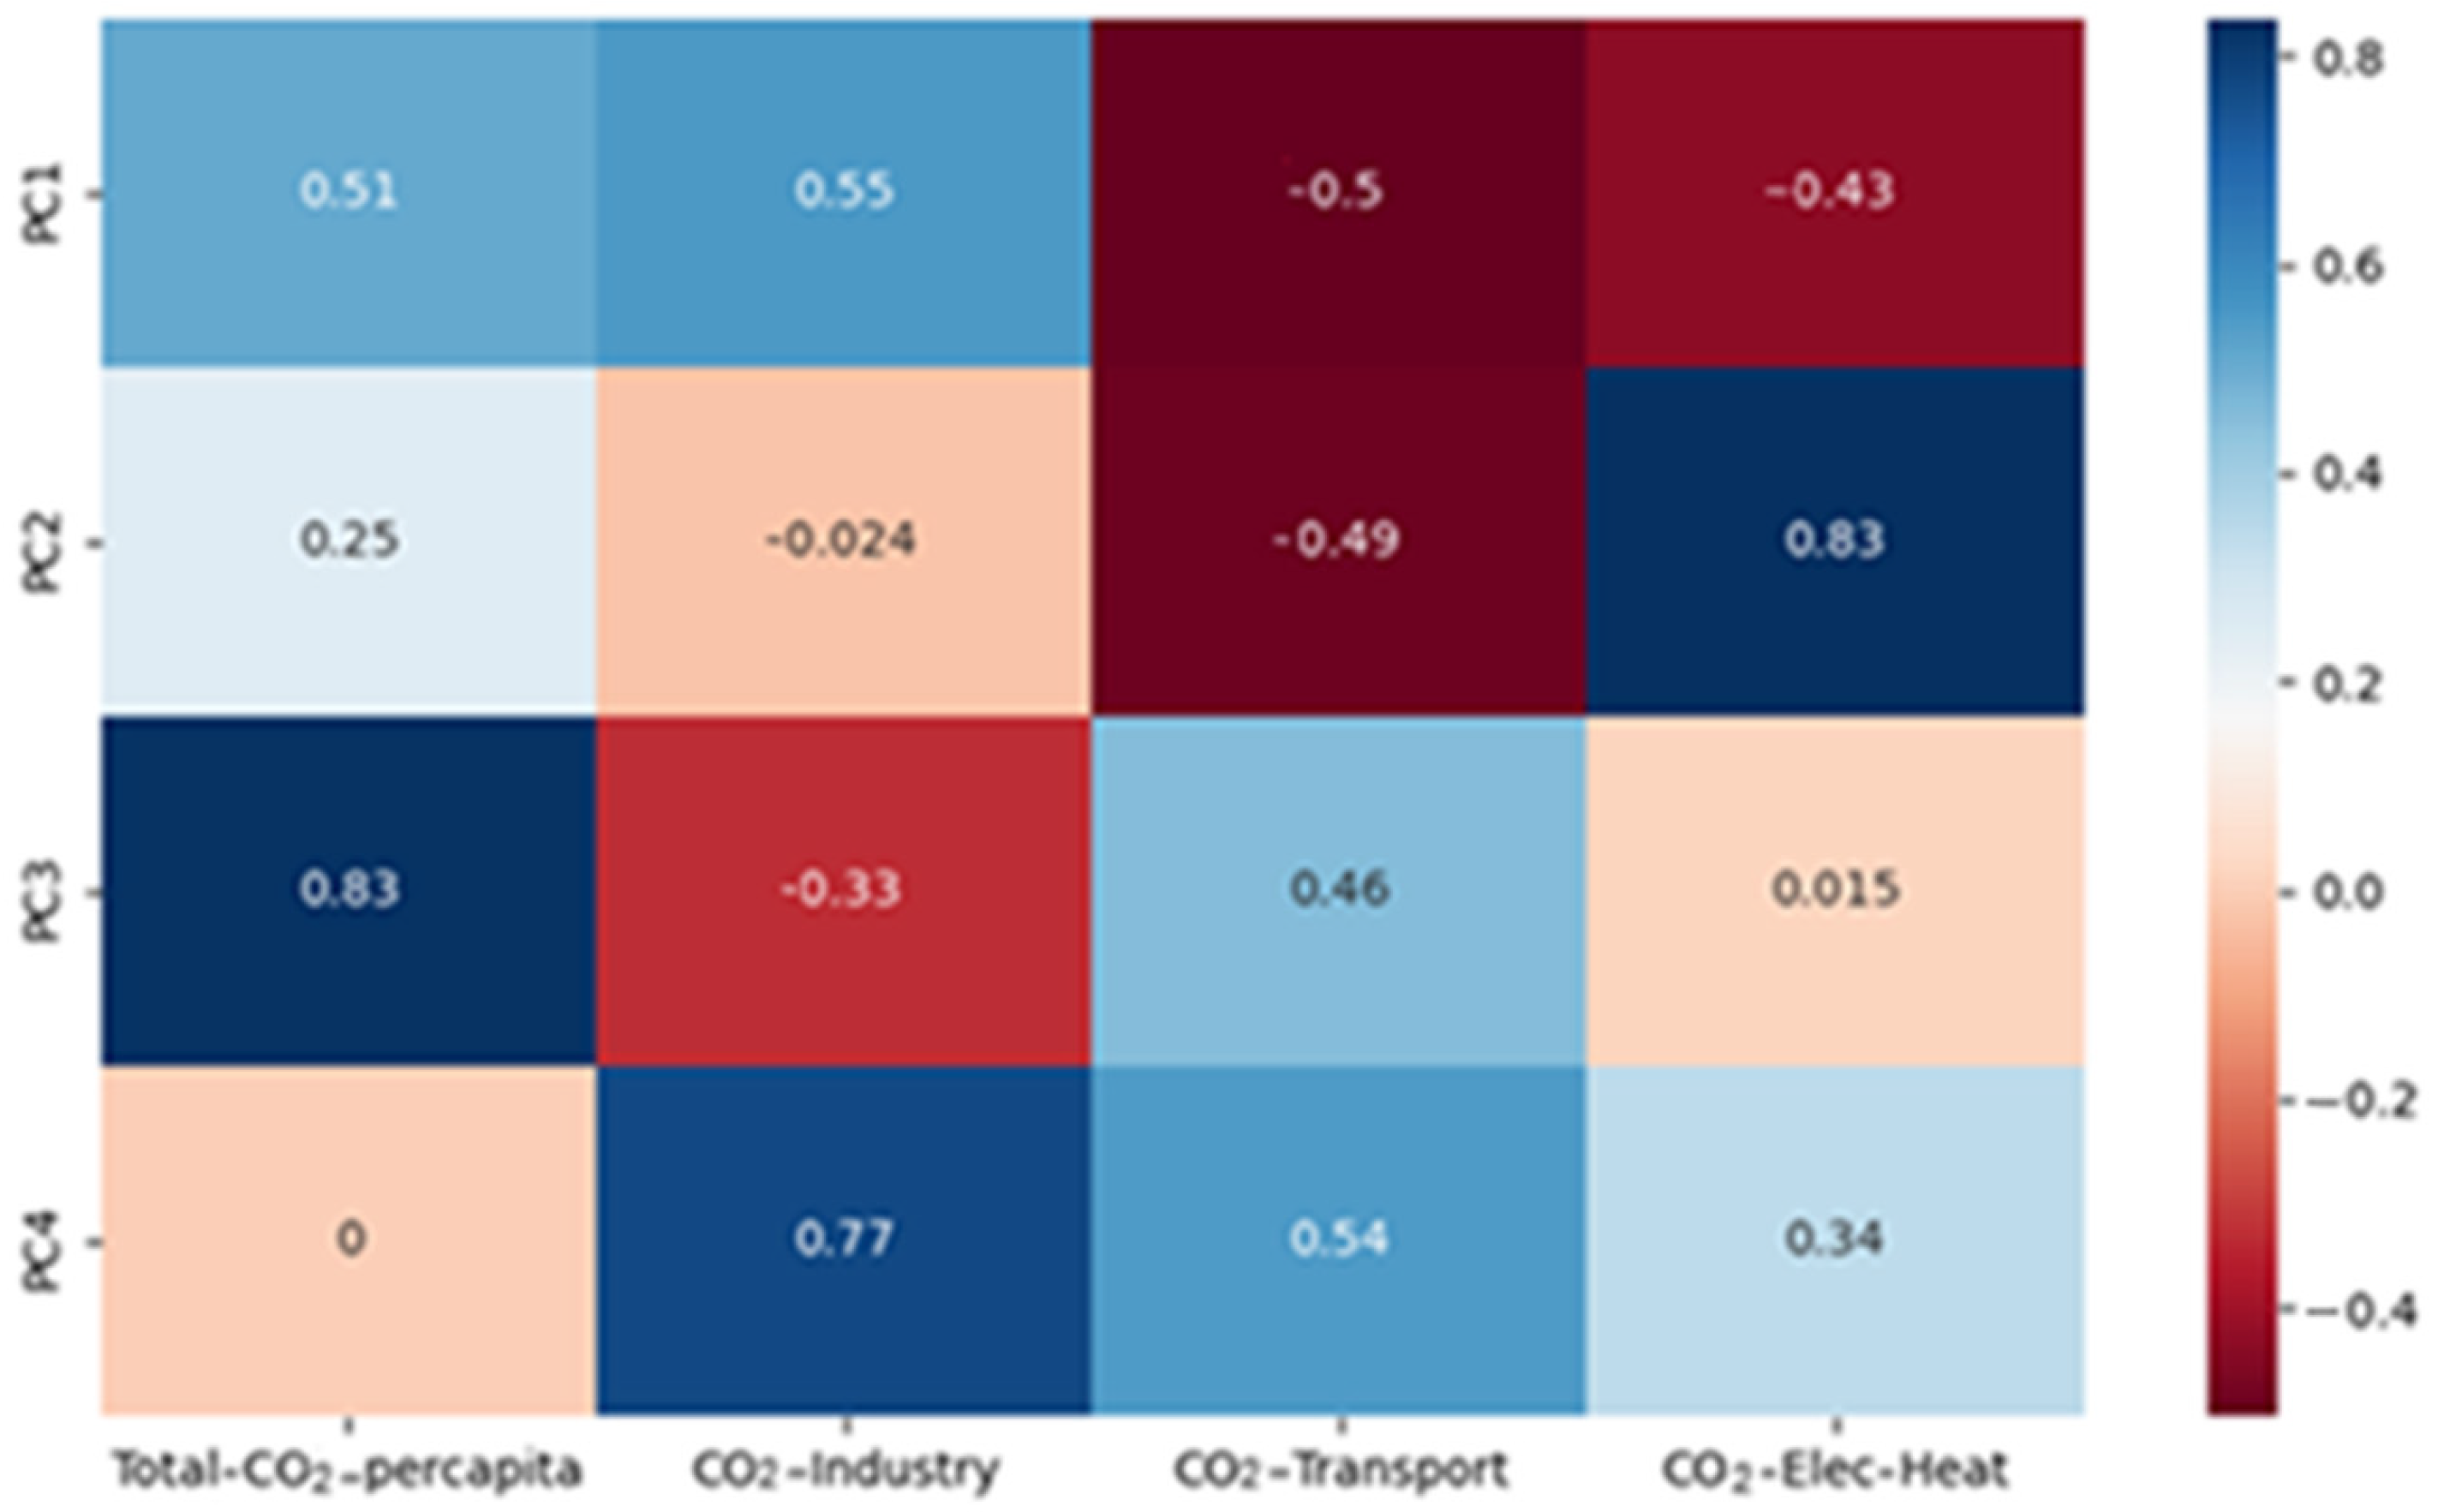
To investigate structural differences across countries, principal component analysis (PCA) was applied to sector-specific CO2 emissions and total per capita emissions. The PCA biplot (Figure 21) reveals that the first principal component (PC1) primarily captures variance associated with electricity and heat generation emissions, while the second principal component (PC2) reflects variation linked to the transport sector.
Countries with high emissions from fossil fuel–based electricity generation (e.g., Poland) are positioned in the positive PC1 direction, while countries with more dominant transport-related emissions (e.g., Croatia) appear along the positive PC2 axis.
From a decarbonisation strategy perspective, the large role of PC1 suggests that for PC1-positive countries, emission reduction policies must target electricity generation decarbonisation—for example, by phasing out coal, increasing renewable capacity, and improving grid efficiency. In contrast, PC2-positive countries would benefit most from transport electrification, modal shifts, and stricter fuel efficiency standards.
The loading heatmap (Figure 22) confirms that electricity sector emissions contribute most strongly to PC1, while transport sector emissions dominate PC2. Industrial emissions and per capita CO2 emissions have more moderate but complex influences, often spanning both components.
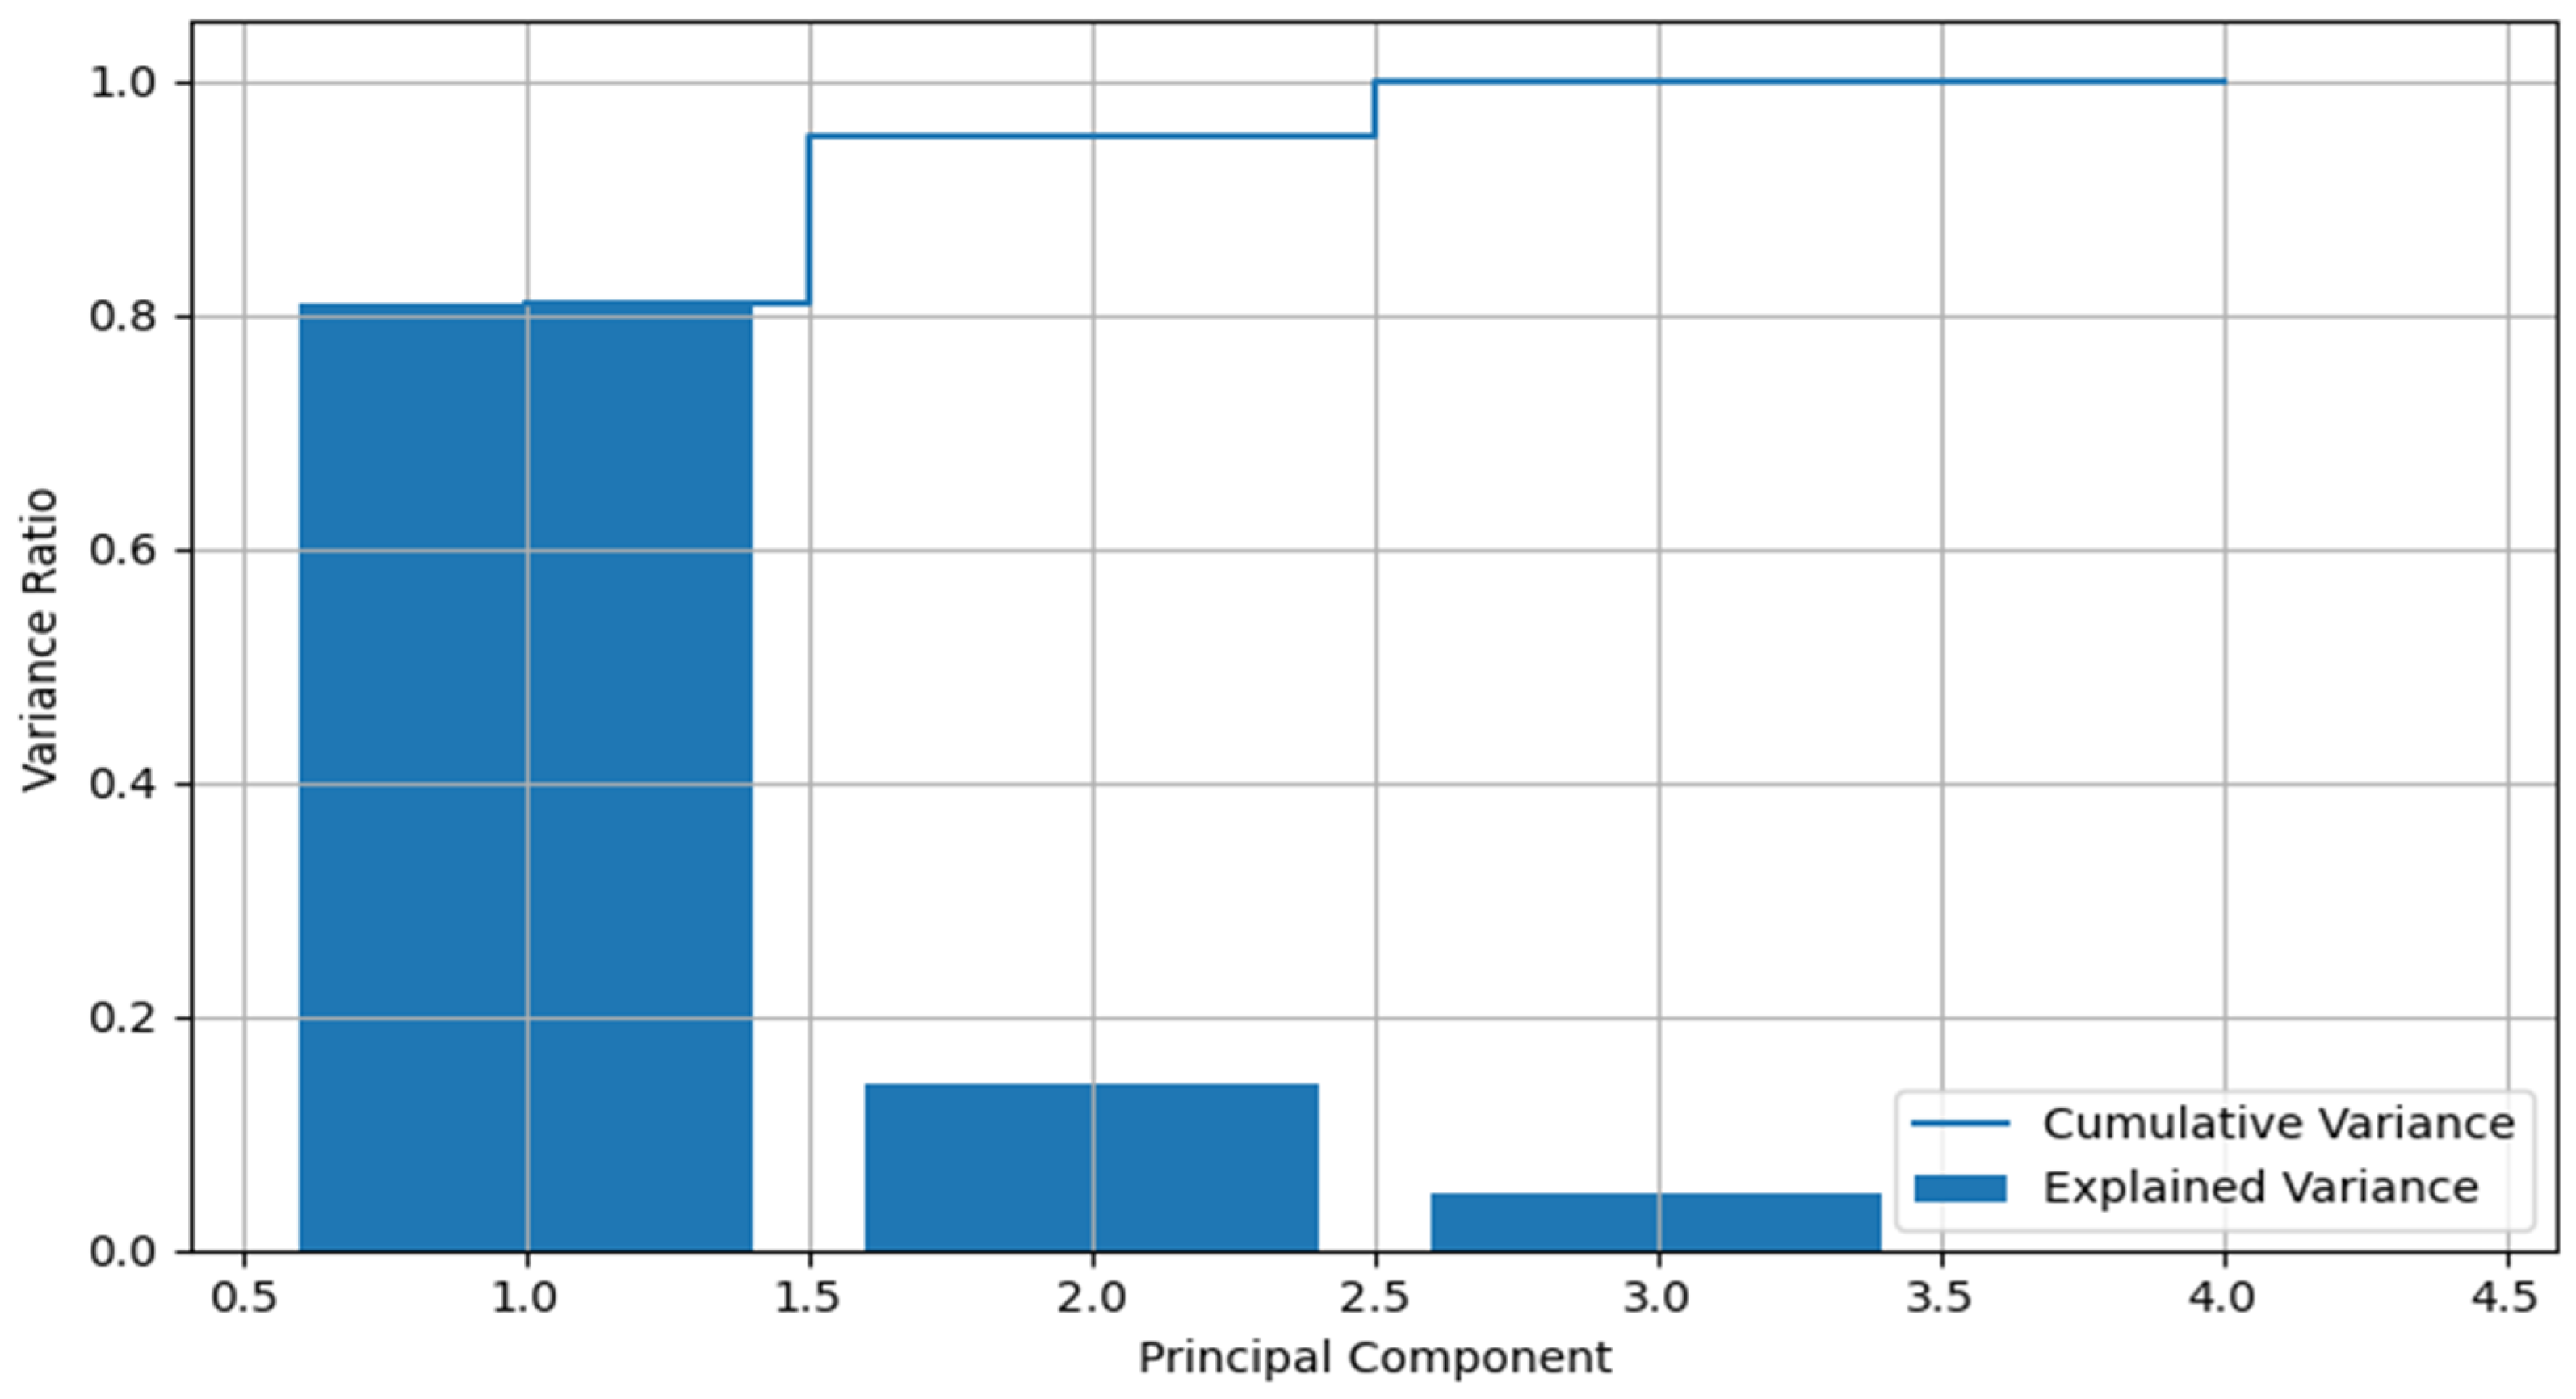
As shown in Figure 23, the first two principal components together account for over 85% of the variance in the dataset, indicating that the essential emission structure can be captured in two dimensions without significant information loss.
The K-means clustering results (Figure 24) classify countries into three groups:
  • Cluster 1—High electricity sector emissions from fossil fuel-dependent generation (e.g., BG, PL).
  • Cluster 2—Transport-dominated emissions with relatively low-carbon electricity generation (e.g., HR, SI).
  • Cluster 3—Balanced or moderate emission profiles without a single dominant sector (e.g., HU, SK).
These clusters provide a useful framework for targeted decarbonisation pathways, ensuring sector-specific interventions rather than uniform policy application.
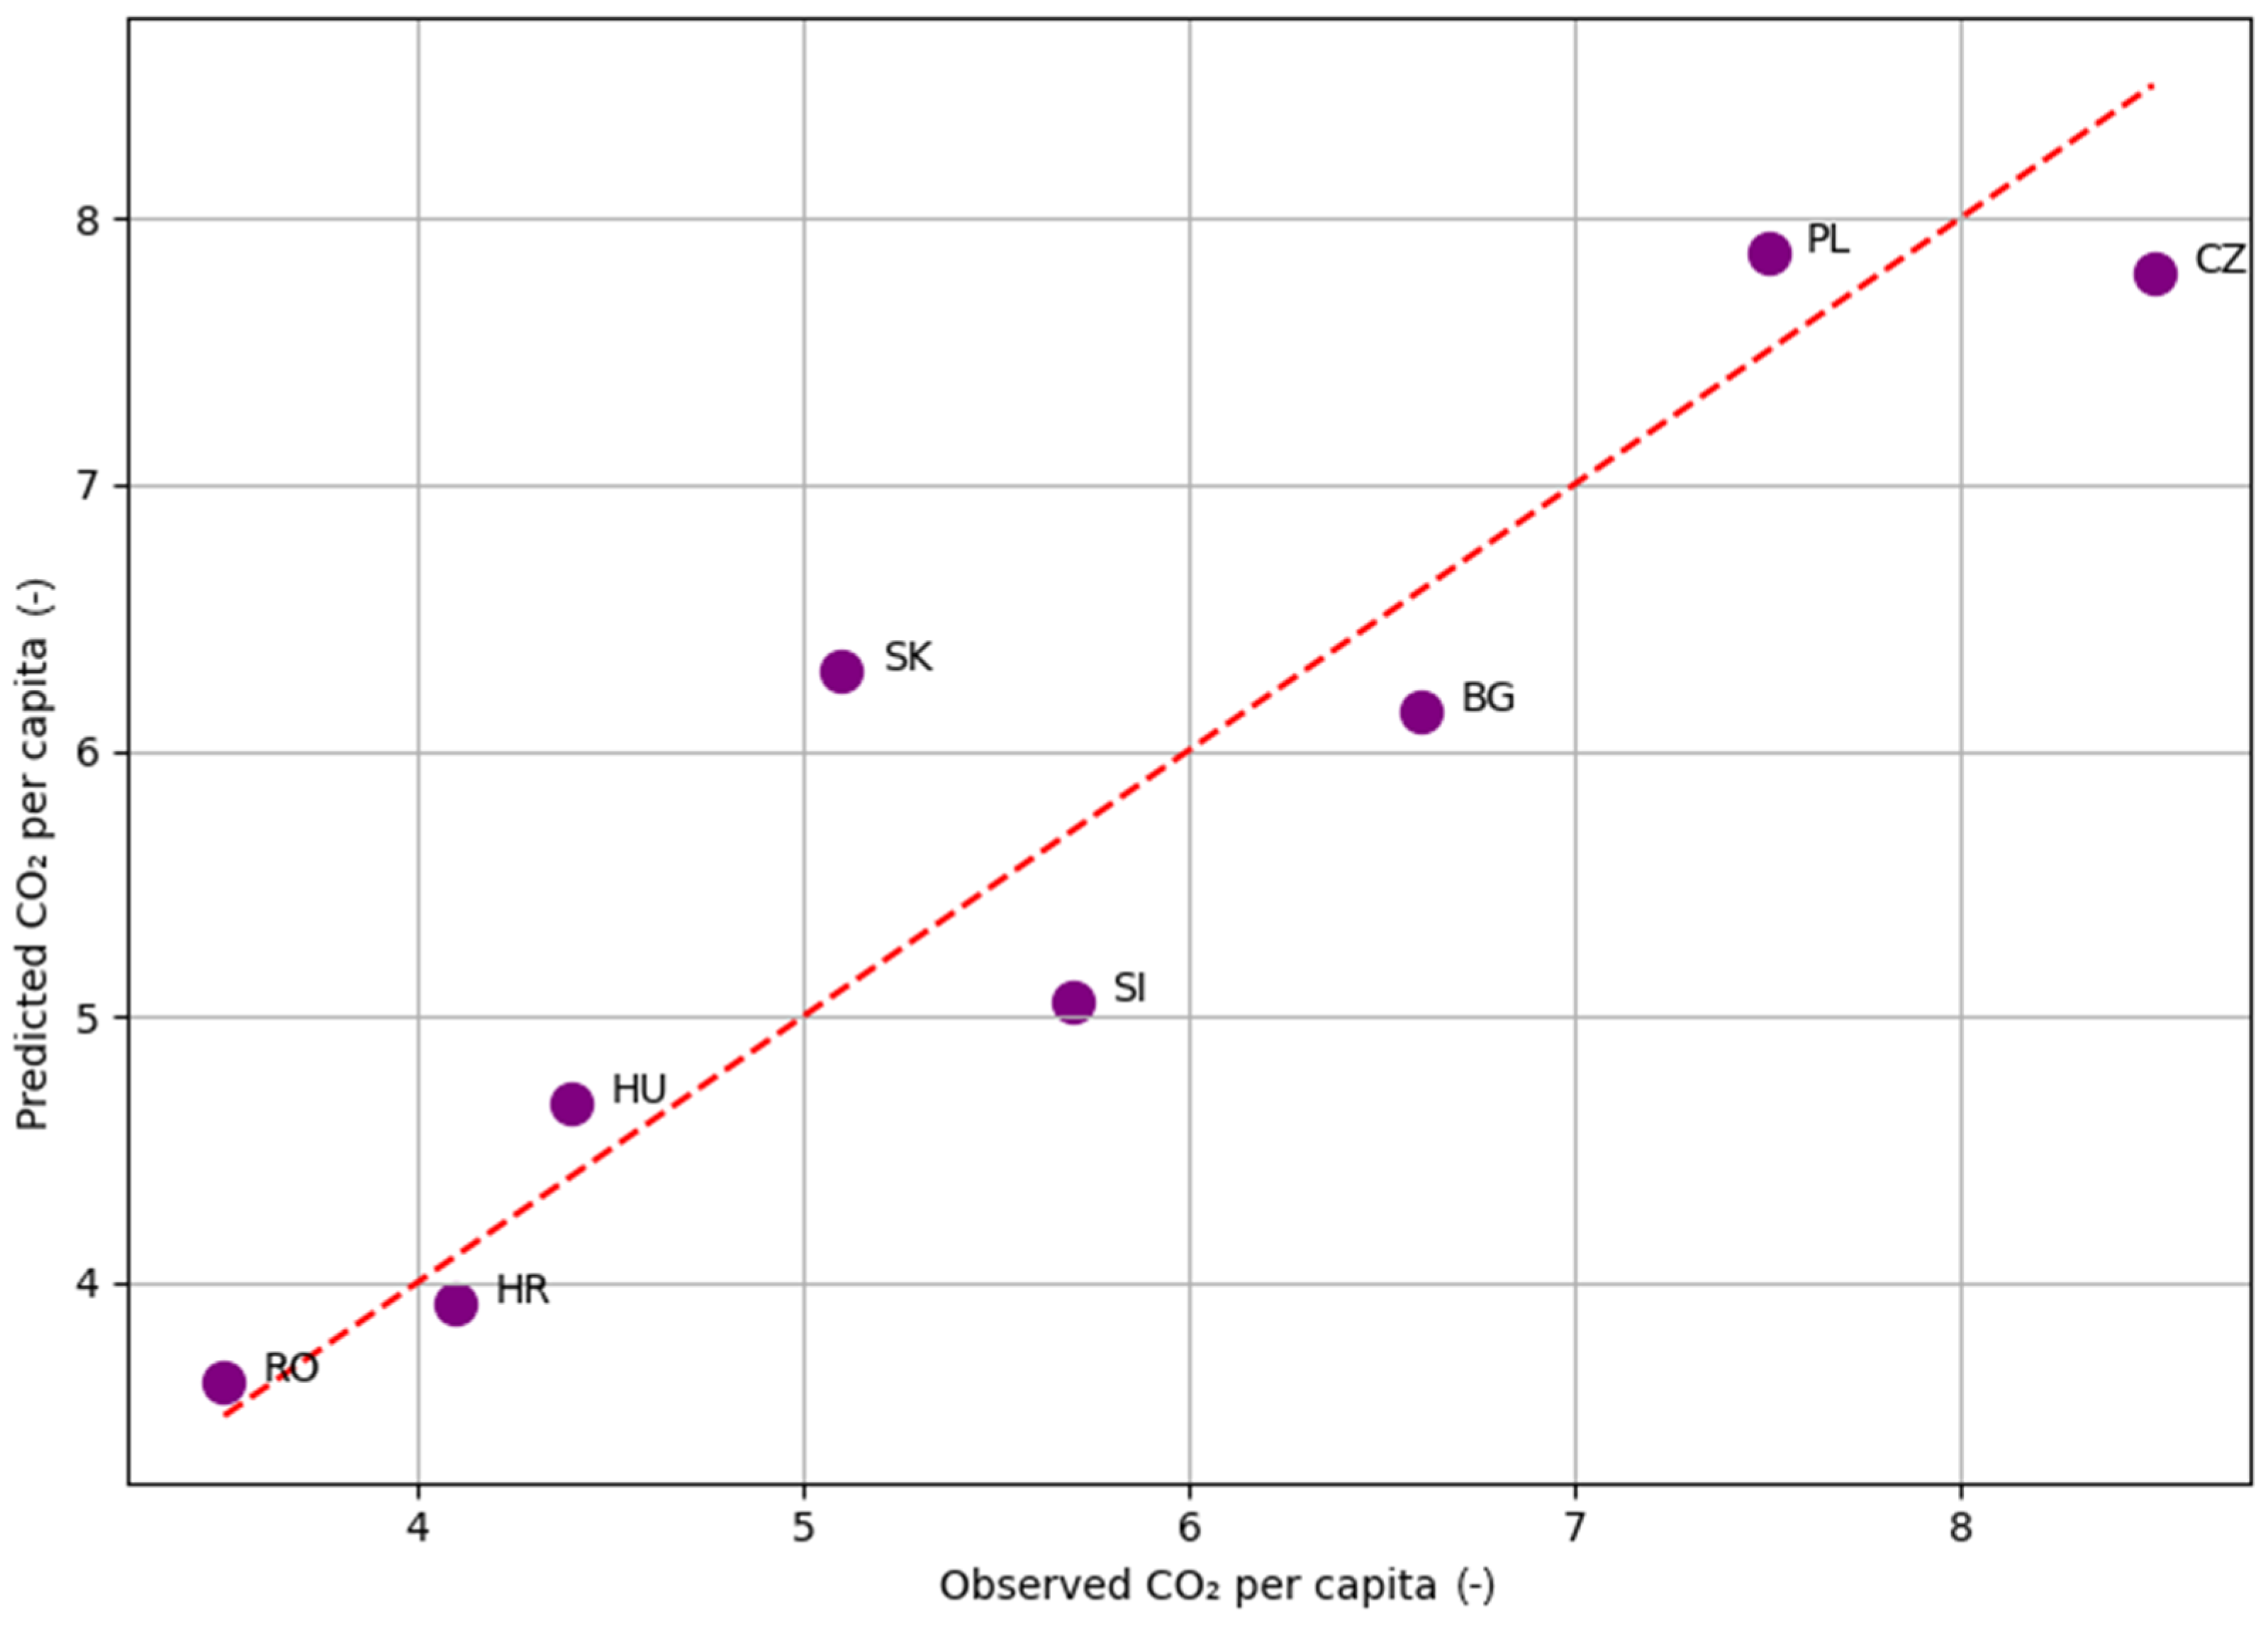
Figure 25 shows the PCA-based regression model to explain per capita CO2 emissions.
The regression model, which is based on the principal components, aims to predict the per capita CO2 emission values. The R2 of the model shows that the principal components explain the variance of specific emissions relatively well, with an accuracy of about 80–85%. The differences between the predicted and actual values are relatively small, and the model has significant predictive power, underlining the importance of the PCA components in characterising the emission profiles.
A PCA-based regression model was developed to explain per capita CO2 emissions using PC1 and PC2 as predictors (Figure 25 and Table 5). The model demonstrates strong explanatory power (R2 = 0.869, adjusted R2 = 0.817), with the F-test indicating statistical significance (F = 16.59, p = 0.006).
  • PC1 has a significant positive effect (β = 0.8286, p = 0.002), underscoring its importance as a driver of per capita CO2 emissions—consistent with PC1’s representation of electricity and industrial sector emissions.
  • PC2 has a positive but statistically insignificant coefficient (β = 0.4054, p = 0.300), indicating a supplementary role.
Residual diagnostics (Omnibus, Jarque–Bera) confirm normality, the Durbin–Watson statistic (1.857) rules out autocorrelation, and the condition number (2.39) confirms the absence of multicollinearity.
The findings align with prior studies (e.g., IEA, 2022 [32]; Eurostat, 2023 [33]), which emphasise the pivotal role of the electricity sector in shaping national emission profiles and the importance of transport sector decarbonisation in advanced economies. However, some variance remains unexplained—particularly in per capita emissions models for electricity consumption, where lower R2 values suggest missing structural drivers.
Potential factors not captured in this analysis include the following:
  • Political and regulatory frameworks (e.g., renewable subsidies, carbon pricing mechanisms).
  • Market structures and liberalisation levels, influencing investment in low-carbon generation.
  • Economic shocks or fuel price volatility, which can alter short-term energy mix and consumption patterns.
Addressing these in future models would improve predictive accuracy and policy relevance, enabling a more complete understanding of national emission trajectories.

3.6. Ranking by the Decarbonisation Level Index (DLI) Indicator

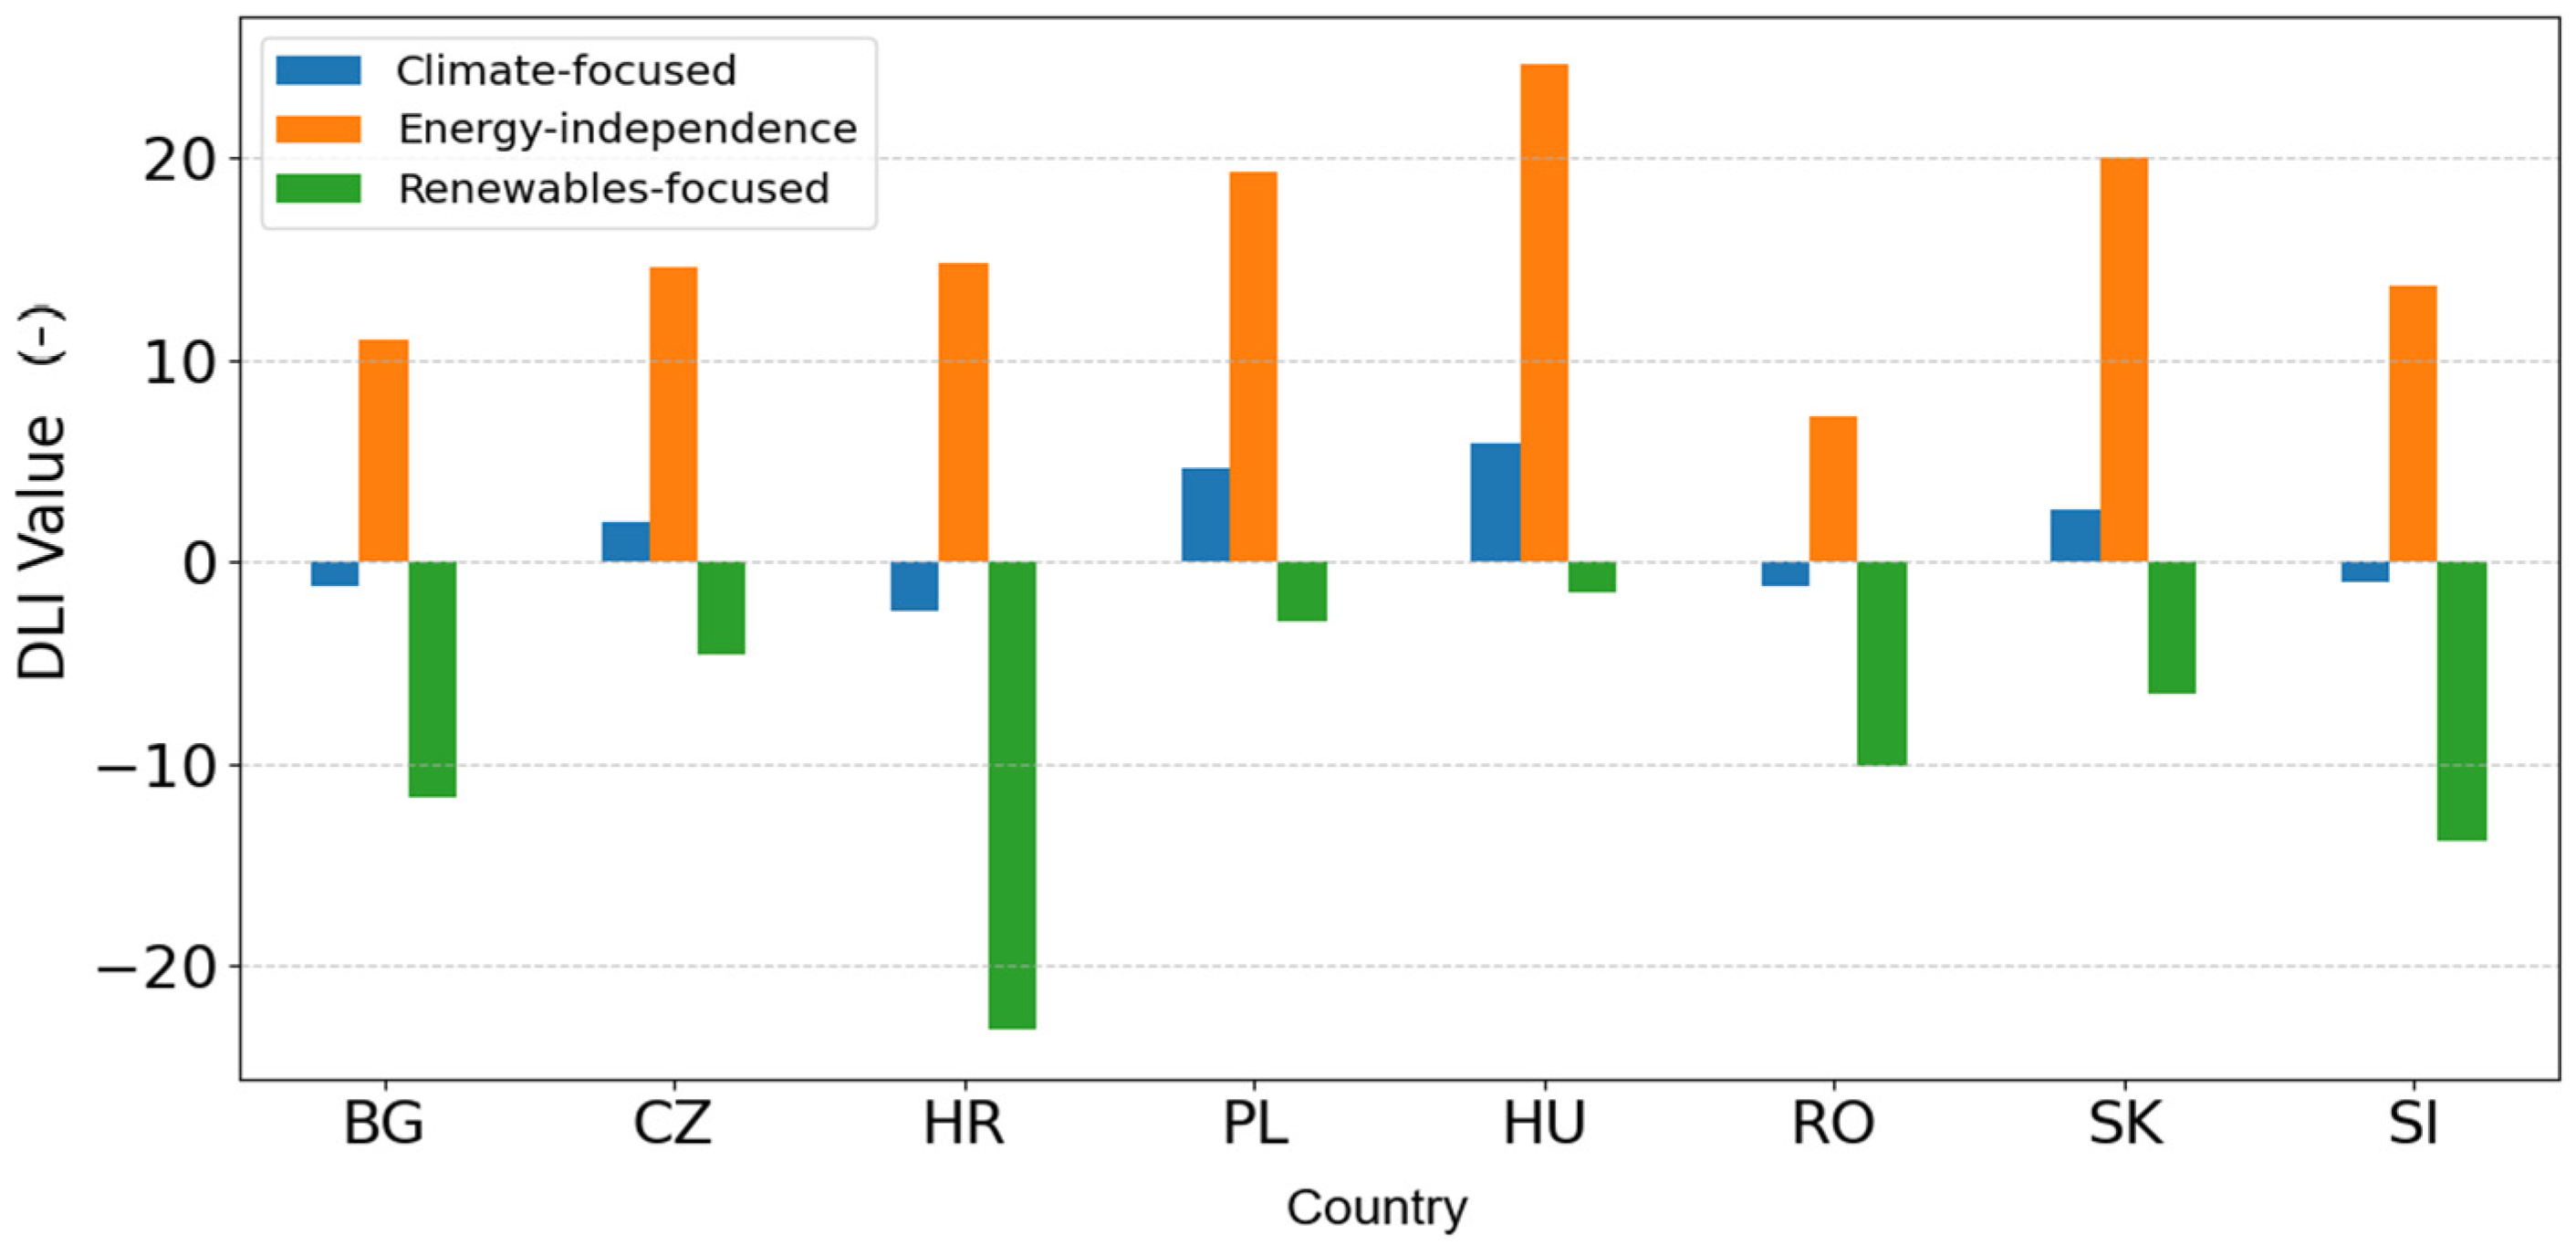
The comparative analysis of the eight Eastern European countries using the Decarbonization Level Index (DLI), according to Equation (12), highlights substantial differences in their strategic positioning under the three weighting scenarios (climate-focused, energy-independence, renewables-prioritised), as shown in Figure 26.
  • Climate-focused scenario (w1 = 0.5, w2 = 0.2, w3 = 0.2, w4 = 0.1): Countries with lower CO2 intensity and balanced low-carbon portfolios perform more favourably. Bulgaria, Romania, and Slovenia exhibit negative DLI values, reflecting advantageous conditions for decarbonization due to relatively low emission intensities and substantial renewable/nuclear shares. In contrast, Hungary and Poland register the highest DLI values, indicating structural disadvantages in terms of emission intensity and import dependency.
  • Energy-independence scenario (w1 = 0.2, w2 = 0.5, w3 = 0.2, w4 = 0.1): Here, import dependency dominates the assessment. Hungary emerges as the weakest performer (DLI = 24.6), followed by Poland and Slovakia, underlining their high reliance on external energy supplies. Romania (DLI = 7.2) and Bulgaria (11.0) rank more favourably, benefiting from a stronger domestic production base. These results confirm that energy security remains a central vulnerability for most of the region, particularly for landlocked states heavily dependent on gas imports.
  • Renewables-focused scenario (w1 = 0.2, w2 = 0.2, w3 = 0.5, w4 = 0.1): This perspective fundamentally reshapes the ranking. Croatia, Slovenia, and Bulgaria record strongly negative DLI values, reflecting their substantial renewable penetration. Conversely, Poland and Hungary exhibit relatively low values, which indicate a lower level of renewable energy integration into their systems, despite the fact that both countries face significant decarbonization requirements.
The DLI evaluation underscores the multidimensional nature of decarbonization strategies. No single country performs consistently well across all scenarios:
Bulgaria achieves advantageous positions in climate- and renewables-focused scenarios but remains moderately vulnerable on import dependency. Romania demonstrates resilience across all dimensions, representing a relatively balanced profile. Hungary and Poland consistently underperform, highlighting the need for accelerated renewable deployment and efficiency improvements to reduce both emissions and import reliance. Croatia and Slovenia emerge as leaders in renewable integration, though their structural import dependency still constrains long-term resilience. The Czech Republic and Slovakia exhibit mid-range performance, with strong nuclear contributions partly offsetting their fossil dependence.
Overall, the DLI provides a robust synthetic framework to evaluate trade-offs between emissions, energy security, and technology mix. The results reveal that while certain countries (e.g., Bulgaria, Romania, Slovenia) are strategically better positioned for the 2030 climate targets, others (e.g., Hungary, Poland) face significant challenges requiring targeted policy interventions and accelerated investment in clean energy infrastructure.
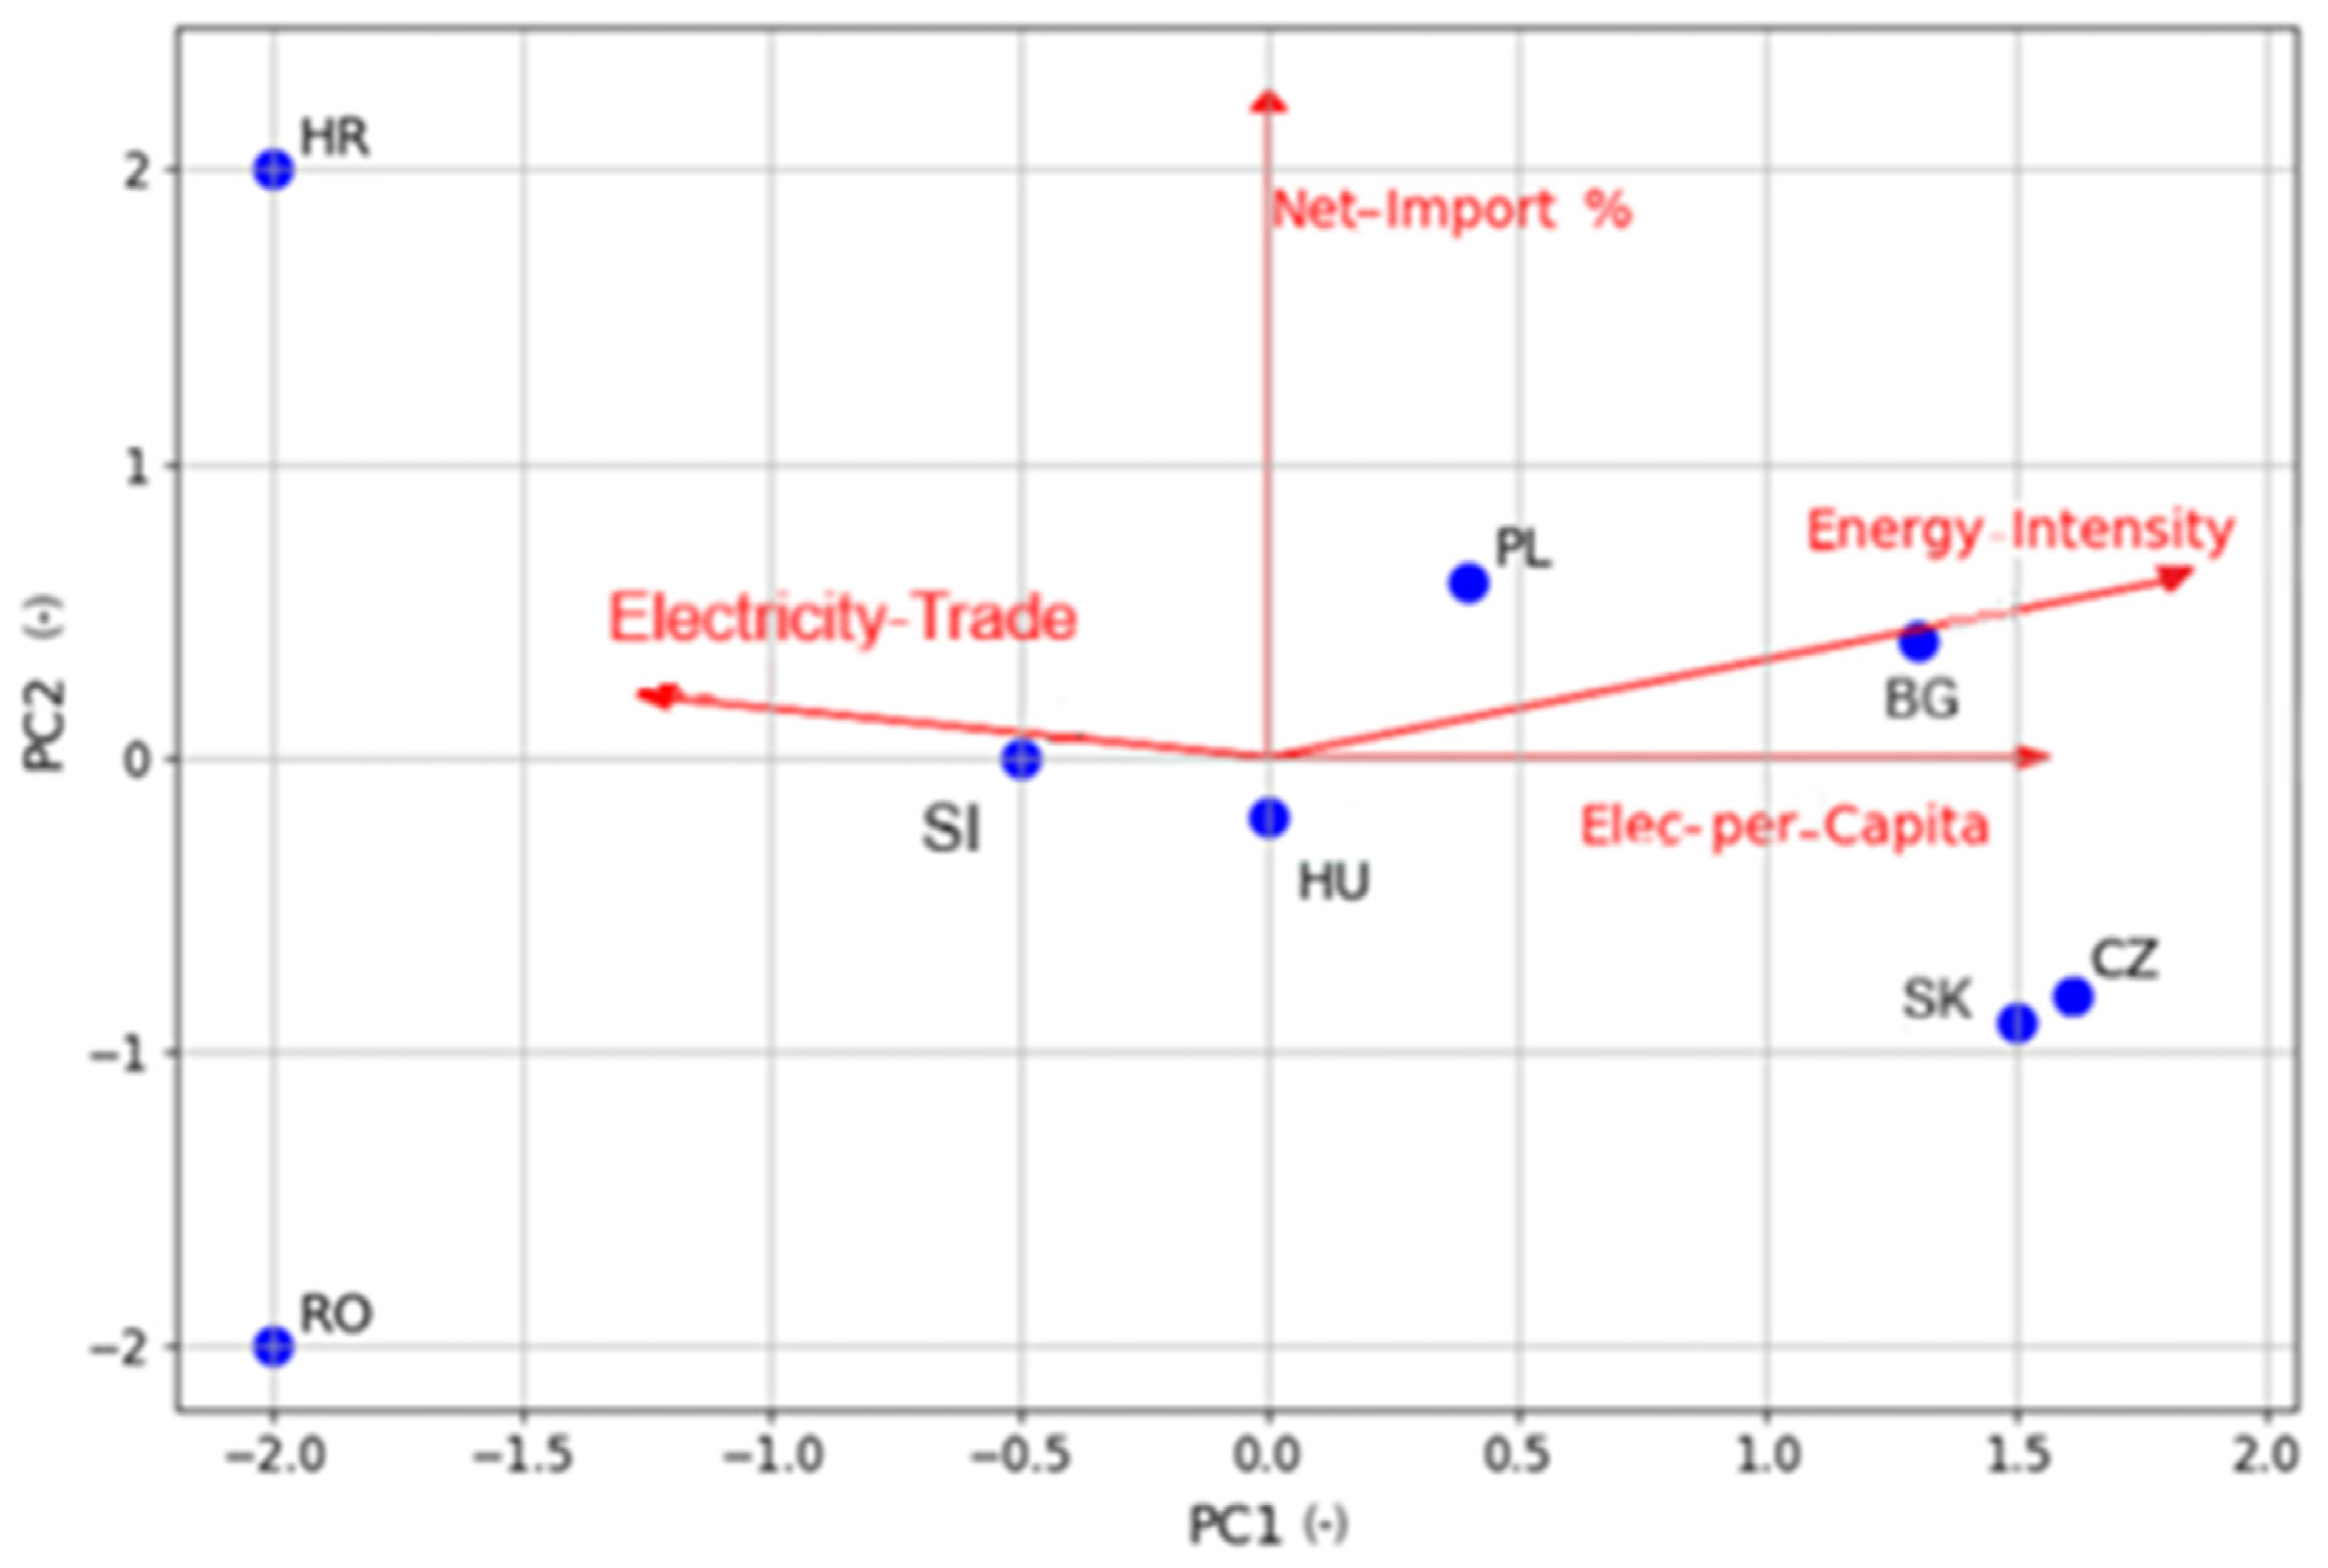
To further deepen the analysis, Figure 27 provides a classification of countries based on two additional strategic variables: energy intensity (measured in MJ per 2015 USD PPP) and net energy import share.
This positioning leads to a three-level typology:
  • Resilient countries, represented only by Romania (RO), combine a low net import dependency (28.1%) with the lowest energy intensity (1716 MJ/USD), indicating an advantageous structural position in terms of efficiency and autonomy.
  • Balanced countries such as the Czech Republic (CZ), Slovenia (SI), Poland (PL), and Bulgaria (BG) have moderate levels of imports and energy intensity. Although these countries are not particularly vulnerable, they would benefit from policy measures to increase energy efficiency and diversify energy sources.
  • Vulnerable countries, including Hungary (HU), Slovakia (SK), and Croatia (HR), are highly dependent on energy imports (over 57%) and/or have high energy intensity. These factors indicate that their energy systems are more vulnerable to supply disruptions and external price shocks.
Overall, the DLI, in combination with structural indicators such as import dependency and energy productivity, serves as a solid basis for energy policy formulation. Strategic interventions should prioritise the expansion of domestic renewable energy capacity, improving energy efficiency in industry, and reducing dependence on fossil fuels, especially in the more vulnerable states.
Table 6 provides an overview of the planned developments in the energy mix and their expected impact by 2030 for each country, calculated using Equations (13) and (14).
The aggregated results for all seven countries are summarised in Table 7.
Total energy increase (net) = Nuclear + Renewables − Coal decrease + Energy efficiency = (155.7 to 167.7) + (52 to 69) − (68 to 78) − (18 to 21) ≈ 122.7 to 137.7 TWh/year.
Total CO2 savings = (54.74 to 67.24) + (15.6 to 20.1) + (41.3 to 46.8) + (7.3 to 9.1) ≈ 118.9 to 143.2 Mt CO2/year.
  • The eight countries represent a subset of the EU’s total energy system; the EU27’s annual electricity consumption is roughly 3000 TWh (depending on the year).
  • The estimated net energy change of ~120–140 TWh/year corresponds to roughly 4–5% of the EU’s total electricity consumption.
  • The EU’s total annual CO2 emissions are about 2500–3000 Mt/year (all sectors, not just power).
  • So, the 118.9–143.2 Mt CO2/year savings represent roughly 4–5% of the EU’s total CO2 emissions.
  • Energy increase of ~120–140 TWh/year and CO2 savings of ~120–140 Mt/year in these eight countries is a significant contribution, but it is only part of the full EU picture.
Scaling this proportionally to the entire EU (assuming similar progress across all member states) might imply CO2 savings in the order of ~300–400 Mt/year or more, which would be a substantial contribution toward EU climate goals by 2030.

4. Conclusions

This study emphasises the complexity and diversity of energy systems in Eastern European countries, where structural differences in infrastructure, energy consumption, and import dependency create different challenges for advancing the energy transition. While EU policies such as the “Clean Energy for All Europeans” and “Fit for 55” packages provide an important policy basis for decarbonisation and energy security, the implementation of these targets varies significantly due to different national priorities and economic capacities.
For a successful and sustainable energy transition, strategic efforts to diversify energy sources, increase investment in infrastructure modernisation, and strengthen energy independence must be intensified—especially in the newer EU Member States, which remain heavily dependent on fossil fuel imports and outdated systems. Forecasts indicate that expanding nuclear energy, increasing renewable energy capacity, and improving energy efficiency will play a key role in reducing CO2 emissions and import dependency.
The policy framework should be sufficiently flexible to take into account country-specific circumstances while promoting greater regional coordination to achieve common climate and energy security goals. Addressing these challenges requires a multi-pronged approach that integrates technological innovation, financial mechanisms, and social acceptance to ensure effective implementation.
Table 8 summarises the empirical findings (energy mix, sectoral consumption, electricity generation, DLI, intensity, imports, and projected developments for 2030) and provides tailored decarbonization recommendations for each of the eight analysed countries. Furthermore, it presents how the “Clean Energy for All Europeans” [55] and “Fit for 55” [56] policy packages shape the energy transition options available to these countries.
The “Clean Energy for All Europeans” [55] and “Fit for 55” [56] packages significantly shape the energy transition pathways of the analysed countries through a combination of regulatory, market, and financial mechanisms. Key directives such as the Renewable Energy Directive (RED series) [57] raise national renewable energy targets and establish support frameworks, thereby accelerating the deployment of solar and wind power across the region. Energy efficiency improvements, driven by the Energy Efficiency Directive (EED) [58] and the Buildings Directive (EPBD) [59], contribute substantially to demand reduction, benefiting countries like Hungary, Poland, Croatia, and Romania.
The reform of the Emissions Trading System (ETS) [60] and enhanced carbon pricing under the Fit for 55 package [51] strongly penalise coal- and gas-dependent sectors, accelerating coal phase-out particularly in Poland, Bulgaria, and Czechia, while encouraging industry electrification and adoption of low-carbon fuels. Complementary mechanisms such as Effort Sharing Regulation (ESR) [61] and the Carbon Border Adjustment Mechanism (CBAM) [62] create further incentives for domestic emission reductions and sustainable industrial supply chains.
Market and infrastructure measures enhance integration and cross-border flexibility, especially benefiting countries with high shares of variable renewables like Croatia, Romania, and Slovenia. Meanwhile, financing instruments including the Modernisation Fund [63], Just Transition Fund [64], and REPowerEU [5] provide crucial capital support for coal region transitions, grid modernization, and major nuclear investments.
Overall, the policy packages combine “carrots”—funding and regulatory support for renewables, efficiency, and just transition—with “sticks”—stricter carbon constraints and increased ETS prices—to drive decarbonization. While coal-reliant countries face higher near-term adjustment costs, they also gain access to targeted funding. In contrast, countries with established low-carbon assets are better positioned to meet 2030 targets, focusing on flexibility and electrification.
For successful implementation, short-term priorities (until 2027) include advancing shovel-ready grid and storage projects, accelerating building renovations, and expanding transport charging infrastructure. Medium-term efforts (until 2030) should focus on coal exit pathways, scaling utility renewables, and deploying large-scale storage and system integration solutions. Key performance indicators to monitor progress include renewable energy share, electricity consumption trends normalised by GDP, per capita CO2 emissions, fossil fuel share in primary energy, and alignment with national energy and climate plans (NECPs).
This study provides a comprehensive, multidimensional assessment of the energy systems in eight Eastern European countries, filling a crucial gap in our understanding of the particular challenges of the energy transition in this region. Its novelty lies in several key contributions:
  • Integrated multivariate analysis: by applying advanced statistical methods such as Principal Component Analysis (PCA), clustering, and regression modelling to various energy indicators—including production, sectoral consumption, emissions profiles, and energy independence—the study reveals structural patterns and country groupings that go beyond simple country comparisons. This approach allows policy makers to identify customised intervention points that reflect the unique dynamics of each country’s energy system.
  • Introduction of the Decarbonisation Level Index (DLI) indicator: The DLI summarises domestic energy production relative to consumption, coupled with decarbonisation and innovation metrics, providing a novel composite measure to assess energy security alongside climate targets. This indicator improves the ability to track progress towards energy independence and sustainability in an integrated framework.
  • Explicit contextualisation within the EU policy framework: In contrast to much previous work, this study situates national energy strategies within the evolving EU regulatory landscape (e.g., “Clean Energy for All Europeans” and “Fit for 55”), and shows how these supranational policies contribute to, but do not fully resolve, the heterogeneity of the energy transition in the newer and older EU Member States in Eastern Europe.
  • Forward-looking scenario analysis: The inclusion of quantified projections for nuclear capacity expansion, renewable energy growth, coal phase-out, and energy efficiency improvements through 2030 provides actionable insights into the potential scale of CO2 emissions reductions and energy security improvements. This is a valuable decision-making tool for aligning investments and policies with the EU’s climate targets.
Despite these strengths, the study has some limitations that deserve attention:
  • Data limitations and temporal coverage: The analysis relies on publicly available, harmonised datasets that mostly reflect the latest available years (mostly 2022–2023). Although this is necessary for comparability, this temporal snapshot may limit the ability to capture rapid or recent changes, such as those caused by geopolitical events or new technologies.
  • Sample size and regional focus: The focus on eight selected Central and Eastern European countries provides depth and regional specificity, but limits the generalisability of the results to broader European or global contexts. Future extensions could include additional countries or cross-regional comparisons to validate and enrich the identified typologies.
  • Lack of consideration of socio-economic and behavioural determinants: While the multivariate methods effectively highlight structural energy patterns, they do not fully capture important socio-economic, political, and behavioural factors—such as energy price mechanisms, market liberalisation, public acceptance, or climate policy ambition—that significantly influence energy consumption and the dynamics of the energy transition. The inclusion of these variables in future models could improve the explanatory power and political relevance.
  • Simplified assumptions in the scenario projections: While the quantified short-term projections are based on official plans and capacity factors, they inherently simplify the complex market dynamics, regulatory changes, and infrastructure development challenges. Deviations in the real world due to policy changes, supply chain disruptions, or technological breakthroughs could significantly impact the results.
In summary, this study enhances the understanding of energy transition pathways in a strategically important but understudied European region by combining rigorous data-driven analysis with policy contextualisation. The recognition of its limitations points to fruitful avenues for future research, including deeper integration of socio-economic variables, extension to broader geographical scales, dynamic modelling tools, and more detailed assessments of technological challenges and market integration. Policy makers can use the results and indicators presented here to develop more targeted, coordinated, and sustainable energy strategies that fulfil the dual goals of climate change mitigation and energy security for Eastern Europe.
Future research should analyse how national energy strategies can be aligned with EU-wide targets, with a focus on overcoming infrastructure gaps, investment barriers, and policy constraints. This analysis provides important insights and practical guidance for policy makers seeking to develop a coordinated yet customised energy policy, which is essential for a resilient and low-carbon energy future in Eastern Europe.

Author Contributions

Conceptualization, R.S. and M.B.; methodology, R.S. and M.B.; software, R.S.; validation, R.S. and M.R.-M.; formal analysis, R.S.; investigation, R.S. and M.B.; resources, R.S. and I.A.; data curation, R.S.; writing—original draft preparation, R.S. and M.B.; writing—review and editing, R.S., M.B., M.R.-M. and I.A.; visualization, R.S. and M.R.-M.; supervision, R.S.; project administration, I.A. All authors have read and agreed to the published version of the manuscript.

Funding

This research received no external funding.

Data Availability Statement

The original contributions presented in this study are included in the article. Further inquiries can be directed to the corresponding author.

Conflicts of Interest

The authors declare no conflicts of interest.

References

  1. Eurostat. EU Energy Mix and Import Dependency. 2022. Available online: https://ec.europa.eu/eurostat/statistics-explained/index.php?title=Archive:EU_energy_mix_and_import_dependency (accessed on 14 August 2025).
  2. Christou, O. Energy Security in Turbulent Times Towards the European Green Deal. Politics Gov. 2021; 9, 360–369. [Google Scholar]
  3. Monaghan, A.; Energy Security: NATO’s Limited, Complementary Role. Research Division—NATO Defense College, Rome No. 36, 2008. Available online: https://www.files.ethz.ch/isn/56022/rp_36en.pdf (accessed on 4 September 2025).
  4. Mišík, Matúš. The EU needs to improve its external energy security. Energy Policy 2022, 165, 112930. [Google Scholar] [CrossRef]
  5. European Commission. REPowerEU Plan COM/2022/230 Final (2022). Available online: https://eur-lex.europa.eu/legal-content/EN/TXT/?uri=COM:2022:230:FIN (accessed on 14 August 2025).
  6. European Parliament, Renewable Energy: Setting Ambitious Targets for Europe, Last Updated: 21-03-2024. Available online: https://www.europarl.europa.eu/topics/en/article/20171124STO88813/renewable-energy-setting-ambitious-targets-for-europe (accessed on 14 August 2025).
  7. Leimbach, B.; Müller, F. European Energy Policy: Balancing National Interests and the Need for Policy Change: The Current European Energy Dialogue. In Climate and Energy Papers Documentation; Friedrich-Ebert-Stiftung, International Dialogue: Berlin, Germany, 2008; Available online: https://library.fes.de/pdf-files/id/06633.pdf (accessed on 4 September 2025).
  8. Rochet, A.; Hanoteaux, R. Lessons from the European Reaction to the War in Ukraine. E3G, 20 February 2023. Available online: https://www.e3g.org/news/lessons-from-the-european-reaction-to-the-war-in-ukraine/ (accessed on 14 August 2025).
  9. Bordoff, J.; O’Sullivan, M.L. The Age of Energy Insecurity. Foreign Affairs, 10 April 2023. Available online: https://www.foreignaffairs.com/world/energy-insecurity-climate-change-geopolitics-resources (accessed on 14 August 2025).
  10. Isbrekken, A.T. The Green Transition: Who Will Be the Geopolitical Winners–and Losers? 2019. Available online: https://partner.sciencenorway.no/nupi-renewableenergy/the-green-transition-who-will-be-the-geopolitical-winners--andlosers/1603800 (accessed on 14 August 2025).
  11. Pérez, M.E.M.; Scholten, D.; Smith Stegen, K. The Multi-Speed Energy Transition in Europe: Opportunities and Challenges for EU Energy Security. Energy Strategy Rev. 2019, 26, 100415. [Google Scholar] [CrossRef]
  12. Deák, A. Európa három klímapolitikai régiója: Kelet-Közép-Európa mint a kívülről vezérelt energiaátmenet modellje. In A Nemzetközi jog, az uniós jog és a Nemzetközi Kapcsolatok Szerepe a 21. Században; Kajtár, G., Sonnevend, P., Eds.; ELTE Eötvös Kiadó: Budapest, Hungary, 2021; pp. 653–666. [Google Scholar]
  13. Kuzemko, C.; Bradshaw, M.; Bridge, G.; Goldthau, A.; Jewell, J.; Overland, I.; Scholten, D.; Van de Graaf, T.; Westphal, K. COVID-19 and the Politics of Sustainable Energy Transitions. Energy Res. Soc. Sci. 2020, 68, 101685. [Google Scholar] [CrossRef] [PubMed]
  14. Doig, A.; Kvac, B.; Urbanová, B.; Hofmann, E.; Kahmann, M.; Hentschke, M.; Ferreira, F.; Higgins, J.; Clausen, J.; Christensen, T.D.; et al. Ranking of EU Countries’ Ambition and Progress in Fighting Climate Change; Climate Action Network Europe: Brussels, Belgium, 2018. [Google Scholar]
  15. Mengxuan, T.; Khan, K.; Cifuentes-Faura, J.; Sukumaran, S. Technological Innovation and Energy Efficiency in Central Eastern European Countries. Util. Policy 2024, 88, 101761. [Google Scholar] [CrossRef]
  16. Lamb, W.F.; Grubb, M.; Diluiso, F.; Minx, J.C. Countries with Sustained Greenhouse Gas Emissions Reductions: An Analysis of Trends and Progress by Sector. Clim. Policy 2022, 22, 1–17. [Google Scholar] [CrossRef]
  17. Mitić, P.; Fedajev, A.; Radulescu, M.; Rehman, A. The Relationship between CO2 Emissions, Economic Growth, Available Energy, and Employment in SEE Countries. Env. Sci. Pollut. Res. 2023, 30, 16140–16155. [Google Scholar] [CrossRef] [PubMed]
  18. Nichifor, B.; Zait, L.; Turcu, O. Renewable Investments, Environmental Spending, and Emissions in Eastern Europe: A Spatial-Economic Analysis of Management and Policy Decisions Efficiency. Sustainability 2025, 17, 3010. [Google Scholar] [CrossRef]
  19. Ioan, G.; Bălănică, C.M.D.; Carmen, S.G.; Pirju, I.S.; Beldiman, C.M. The Green Dilemma: Energy Efficiency, Renewables and Economic Challenges in Eastern Europe. Energy Policy 2025, 206, 114791. [Google Scholar] [CrossRef]
  20. Apata, O. Decarbonization Pathways through Multi-Energy System Planning. Energy Rep. 2025, 13, 4477–4490. [Google Scholar] [CrossRef]
  21. Alabi, T.M.; Agbajor, F.D.; Yang, Z.; Lu, L.; Ogungbile, A.J. Strategic Potential of Multi-Energy System towards Carbon Neutrality: A Forward-Looking Overview. Energy Built Environ. 2023, 4, 689–708. [Google Scholar] [CrossRef]
  22. European Commission. Leyen. The European Green Deal. Available online: https://commission.europa.eu/strategy-and-policy/priorities-2019-2024/european-green-deal_en (accessed on 8 August 2025).
  23. European Commission Directive (EU) 2023/2413 of the European Parliament and of the Council of 18 October 2023 Amending Directive (EU) 2018/2001, Regulation (EU) 2018/1999 and Directive 98/70/EC as Regards the Promotion of Energy from Renewable Sources. Off. J. Eur. Union 2023, 2413, 1–77.
  24. The European Parliament and the Council of the European Union Directive (Eu) 2023/1791 ff the European Parliament and of the Council of 13 September 2023 on Energy Efficiency and Amending Regulation (EU) 2023/955 (Recast) (Text with EEA Relevance). Off. J. Eur. Union 2023, 2023, 1–231.
  25. Regulation (EU) 2018/842 Regulation (EU) 2018/842 of the European Parliament and the Council of 30 May 2018 on Binding Annual Greenhouse Gas Emission Reductions by Member States from 2021 to 2030 Contributing to Climate Action to Meet Commitments under the Paris Agreement and Amending Regulation (EU) No 525/2013. Off. J. Eur. Union 2018, 156, 26–42.
  26. European Commission. Fit for 55: Delivering on the Proposals. Available online: https://commission.europa.eu/strategy-and-policy/priorities-2019-2024/european-green-deal/delivering-european-green-deal/fit-55-delivering-proposals_en (accessed on 14 August 2025).
  27. Greenacre, M.; Groenen, P.J.F.; Hastie, T.; D’Enza, A.I.; Markos, A.; Tuzhilina, E. Principal component analysis. Nat. Rev. Methods Primers 2022, 2, 100. [Google Scholar] [CrossRef]
  28. James, G.M.; Nielsen, M.Ø.; Webb, M.D. Testing for the appropriate level of clustering in linear regression models. J. Econom. 2023, 235, 2027–2056. [Google Scholar] [CrossRef]
  29. Hoffmann, J.P. Linear Regression Models, 1st ed.; Chapman and Hall/CRC: New York, NY, USA, 2021. [Google Scholar] [CrossRef]
  30. Gostkowski, M.; Rokicki, T.; Ochnio, L.; Koszela, G.; Wojtczuk, K.; Ratajczak, M.; Szczepaniuk, H.; Bórawski, P.; Bełdycka-Bórawska, A. Clustering Analysis of Energy Consumption in the Countries of the Visegrad Group. Energies 2021, 14, 5612. [Google Scholar] [CrossRef]
  31. Neef, M.; Dettmer, T.; Bäuml, G.; Schebek, L. Decarbonisation Index (DCI): An LCA-based key performance indicator for the automotive industry. Int. J. Life Cycle Assess. 2024, 29, 557–577. [Google Scholar] [CrossRef]
  32. IEA (International Energy Agency). Countries and Regions. Available online: https://www.iea.org/countries (accessed on 14 August 2025).
  33. Eurostat Energy. Statistics—Supply, Transformation and Consumption; European Commission: Luxembourg, 2023; Available online: https://ec.europa.eu/eurostat (accessed on 14 August 2025).
  34. Markandya, A.; González-Eguino, M. Integrated assessment for identifying climate finance needs for loss and damage: A critical review. Clim. Policy 2019, 19, 743–758. [Google Scholar] [CrossRef]
  35. Hungarian NECP 2021–2030; European Commission: Luxembourg, 2024. Available online: https://commission.europa.eu/publications/hungary-final-updated-necp-2021-2030-submitted-2024_en (accessed on 14 August 2025).
  36. IAEA PRIS. Power Reactor Information System. Hungary. Available online: https://pris.iaea.org/pris/countrystatistics/countrystatisticslandingpage.aspx (accessed on 14 August 2025).
  37. Power Technology. Paks 2, MVM. Available online: https://www.power-technology.com/projects/paks-ii-nuclear-power-plant/ (accessed on 14 August 2025).
  38. Eurostat. Renewable Energy. 2024. Available online: https://ec.europa.eu/eurostat/statistics-explained/index.php?title=Renewable_energy_statistics (accessed on 14 August 2025).
  39. Ministry for Innovation and Technology. National Energy and Climate Plan. Hungary. 2023. Available online: https://commission.europa.eu/system/files/2023-09/HUNGARY%20-%20DRAFT%20UPDATED%20NECP%202021-2030%20_HU.pdf (accessed on 14 August 2025).
  40. Slovakia–Draft Updated NECP 2021–2030. Available online: https://commission.europa.eu/publications/slovakia-draft-updated-necp-2021-2030_en (accessed on 14 August 2025).
  41. IAEA PRIS. Power Reactor Information System, Slovak Republic. Available online: https://pris.iaea.org/pris/CountryStatistics/CountryDetails.aspx?current=SK (accessed on 16 September 2025).
  42. Ministry of Environment of the Slovak Republik. Renewables. Available online: https://www.minzp.sk/en/areas/renewable-energy-sources/renewables/ (accessed on 14 August 2025).
  43. Czechia-Final Updated NECP 2021–2030. Available online: https://commission.europa.eu/publications/czechia-final-updated-necp-2021-2030-submitted-2024_en (accessed on 14 August 2025).
  44. Ministry of Industry and Trade Czech Republic. The National Energy and Climate Plan of the Czech Republic. 2024. Available online: https://mpo.gov.cz/en/energy/strategic-and-conceptual-documents/the-national-energy-and-climate-plan-of-the-czech-republic--285295/ (accessed on 14 August 2025).
  45. Poland—Draft Updated NECP 2021–2030. Available online: https://commission.europa.eu/publications/poland-draft-updated-necp-2021-2030_en (accessed on 14 August 2025).
  46. Ministry of Climate and Environment Republic of Poland. National Energy and Climate Plan. Available online: https://www.gov.pl/web/climate/national-energy-and-climate-plan (accessed on 14 August 2025).
  47. Romania—Final Updated NECP 2021–2030 (Submitted in 2024). Available online: https://commission.europa.eu/publications/romania-final-updated-necp-2021-2030-submitted-2024_en (accessed on 14 August 2025).
  48. IAEA PRIS. Power Reactor Information System. Romania. Available online: https://pris.iaea.org/pris/CountryStatistics/CountryDetails.aspx?current=RO (accessed on 14 August 2025).
  49. Bulgaria–Final Updated NECP 2021–2030 (Submitted in 2025). Available online: https://commission.europa.eu/publications/bulgaria-final-updated-necp-2021-2030-submitted-2025_en (accessed on 14 August 2025).
  50. IAEA PRIS. Power Reactor Information System. Bulgaria. Available online: https://pris.iaea.org/pris/CountryStatistics/CountryDetails.aspx?current=BG (accessed on 14 August 2025).
  51. Croatia—Final Updated NECP 2021–2030 (Submitted in 2025). Available online: https://commission.europa.eu/publications/croatia-final-updated-necp-2021-2030-submitted-2025_en (accessed on 14 August 2025).
  52. Republic of Croatia Ministry of Physical Planning. Construction and State Assets. Energy Renovation of Commercial Non-Residential Buildings. Available online: https://mpgi.gov.hr/about-the-ministry-139/scope-of-the-ministry/energy-efficiency-in-the-buildings-sector/energy-renovation-of-buildings-8670/energy-renovation-of-commercial-non-residential-buildings-8672/8672 (accessed on 14 August 2025).
  53. Slovenia—Final Updated NECP 2021–2030 (Submitted in 2025). Available online: https://commission.europa.eu/publications/slovenia-final-updated-necp-2021-2030-submitted-2025_en (accessed on 14 August 2025).
  54. IAEA PRIS. Power Reactor Information System. Slovenia. Available online: https://pris.iaea.org/pris/CountryStatistics/CountryDetails.aspx?current=SI (accessed on 14 August 2025).
  55. European Union, Publications Office of the European Union. Clean Energy for all Europeans. Available online: https://op.europa.eu/en/publication-detail/-/publication/b4e46873-7528-11e9-9f05-01aa75ed71a1/language-en (accessed on 14 August 2025).
  56. European Council of the European Union. Fit for 55. Available online: https://www.consilium.europa.eu/en/policies/fit-for-55/ (accessed on 14 August 2025).
  57. European Commission. Renewable Energy Directive. Available online: https://energy.ec.europa.eu/topics/renewable-energy/renewable-energy-directive-targets-and-rules/renewable-energy-directive_en (accessed on 14 August 2025).
  58. European Commission. Energy Efficiency Directive (EED). Available online: https://energy.ec.europa.eu/topics/energy-efficiency/energy-efficiency-targets-directive-and-rules/energy-efficiency-directive_en (accessed on 14 August 2025).
  59. European Commission. Energy Performance of Buildings Directive (EPBD). Available online: https://energy.ec.europa.eu/topics/energy-efficiency/energy-performance-buildings/energy-performance-buildings-directive_en (accessed on 4 September 2025).
  60. European Commission. EU Emissions Trading System (EU ETS). Available online: https://climate.ec.europa.eu/eu-action/carbon-markets/eu-emissions-trading-system-eu-ets_en (accessed on 14 August 2025).
  61. European Commission. About Effort Sharing. Available online: https://climate.ec.europa.eu/eu-action/effort-sharing-member-states-emission-targets/about-effort-sharing_en (accessed on 14 August 2025).
  62. OECD. European Carbon Border Adjustment Mechanism: What Is It, How Does It Work and What Are the Effects? Available online: https://www.oecd.org/en/blogs/2025/03/eu-carbon-border-adjustment-mechanism-what-is-it-how-does-it-work-and-what-are-the-effects.html (accessed on 14 August 2025).
  63. European Commission. Modernisation Fund. Available online: https://climate.ec.europa.eu/eu-action/eu-funding-climate-action/modernisation-fund_en (accessed on 14 August 2025).
  64. European Commission. Just Transition Fund. Available online: https://commission.europa.eu/funding-tenders/find-funding/eu-funding-programmes/just-transition-fund_en (accessed on 14 August 2025).
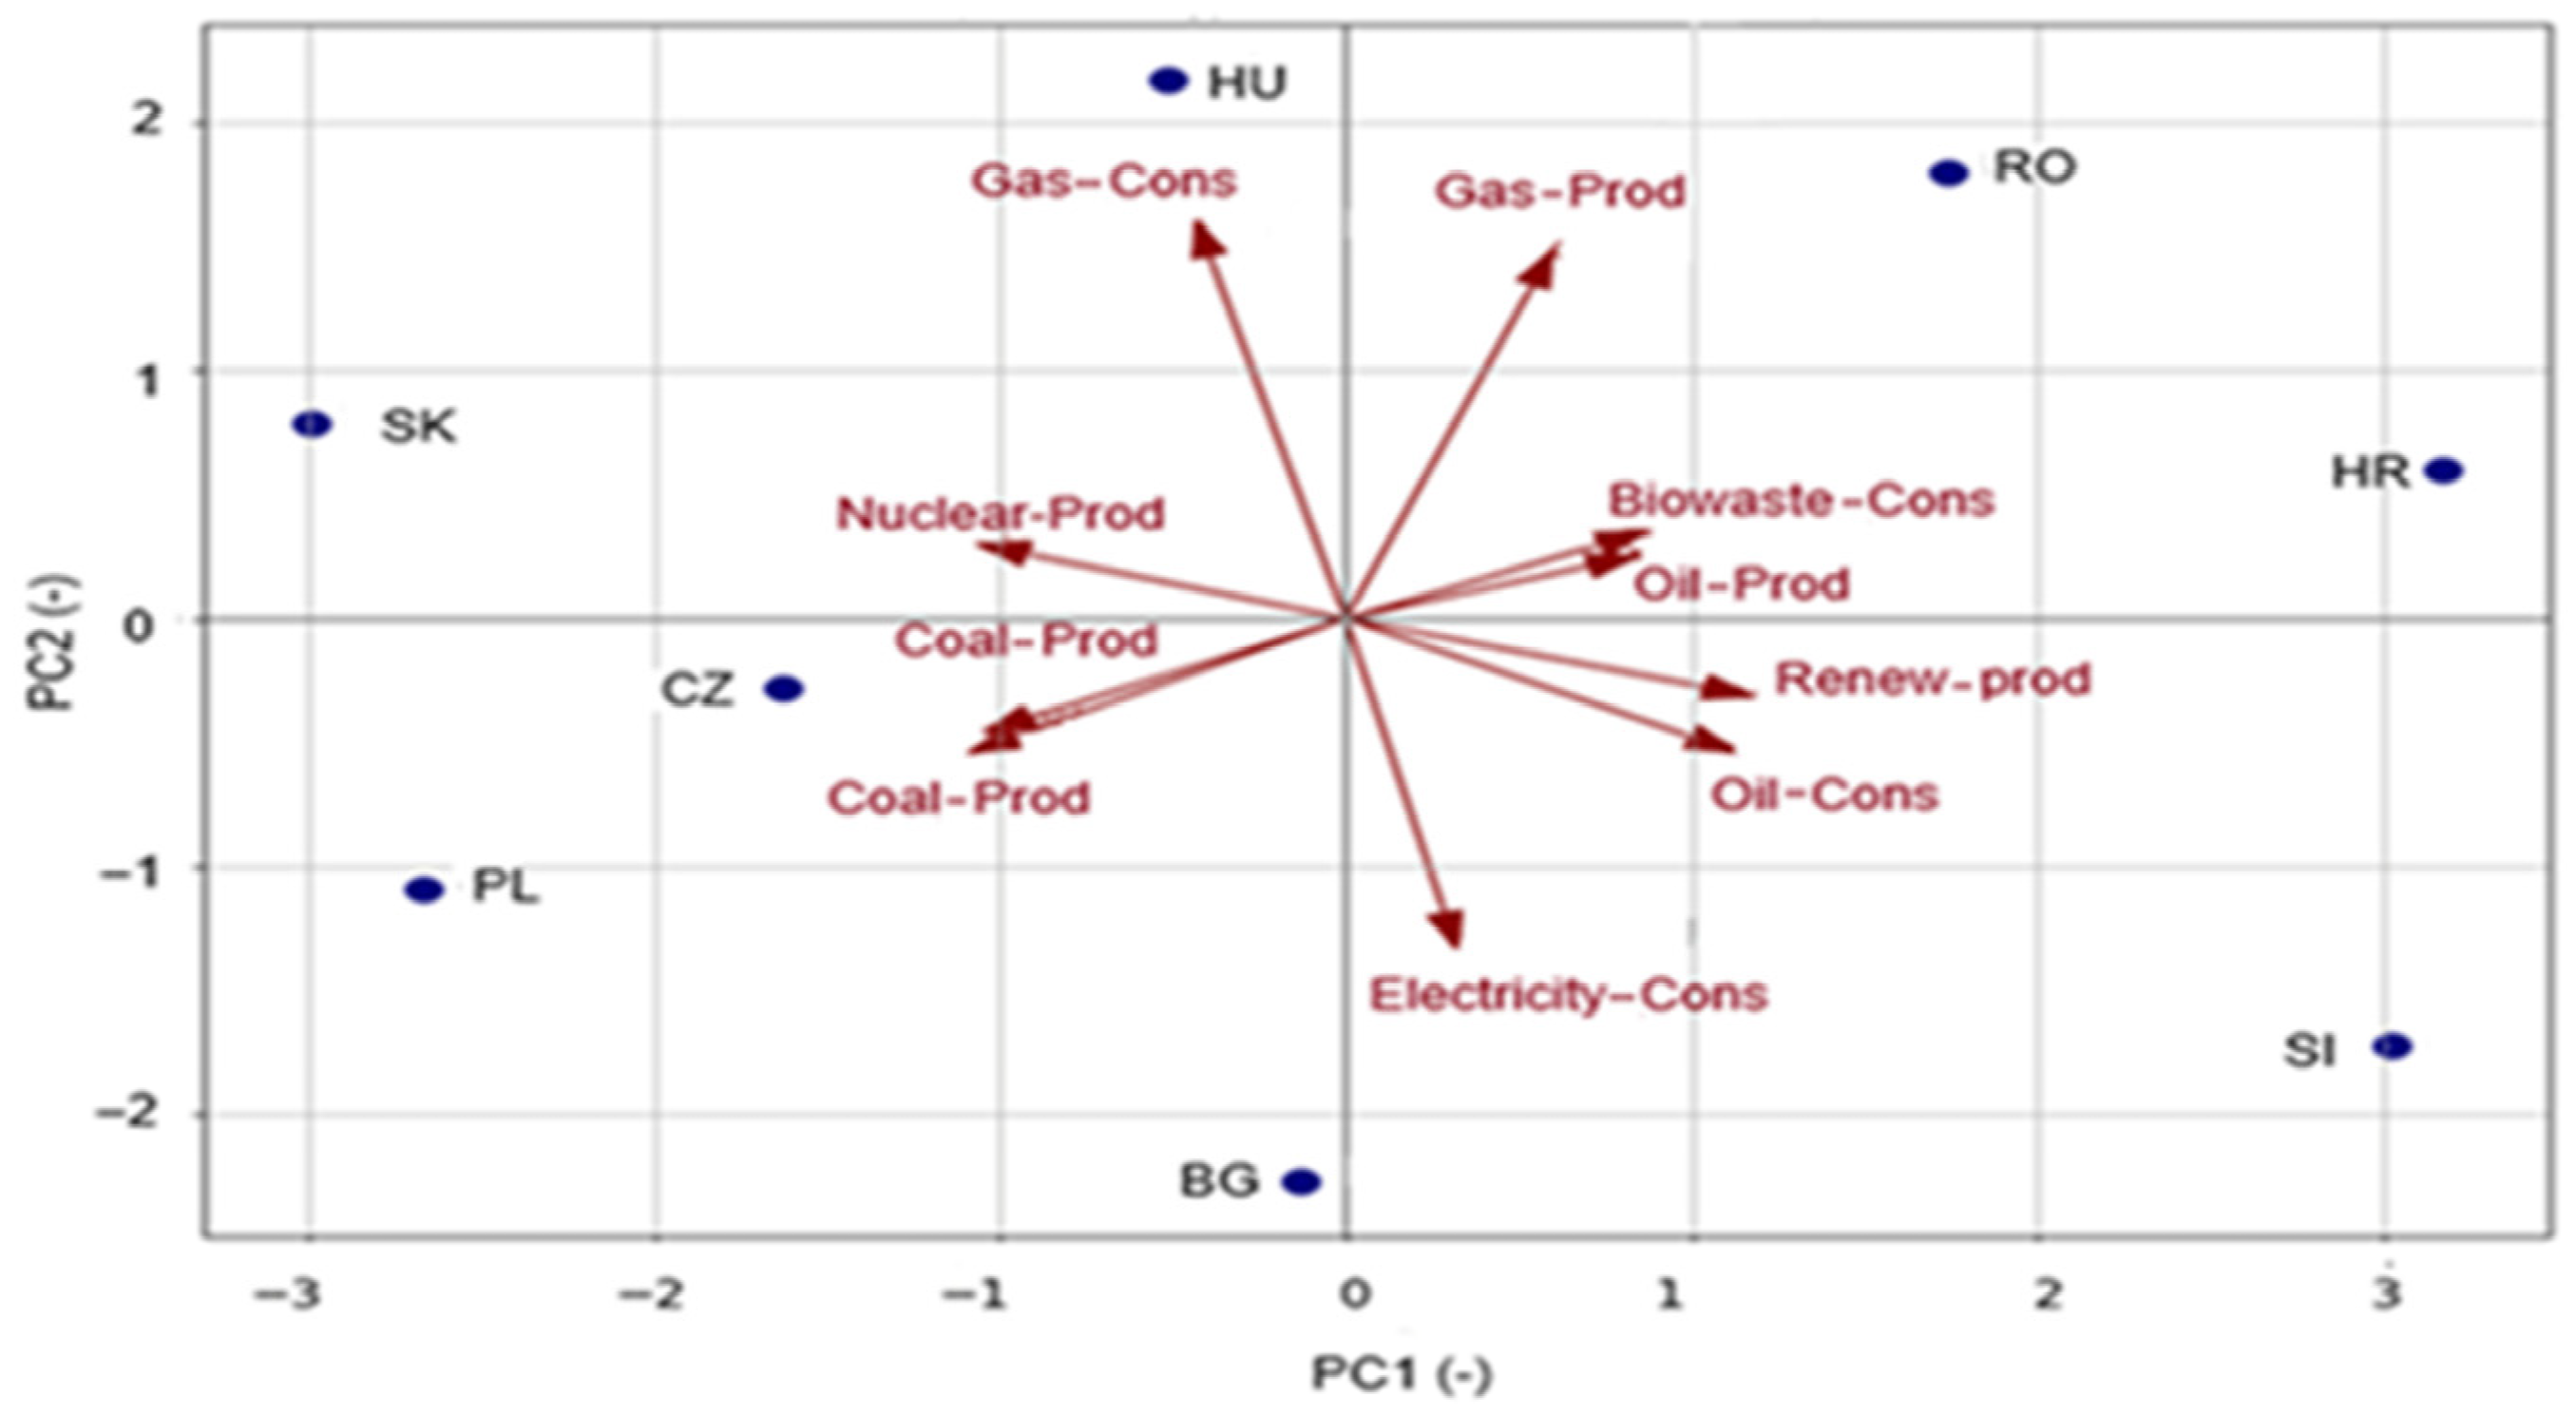
Figure 1. PCA biplot—energy mix (Production + Consumption).
Cleantechnol 07 00084 g001
Figure 2. Loading heat map—energy mix (Production + Consumption).
Cleantechnol 07 00084 g002
Figure 3. Explained and cumulative variance based on energy mix (Production + Consumption).
Cleantechnol 07 00084 g003
Figure 4. PCA + K-means clustering based on energy mix.
Cleantechnol 07 00084 g004
Figure 5. PCA regression—renewable energy production.
Cleantechnol 07 00084 g005
Figure 6. PCA biplot—energy consumption by sector.
Cleantechnol 07 00084 g006
Figure 7. Variable loadings on the first principal components of sectoral energy consumption.
Cleantechnol 07 00084 g007
Figure 8. Explained and cumulative variance based on sectoral energy consumption.
Cleantechnol 07 00084 g008
Figure 9. PCA + K-means clustering based on sectoral energy consumption.
Cleantechnol 07 00084 g009
Figure 10. PCA regression—observed vs. predicted electricity consumption.
Cleantechnol 07 00084 g010
Figure 11. PCA biplot: electricity generation sources.
Cleantechnol 07 00084 g011
Figure 12. Loading heatmap: electricity generation sources.
Cleantechnol 07 00084 g012
Figure 13. Explained and cumulative variance based on electricity generation sources.
Cleantechnol 07 00084 g013
Figure 14. PCA + K-means clustering based on electricity generation profiles.
Cleantechnol 07 00084 g014
Figure 15. PCA regression—actual vs. predicted coal generation.
Cleantechnol 07 00084 g015
Figure 16. PCA biplot—energy independence and intensity.
Cleantechnol 07 00084 g016
Figure 17. Loading heatmap: PCA components vs. variables of the energy independence and intensity.
Cleantechnol 07 00084 g017
Figure 18. PCA explained and cumulative variance by PCA components based on energy independence and intensity.
Cleantechnol 07 00084 g018
Figure 19. K-means clustering based on energy independence and intensity.
Cleantechnol 07 00084 g019
Figure 20. PCA regression: actual vs. predicted per capita electricity use.
Cleantechnol 07 00084 g020
Figure 21. PCA biplot: CO2 emission profiles.
Cleantechnol 07 00084 g021
Figure 22. Loading heatmap—PCA vs. CO2 indicators.
Cleantechnol 07 00084 g022
Figure 23. Explained and cumulative variance based on CO2 emission profiles.
Cleantechnol 07 00084 g023
Figure 24. K-means clustering CO2 emission PCA space.
Cleantechnol 07 00084 g024
Figure 25. PCA regression: actual vs. predicted CO2 per capita.
Cleantechnol 07 00084 g025
Figure 26. The decarbonisation level index (DLI) by country.
Cleantechnol 07 00084 g026
Figure 27. Country typology based on energy intensity and net import dependency.
Cleantechnol 07 00084 g027
Table 1. Regression results for renewable energy production.
Dependent VariableRenewable productionR-squared0.918
ModelOLSAdjusted R-squared0.885
MethodLeast SquaresF-statistic27.97
No observations8Probability (F-statistic)0.00193
Degrees of Freedom Residuals5Log-likelihood−24.898
Degrees of Fredoom Model2AIC55.80
Covariance TypeNonrobustBIC56.03
-CoefficientStandard errorT P > t 0.0250.975
Constant27.87502.43211.4640.00021.62434.126
X17.888831.0710.2540.0015.13610.642
X2−2.09111.609−1.3000.250−6.2262.044
Omnibus 0.583Durbin-Watson1.555
Probability (Omnibus)0.747Jarque–Bera (JB)0.541
Skew−0.346Probability JB0.763
Kurtosis1.931Condition number2.27
Table 2. Regression results for electricity consumption.
Dependent Variable ElectricityR-squared0.841
ModelOLSAdjusted R-squared0.778
MethodLeast SquaresF-statistic13.26
No observations8Probability (F-statistic)0.010
Degrees of Freedom Residuals5Log-likelihood−8.9967
Degrees of Freedom Model2AIC23.99
Covariance TypeNonrobustBIC24.23
-CoefficientStandard errorT P > t 0.0250.975
Constant38.000.333114.0520.0037.14438.856
X10.97240.1964.9550.0040.4681.477
X2−0.38790.276−1.4060.219−1.0970.321
Omnibus0.735Durbin-Watson2.536
Probability (Omnibus)0.692Jarque–Bera (JB)0.110
Skew0.259Probability JB0.947
Kurtosis2.754Condition Number1.70
Table 3. Regression results for coal-based electricity generation.
Dependent Variable CoalR-squared0.992
ModelOLSAdjusted R-squared0.989
MethodLeast SquaresF-statistic303.6
No observations8Probability (F-statistic)6.03 × 10⁻⁶
Degrees of Freedom Residuals5Log-likelihood−15.1
Degrees of Freedom Model2AIC36.20
Covariance TypeNonrobustBIC36.44
-CoefficientStandard errorT P > t 0.0250.975
Constant32.50.71545.4860.0030.66334.337
X12.17660.4055.3740.0031.1353.218
X213.14120.54624.0470.00111.73614.546
Omnibus1.102Durbin-Watson1.519
Probability (Omnibus)0.576Jarque–Bera (JB)0.273
Skew0.437Probability JB0.873
Kurtosis2.765Condition number1.76
Table 4. Regression results for electricity consumption per capita.
Dependent VariableElec/per capitaR-squared0.324
ModelOLSAdjusted R-squared0.058
MethodLeast SquaresF-statistic1.196
No observations8Probability (F-statistic)0.376
Degrees of Freedom Residuals5Log-likelihood−8.2363
Degrees of Freedom Model2AIC22.47
Covariance TypeNonrobustBIC22.71
-CoefficientsStandard errorT P > t 0.0250.975
Constant5.01250.30316.5450.004.2345.791
X10.33810.2191.5450.183−0.2250.901
X20.02500.2970.0840.936−0.7390.789
Omnibus 1.598Durbin-Watson1.769
Probability (Omnibus)0.450Jarque–Bera (JB)0.508
Skew0.606Probability JB0.776
Kurtosis2.766Condition Number 1.38
Table 5. Regression results for total CO2 emissions per capita.
Dependent VariableTotal CO2 per capitaR-squared0.869
ModelOLSAdjusted R-squared0.817
MethodLeast SquaresF-statistic16.59
No observations8Probability (F-statistic)0.00620
Degrees of Freedom Residuals5Log-likelihood−7.1432
Degrees of Freedom Model2AIC20.29
Covariance TypeNonrobustBIC20.52
-CoefficientStandard errorT P > t 0.0250.975
Constant5.67500.26421.4740.004.9966.354
X10.82860.1475.6430.0020.4511.206
X20.40540.3511.1560.300−0.4961.306
Omnibus1.491Durbin-Watson1.857
Probability (Omnibus)0.474Jarque–Bera (JB)0.626
Skew−0.655Probability JB0.731
Kurtosis2.596Condition Number2.39
Table 6. Summary of the planned energy mix developments and their expected impacts by 2030.
CountryAreaPlanned ChangeExpected Annual Energy Change (TWh)Expected Annual CO2 Savings (Mt/year)Notes/Related Programs and Strategies
Hungary
[35,36,37,38,39]
Nuclear capacity expansionPaks II (2 × 1200 MW)+18.93.78Paks II project, 2022–2030 implementation
Renewable energySolar PV growth (8 Gigawatt (GW) total)+6–81.2–1.6METÁR program, solar subsidies
Coal phase-outClosure of Mátra coal plant−1–20.5–1Coal exit strategy 2025
Energy efficiencyRenovation buildings−2–30.8–1.2National Renovation Program
Slovakia
[40,41,42]
Nuclear capacity expansionMochovce 3–4 (~940 MW each)+18.93.78Mochovce Nuclear Power Plant (NPP) expansion
Renewable energySolar/wind expansion+4–60.8–1.2Slovak Renewable Energy Sources (RES) Support Scheme
Coal phase-outPhase-out by 2023−4.01.2Government Resolution 2019
Energy efficiencyRenovation buildings−20.7National Renovation Program
Czech Republic
[43,44]
Nuclear capacity expansionDukovany new block (1200 MW)+8.74.21Dukovany NPP tender
Renewable energySolar/wind+5.01.5Modernisation Fund
Coal phase-outGradual 2033 exit−10.07.0Coal Commission
Energy efficiencyRenovation buildings−31–1.5National Renovation Program
Poland [45,46]Nuclear capacity expansion6–9 GW by 2033 (partial by 2030 ~3 GW)+50–7023.7–35.5Polish Nuclear Power Program (PPEJ)
Renewable energyWind offshore/onshore, solar+15–205–7PSE2040; RES auctions
Coal phase-outGradual reduction−30–3520–25Coal sector restructuring
Energy efficiencyRenovation buildings−7–93–4National Renovation Program
Romania [47,48]Nuclear capacity expansionCernavodă Units 3–4 (~1400 MW)+113.31Cernavodă expansion
Renewable energyWind/solar+7–95–7Green Transition Fund
Coal phase-outreduction in coal production−4–63–5Energy Ministry plan
Energy efficiencyRenovation buildings−2–31–2National Renovation Program
Bulgaria [49,50]Nuclear capacity expansionKozloduy Unit 7 (~1200 MW)+18.16.35Kozloduy expansion
Renewable energySolar/wind/biomass+5–72–3RES strategy 2030
Coal phase-outreduction in coal production−10–125–6Energy Ministry plan
Energy efficiencyRenovation buildings−20.8National Renovation Program
Croatia [51,52]Renewable energySolar/wind+4–51–1.5RES strategy 2030
Coal phase-outreduction in coal production−20.6Energy Ministry plan
Energy efficiencyRenovation buildings−10.4National Renovation Program
Slovenia [53,54]Nuclear capacity expansionKrško 2 (~1200 MW)+18.94.26Krško 2 feasibility
Renewable energyHydro, solar+3–40.8–0.9Slovenian RES strategy
Coal phase-outphasing out coal−31Energy Ministry plan
Energy efficiencyRenovation buildings−10.4National Renovation Program
Table 7. The expected annual changes in the energy mix and their environmental impacts through 2030.
IndicatorValue (TWh/Year)Value (Mt CO2/Year)Notes
Annual increase in nuclear production+155.7–167.754.74–67.24Hungary, Slovakia, Czechia, Poland, Romania, Bulgaria, Slovenia—only planned new units
Annual increase in renewable production+52–6915.6–20.1Wind, solar, biomass, hydropower
Production decrease due to coal phase-out−68–7841.3–46.8Coal phase-out or significant reduction
Energy efficiency (savings)−18–217.3–9.1Building and industrial efficiency programs
Energy storage and grid development--Batteries, smart grid developments
Table 8. Summarises the empirical findings.
Country’sKey FactsMain
Challenge
RecommendationsFit with EU Packages
Bulgaria (BG)Domestic production: large shares of nuclear (~41%) and coal (~34%). In all three scenarios, the DLI value is very low, indicating a favourable position. Electricity generation: substantial nuclear + coal share; emission profile elevated in power sector.coal dependency in power despite domestic independence; elevated power-sector emissions.Accelerate coal retirement with clear timelines and decommissioning plans; prioritise repurposing sites and workforce retraining (Just Transition-type measures).
Scale variable renewables (utility PV and wind) and pair with storage and grid upgrades to balance nuclear baseload and replace coal.
Upgrade grid flexibility (Demand Side Response (DSR), storage, interconnections) to integrate renewables while keeping nuclear contribution stable.
Strengthen carbon-pricing pass-through and link revenues to investment in renewables and network modernisation.
Renewable Energy Directive (RED)-driven RES targets and Emissions Trading System (ETS) carbon price increases will make coal progressively less economic; access to Modernisation/Just Transition funds can finance plant closures and grid upgrades.
Czech Republic (CZ)High domestic production including coal and nuclear; electricity generation shows balanced nuclear + coal. In all three scenarios, the DLI value is average, indicating vulnerability.moving from coal while preserving electricity security; industrial emissions significant.Use nuclear as transition backbone while rapidly expanding renewables in decentralised locations and adding storage.
Industrial decarbonisation: promote electrification of processes, heat pumps for district heat where feasible, and pilots for low-carbon hydrogen for heavy industry.
Improve energy efficiency in industry and buildings via targeted incentives and energy management programs.
ETS tightening and Carbon Border Adjustment Mechanism (CBAM) incentivise industry decarbonisation; RED and Energy Efficiency Directive (EED) obligations support renewables rollout and efficiency investments, with EU funds available for modernisation.
Croatia (HR)Domestic production: relatively low coal, higher shares of oil/gas and renewables (hydro/wind).
Final consumption: high oil share (transport), sizeable residential consumption. In all three scenarios, the DLI value is very low, indicating a favourable position.
heavy transport oil dependence; opportunities from renewables (hydro and growing wind/solar).Transport electrification and rapid deployment of EV charging infrastructure; fiscal incentives to shift from oil-based road transport.
Expand distributed solar (rooftops) and grid integration measures; utilise hydropower flexibility to backstop variable renewable output.
Energy efficiency in buildings (renovation programmes) to reduce residential consumption.
Fit-for-55 supports transport electrification (CO2 standards) and RED targets boost renewables; access to Recovery/REPowerEU (EU plan to re-power Europe) funds can accelerate charging infrastructure and building renovation.
Poland (PL)Very high coal share in domestic production (~66%) and electricity generation (≈60%); high absolute emissions.
In all three scenarios, the DLI value is very high, indicating significant vulnerability.
deepest structural coal dependence, large emissions, social and economic complexity of transition.Immediate and credible coal phase-out plan with social transition packages (jobs, retraining, regional development).
Fast-track large-scale renewables (onshore/offshore) + storage and grid reinforcement.
Leverage planned nuclear capacity as baseload but ensure sequencing of renewables and storage to replace coal.
Scale energy efficiency retrofits nationwide (residential + public buildings) for demand reduction.
ETS and carbon pricing and higher 2030 targets increase pressure to decarbonise; Just Transition Fund and Modernisation Fund should be mobilised to finance regional shifts away from coal.
Hungary (HU)Significant nuclear share in electricity (domestic nuclear ~38.7%, generation nuclear ~44.8%); considerable gas and oil in other sectors; relatively high import dependency. In all three scenarios, the DLI value is very high, indicating significant vulnerability.Import dependence for some fuels; need for diversification and stronger RES rollout.Proceed with safe nuclear completion (if continuing) while diversifying supply—balance Paks II with accelerated renewables (large-scale PV) and storage.
Reduce gas/oil dependence in buildings and transport via efficiency programmes and electrification.
Enhance energy security by diversifying gas supply routes, increasing interconnectivity, and strategic storage.
Nuclear contributes to security while RED/EED drive renewables and efficiency; ETS increases incentive to cut fossil fuel use in heating and industry.
Romania (RO)Domestic production mix: notable natural gas and hydro; some nuclear (existing Cernavodă) and renewable potential. In all three scenarios, the DLI value is low, indicating lower vulnerability. Modernising gas sector and scaling variable renewables while preserving hydropower resources.Scale wind and solar in high-resource regions and exploit grid-forming hydropower flexibility.
Advance Cernavodă expansion cautiously (if pursued) alongside renewables to minimise emissions.
Prioritise energy efficiency in buildings and industry, given already favourable energy intensity.
Funding for Renewable Energy Deployment FRED/REPowerEU support large-scale renewables; Fit-for-55 and ETS reform shape gas-to-renewables economics; funding instruments (Green Transition Fund) are directly relevant.
Slovakia (SK)Very high domestic nuclear share (domestic production ~65% and electricity generation nuclear ~61.3%); lower fossil shares.
Moderate import dependency but exposure in some sectors. In all three scenarios, the DLI value is average, indicating vulnerability.
Integrating higher shares of renewables around strong nuclear baseload; addressing building/industrial efficiency.Leverage nuclear as low-carbon base and invest in grid flexibility (storage, demand response) to integrate renewables.
Promote electrification in transport and industry and targeted building retrofit programmes.
Diversify energy supply where import exposure exists and increase interconnections.
Nuclear helps meet low-carbon targets; RED/EED and ETS push toward renewables and efficiency; Slovakia can benefit from EU support for grid and storage.
Slovenia (SI)High share of nuclear and hydro in production; relatively high per capita electricity consumption and clean generation mix. In all three scenarios, the DLI value is low, indicating lower vulnerability.Optimise use of hydro/nuclear flexibility, scale distributed renewables, and further reduce transport emissions.Maximise renewable potential (solar + small hydro modernisation); use hydro as flexibility to integrate PV/wind.
Electrify transport and decarbonise heating with heat pumps, plus continue building renovation programmes.
Enhance regional market integration to export flexibility and benefit from market coupling.
Strong alignment—RED/EED measures enhance renewables and efficiency; electricity market reforms and cross-border integration under EU rules improve dispatch and trade.
Disclaimer/Publisher’s Note: The statements, opinions and data contained in all publications are solely those of the individual author(s) and contributor(s) and not of MDPI and/or the editor(s). MDPI and/or the editor(s) disclaim responsibility for any injury to people or property resulting from any ideas, methods, instructions or products referred to in the content.