Article

Optimization of Composting Locations for Livestock Manure in Bangladesh: Spatial Analysis-Based Potential Environmental Benefits Assessment

1
Degree Programs in Life and Earth Sciences, Graduate School of Science and Technology, University of Tsukuba, Tsukuba 305-8577, Japan
2
Faculty of Life and Environmental Sciences, University of Tsukuba, Tsukuba 305-8577, Japan
3
Ministry of Environment, Forests and Climate Change, Government of the People’s Republic of Bangladesh, Dhaka 1000, Bangladesh
*
Authors to whom correspondence should be addressed.
Clean Technol. 2025, 7(3), 72; https://doi.org/10.3390/cleantechnol7030072
Submission received: 15 July 2025 / Revised: 1 August 2025 / Accepted: 18 August 2025 / Published: 22 August 2025

Abstract

For sustainable livestock manure management, composting is a common practice for supplying nutrients to crops. Therefore, optimizing plant locations for composting from livestock manure is essential in Bangladesh. This study performed a land suitability analysis using Geographic Information System (GIS) spatial modeling to identify suitable sites for composting plants, which was optimized through network analysis. After spatial analysis, 15, 42, and 147 locations were identified for large-scale, medium-scale, and small-scale manure-based compost production, respectively, across different scenarios. As a result, approximately 1537.74 kilotons/year of compost can be generated from 2703.86 kilotons of livestock manure, replacing about 44.31% of synthetic fertilizer use in Bangladesh in 2024. The potential reduction in greenhouse gas (GHG) emissions was assessed at 1986.76 gigagrams CO2eq/year, with nutrient leaching reduction potentials of 15.11 and 10.98 kilotons/year for nitrogen and phosphorus, respectively. Additionally, around 4.51 million tons of livestock manure can be disposed of annually by establishing composting plants. However, assessing the potential environmental benefits by optimizing composting plant locations can support the development of strategies to produce organic fertilizer by utilizing natural resources in Bangladesh.

1. Introduction

Livestock manure is an excellent source of nutrients such as N (nitrogen), P (phosphorus), and K (potassium) to enrich soils. [1,2]. However, direct land application of manure is not a good option for reducing environmental pollution. It can enhance organic substances, causing eutrophication in water sources and damaging seedlings and growing plants. [3,4]. Composting of manure aids in combining nutrients actively in biological forms, which decreases pathogens, GHG emissions, and the volume of total manure, and the application of compost in agricultural fields is environmentally safer than raw manure application [5,6]. Additionally, composting from livestock manure is economical compared to the use of commercial synthetic fertilizer for crop production, and provides a feasible opportunity to reduce the total volume of livestock manure in landfill sites [7].
In Bangladesh, a large livestock population is expected to present many challenges with regard to managing the large volume of manure the livestock produce. Manure is generally utilized as fertilizer, though conventionally, it is kept fresh in open storage space and then directly applied to the soil in rural areas of Bangladesh [8]. As a result, the organic materials and other substances are released into the environment, posing risks for air, soil, and water contamination, especially in the rainy season [9,10]. Proper manure management is necessary, and composting could be an important option for resource recovery in Bangladesh. Moreover, related policies such as the National Environment Policy (1992), National Livestock Development Policy (2007), and National Agriculture Policy (2013) suggest upgrading the environment by properly utilizing agricultural resources to produce organic fertilizer from livestock manure.
Identifying optimum locations for the development of livestock manure treatment facilities, such as composting plants, is a crucial step. Land suitability analyses using GIS spatial tools aid in choosing appropriate locations for target facilities from various geo-datasets for specific objectives [11,12]. The exact location can be selected among different possible locations based on the chosen interface between demand points by applying network analysis [13]. Firstly, this study conducted a spatial land suitability analysis comprising both restriction and suitability modeling to identify suitable parcels from the final land index. Then, the existing road network was evaluated to optimize the sites of composting plants in different scenario analyses in Bangladesh. Lastly, the environmental benefits of various scenarios were projected using mathematical equations and statistics.
However, previous studies mostly focused on compost composition and techniques for generation from livestock manure, including emissions assessment [14,15,16]. However, there is much less research on the identification of locations for potential compost production, both in the study area and in other parts of the world. Therefore, this study introduces a comprehensive scenario design for establishing large-scale, medium-scale, and small-scale composting plants, which is essential for the sustainable management of livestock manure within Bangladesh.

2. Methodology

2.1. Study Approach

Optimal locations for composting plants were identified based on compost potential from manure, suitable parcel availability, local synthetic fertilizer demand, and maximum coverage of manure sources within a specific range of transportation. Firstly, manure generation and rice straw production were assessed throughout the country to estimate composting potential. To this end, data on factors such as total livestock population by type and rice production were collected from a survey performed by the departments of Livestock Services and Agriculture Extension of Bangladesh in 2024, respectively [17,18]. After that, suitable parcels were identified through spatial land suitability analysis, and chosen locations for composting plants were optimized using network analysis. This study used several geological, economic, and social factors, such as surface water, transport network, flood-prone area, river erosion area, residential and developed area, etc., during the land suitability and network analysis, and the relevant data were collected from the Bangladesh Bureau of Statistics, the Local Government Engineering Department, the Roads and Highways Department of Bangladesh, and the ArcGIS online websites [19]. Lastly, some mathematical equations and factors were collected from previous studies for environmental benefit assessment. These collected statistical and mathematically estimated data were processed into a geospatial database (shapefile) using GIS (ArcMap 10.8) software. The methodological framework is shown in Figure 1.

2.2. GIS Suitability Analysis

The study used Equation (1) for suitability analysis by combining restriction and suitability mapping for siting livestock manure composting plants.
S = i = 1 n W i C i . j = 1 m R j
where S = suitable parcels; Wi = weights for criteria i; Ci = criteria for suitability analysis (i includes the availability of manure and rice straw, road distance, synthetic fertilizer demand, flood-prone area, and elevation), and Rj = criteria for restriction analysis (j includes surface water, transport networks, protected areas, important places, residential areas, and vulnerable areas).

2.2.1. Restriction Mapping

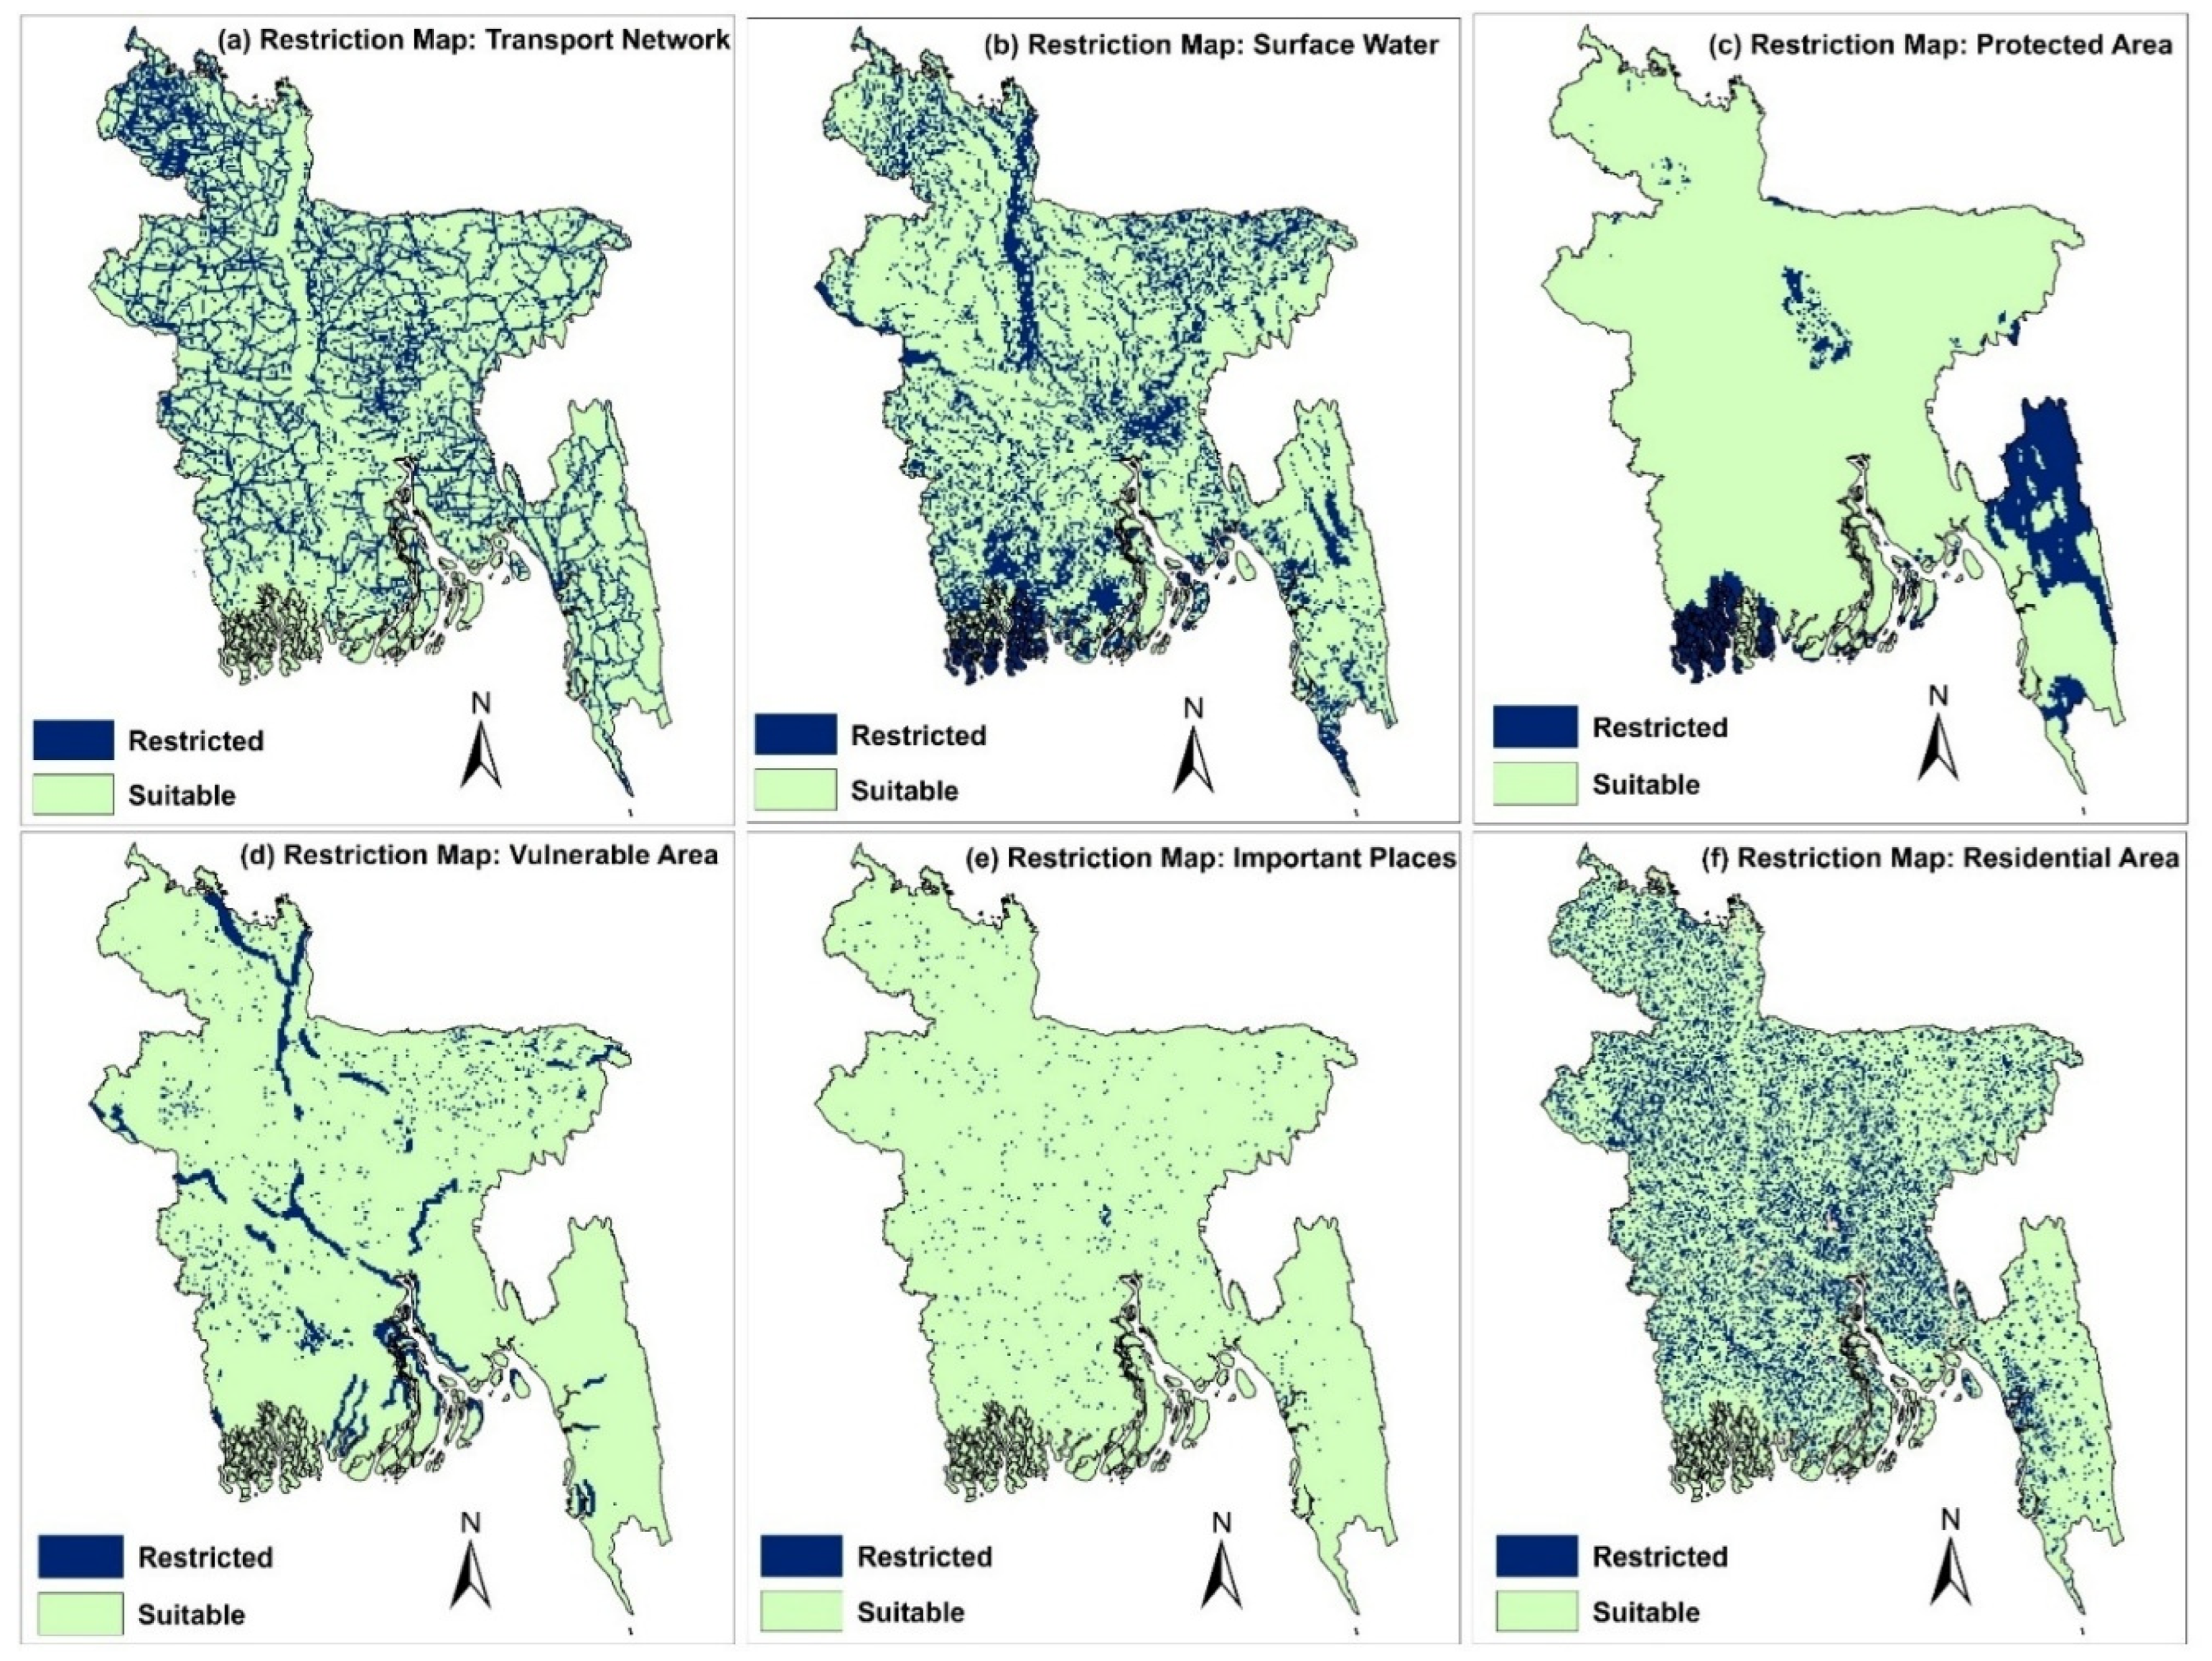
This study considered 12 features under six criteria (transportation modes, surface water, protected areas, vulnerable areas, important places, and residential areas) for restriction modeling of areas, including their buffer zones, that cannot be used for further development due to limitations posed by laws and rules. Moreover, the already developed areas (transportation facilities including roads and highways, residential houses and buildings, airports, educational facilities, etc.) might not be feasible to use in further construction. At the same time, it is desirable to maintain a minimum distance as a buffer area from the already settled areas. The buffer areas used in different articles for waste disposal sites were studied, and based on these values, this study determined the buffer areas for the restricted features (Table 1). After that, the buffered features were made in union with the study area, and the features were again reformed into raster files using the geological processing tools included in the GIS software. Lastly, the cons tool was used to form restriction maps of all restriction features, where restricted areas were distinguished from the other parts of the map. A sample of restriction modeling for the restriction features is given in Figure 2. Finally, all the restricted layers of different features were multiplied to create the final restriction map.

2.2.2. Suitability Mapping

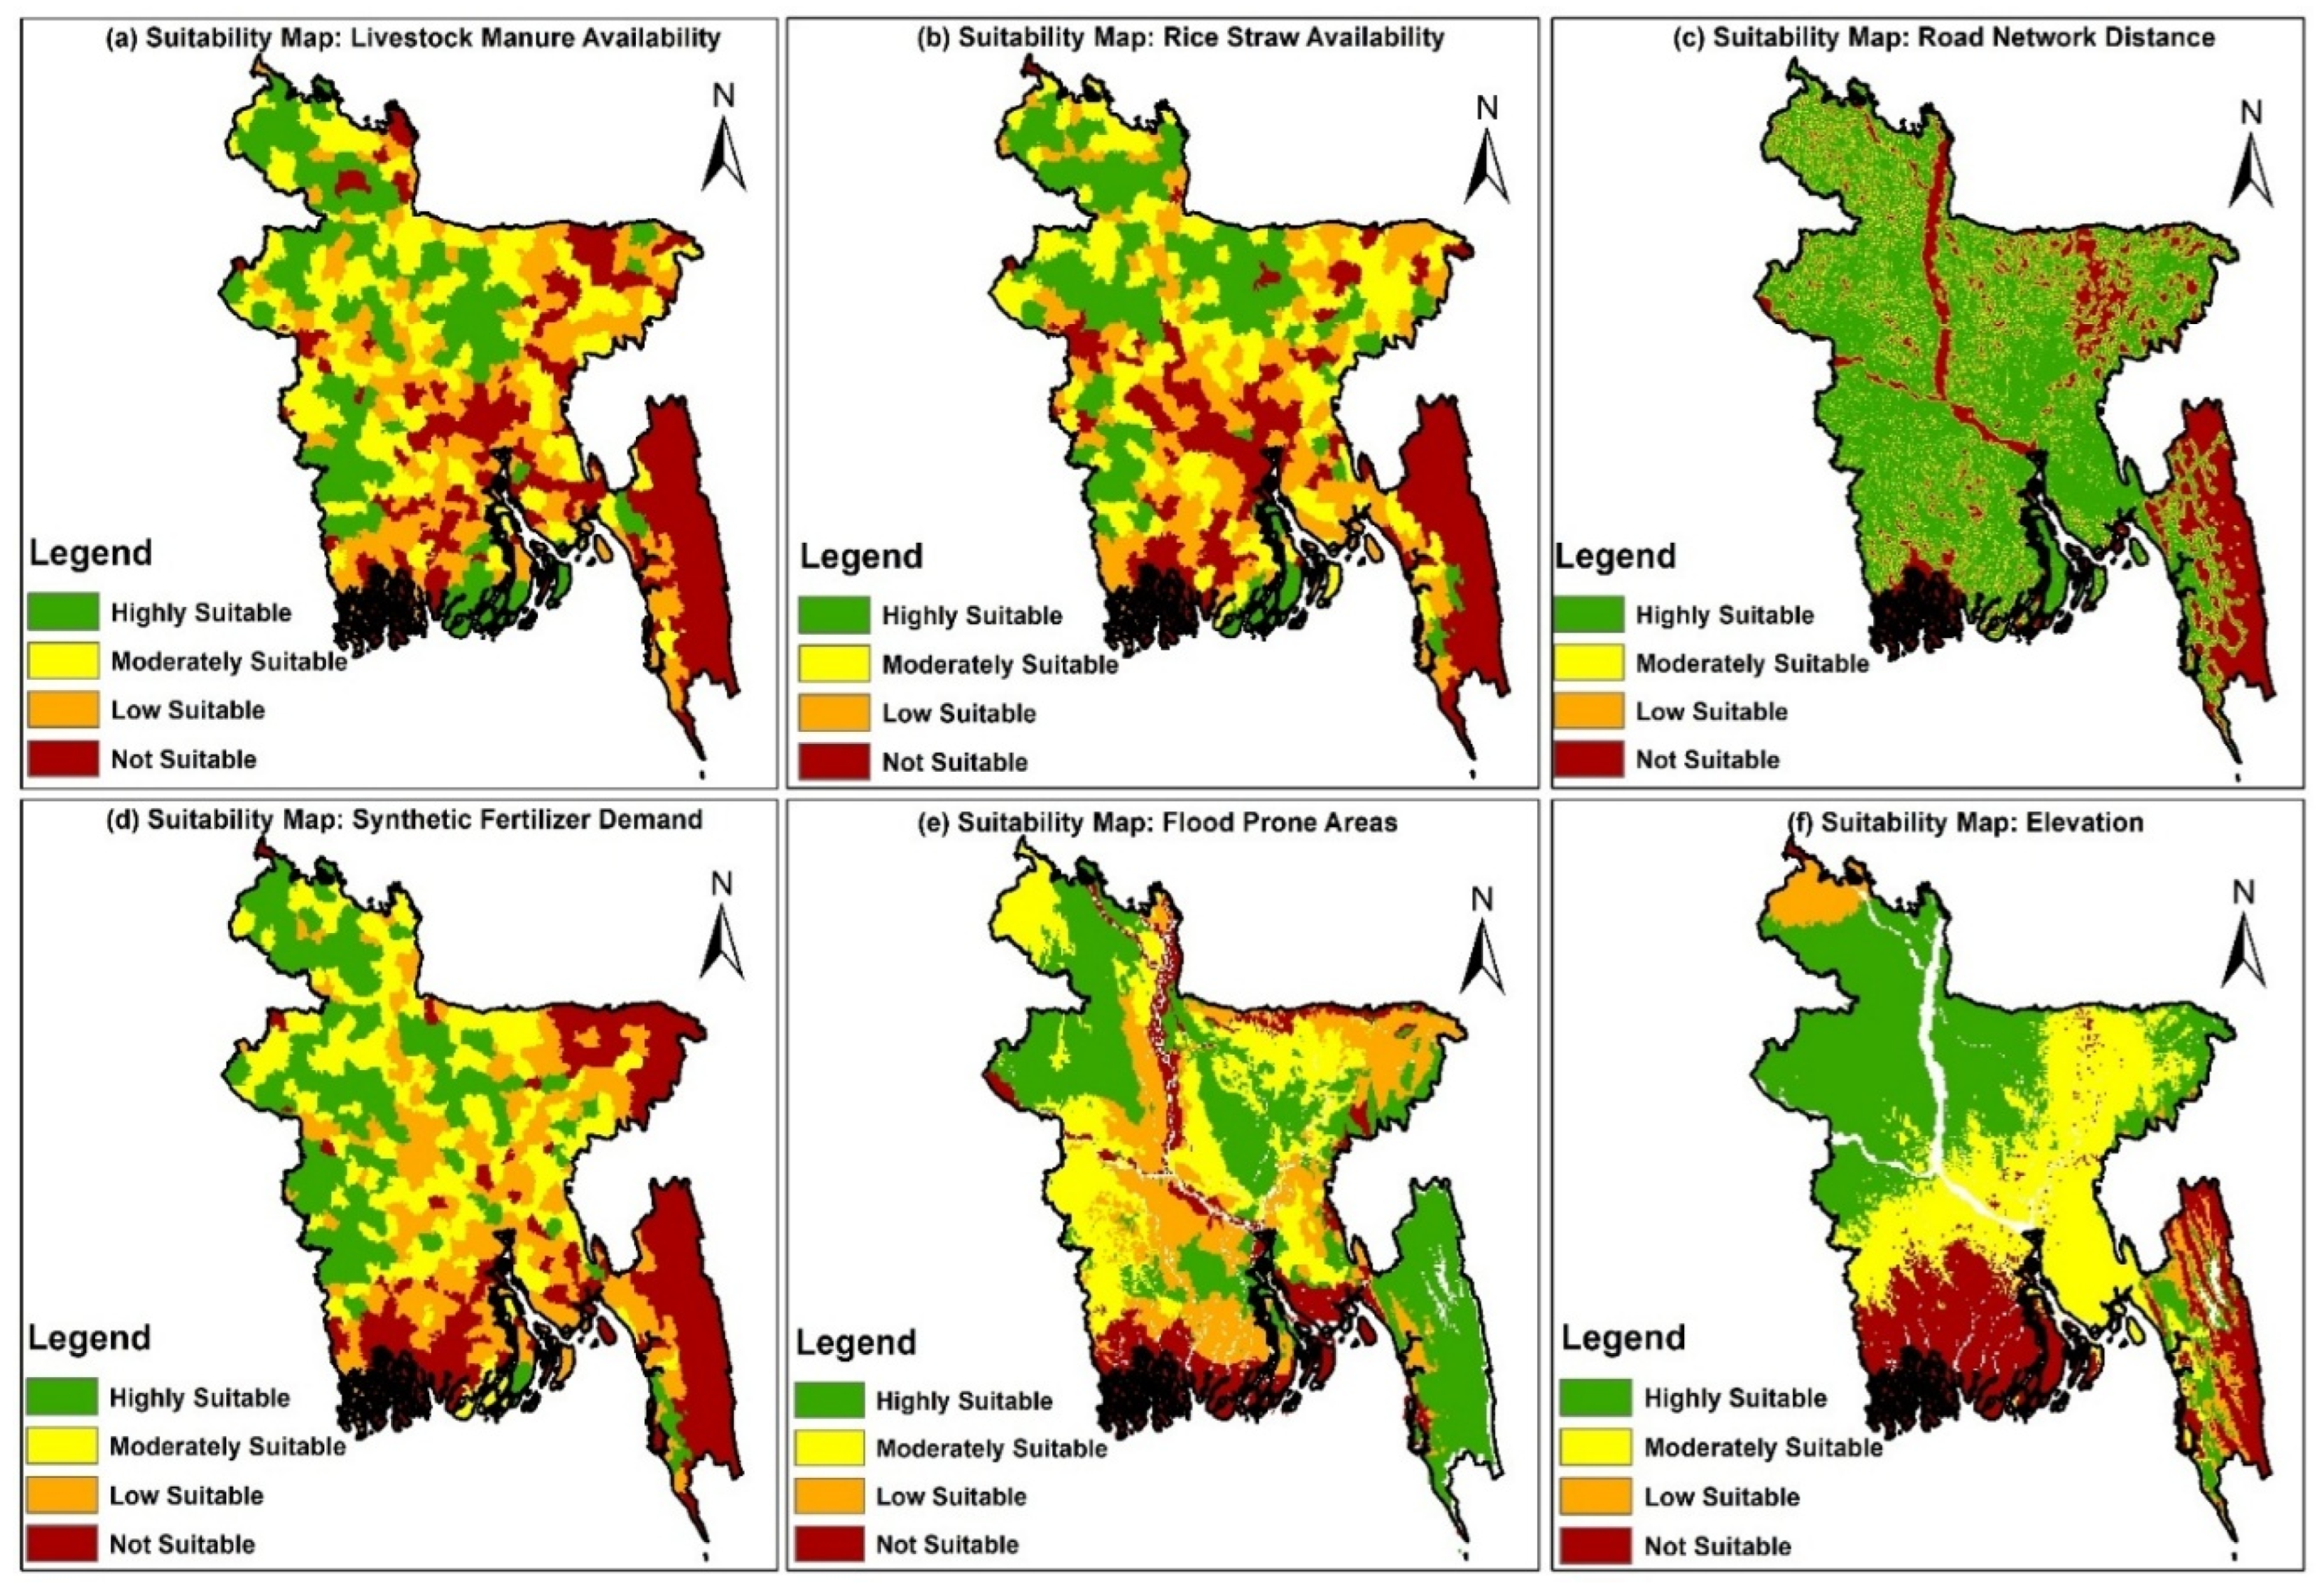
For suitability mapping, six features under three criteria, such as resource availability (livestock manure availability, rice straw availability), economy (distance to road network, demand for synthetic fertilizer), and topography (flood-prone areas, elevation), were considered to optimize plant locations for livestock manure composting across Bangladesh. All features were reclassified according to their appropriateness or suitability for the construction of a new plant. For reclassification, this study used the reclassify tools included in the GIS.
The weighted linear combination (WLC) model was applied in this research for the combination of all the criteria of suitability analysis. The WLC is a model that is used to standardize several continuous criteria to a common numeric range and combine them with a weighted average [27]. Before that, the weighted preferences of the criteria were determined using Analytical Hierarchy Process (AHP) methods, and the consistency ratio (CR) calculated in this study was 1.12%, which is below 10%. When CR is less than 0.10 (10%), it implies a strong consistency among the preferred weights [28]. The detailed CR value calculations were given in Table A1, Table A2 and Table A3. Then, the weighted overlay tools were used to combine all the suitability features according to the final weighted preferences to obtain a combined suitability map. The reclassification features with their weighted preferences are given in Table 2, and the modeling of suitability analysis is shown in Figure 3. Then, a raster calculator of the same software was used to develop the final land suitability map by combining all the restriction and suitability maps.

2.3. Generation of Livestock Manure and Rice Straw

The available manure was estimated by counting the total manure generation from different livestock species in each upazila (an administrative unit of Bangladesh, which acts like a sub-district) using Equation (2) [29], and the available rice residues were calculated using Equation (3) [30,31]. Then, upazila-wise available manure and rice straw amounts were divided by the area of that upazila to determine the manure and rice straw intensity throughout the country:
ALi= N × YL × CL
Ac= P × Yc × Cc × Dc × Sc
where ALi is the available livestock manure, i represents the various livestock species, N is the number of livestock in each upazila, YL is the manure production rate (20, 0.8, and 0.05 kg/head/day for large ruminants, small ruminants, and poultry manure, respectively), and CL is the manure collection coefficient factors, such as 0.5, 0.13, and 0.9 for large ruminants, small ruminants, and poultry manure, respectively) [29,32]. Ac is the available crop residue; P is the annual crop production in each upazila; Yc is the residue to crop yield mass ratio (1.5); Cc is the residue collection factor (0.6); Dc is the residue dryness factor (0.873), and Sc is the surplus residue factor (0.5) [33,34,35].

2.4. Compost Production Potential

This study assumed that the compost is composed of a mixture of manure and agricultural residue, such as rice straw, to ensure the optimal C/N ratio. Here, rice straw was used as a carbon source because rice is a common agricultural crop in Bangladesh, which is cultivated throughout the country. In composting piles, the C/N ratio is an important issue ranging from 20:1 to 40:1. However, the C/N ratio range varied from 16 to 20:1 for large livestock (cattle and buffalo), 14 to 18:1 for small livestock (sheep and goat), 5 to 12:1 for poultry (chicken and duck) manure, and 40 to 120:1 for rice straw [32,36,37,38]. Therefore, it is necessary to adjust the C/N ratio of compost to about 30:1; the average C/N ratio values of livestock manure and straw were used to estimate the compost production potential in this study. The amount of livestock manure and straw required to obtain the desired C/N ratio of compost during the calculation of total compost potential from livestock manure is given in Table 3. This study assumed a reduction in total mass after composting of manure of about 50% of the initial mass [32,39].

2.5. Scenario Design and Analysis

The scenario analysis was performed in steps to optimize the locations for composting plants from livestock manure in Bangladesh. The scenarios were designed to optimize the locations of composting plants based on compost production potential and plant capacity. Composting plant capacities vary significantly depending on factors such as the scale of operation, waste types, location, and composting methods. They range from small plants processing a few tons (2–10/day) to medium-sized facilities managing dozens of tons (3–100 tons/day), and large plants handling hundreds of tons (50–200 tons/day) or more [40,41,42]. This study considered three scenarios (Scenario-C1, Scenario-C2, and Scenario-C3) for large-scale (100 tons/day), medium-scale (50 tons/day), and small-scale (8 tons/day) compost production, respectively. First, primary administrative areas (upazilas) were selected based on the compost potential in each upazila. However, some other important features, such as optimum plant capacity, minimum site area, maximum road travel for manure sources to the plant site, etc., were considered to select chosen locations for composting in different scenarios.

2.5.1. Primary Upazila Selection

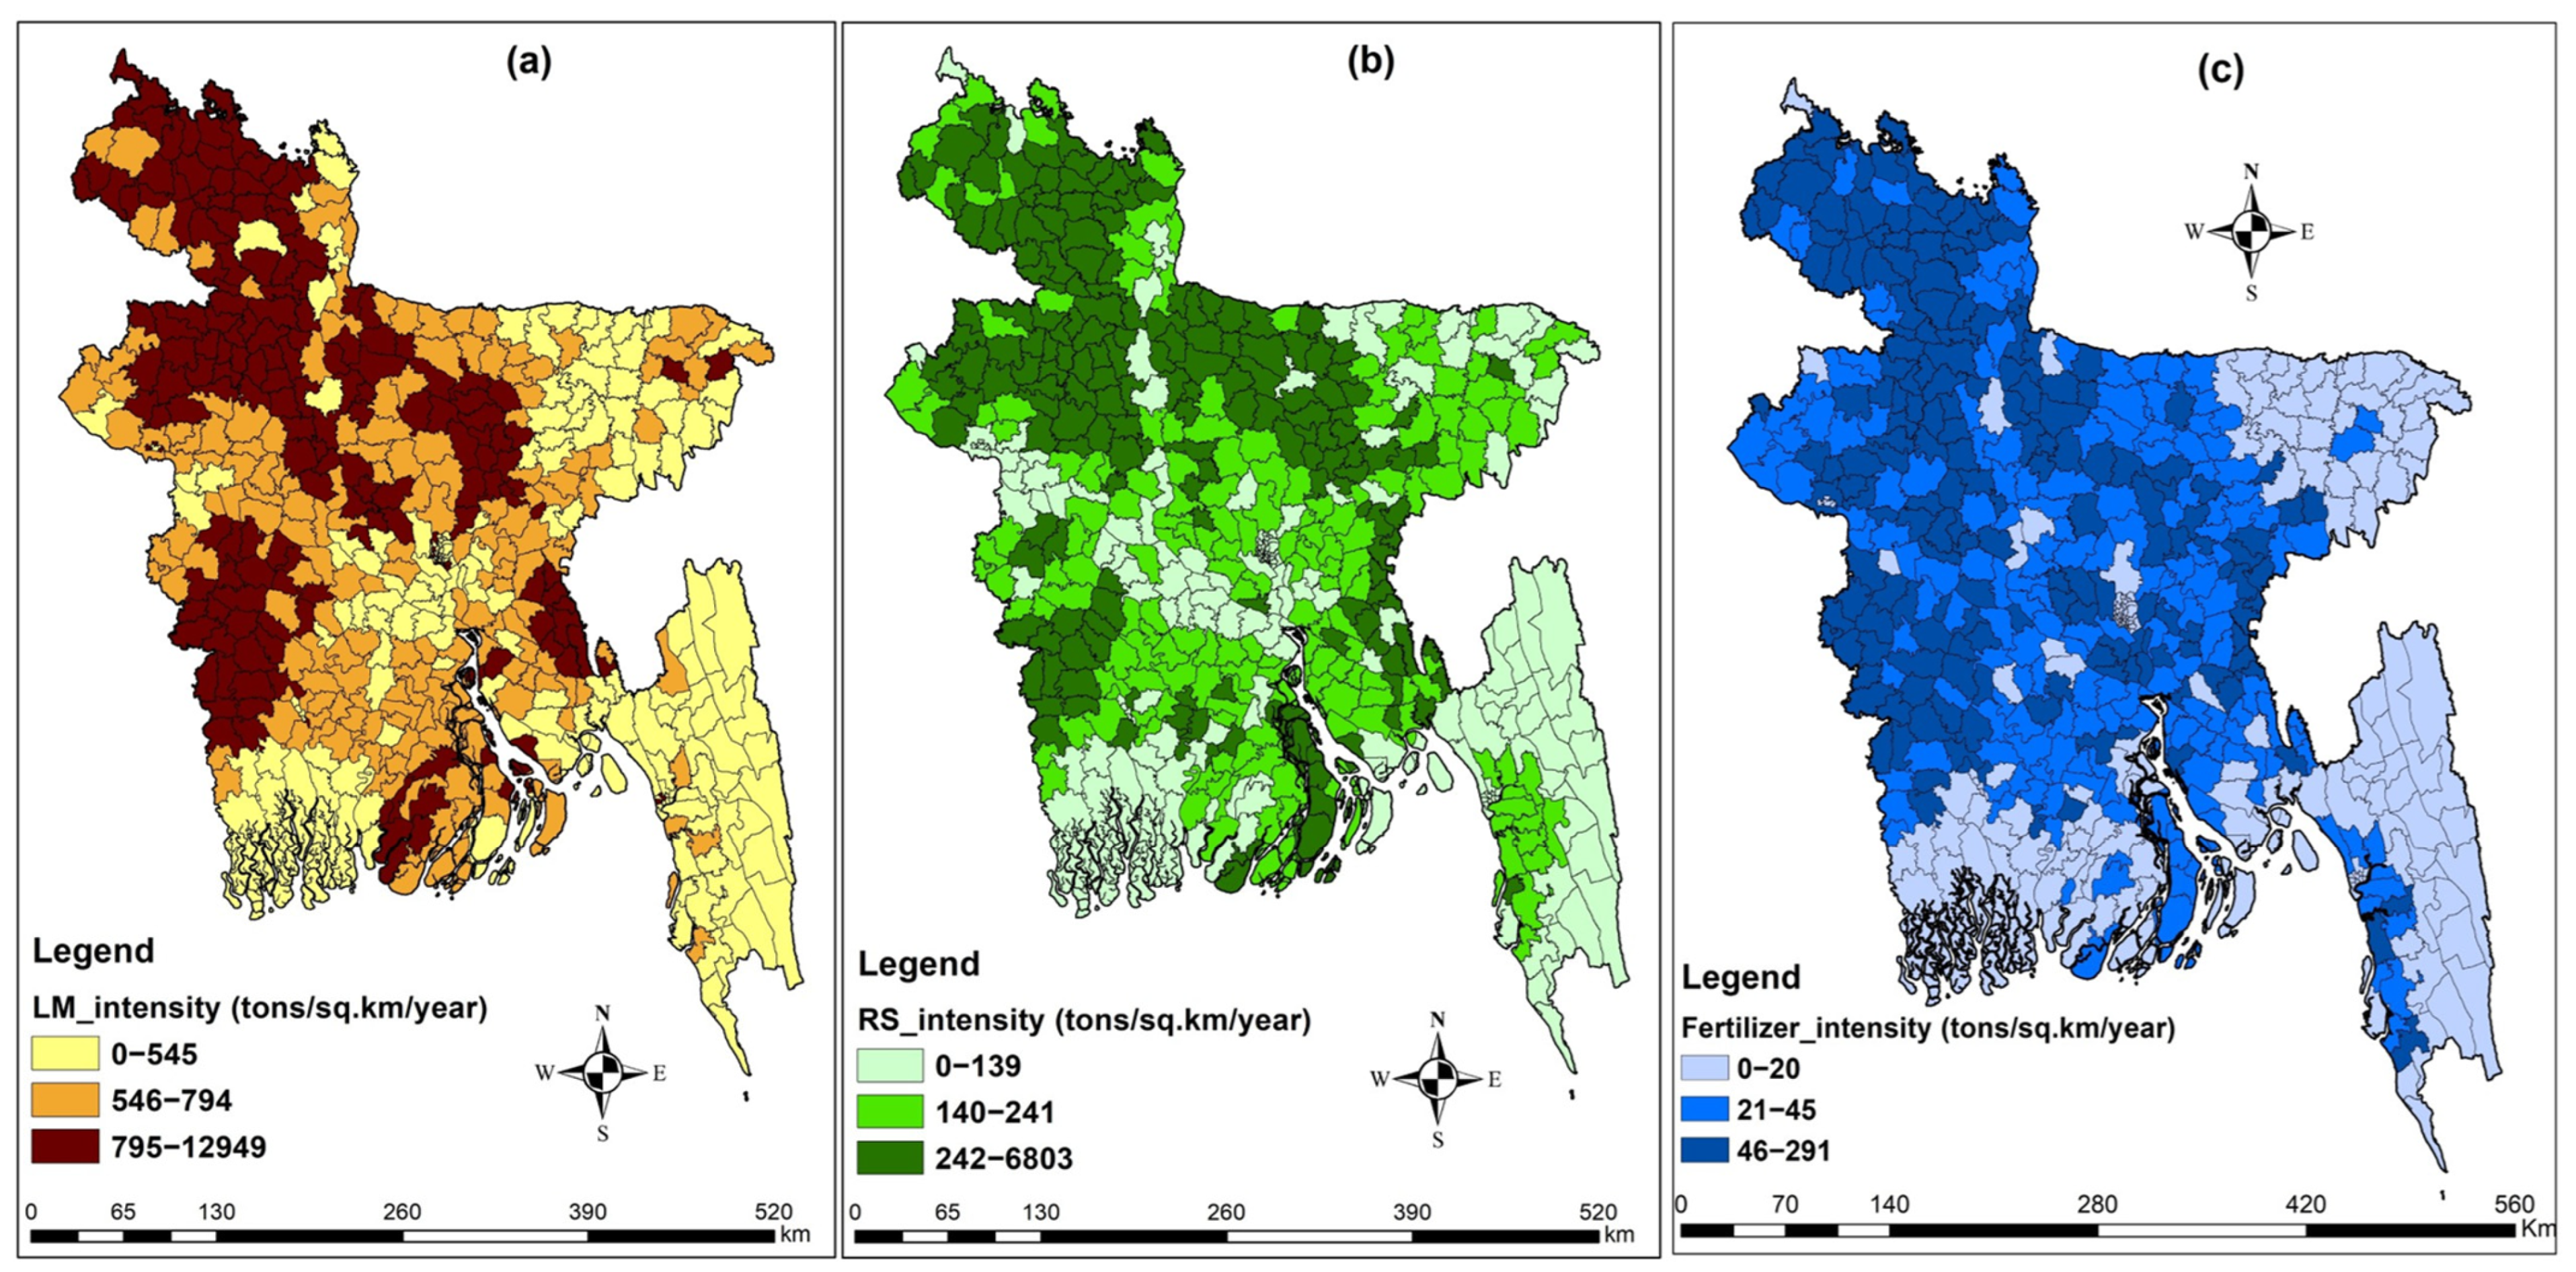
This study estimated the co-digestion ratio of manure and rice straw as approximately 4:1 for large and small livestock manure, and 2:1 for poultry manure. However, the average intensity for manure and rice straw was 587 and 162 tons/sq.km/year, respectively, which nearly reveals the co-digestion ratio (4:1 or 2:1). Therefore, this study considered all upazilas for further analysis. As the scenarios were planned to provide organic fertilizer to meet the local demand, in addition to national demand, it was necessary to identify the area where the demand for fertilizer use is high. So, the upazilas with above average intensity of synthetic fertilizer use (37 tons/sk.km/year) were considered for primary upazilas in different scenarios to stabilize the demand of plant output and reduce transportation cost spatially. The spatial distribution of livestock manure, rice straw, and synthetic fertilizer use in Bangladesh is displayed in Figure 4.

2.5.2. Upazila Categorization for Different Scenarios

First, compost production potential was estimated for each upazila and classified into 3 groups (high, moderate, and low) by the quintile method based on minimum and maximum values using the symbology of GIS spatial analysis. This study assumed the upazilas that have high compost production potential are suitable for large-scale plants (Scenario-C1), whereas moderate- and low-compost potential upazilas were considered as medium-scale (Scenario-C2) and small-scale (Scenario-C3) plant establishments, respectively. In Figure 5, the yellow-colored upazilas with more than 600 tons/day compost potential were considered for large-scale composting plant location analysis, where the green (301–600 tons/day) and blue (<300 tons/day) colored areas were considered to have medium- and small-scale plant location optimization, separately.

2.5.3. Required Land Areas and Number of Plants

Typically, the plant capacity depends on land area, the methods used for composting (e.g., sheet composting, window composting, turned composting, and active pile method), and other factors such as the source of raw material, demand for compost, etc. Again, land area requirement depends on several factors such as composting methods, traffic and safety, GHG emission and water leachate control, and the buffer area for product shipping and storage [16,43]. The total land for the composting plant includes not only active composting piles but also curing places and temporary storage space. The provision of adequate space is essential for compost storage, equipment, and maintenance, helping to determine the compost removal frequency and quantity at each composting plant. These factors are required to be considered before identifying an area as a potential site for composting plants. However, about 2 acres of land is required for a 100 tons/day capacity window composting plant with a 28–30 day composting period and a 120-day curing period [43]. Another report said that approximately 0.53 acres are required for composting waste, with a plant capacity of about 6–7 tons/day [44]. In this study, it was assumed that the capacity of composting plants was 8, 50, and 100 tons/day with 330 annual operating days, and the required land areas were 1, 1.5, and 2 acres for small-scale, medium-scale, and large-scale composting plants, respectively. However, not all selected upazilas have enough suitable parcels for establishing composting plants. This study considered the upazilas that had suitable parcels of more than 1 acre of land for further analysis. Afterwards, the number of composting plants was calculated based on the total compost potential in the selected primary upazilas of each scenario, divided by the total capacity and composting cycle (at least 28 days).

2.5.4. Network Analysis

This study used the location-allocation network analysis tool to find optimal locations for composting plants, considering the maximum coverage of manure and rice straw sources (demand points) with a specific range of road travel distance. However, keeping manure transportation costs optimal depends on numerous factors, including travel distance, transportation mode, fuel prices, availability of labor and vehicles, travel routes, and the types of goods transported [45]. In Bangladesh, the distance from feedstock sources to waste treatment plants varies significantly, ranging from 3 km to over 30 km, influenced by various conditions [46,47]. Afterwards, the locating points were generated from suitable parcels of land suitability analysis as facility points for composting plants based on the demand points’ accessibility within 20 km, 15 km, and 10 km distances for large, medium, and small-scale plants, respectively.
To maintain a continuous flow of feed to the composting plants and avoid competition with other plants for manure collection, a minimum 20 km distance was maintained from Scenario-C1 plant sites and a 15 km distance from Scenario-C2 plant sites. The upazilas that fell within a 20 km radius of Scenario-C1 plant sites and a 15 km radius of Scenario-C2 plant sites were excluded from selecting final upazilas for Scenario-C2 and Scenario-C3, respectively.

2.6. Environmental Benefits Assessment

2.6.1. Synthetic Fertilizer Replacement

The percentage of synthetic fertilizer that could be replaced with livestock manure compost (SR) was calculated using Equations (4) and (5) [32,48].
SFR (%) = 100 × NS ÷ ASF
NS = NC × AL × (100 − LN) × 0.01 × (BN)
where SFR = synthetic fertilizer replaced by compost; NS = nutrient supply estimated annually based on the nutrient content of manure compost; ASF = allocated or synthetic fertilizer used in a year; NC = nutrient content (% of N, P, and K content in manure); AL = available livestock manure production in a year; LN = loss of N, P, and K during composting; BN = bioavailability of N, P, and K by agricultural plants. The average values for N, P, and K content in various types of manure, nutrient loss through the composting procedure, and nutrients’ bioavailability by crops from compost are given in Table A4 and Table A5.

2.6.2. GHG Emissions Reduction Potential

Reduction of GHG emissions from manure-based compost generation was estimated in comparison with the GHG emissions generated from synthetic fertilizers by using Equation (6).
GRC = TC × (GSF – GC)
where GRC = GHG emissions reduction potential for livestock compost (kg CO2eq); TC = total compost generation (kg); GSF = GHG emission production rate from synthetic fertilizer (kg CO2eq/kg synthetic fertilizer); and GC = GHG emission production rate from compost (kg CO2eq/kg compost). The factors for GHG emission production from synthetic fertilizer and compost are given in Table 4. The GHG emissions produced through composting are dependent on various aspects, such as the methods of composting, the kinds of manure or waste, the techniques used to count the GHG emissions, etc. [15,49,50,51]. The GHG emission production from synthetic fertilizer also varies according to the region and fertilizer types. Therefore, this study assumed the average value of the GHG emission rate of the referred ranges in the table to calculate the GHG emissions reduction potential from compost in Bangladesh.

2.6.3. Nutrients Leaching Reduction Potential

The manure nutrient leaching reduction potential was assessed by screening leaching nutrients through raw livestock manure and the application of compost onto agricultural fields. As nutrient loss through leaching or runoff is influenced by many factors, such as cultivation methods and fertilizer application practices, soil properties, climate, rainfall, elevation, etc. [62,63,64,65], this study used the average value of the referenced range for N and P leaching factors (Table 5) to calculate nutrient leaching from livestock manure and compost by using Equation (7) [66].
NL = LFN + (Ini – RDN)
where NL = nutrients leaching out (kg/ha); LFN = leaching factor for nutrients (kg/ha); Ini = intensity for nutrients in each stock item i (manure of each livestock and compost) was divided by the area of upazilas for each scenario (kg/ha); RDN = recommended dose of nutrients application in fields (kg/ha), approximately 30 and 15 kgha−1 for N and P application to fields [67].

3. Results

3.1. Identification of Suitable Areas

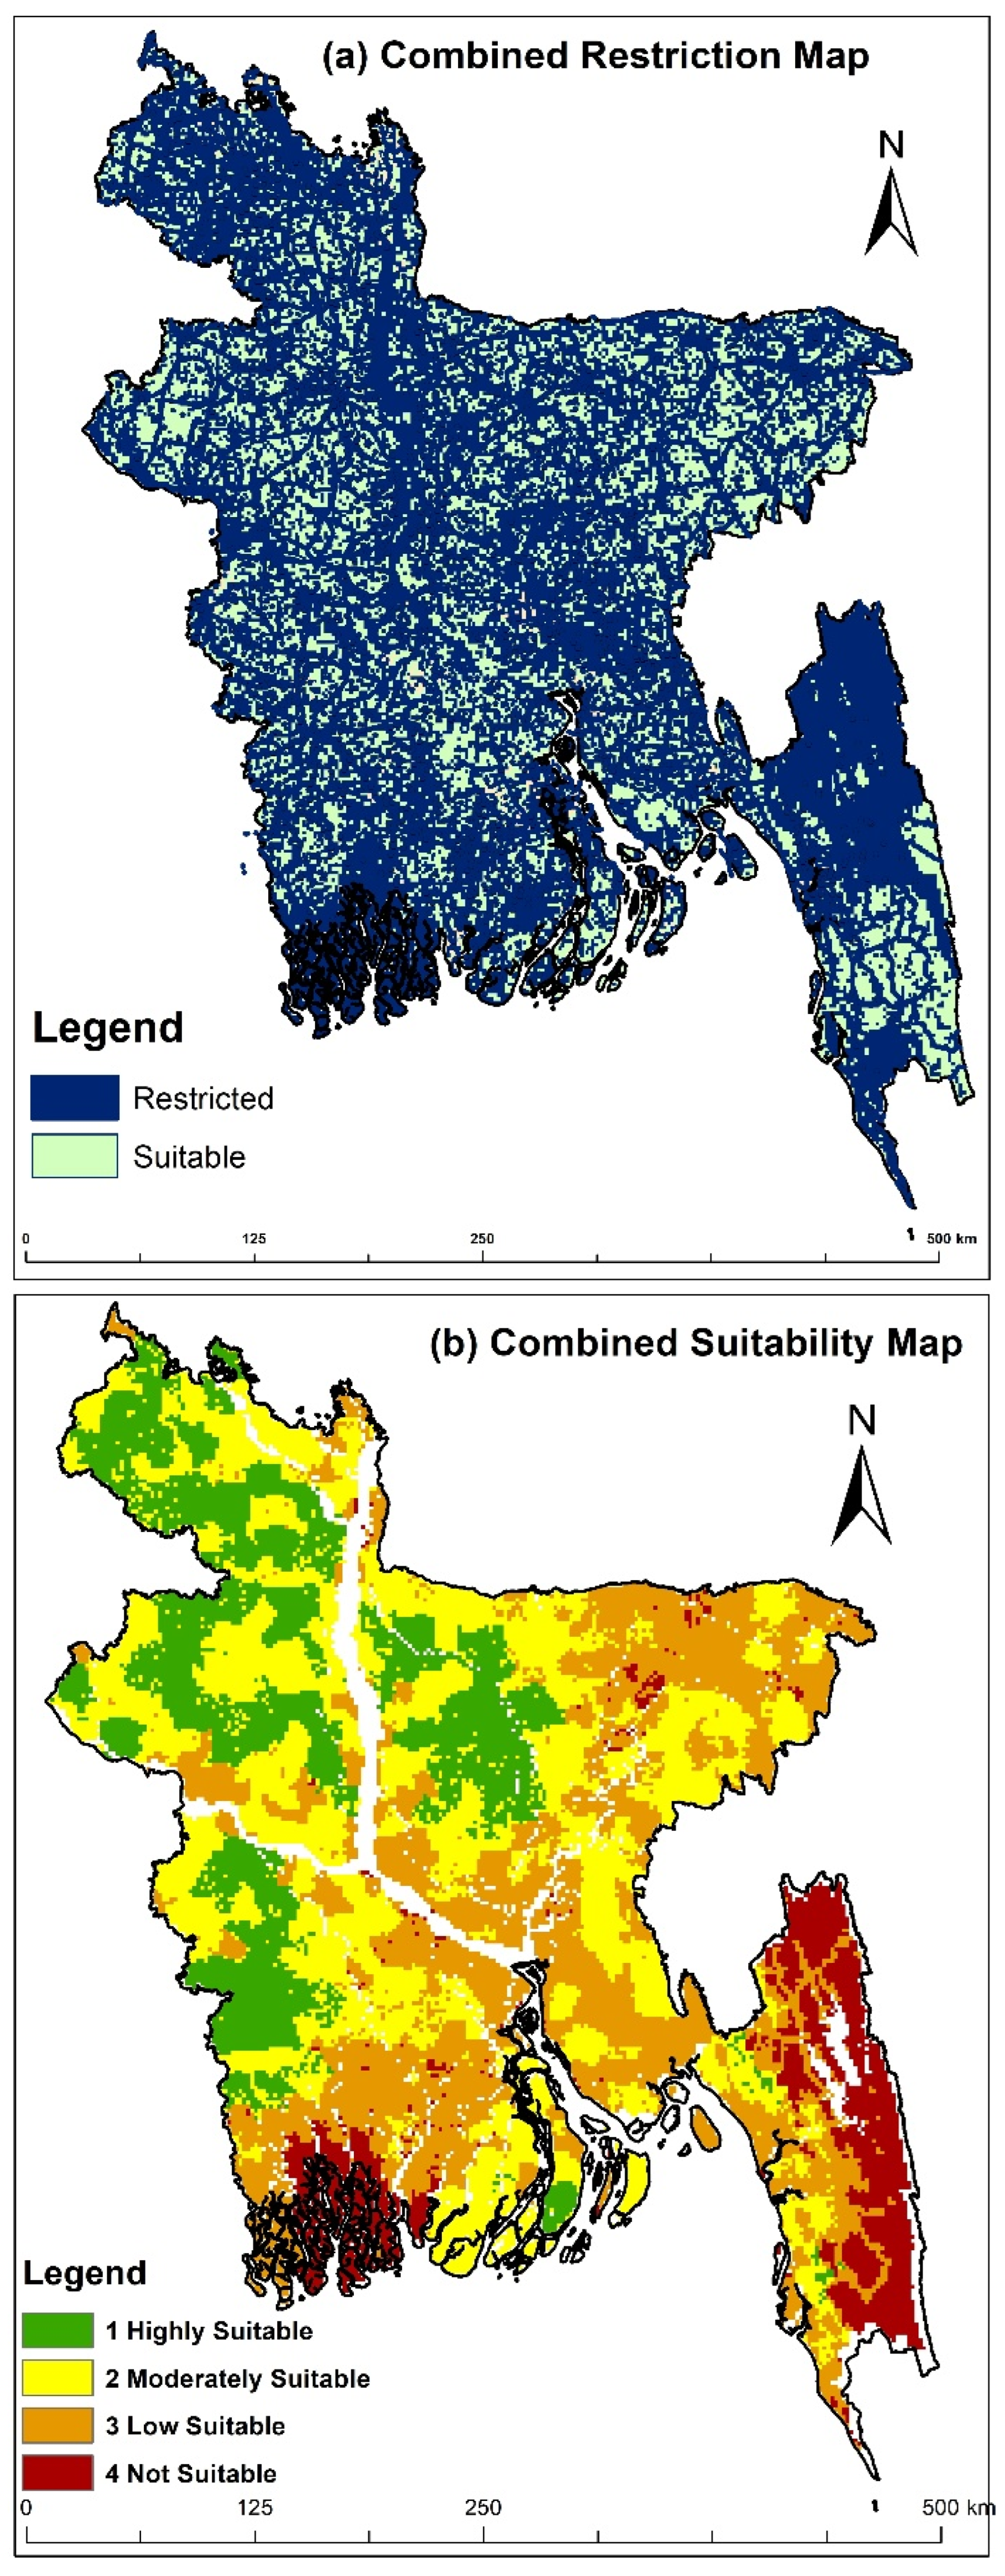
In the restriction modeling, six restricted features were analyzed and excluded from the country map to identify the lands that are applicable for further development (Figure 6a–f). In the case of suitability modeling, the degree of land suitability was analyzed based on six suitability features, and the separate suitability raster maps are shown in Figure 7a–f. After the combination of all the different restricted feature maps, the final restriction map was interpreted (Figure 8a), where the restricted and suitable areas were specified by blue and light green-colored areas, respectively. The separate suitability maps were combined to create the combined suitability map (Figure 8b), where the green, yellow, orange, and red-colored areas are indicated as highly suitable, moderately suitable, low suitable, and not suitable areas for siting composting plants in Bangladesh.
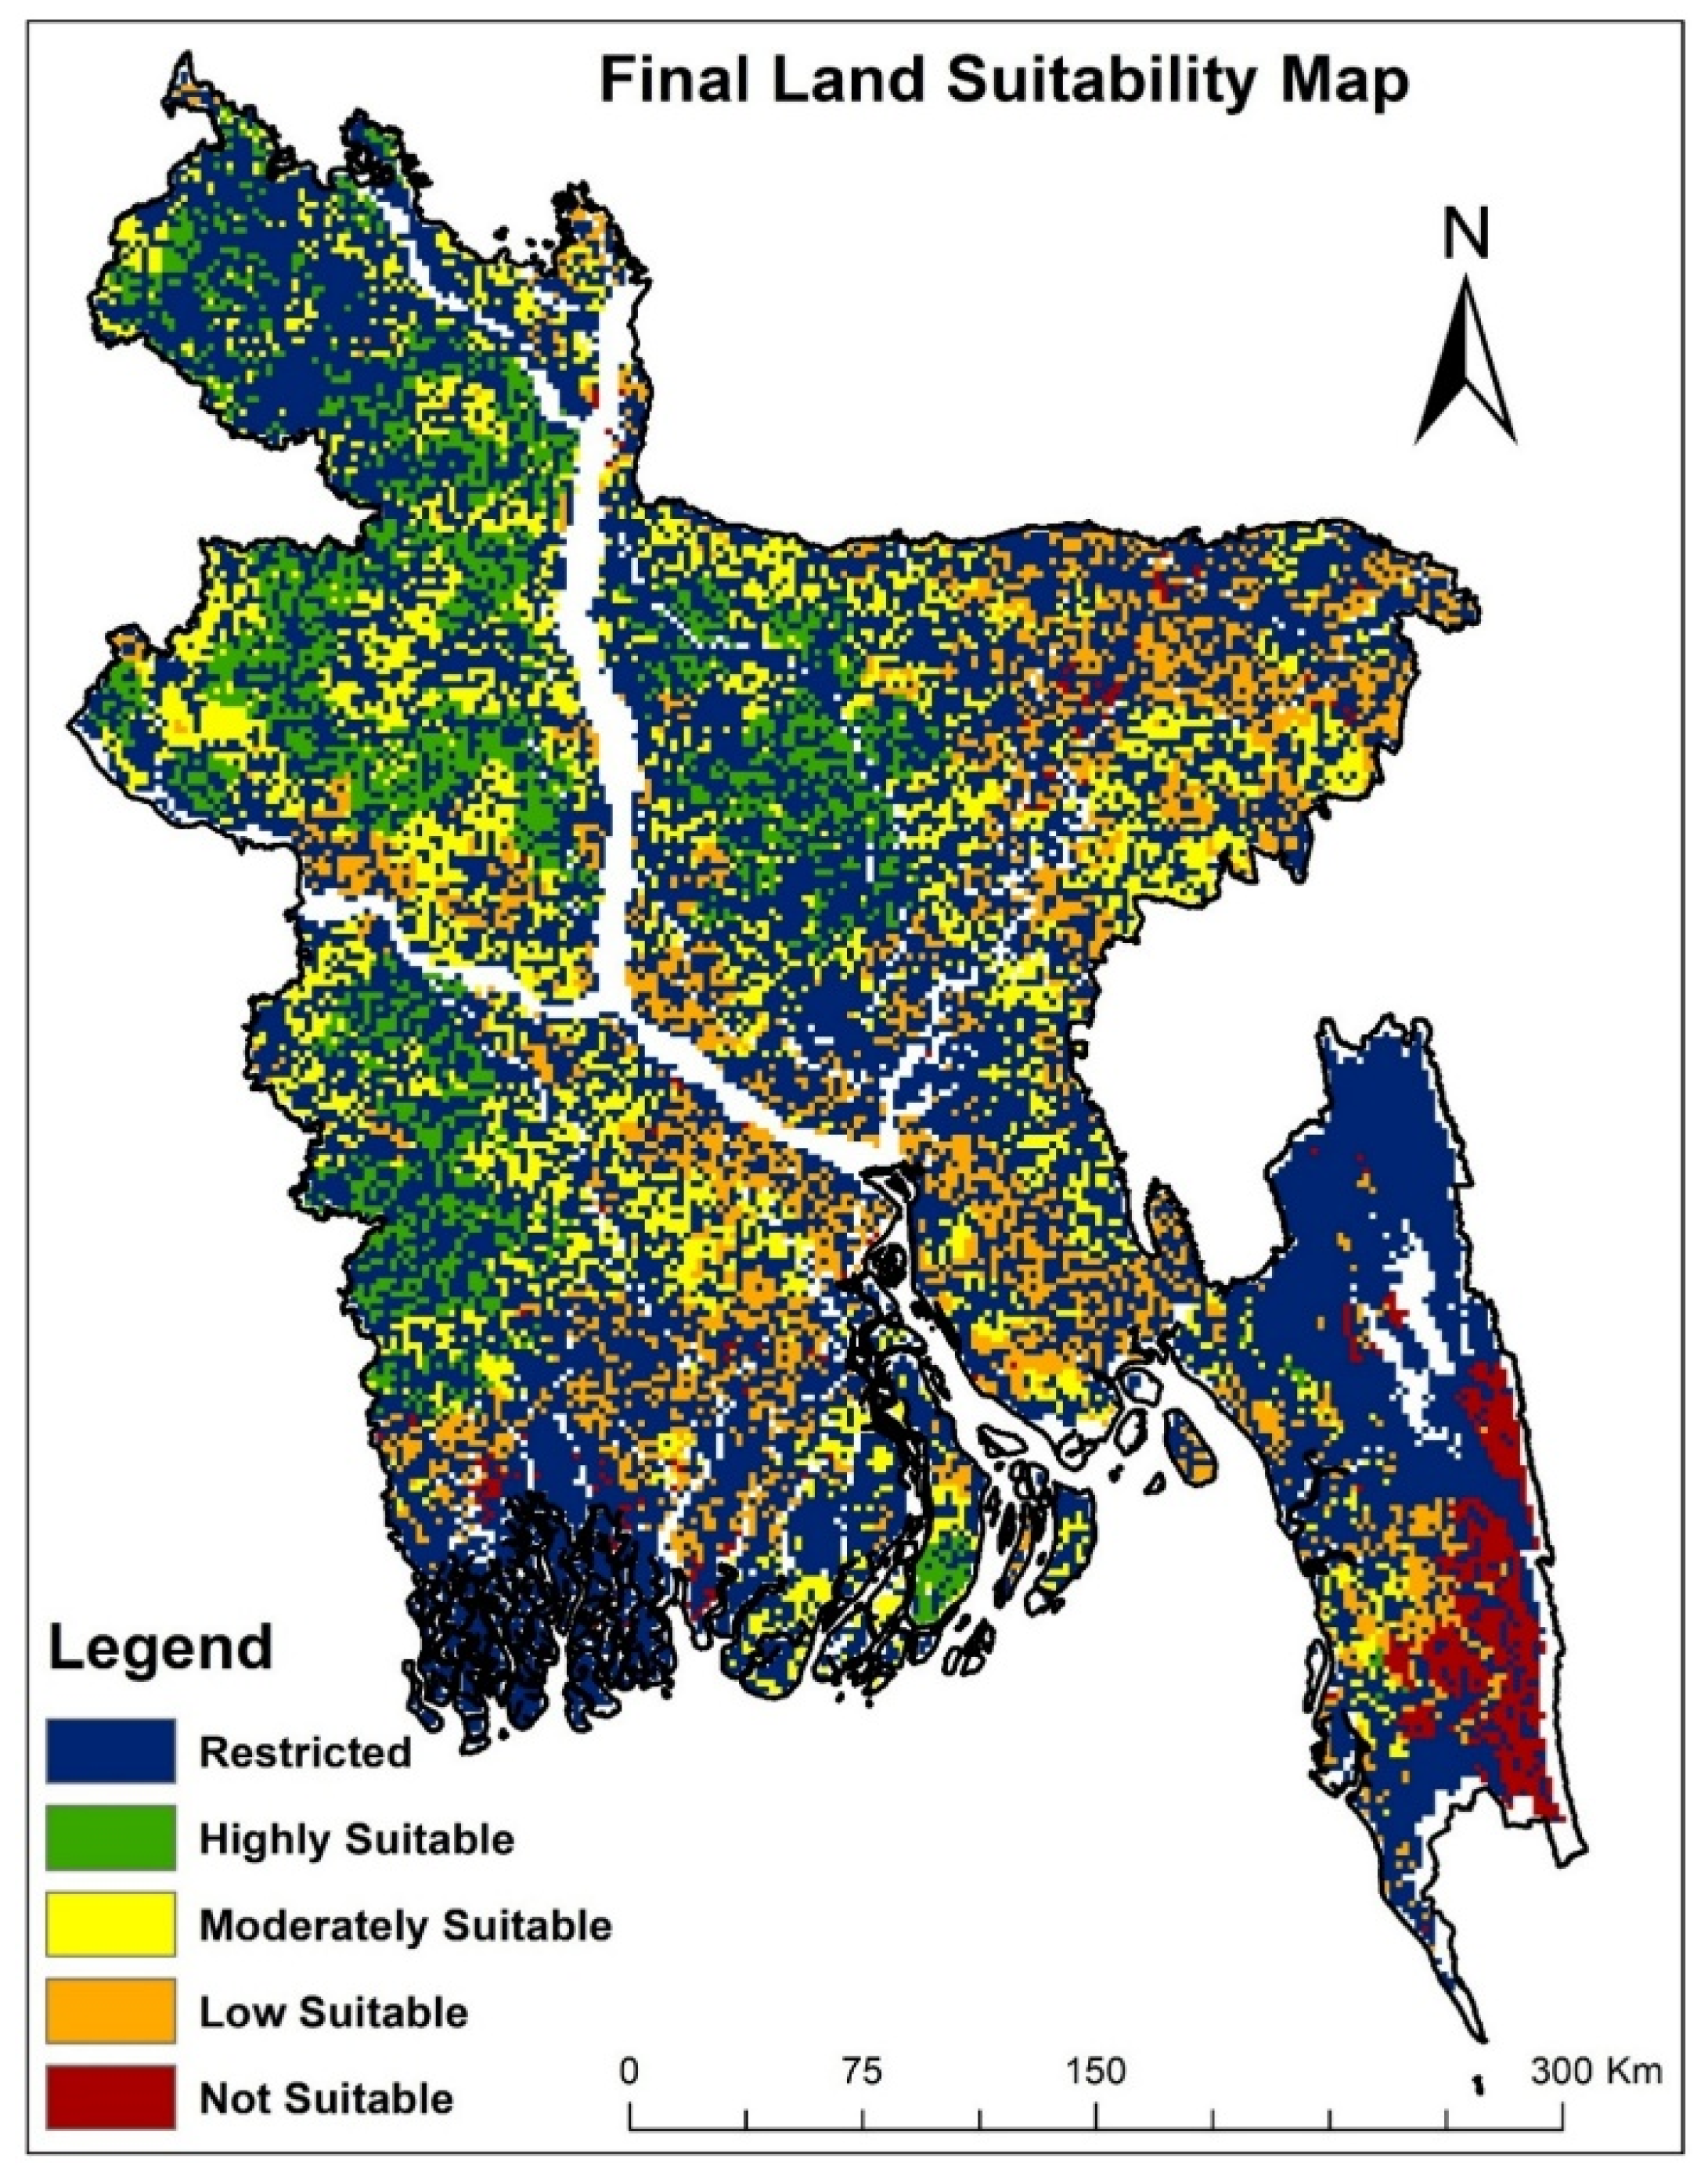
Lastly, the restriction and suitability maps were combined to create a final land suitability map where all types of land suitability indices existed alongside restricted areas in one map (Figure 9). From this final land suitability map, the high and moderately suitable areas were extracted as suitable parcels to use in the network analysis during scenario analysis.

3.2. Optimizing the Locations for Composting Plants

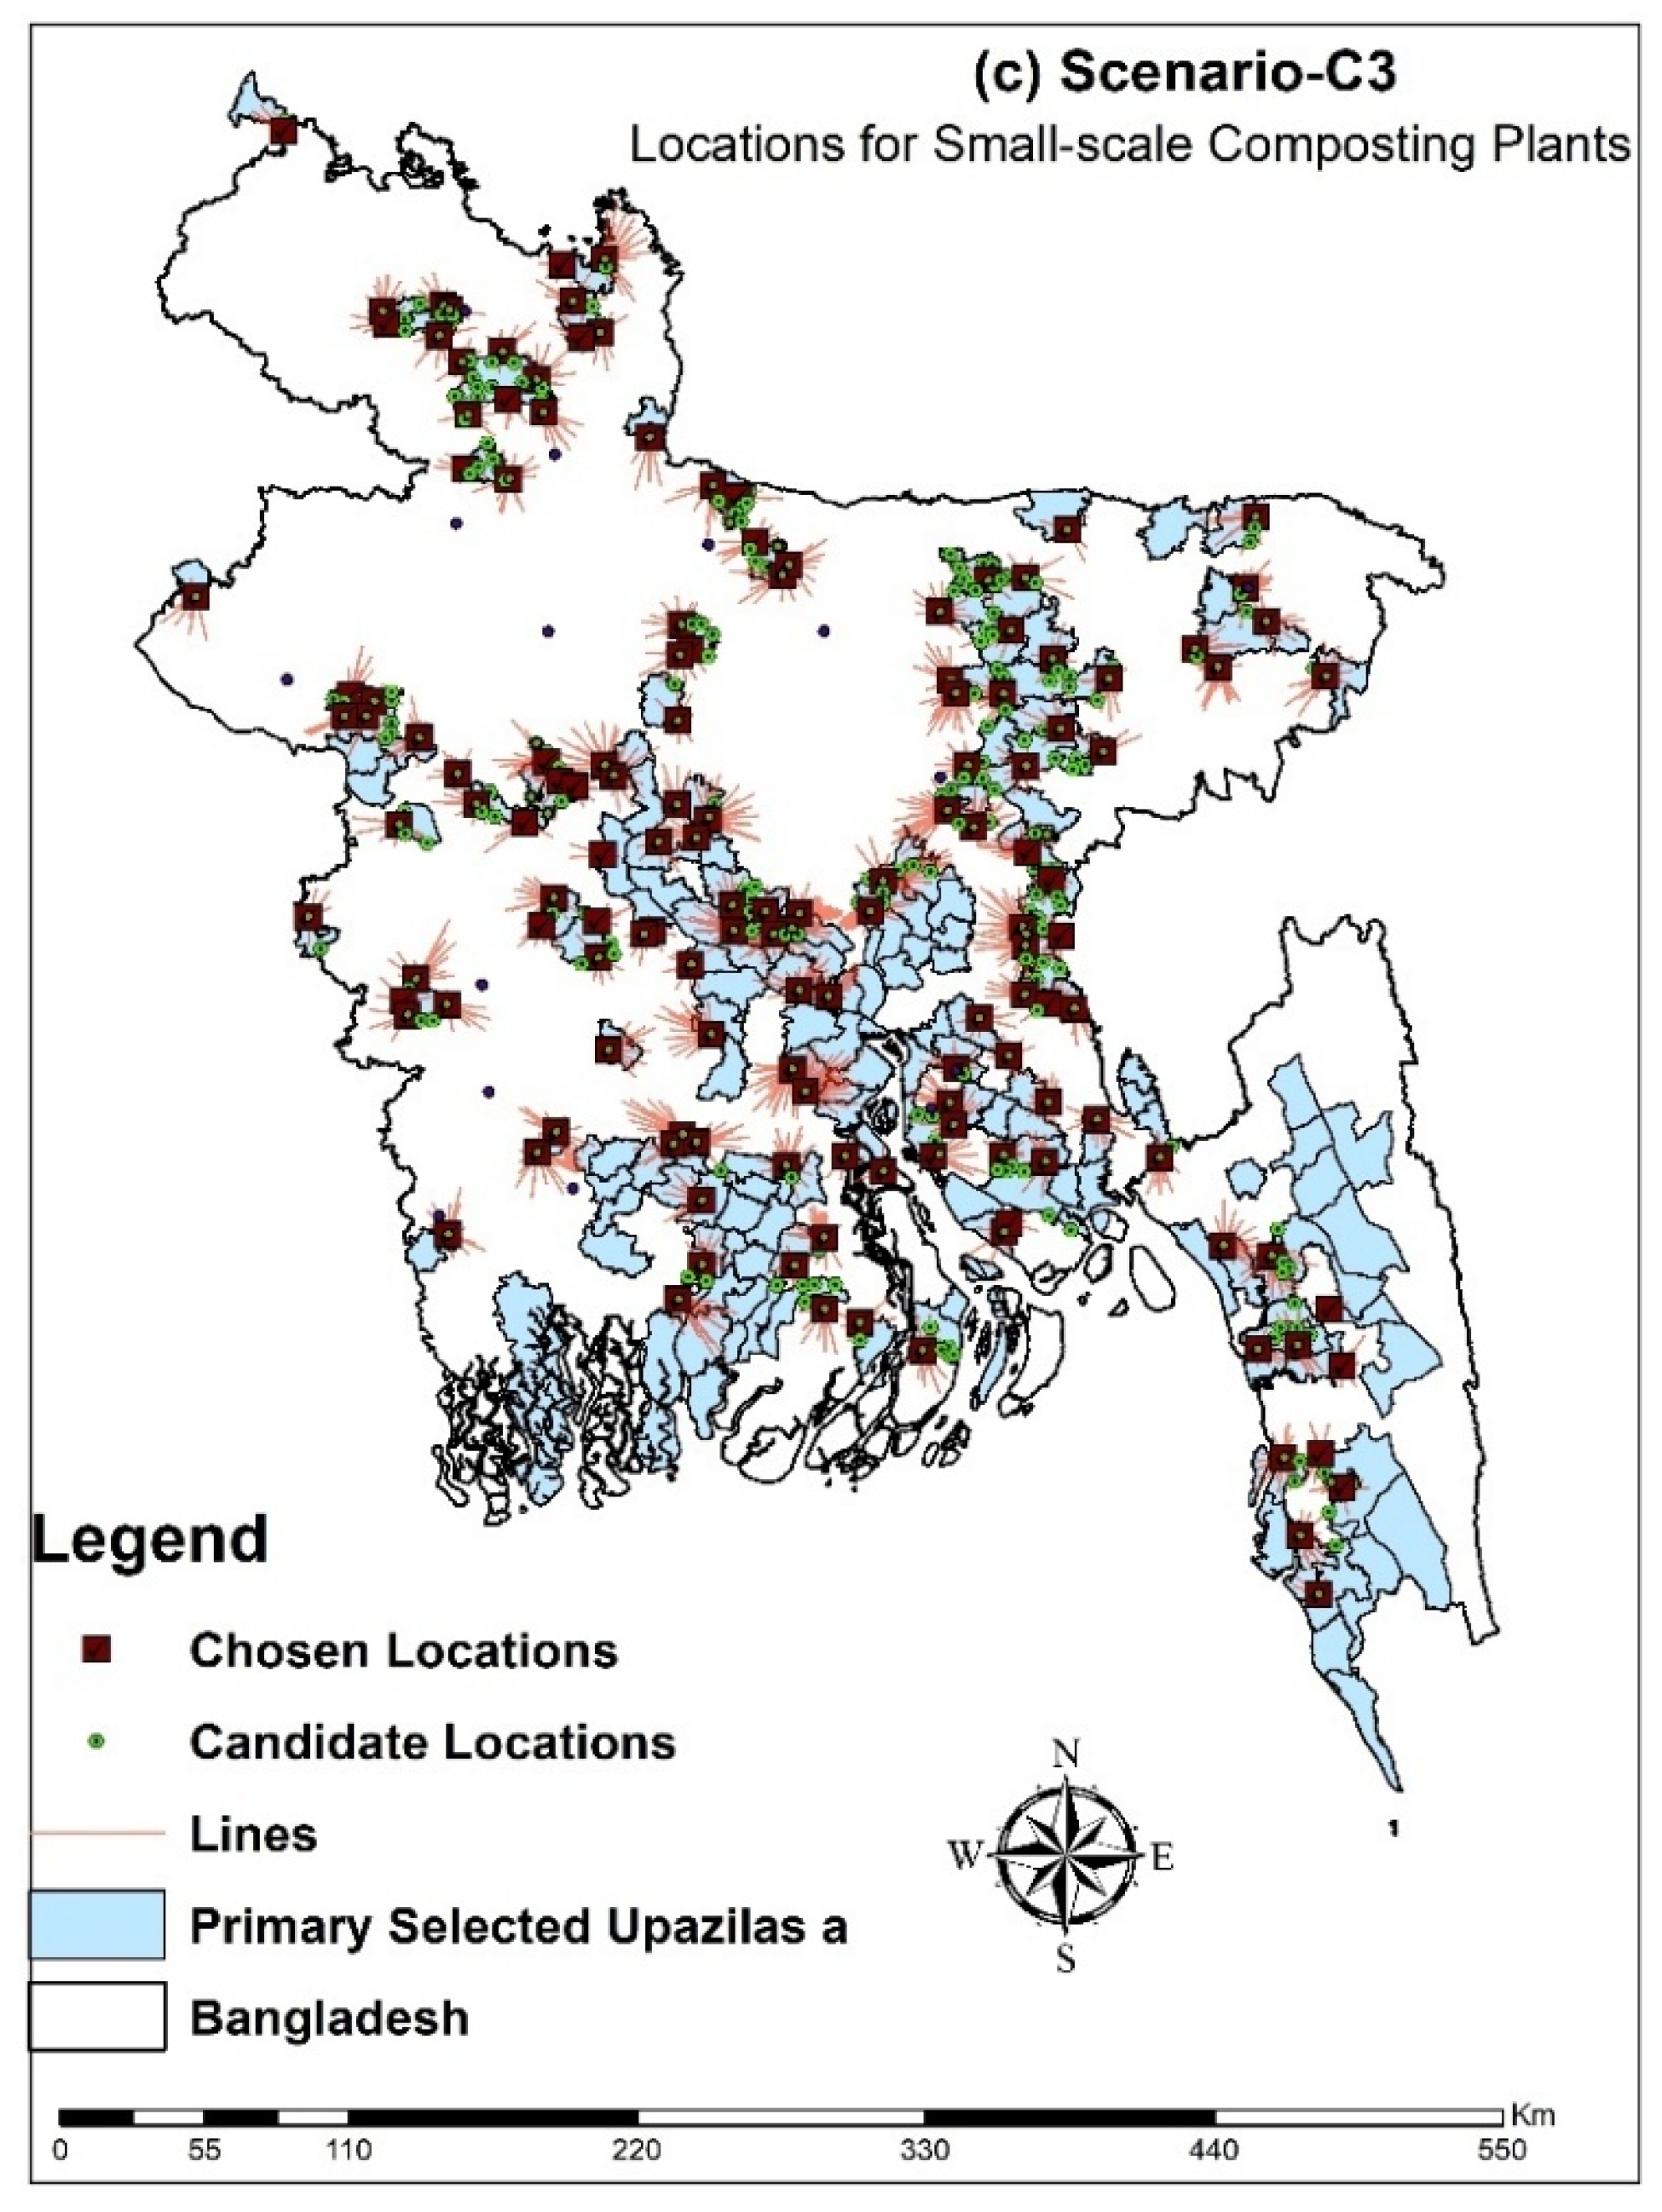
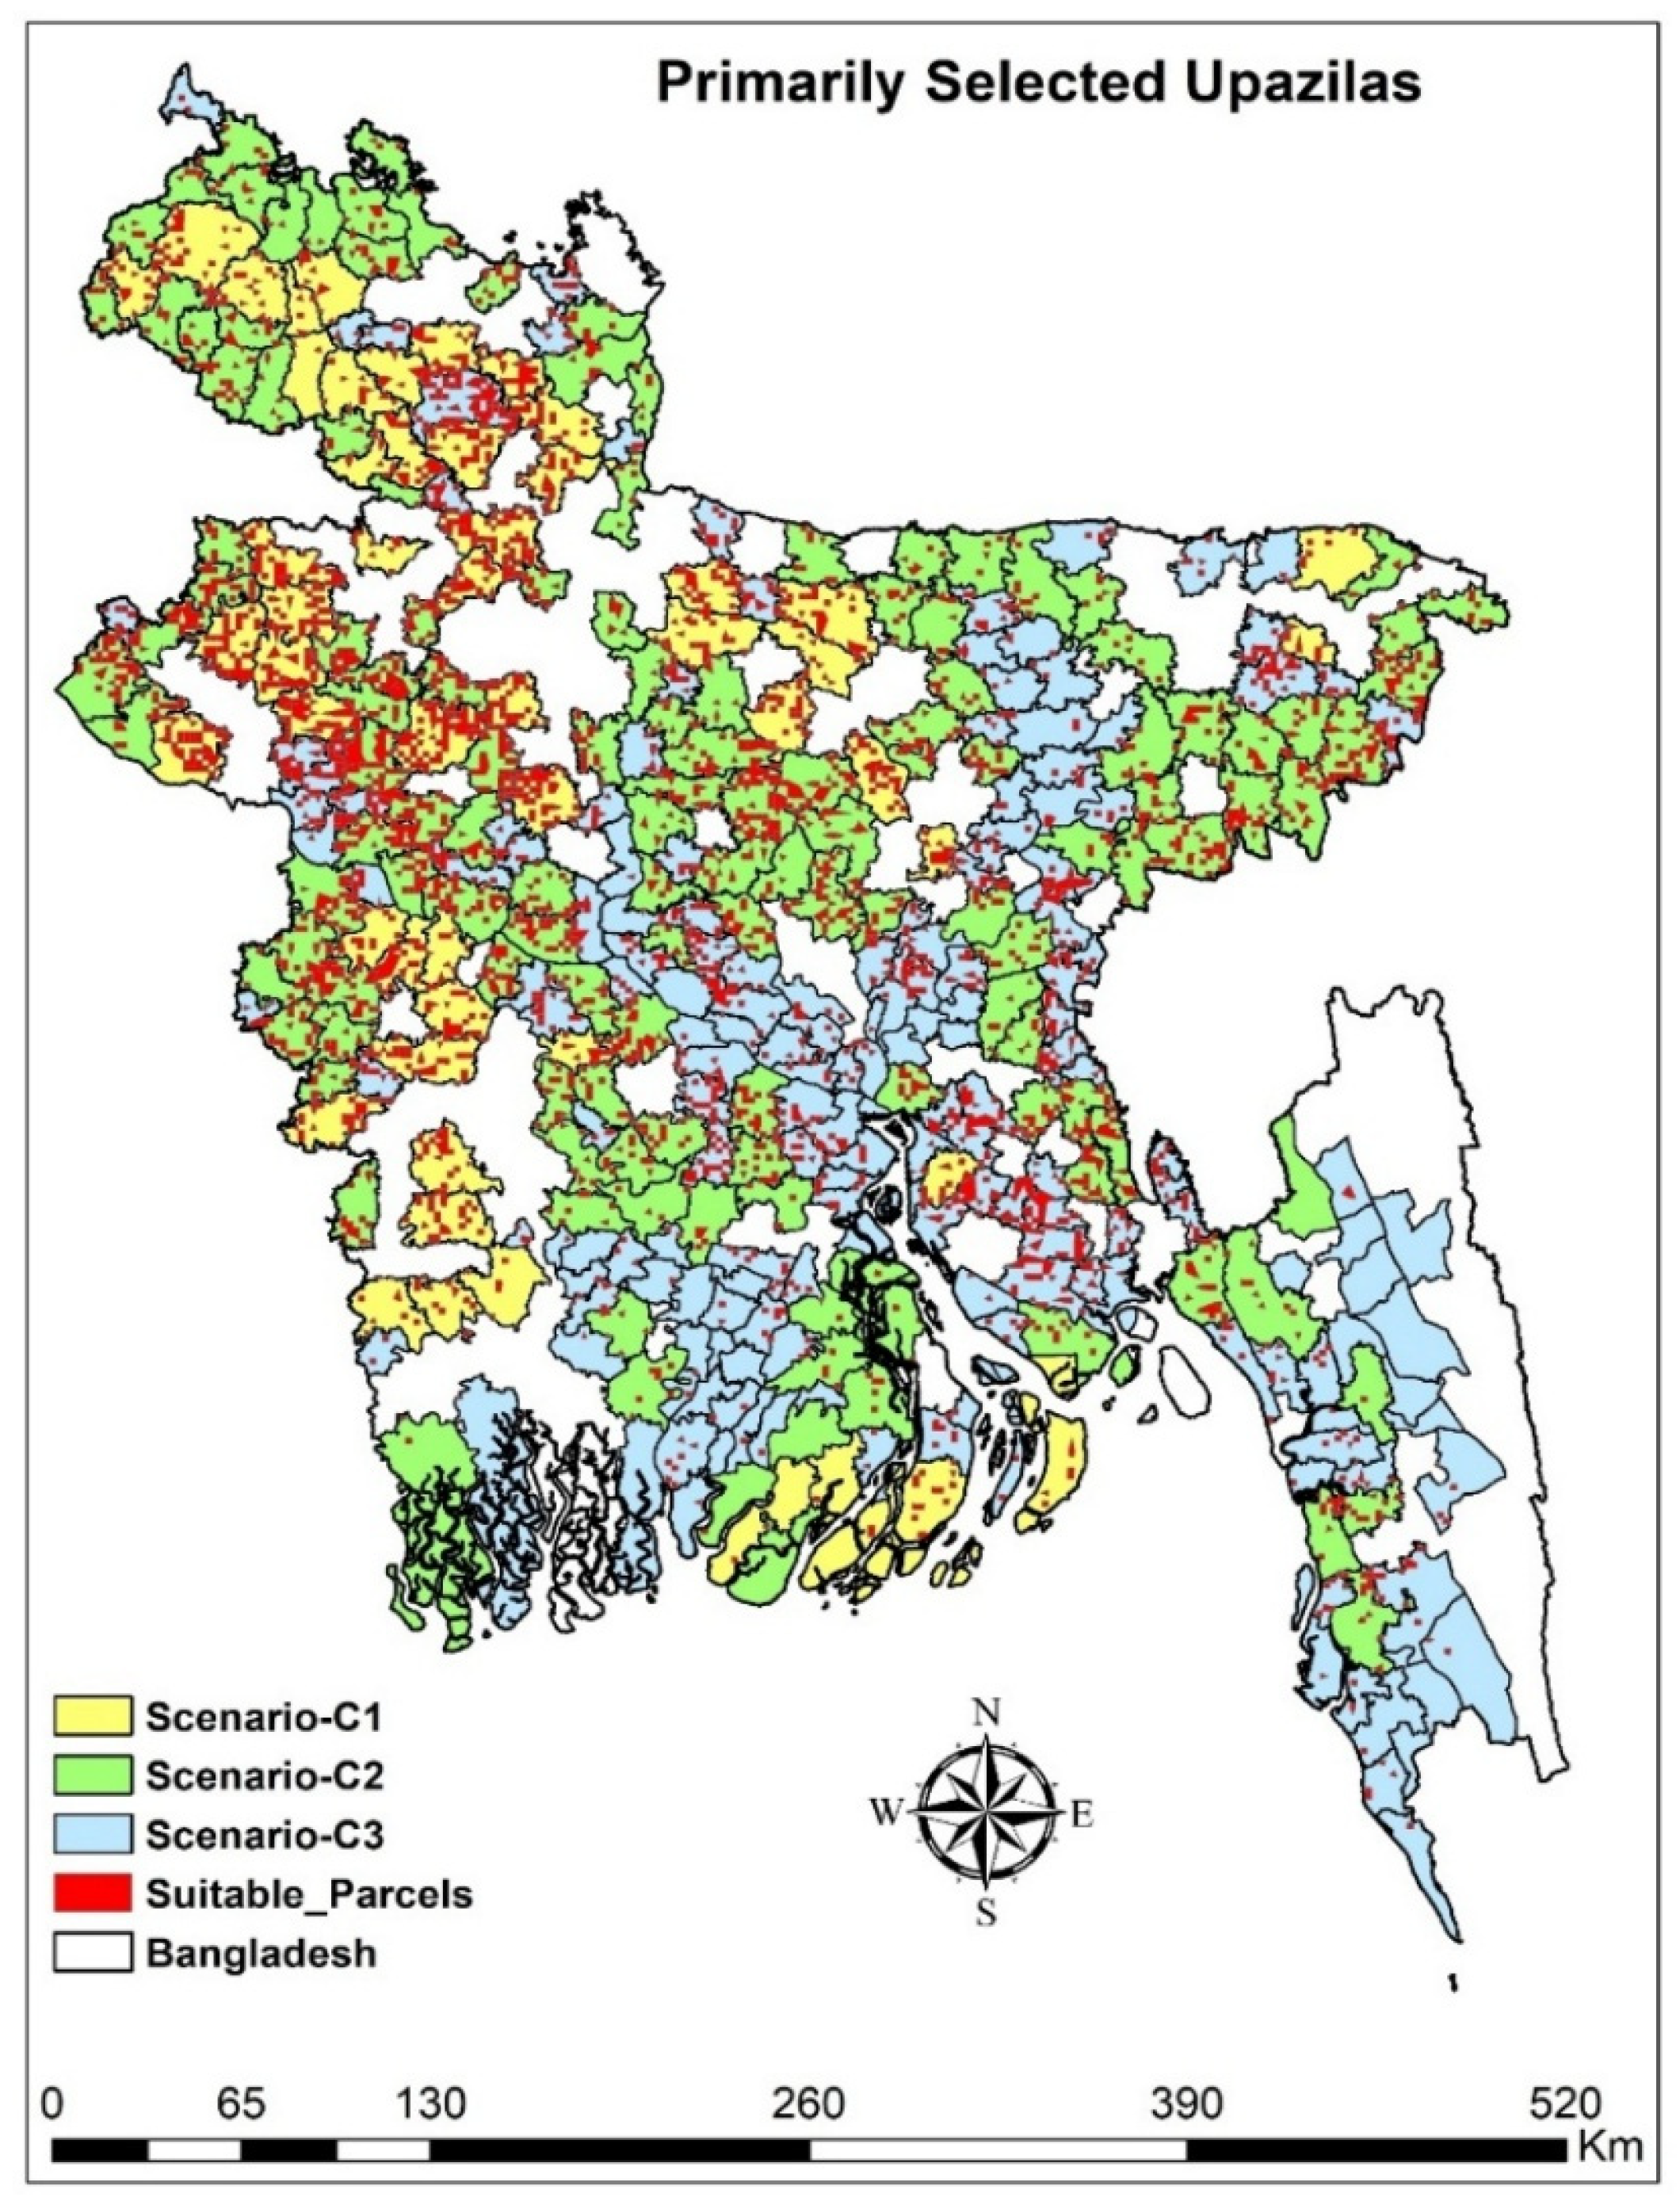
After spatial analysis, approximately 53, 138, and 222 upazilas were selected as primary upazilas for the establishment of large-scale, medium-scale, and small-scale composting plants from livestock manure in Bangladesh, respectively (Figure 10). The red colored areas within the primary selected upazilas are indicated as suitable parcels in the land suitability analysis. However, all the initially selected upazilas lack sufficient suitable parcels for developing composting plants. Similarly, each selected upazila has several suitable parcels for implementing composting plants. Therefore, the optimum sites are identified through network analysis among various candidate locations within the primarily selected upazilas. The results indicate that, in Scenario-C1, 15 large-scale composting plants are feasible considering transport efficiency and manure volume from the total livestock in the selected upazilas (Figure A1a). Additionally, around 42 medium-scale plants could be established to produce compost from available livestock manure within the chosen upazilas in Scenario-C2. (Figure A1b). As the plant capacity of Scenario-C3 was less than medium and large-scale plants, the number of plants was higher than in other scenarios. Around 147 locations were counted as chosen locations among many candidate locations for small-scale compost production in Scenario-C3 from livestock manure in Bangladesh (Figure A1c). Finally, the optimized locations for composting plants in different scenarios across Bangladesh are shown on the Google Earth map (Figure 11).

3.3. Potential Environmental Benefits

All potential benefits calculated from various scenarios are summarized in Table 6. Scenario-C1 indicates that installing 15 large-scale composting plants, each with a capacity of 100 tons per day, could produce approximately 496.04 kilotons of compost annually. From Scenario-C2, 42 sites are chosen for medium-scale composting plants, with potential compost production of 694.46 kilotons/year, enough to replace about 29.07 kilotons of chemical fertilizer annually. Scenario-C3 shows 147 small-scale composting plants, which can produce around 347.23 kilotons of compost yearly. The nutrients supplied through compost from these scenarios are 20.77, 29.07, and 14.54 kilotons/year, respectively, which could substitute roughly 4.35% of synthetic fertilizer imports from abroad in 2024.
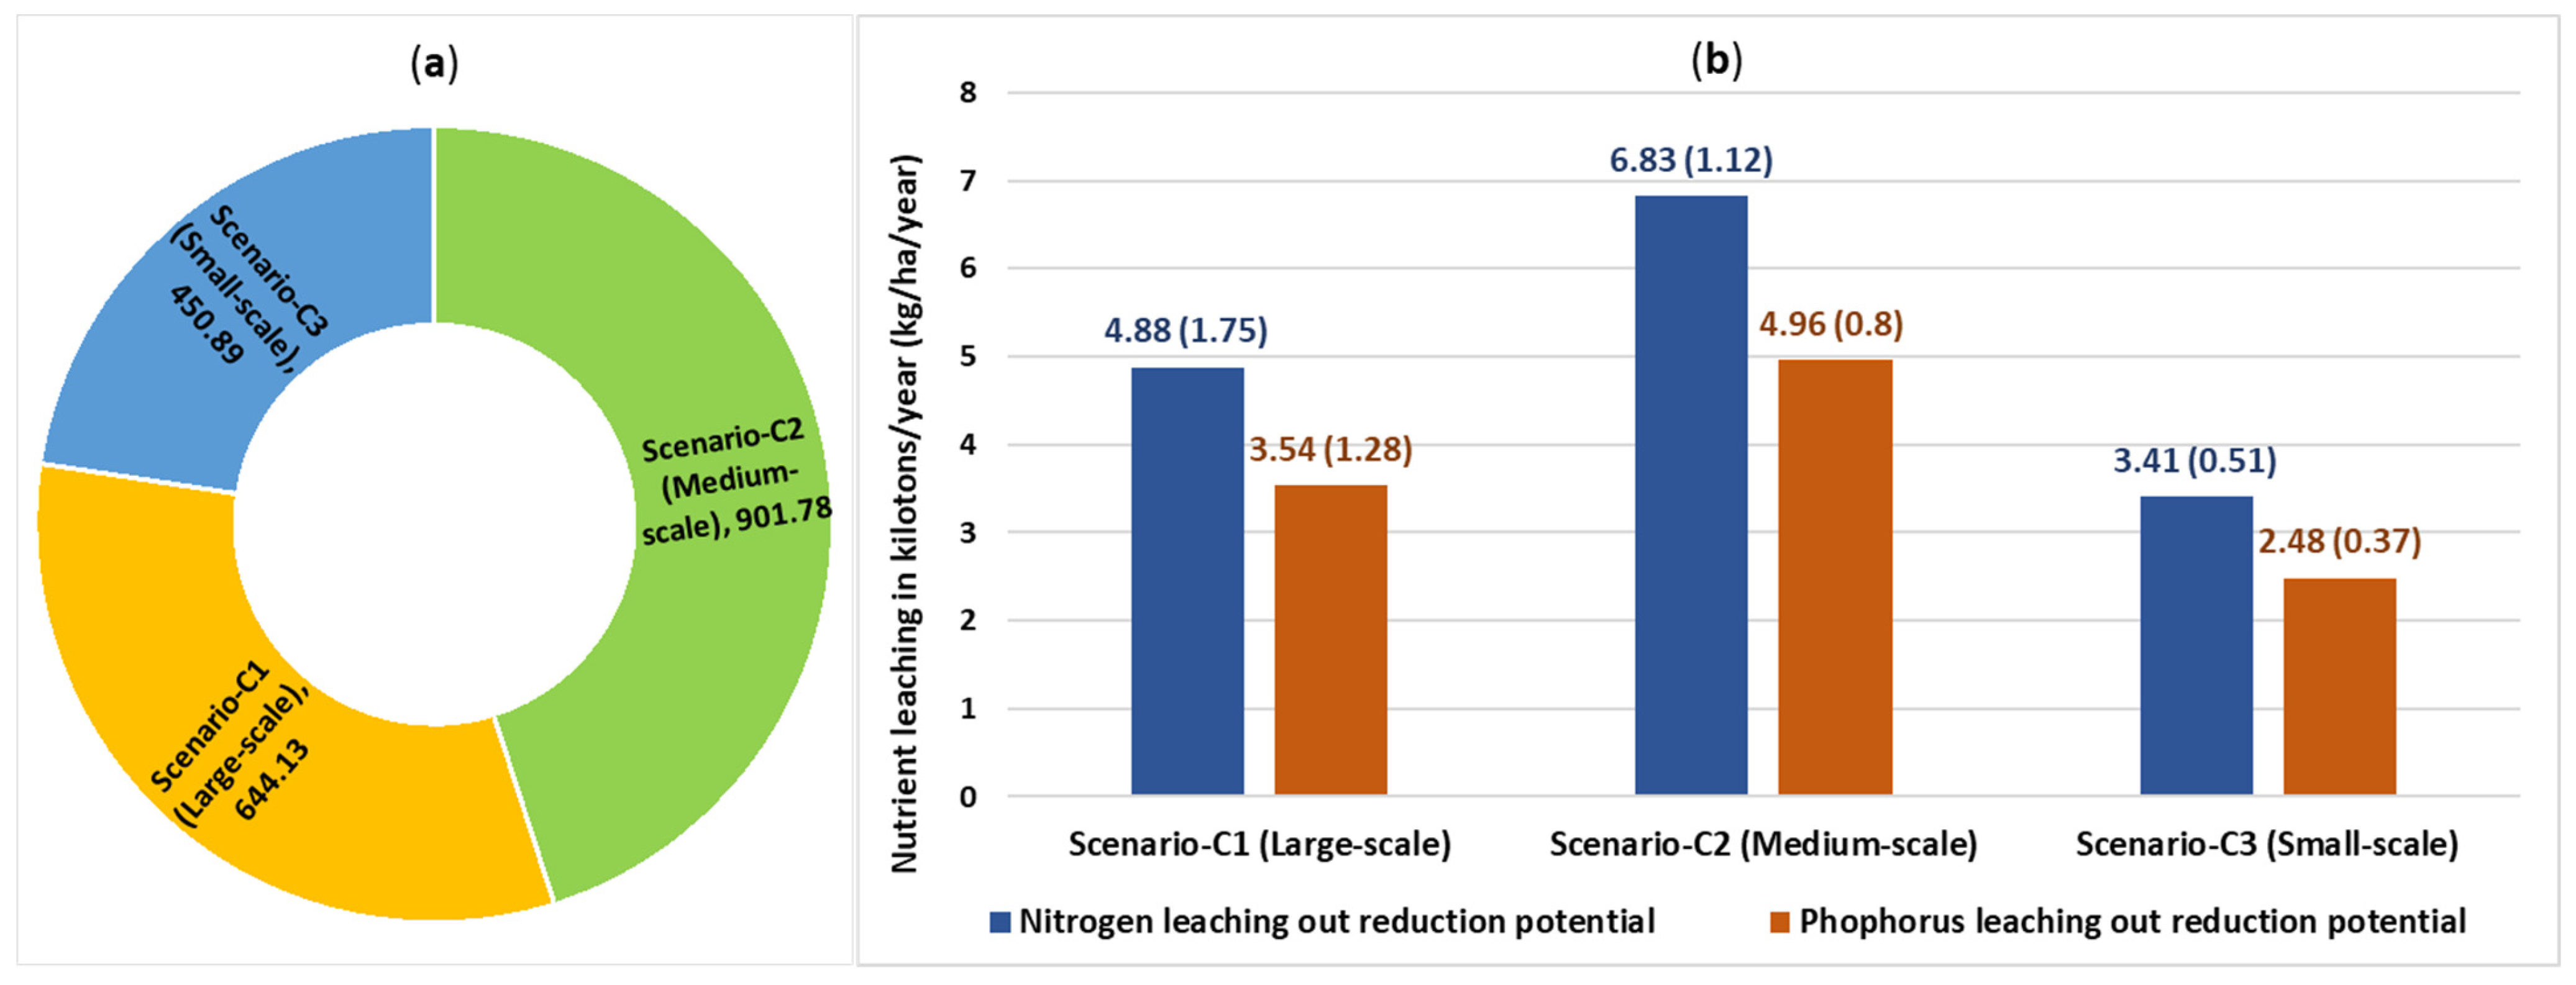
The estimated reductions in GHG emissions and manure nutrient leaching are illustrated in Figure 12. Under Scenario-C1, composting plants could prevent 644.13 gigagrams of CO2eq emissions annually by replacing synthetic fertilizers. Scenario-C2 and C3 could reduce 901.78 and 450.89 gigagrams of CO2eq emissions, respectively. Additionally, these plants could prevent the leaching of manure nutrients into water by about 4.78, 6.82, and 3.41 kilotons/year for N, and roughly 3.54, 4.96, and 2.48 kilotons/year for P, from large, medium, and small-scale composting plants, respectively. To produce 1537.73 kilotons of compost, approximately 2704.79 kilotons of available livestock manure are needed annually, which will require disposing of a total of 4507.99 kilotons of waste in landfills or by alternative methods.

4. Discussion

Optimizing the locations for livestock manure-based composting plants using GIS spatial modeling is a new approach for this study area. Previously, the GIS model was applied to waste management plants using land suitability [22,77,78]. This study applied both land suitability and network analysis to optimize the composting location. Afterwards, the land suitability index was executed by eliminating different restricted areas from the suitable area, which ensures the analysis has greater relevance and accuracy. The identified composting plants were optimized by analyzing input sources (manure and rice straw) and output needs (synthetic fertilizer) using spatial and network methods. The optimization aimed at providing maximum input coverage within a fixed travel distance, enhancing transport efficiency by minimizing fuel and labor costs for shorter trips. The chosen locations for composting plants from the scenario analysis were identified in Bangladesh, and these locations can produce compost as organic fertilizer to replace the synthetic fertilizer used for crop production.
To implement the proposed scenarios, the government policy, available technology, and other facilities of operating plants are important issues to consider. However, as Bangladesh is an agriculturally based country, its demand for fertilizer for agricultural crop production is enormous. Farmers conventionally use manure for the fertilization of their land, which enhances climate pollution and does not provide proper economic benefits. Conventional manure application often falls short of the economic advantages of compost because of key factors such as nutrient concentration, transportation expenses, and application difficulties. Although manure provides essential nutrients and benefits for soil health, its lower nutrient density and the costs associated with managing and distributing large quantities of raw manure can render it less economical than compost or synthetic fertilizers in certain cases [79,80]. So, improved manure management strategies and methods are important for the sustainability of livestock farms. Moreover, the establishment of an organic fertilizer/composting plant requires a low investment compared to a biogas plant [81]. In recent years, composting has become a promising technique because the operating costs and technology requirements are low. So, the composting plant development is also recommended from an economic perspective.
The total amount of synthetic fertilizer used in Bangladesh was about 3469.72 kilotons in 2024 [17,82] where 42.68% (1481 kilotons) of it was imported from abroad [83]. The installation of all scenarios could produce 1537.73 kilotons/year of compost from livestock manure, which supplies 64.43 kilotons/year of nutrients for crop production. This nutrient supply can reduce approximately 4.35% of total synthetic fertilizer imports in Bangladesh. Again, the manure applied to cropland was only 1196.28 kilotons in 2024 [18,82]. So, this compost production has the scope to increase the nutrient supply from livestock manure rather than using chemical fertilizer.
Many farmers are not interested in using compost as an alternative to synthetic fertilizers due to the low growth of the plants; nevertheless, it has a great effect on decreasing GHG emissions compared to synthetic fertilizer application and reducing manure nutrients leaching out to the water [4]. The compost produced during all scenarios can create a reduction of about 1996.81 gigagrams of CO2eq emissions, which is about 15.03% of the total GHG emissions from total livestock manure and 24.27% of total synthetic fertilizer uses in Bangladesh (the GHG emissions produced by manure and synthetic fertilizer in 2024 amounted to 13,288 and 8328.71 kilotons CO2eq, respectively) [82]. Moreover, the nutrients leaching was reduced by about 15.11 kilotons/year as N, which suggests that almost 7.22% of N leaches out due to synthetic fertilizer use (with 209.18 kilotons/year of nutrients leaching out as N from synthetic fertilizer in 2024) [82]. Afterwards, the N leaching rate resulting from synthetic fertilizer use in Bangladesh was 23.72 kg/ha in 2024, whereas the N leaching rate associated with manure-based compost application on cropland was estimated at 3.67 kg/ha by this study. Applying compost decreases nutrient leaching relative to raw manure by stabilizing nutrients during composting, which makes them less susceptible to being washed away by water, and compost enhances the soil structure, improving water retention and minimizing runoff [32,84,85]. Therefore, compost production will not only help with economic development but will also reduce the impact on the environment by replacing synthetic fertilizers.
This study classified composting plants into large, medium, and small scales through scenario analysis, which is closely linked to transportation costs influenced by different travel distances. The location of these plants greatly affects transportation expenses. Larger plants tend to have lower per-unit transportation costs because of economies of scale, but their total transportation costs may be higher due to a broader collection radius. Conversely, smaller plants usually have higher per-unit costs but incur lower total transportation expenses related to a more limited collection zone. Medium-sized plants are positioned between these two extremes.
Composting plant location optimization can significantly influence strategy expansion related to clean technologies and materials by indicating the effectiveness of total waste reduction, resource recovery, and soil fertility enhancement. This can lead to emphasizing the organic fertilizer use in crop production for sustainability, promoting circular economy models, and encouraging the development and adoption of cleaner production methods.

5. Conclusions

This spatial modeling study for composting plant location optimization in Bangladesh using GIS tools can support local governments or private organizations in initiating projects by producing organic fertilizer from livestock manure and reducing environmental pollution. Developing these scenarios requires coordinated management among the related institutions. However, several issues, such as the actual capacity of plants, the social status of the locality, the economic activity of residents, and related policies, must be addressed before constructing these plants. This necessitates investigation, research work, and extension efforts focused on strategies, systems, and techniques to maximize the benefits of livestock manure composting while minimizing its impact on natural resources and ecosystems.
This approach can greatly aid decision makers by offering a data-driven method for suitable site selection, resource management, and policy-making of organic fertilizer production. The model facilitates a thorough analysis of factors such as livestock density, manure production rates, transport routes, environmental policies, and the potential for producing manure-based composts. This helps identify optimal sites that reduce costs, enhance efficiency, and lessen environmental impacts, supporting more sustainable manure management practices in Bangladesh. Additionally, comprehensive life cycle analysis, economic cost–benefit assessments, and social impact studies focused on manure composting are essential future steps. Furthermore, this type of spatial modeling can also be used to select sites for other types of waste recycling plants within the study area or in different countries.
Choosing a location for a composting facility in Bangladesh requires careful assessment of environmental effects. Key considerations include closeness to manure sources, transportation facilities, and risks of soil and water contamination. Properly located and managed composting facilities can decrease landfill use, reduce greenhouse gas emissions, and enhance soil quality. Conversely, poorly chosen sites may cause issues like air and water pollution from leachate or odors, and harm local ecosystems.

Author Contributions

Conceptualization, Z.M. and H.Y.; methodology, Z.M. and M.F.A.K.; software, H.Y.; validation, H.Y.; investigation, M.F.A.K.; formal analysis, Z.M.; data curation, M.F.A.K.; writing—original draft preparation, Z.M.; writing—review and editing, H.Y.; resources, M.F.A.K.; visualization, Z.M.; supervision, H.Y. All authors have read and agreed to the published version of the manuscript.

Funding

This research received no external funding.

Data Availability Statement

The original contributions presented in this study are included in the article. Further inquiries can be directed to the corresponding authors.

Acknowledgments

The authors gratefully acknowledge the support of the Graduate School of Environmental Sciences and Technology, University of Tsukuba, Japan.

Conflicts of Interest

The funders had no role in the design of the study; in the collection, analyses, or interpretation of data; in the writing of the manuscript; or in the decision to publish the results.

Appendix A

Table A1. Ranking of suitability features for AHP analysis (initial matrix).
Suitability FeaturesLivestock Manure AvailabilityRice Straw Availability Distance to Road NetworkDemand for Synthetic FertilizerFlood-Prone AreaElevation
Livestock manure availability123456
Rice straw availability 0.511.5234
Distance to the road network0.330.6611.523
Demand for synthetic fertilizer0.250.50.66123
Flood-prone area0.20.330.50.513
Elevation0.1660.250.330.330.331
Sum2.4464.746.999.3313.3320
Table A2. Normalized matrix for suitability criteria AHP analysis.
Suitability FeaturesLivestock Manure AvailabilityRice Straw Availability Distance to the Road NetworkDemand for Synthetic FertilizerFlood-Prone AreaElevationCriteria Weights
Livestock manure availability0.4088310.4219410.4291850.4287250.3750940.30.393962
Rice straw availability 0.2044150.210970.2145920.2143620.2250560.20.211566
Distance to the road network0.1349140.1392410.1430620.1607720.1500380.150.146338
Demand for synthetic fertilizer0.1022080.1054850.0944210.1071810.1500380.150.118222
Flood-prone area0.0817660.069620.0715310.0535910.0750190.150.083588
Elevation0.0678660.0527430.047210.035370.0247560.050.046324
Table A3. Calculation of consistency index (CI) and consistency ratio (CR) for suitability criteria AHP analysis.
Suitability FeaturesLivestock Manure AvailabilityRice Straw Availability Distance to the Road NetworkDemand for Synthetic
Fertilizer
Flood-Prone AreaElevationWeighted Sum ValueCriteria WeightsRatioAverage
max)
CI = (λmax-n)/n − 1CR = CI/RI *
Livestock manure availability0.3939620.4231320.4390130.4728880.4179390.2779452.42490.36816.58676.07480.01480.0119
Rice straw availability 0.1969810.2115660.2195060.2364440.2507630.1852971.30060.19876.5467
Distance to the road network0.1300080.1396340.1463380.1773330.1671750.1389720.8990.18994.7368
Demand for synthetic fertilizer0.0984910.1057830.0965830.1182220.1671750.1389720.7252260.11536.2884
Flood-prone area0.0787920.0698170.0731690.0591110.0835880.1389720.5034490.0836.0576
Elevation0.0653980.0528920.0482910.0390130.0275840.0463240.2795020.04496.2282
RI = Random Index and CI = Consistency Index. * RI = 1.24 [86].
Table A4. Nutrient content in various types of manure and compost.
ComponentsN (%)P (%)K (%)References
Large livestock manure2.70.6240.6[87]
1.791.686.17[88]
0.920.330.66[1]
0.550.900.50[89]
Small livestock manure1.940.990.38[88]
1.820.591.11[90]
1.040.281.01[1]
Poultry manure4.521.682.12[88]
2.71.321.45[1]
1.652.401.7[89]
Compost3.30.922.1[91]
2.10.943.67[92]
0.720.160.29[93]
6.12.75.5[94]
2.362.37-[95]
0.220.0120.03[96]
Table A5. Nutrient loss through composting and bioavailability of nutrients by crops.
NutrientsNPKReferences
Loss of nutrients during composting (%)401020[48]
Nutrient bioavailability by agricultural plants (%)408090[48]
Figure A1. Optimization of locations for composting plants from livestock manure in Bangladesh: (a) large-scale composting plants, (b) medium-scale composting plants, and (c) small-scale composting plants.
Cleantechnol 07 00072 g0a1aCleantechnol 07 00072 g0a1b

References

  1. Brown, C. Available Nutrients and Value for Manure; The Ontario Ministry of Agriculture and Food and the Ministry of Rural Affairs: Toronto, ON, Canada, 2013. Available online: https://fieldcropnews.com/wp-content/uploads/2015/03/Nutrient-Value-of-Manure.pdf (accessed on 23 February 2025).
  2. Rayne, N.; Aula, L. Livestock Manure and the Impacts on Soil Health: A Review. Soil Syst. 2020, 4, 64. [Google Scholar] [CrossRef]
  3. Ellis, L.; Love, S.; Moore, A.; de Haro-Martí, M.E. Composting and Using Backyard Poultry Waste in the Home Garden. 2013. Available online: https://objects.lib.uidaho.edu/uiext/uiext31507.pdf (accessed on 6 March 2025).
  4. Mahal, Z.; Yabar, H.; Mizunoya, T. Spatial Assessment of Greenhouse Gas Emissions and Eutrophication Potential from Livestock Manure in Bangladesh. Sustainability 2024, 16, 5479. [Google Scholar] [CrossRef]
  5. Bayu, W.; Rethman, N.F.G.; Hammes, P.S. The Role of Animal Manure in Sustainable Soil Fertility Management in Sub-Saharan Africa: A Review. J. Sustain. Agric. 2005, 25, 113–136. [Google Scholar] [CrossRef]
  6. Sanford, G.R.; Cook, A.R.; Posner, J.L.; Hedtcke, J.L.; Hall, J.A.; Baldock, J.O. Linking Wisconsin Dairy and Grain Farms via Manure Transfer for Corn Production. Agron. J. 2009, 101, 167–174. [Google Scholar] [CrossRef]
  7. Lin, L.; Xu, F.; Ge, X.; Li, Y. Improving the sustainability of organic waste management practices in the food-energy-water nexus: A comparative review of anaerobic digestion and composting. Renew. Sustain. Energy Rev. 2018, 89, 151–167. [Google Scholar] [CrossRef]
  8. DLS. Livestock Economy at a Glance; Department of Livestock Services: Dhaka, Bangladesh, 2024. Available online: http://dls.portal.gov.bd/sites/default/files/files/dls.portal.gov.bd/page/ee5f4621_fa3a_40ac_8bd9_898fb8ee4700/2023-07-23-12-04-afbcccb96f8b27d4bab6501aa8c2c2ff.pdf (accessed on 21 March 2025).
  9. Adeoye, P.A.; Hasfalina, C.M.; Amin, M.S.M.; Thamer, A.M.; Akinbile, C.O. Environmental Implication of Poultry WasteGeneration and Management Techniques inMinna, Semi-arid Region of Nigeria. Annu. Res. Rev. Biol. 2014, 4, 1669–1681. [Google Scholar] [CrossRef]
  10. Cheng, H.; Ouyang, W.; Hao, F.; Ren, X.; Yang, S. The non-point source pollution in livestock-breeding areas of the Heihe River basin in Yellow River. Stoch. Environ. Res. Ris. Assess. 2007, 21, 213–221. [Google Scholar] [CrossRef]
  11. Yalcinkaya, S. A spatial modeling approach for siting, sizing and economic assessment of centralized biogas plants in organic waste management. J. Clean. Prod. 2020, 255, 120040. [Google Scholar] [CrossRef]
  12. Kumar, R. Site Suitability Analysis for Urban Development of a Hill Town Using GIS Based Multicriteria Evaluation Technique: A Case Study of Nahan Town, Himachal Pradesh, India. Int. J. Adv. Remote Sens. Gis 2014, 3, 516–524. [Google Scholar]
  13. ESRI. Types of Network Analysis Layers—ArcMap | Documentation. Available online: https://desktop.arcgis.com/en/arcmap/latest/extensions/network-analyst/types-of-network-analyses.htm (accessed on 12 September 2024).
  14. Ahn, H.K.; Mulbry, W.; White, J.W.; Kondrad, S.L. Pile mixing increases greenhouse gas emissions during composting of dairy manure. Bioresour. Technol. 2011, 102, 2904–2909. [Google Scholar] [CrossRef]
  15. Hao, X.; Chang, C.; Larney, F.J. Carbon, Nitrogen Balances and Greenhouse Gas Emission during Cattle Feedlot Manure Composting. J. Environ. Qual. 2004, 33, 37–44. [Google Scholar] [CrossRef]
  16. Nordahl, S.L.; Preble, C.V.; Kirchstetter, T.W.; Scown, C.D. Greenhouse Gas and Air Pollutant Emissions from Composting. Environ. Sci. Technol. 2023, 57, 2235–2247. [Google Scholar] [CrossRef]
  17. DAE. Department of Agricultural Extension-Government of the People’s Republic of Bangladesh. Available online: https://dae.gov.bd/ (accessed on 9 July 2024).
  18. DLS. Department of Livestock Services. Available online: https://dls.gov.bd/ (accessed on 24 April 2024).
  19. ArcGIS Online. Available online: https://www.google.com/search?client=firefox-b-d&q=arcgis+online (accessed on 13 November 2024).
  20. Berisa, G.; Birhanu, Y. Municipal Solid Waste Disposal Site Selection of Jigjiga Town Using GIS and Remote Sensing Techniques, Ethiopia. Int. J. Phy. Hum. Geogr. 2016, 4, 1–25. [Google Scholar]
  21. Chukwuma, E.; Chukwuma, G.; Orakwe, L. GIS Suitability Analysis for Anaerobic Treatment Facility for Slaughter Houses in Anambra State of Nigeria. ACRI 2016, 4, 1–10. [Google Scholar] [CrossRef]
  22. Ma, J.; Scott, N.R.; DeGloria, S.D.; Lembo, A.J. Siting analysis of farm-based centralized anaerobic digester systems for distributed generation using GIS. Biomass Bioenergy 2005, 28, 591–600. [Google Scholar] [CrossRef]
  23. Perpiña, C.; Martínez-Llario, J.C.; Pérez-Navarro, Á. Multicriteria assessment in GIS environments for siting biomass plants. Land. Use Policy 2013, 31, 326–335. [Google Scholar] [CrossRef]
  24. Silva, S.; Alçada-Almeida, L.; Dias, L.C. Multiobjective programming for sizing and locating biogas plants: A model and an application in a region of Portugal. Comput. Oper. Res. 2017, 83, 189–198. [Google Scholar] [CrossRef]
  25. Thompson, E.; Wang, Q.; Li, M. Anaerobic digester systems (ADS) for multiple dairy farms: A GIS analysis for optimal site selection. Energy Policy 2013, 61, 114–124. [Google Scholar] [CrossRef]
  26. Union of BC. Municipalities Landfill Guidelines. Available online: https://www.ubcm.ca/convention-resolutions/resolutions/resolutions-database/landfill-guidelines (accessed on 22 November 2024).
  27. Drobne, S.; Lisec, A. Multi-Attribute Decision Analysis in GIS: Weighted Linear Combination and Ordered Weighted Averaging. Available online: https://www.researchgate.net/publication/220166125_Multi-attribute_Decision_Analysis_in_GIS_Weighted_Linear_Combination_and_Ordered_Weighted_Averaging (accessed on 4 December 2024).
  28. Saaty, T.L. Decision making with the analytic hierarchy process. Int. J. Serv. Sci. 2008, 1, 83. [Google Scholar] [CrossRef]
  29. Mahal, Z.; Yabar, H. Spatial Optimization of Bioenergy Production by Introducing a Cooperative Manure Management System in Bangladesh. Resources 2025, 14, 111. [Google Scholar] [CrossRef]
  30. Rahman, M.M.; Paatero, J.V. A methodological approach for assessing potential of sustainable agricultural residues for electricity generation: South Asian perspective. Biomass Bioenergy 2012, 47, 153–163. [Google Scholar] [CrossRef]
  31. Mahal, Z.; Yabar, H. A Spatial Modeling Approach for Optimizing the Locations of Large-Scale Biogas Plants from Livestock Manure in Bangladesh. Land 2025, 14, 79. [Google Scholar] [CrossRef]
  32. Mahal, Z.; Yabar, H. Spatial Estimation of Biogas and Compost Potential for Sustainable Livestock Manure Management in Bangladesh. Appl. Sci. 2025, 15, 6753. [Google Scholar] [CrossRef]
  33. Abraham, A.; Mathew, A.K.; Sindhu, R.; Pandey, A.; Binod, P. Potential of rice straw for bio-refining: An overview. Bioresour. Technol. 2016, 215, 29–36. [Google Scholar] [CrossRef] [PubMed]
  34. Hiloidhari, M.; Baruah, D.C. Crop residue biomass for decentralized electrical power generation in rural areas (part 1): Investigation of spatial availability. Renew. Sustain. Energy Rev. 2011, 15, 1885–1892. [Google Scholar] [CrossRef]
  35. Singh, J. Identifying an economic power production system based on agricultural straw on regional basis in India. Renew. Sustain. Energy Rev. 2016, 60, 1140–1155. [Google Scholar] [CrossRef]
  36. Mary, A.K. Composting Animal Manures: A Guide to the Process and Management of Animal Manure Compost | NDSU Agriculture. Available online: https://www.ndsu.edu/agriculture/extension/publications/composting-animal-manures-guide-process-and-management-animal-manure-compost (accessed on 24 May 2024).
  37. Rynk, R.; van de Kamp, M.; Willson, G.B.; Singley, M.E.; Richard, T.L.; Kolega, J.J.; Gouin, F.R.; Laliberty, L.; Kay, D.; Murphy, D.; et al. On-Farm Composting Handbook (NRAES 54); Northeast Regional Agricultural Engineering Service (NRAES): Ithaca, NY, USA, 1992; Available online: https://hdl.handle.net/1813/67142 (accessed on 23 March 2025).
  38. Okopi, S.; Li, Y.; Xu, F. Biomass Digestion. In Encyclopedia of Sustainable Technologies; Elsevier: Amsterdam, The Netherlands, 2024; pp. 236–251. ISBN 978-0-443-22287-0. Available online: https://linkinghub.elsevier.com/retrieve/pii/B9780323903868000516 (accessed on 23 March 2025).
  39. Breitenbeck, G.A.; Schellinger, D. Calculating the Reduction in Material Mass And Volume during Composting. Compos. Sci. Util. 2004, 12, 365–371. [Google Scholar] [CrossRef]
  40. Palese, A.M.; Persiani, A.; D’Adamo, C.; Pergola, M.; Pastore, V.; Sileo, R.; Ippolito, G.; Lombardi, M.A.; Celano, G. Composting as Manure Disposal Strategy in Small/Medium-Size Livestock Farms: Some Demonstrations with Operative Indications. Sustainability 2020, 12, 3315. [Google Scholar] [CrossRef]
  41. Kalamdhad, A.S.; Singh, Y.K.; Ali, M.; Khwairakpam, M.; Kazmi, A.A. Rotary drum composting of vegetable waste and tree leaves. Bioresour. Technol. 2009, 100, 6442–6450. [Google Scholar] [CrossRef] [PubMed]
  42. Pandyaswargo, A.H.; Premakumara, D.G.J. Financial sustainability of modern composting: The economically optimal scale for municipal waste composting plant in developing Asia. Int. J. Recycl. Org. Waste Agric. 2014, 3, 4. [Google Scholar] [CrossRef]
  43. Miller, R.A. Calculating Capacity at Composting Sites. Available online: https://www.biocycle.net/calculating-capacity-at-composting-sites/ (accessed on 27 November 2024).
  44. The Organics Recycling Authority Calculating a Composting Facility Footprint. Available online: https://www.biocycle.net/calculating-a-composting-facility-footprint/ (accessed on 27 November 2024).
  45. Schnorf, V.; Trutnevyte, E.; Bowman, G.; Burg, V. Biomass transport for energy: Cost, energy and CO2 performance of forest wood and manure transport chains in Switzerland. J. Clean. Prod. 2021, 293, 125971. [Google Scholar] [CrossRef]
  46. Ashik-Ur-Rahman, M.; Waheduzzaman, M.; Waresul Hassan Nipun, M. Optimized municipal solid waste transportation with landfill requirement in a coastal city of Bangladesh. Environ. Qual. Manag. 2022, 31, 197–210. [Google Scholar] [CrossRef]
  47. Hasan, S. Problems of municipal waste management in Bangladesh: An inquiry into its nature. Habitat. Int. 1998, 22, 191–202. [Google Scholar] [CrossRef]
  48. Ikumo, H. Estimation of Potential Supply of Livestock Waste Compost to Replace Chemical Fertilizer Use in Japan Based on 2000 Census of Agriculture. Jpn. Agric. Res. Q. JARQ 2005, 39, 83–89. [Google Scholar] [CrossRef]
  49. Andersen, J.K.; Boldrin, A.; Christensen, T.H.; Scheutz, C. Greenhouse gas emissions from home composting of organic household waste. Waste Manag. 2010, 30, 2475–2482. [Google Scholar] [CrossRef]
  50. Clemens, J.; Cuhls, C. Greenhouse gas emissions from mechanical and biological waste treatment of municipal waste. Environ. Technol. 2003, 24, 745–754. [Google Scholar] [CrossRef] [PubMed]
  51. Hellebrand, H.J. Emission of Nitrous Oxide and other Trace Gases during Composting of Grass and Green Waste. J. Agric. Eng. Res. 1998, 69, 365–375. [Google Scholar] [CrossRef]
  52. Friedrich, E.; Trois, C. GHG emission factors developed for the recycling and composting of municipal waste in South African municipalities. Waste Manag. 2013, 33, 2520–2531. [Google Scholar] [CrossRef]
  53. Phong, N.T. Greenhouse Gas Emissions from Composting and Anaerobic Digestion Plants. Ph.D. Thesis, Universität Bonn, Bonn, Germany, 2012. [Google Scholar]
  54. Luske, B. Reduced GHG Emissions due to Compost Production and Compost Use in Egypt Comparing Two Scenarios; Louis Bolk Instituu: Bunnik, The Netherlands, 2010; Available online: https://orgprints.org/id/eprint/17480/4/17480.pdf (accessed on 6 April 2025).
  55. White, P.; Dranke, M.; Hindle, P. Integrated Solid Waste Management: A Lifecycle Inventory; Springer Science & Business Media: Berlin, Germany, 2012; ISBN 978-1-4684-6705-5. [Google Scholar]
  56. Skowrońska, M.; Filipek, T. Life cycle assessment of fertilizers: A review. Int. Agrophysics 2014, 28, 101–110. [Google Scholar] [CrossRef]
  57. Albaugh, T.J.; Vance, E.D.; Gaudreault, C.; Fox, T.R.; Allen, H.L.; Stape, J.L.; Rubilar, R.A. Carbon Emissions and Sequestration from Fertilization of Pine in the Southeastern United States. For. Sci. 2012, 58, 419–429. [Google Scholar] [CrossRef]
  58. Brentrup, F.; Hoxha, A.; Christensen, B. Carbon Footprint Analysis of Mineral Fertilizer Production in Europe and Other World Regions; University College Dublin (UCD): Dublin, Ireland, 2016; Available online: https://www.researchgate.net/publication/312553933_Carbon_footprint_analysis_of_mineral_fertilizer_production_in_Europe_and_other_world_regions#fullTextFileContent (accessed on 21 April 2025).
  59. Davis, J.; Haglund, C. Life Cycle Inventory (LCI) of Fertiliser Production: Fertiliser Products Used in Sweden and Western Europe; SIK Institutet för livsmedel och bioteknik: Göteborg, Sweden, 1999; Available online: https://toc.library.ethz.ch/objects/pdf03/e16_91-7290-196-9_01.pdf (accessed on 25 April 2025).
  60. Williams, A.G.; Audsley, E.; Sandars, D.L. Environmental burdens of producing bread wheat, oilseed rape and potatoes in England and Wales using simulation and system modelling. Int. J. Life Cycle Assess. 2010, 15, 855–868. [Google Scholar] [CrossRef]
  61. Chen, W.; Geng, Y.; Hong, J.; Yang, D.; Ma, X. Life cycle assessment of potash fertilizer production in China. Resour. Conserv. Recycl. 2018, 138, 238–245. [Google Scholar] [CrossRef]
  62. Dunkerley, D. Effects of rainfall intensity fluctuations on infiltration and runoff: Rainfall simulation on dryland soils, Fowlers Gap, Australia. Hydrol. Process. 2012, 26, 2211–2224. [Google Scholar] [CrossRef]
  63. Jin, Z.; Guo, L.; Yu, Y.; Luo, D.; Fan, B.; Chu, G. Storm runoff generation in headwater catchments on the Chinese Loess Plateau after long-term vegetation rehabilitation. Sci. Total Environ. 2020, 748, 141375. [Google Scholar] [CrossRef]
  64. Zhong, S.; Tian, X.; Geng, Y.; Santagata, R.; Zhuang, M.; Chen, W.; Yang, S.; Ulgiati, S. Sustainability assessment in the anthropocentric watershed based on emergy and decomposition methods: A case study of Erhai Lake Basin, southwest China. Ecol. Indic. 2022, 139, 108932. [Google Scholar] [CrossRef]
  65. Du, Y.; Li, T.; He, B. Runoff-related nutrient loss affected by fertilization and cultivation in sloping croplands: An 11-year observation under natural rainfall. Agric. Ecosyst. Environ. 2021, 319, 107549. [Google Scholar] [CrossRef]
  66. Dybowski, D.; Dzierzbicka-Glowacka, L.A.; Pietrzak, S.; Juszkowska, D.; Puszkarczuk, T. Estimation of nitrogen leaching load from agricultural fields in the Puck Commune with an interactive calculator. PeerJ 2020, 8, e8899. [Google Scholar] [CrossRef] [PubMed]
  67. Singh, S.R.; Kundu, D.K.; Dey, P.; Singh, P.; Mahapatra, B.S. Effect of balanced fertilizers on soil quality and lentil yield in Gangetic alluvial soils of India. J. Agric. Sci. 2018, 156, 225–240. [Google Scholar] [CrossRef]
  68. Yli-Halla, M.; Lötjönen, T.; Kekkonen, J.; Virtanen, S.; Marttila, H.; Liimatainen, M.; Saari, M.; Mikkola, J.; Suomela, R.; Joki-Tokola, E. Thickness of peat influences the leaching of substances and greenhouse gas emissions from a cultivated organic soil. Sci. Total Environ. 2022, 806, 150499. [Google Scholar] [CrossRef]
  69. Kløve, B.; Sveistrup, T.E.; Hauge, A. Leaching of nutrients and emission of greenhouse gases from peatland cultivation at Bodin, Northern Norway. Geoderma 2010, 154, 219–232. [Google Scholar] [CrossRef]
  70. Sun, C.; Zhou, H.; Chen, L.; Shen, Z. The pollution risk assessment of nitrogen and phosphorus loss in surface runoff from farmland fertilizer. J. Agro-Environ. Sci. 2017, 36, 1266–1273. [Google Scholar] [CrossRef]
  71. Pham, T.; Yli-Halla, M.; Marttila, H.; Lötjönen, T.; Liimatainen, M.; Kekkonen, J.; Läpikivi, M.; Klöve, B.; Joki-Tokola, E. Leaching of nitrogen, phosphorus and other solutes from a controlled drainage cultivated peatland in Ruukki, Finland. Sci. Total Environ. 2023, 904, 166769. [Google Scholar] [CrossRef] [PubMed]
  72. Sieczko, A.K.; Van De Vlasakker, P.C.H.; Tonderski, K.; Metson, G.S. Seasonal nitrogen and phosphorus leaching in urban agriculture: Dominance of non-growing season losses in a Southern Swedish case study. Urban. For. Urban. Green. 2023, 79, 127823. [Google Scholar] [CrossRef]
  73. Portela, S.I.; Reixachs, C.; Torti, M.J.; Beribe, M.J.; Giannini, A.P. Contrasting effects of soil type and use of cover crops on nitrogen and phosphorus leaching in agricultural systems of the Argentinean Pampas. Agric. Ecosyst. Environ. 2024, 364, 108897. [Google Scholar] [CrossRef]
  74. Norberg, L.; Linefur, H.; Andersson, S.; Blomberg, M.; Kyllmar, K. Nutrient losses over time via surface runoff and subsurface drainage from an agricultural field in northern Sweden. J. Environ. Qual. 2022, 51, 1235–1245. [Google Scholar] [CrossRef]
  75. Fu, J.; Wu, Y.; Wang, Q.; Hu, K.; Wang, S.; Zhou, M.; Hayashi, K.; Wang, H.; Zhan, X.; Jian, Y.; et al. Importance of subsurface fluxes of water, nitrogen and phosphorus from rice paddy fields relative to surface runoff. Agric. Water Manag. 2019, 213, 627–635. [Google Scholar] [CrossRef]
  76. Google Earth Pro Earth Versions. Google Earth. 2025. Available online: https://www.google.com/earth/about/versions/ (accessed on 16 January 2025).
  77. Venier, F.; Yabar, H. Renewable energy recovery potential towards sustainable cattle manure management in Buenos Aires Province: Site selection based on GIS spatial analysis and statistics. J. Clean. Prod. 2017, 162, 1317–1333. [Google Scholar] [CrossRef]
  78. Sharma, B.; Birrell, S.; Miguez, F.E. Spatial modeling framework for bioethanol plant siting and biofuel production potential in the U.S. Appl. Energy 2017, 191, 75–86. [Google Scholar] [CrossRef]
  79. Khan, M.T.; Aleinikovienė, J.; Butkevičienė, L.-M. Innovative Organic Fertilizers and Cover Crops: Perspectives for Sustainable Agriculture in the Era of Climate Change and Organic Agriculture. Agronomy 2024, 14, 2871. [Google Scholar] [CrossRef]
  80. Manea, E.E.; Bumbac, C.; Dinu, L.R.; Bumbac, M.; Nicolescu, C.M. Composting as a Sustainable Solution for Organic Solid Waste Management: Current Practices and Potential Improvements. Sustainability 2024, 16, 6329. [Google Scholar] [CrossRef]
  81. Zurbrügg, C.; Drescher, S.; Rytz, I.; Sinha, A.M.; Enayetullah, I. Decentralised composting in Bangladesh, a win-win situation for all stakeholders. Resour. Conserv. Recycl. 2005, 43, 281–292. [Google Scholar] [CrossRef]
  82. FAO. Faostat. Available online: https://www.fao.org/faostat/en/#data/EK (accessed on 23 April 2024).
  83. Economic Review. Finance Division, Ministry of Finance. Available online: https://mof.portal.gov.bd/site/page/28ba57f5-59ff-4426-970a-bf014242179e/Bangladesh-Economic-Review (accessed on 2 May 2024).
  84. Siedt, M.; Schäffer, A.; Smith, K.E.C.; Nabel, M.; Roß-Nickoll, M.; Van Dongen, J.T. Comparing straw, compost, and biochar regarding their suitability as agricultural soil amendments to affect soil structure, nutrient leaching, microbial communities, and the fate of pesticides. Sci. Total Environ. 2021, 751, 141607. [Google Scholar] [CrossRef]
  85. Goldan, E.; Nedeff, V.; Barsan, N.; Culea, M.; Panainte-Lehadus, M.; Mosnegutu, E.; Tomozei, C.; Chitimus, D.; Irimia, O. Assessment of Manure Compost Used as Soil Amendment—A Review. Processes 2023, 11, 1167. [Google Scholar] [CrossRef]
  86. Saaty, T.L. How to make a decision: The analytic hierarchy process. Eur. J. Oper. Res. 1990, 48, 9–26. [Google Scholar] [CrossRef]
  87. Cestonaro, T.; Costa, M.S.S.D.M.; Costa, L.A.D.M.; Pereira, D.C.; Rozatti, M.A.T.; Martins, M.F.L. Addition of cattle manure to sheep bedding allows vermicomposting process and improves vermicompost quality. Waste Manag. 2017, 61, 165–170. [Google Scholar] [CrossRef]
  88. Hossain, M.Z.; Bahar, M.M.; Sarkar, B.; Donne, S.W.; Wade, P.; Bolan, N. Assessment of the fertilizer potential of biochars produced from slow pyrolysis of biosolid and animal manures. J. Anal. Appl. Pyrolysis 2021, 155, 105043. [Google Scholar] [CrossRef]
  89. Dale, F.; Leikam, R.E. Lamond Estimating Manure Nutrient Availability; Kansas State University, Department of Agronomy: Manhattan, KS, USA, 2003; Report No.: MF-2562; Available online: https://bookstore.ksre.ksu.edu/download/estimating-manure-nutrient-availability_MF2562 (accessed on 25 April 2025).
  90. Raza, S.T.; Tang, J.L.; Ali, Z.; Yao, Z.; Bah, H.; Iqbal, H.; Ren, X. Ammonia Volatilization and Greenhouse Gases Emissions during Vermicomposting with Animal Manures and Biochar to Enhance Sustainability. Int. J. Environ. Res. Public Health 2020, 18, 178. [Google Scholar] [CrossRef]
  91. Costa, M.S.S.D.M.; Bernardi, F.H.; Costa, L.A.D.M.; Pereira, D.C.; Lorin, H.E.F.; Rozatti, M.A.T.; Carneiro, L.J. Composting as a cleaner strategy to broiler agro-industrial wastes: Selecting carbon source to optimize the process and improve the quality of the final compost. J. Clean. Prod. 2017, 142, 2084–2092. [Google Scholar] [CrossRef]
  92. Cao, Y.; Chang, Z.; Wang, J.; Ma, Y.; Yang, H.; Fu, G. Potential use of anaerobically digested manure slurry to suppress Phytophthora root rot of chilli pepper. Sci. Hortic. 2014, 168, 124–131. [Google Scholar] [CrossRef]
  93. Slepetiene, A.; Volungevicius, J.; Jurgutis, L.; Liaudanskiene, I.; Amaleviciute-Volunge, K.; Slepetys, J.; Ceseviciene, J. The potential of digestate as a biofertilizer in eroded soils of Lithuania. Waste Manag. 2020, 102, 441–451. [Google Scholar] [CrossRef] [PubMed]
  94. Mayerová, M.; Šimon, T.; Stehlík, M.; Madaras, M.; Koubová, M.; Smatanová, M. Long-term application of biogas digestate improves soil physical properties. Soil. Tillage Res. 2023, 231, 105715. [Google Scholar] [CrossRef]
  95. Alfa, M.I.; Adie, D.B.; Igboro, S.B.; Oranusi, U.S.; Dahunsi, S.O.; Akali, D.M. Assessment of biofertilizer quality and health implications of anaerobic digestion effluent of cow dung and chicken droppings. Renew. Energy 2014, 63, 681–686. [Google Scholar] [CrossRef]
  96. Ezemagu, I.G.; Ejimofor, M.I.; Menkiti, M.C.; Diyoke, C. Biofertilizer production via composting of digestate obtained from anaerobic digestion of post biocoagulation sludge blended with saw dust: Physiochemical characterization and kinetic study. Environ. Chall. 2021, 5, 100288. [Google Scholar] [CrossRef]
Figure 1. Study approach and methodological framework.
Cleantechnol 07 00072 g001
Figure 2. A part of restriction modeling (road network) for land suitability analysis.
Cleantechnol 07 00072 g002
Figure 3. Suitability modeling for suitability mapping.
Cleantechnol 07 00072 g003
Figure 4. Spatial distribution: (a) livestock manure intensity (tons/sq.km/year), (b) rice straw intensity (tons/sq.km/year), (c) synthetic fertilizer use intensity (tons/sq.km/year).
Cleantechnol 07 00072 g004
Figure 5. Compost production potential with the primary selected upazilas of different scenarios.
Cleantechnol 07 00072 g005
Figure 6. Restriction maps for various restriction features: (a) transport network; (b) surface water; (c) protected area; (d) vulnerable area; (e) important places; and (f) residential area.
Cleantechnol 07 00072 g006
Figure 7. Suitability maps for various suitability features: (a) livestock manure availability; (b) rice straw availability; (c) road network distance; (d) synthetic fertilizer demand; (e) flood-prone area; and (f) elevation.
Cleantechnol 07 00072 g007
Figure 8. Combined restriction and suitability maps used for land suitability analysis: (a) combined restriction map; (b) combined suitability map.
Cleantechnol 07 00072 g008
Figure 9. Final suitability map for optimizing composting plant development.
Cleantechnol 07 00072 g009
Figure 10. Primarily selected upazilas with suitable parcels for composting plants from livestock manure in Bangladesh.
Cleantechnol 07 00072 g010
Figure 11. Chosen locations for composting plants in different scenarios using Google Earth Pro software (Version: 7.3.6) [76].
Cleantechnol 07 00072 g011
Figure 12. Environmental impacts across different scenarios of composting plants: (a) GHG emissions reduction potential (in gigagrams CO2eq/year); (b) manure nutrients leaching reduction potential (in kilotons/year).
Cleantechnol 07 00072 g012
Table 1. The buffer areas are considered for different restriction features.
Criteria FeaturesComments* Buffer Area* Referred Ranges [20,21,22,23,24,25,26]
Transport Network Road networkIt can expand the transport network in the future.200 m30–300 m
Railway network500 m
Surface Water River Restricted by existing laws and rules.500 m100–500 m
Water reservoir300 m
Protected Area National parkRestricted by existing laws and rules.200 m100–500 m
Forest area500 m
Residential Area Districts and sub-districtsCloseness to residential areas may create social disturbances and a nuisance.2 km200 m–1 km
Unions and Villages 1 km
Important Places Airports and helipadsRestricted by existing laws and rules.1 km300–500 m
Other developed places500 m
Vulnerable Area River erosion areaIt has a risk of developing in naturally vulnerable areas.500 m100–500 m
Wetlands300 m
* (m = meter and km = kilometer).
Table 2. Reclassification criteria with their weights for suitability analysis.
CriteriaFeaturesCommentsHighly SuitableModerately SuitableLow SuitabilityNot
Suitable
Weighted Preferences
Resource AvailabilityLivestock Manure AvailabilityThe higher intensity has higher suitability (tons/sq.km)>1000700–1000400–7000–40039.5%
Rice Straw AvailabilityThe higher intensity has higher suitability (tons/sq.km)>300200–300100–2000–10021.3%
EconomyDistance to Road NetworkThe nearer road network has higher suitability.0-500 m1 km2 km>2 km14.7%
Demand for Synthetic FertilizerMore uses of fertilizer have higher suitability. (tons/sq.km/year)>10050–10020–500–2011.8%
GeographyFlood Prone AreaThe greater the chance of flood occurrence in the areas, the lower the suitability. No floodingLow floodingModerate floodingSevere flooding8.2%
ElevationThe very high and very low elevations both have lower suitability.8–50 m4–7 m51–79 m0–3 m
80–940 m
4.6%
Table 3. Worksheet for compost production based on the C/N ratio.
Manure TypesC/N Ratio in ManureC/N Ratio in CompostCo-digestion Ratio of Manure: Straw% of Manure% of Rice StrawTotal Available Manure (Tons/Day)Compost Production (Tons/Day)Compost after 50% Mass Reduction
(Tons/Day)
Large Livestock 18:1-~4:180.6419.35248,975.75308,730.55154,365.27
Small Livestock16:130:1~4:178.1221.87297.15380.33190.16
Poultry08:1-~2:169.4430.5615,213.6223,142.4811,571.45
Table 4. GHG emissions from composting and synthetic fertilizer production in the literature.
Waste Types for Compost GenerationEmission Factor (kgCO2eq/kg Compost)References
Municipal waste0.172–0.186[52]
Biowaste0.18[53]
Household waste0.239[49]
Dairy manure0.145–0.173[14]
Municipal waste0.413[50]
Cattle manure0.423[15]
Organic waste0.164[54]
Grass and green waste0.381[51]
Livestock manure0.229[16]
Solid waste0.323[55]
Types of fertilizerCountry/RegionEmission factor (kg CO2eq/kg of fertilizer)References
UreaEurope1.6[56]
USA3.1[57]
Europe/Russia, USA1.9/2.7[58]
Sweden and Europe4[59]
United Kingdom3.5[60]
Ammonium phosphateSweden and Europe1.3–1.8[59]
Europe/Russia, USA1.4/1.7[58]
Single superphosphateSweden1[59]
United Kingdom0.6[60]
Triple superphosphateEurope, Russia, USA0.4–0.54[58]
Sweden1[59]
United Kingdom1.2[60]
Potassium chlorideChina0.14–0.25[61]
Table 5. Leaching factors for nutrients from agricultural land.
TN
(kg/ha)
TP
(kg/ha)
CountrySoil TypeCropsOthersReference
9.30.29FinlandPeat soilCereals, barleySubsurface drainage[68]
21.70.30NorwayMineral soilPerennial grassSubsurface drainage[69]
2.410.64China-CerealsRunoff[70]
250.30FinlandPeat soilGrassSubsurface drainage[71]
39–1910.9–2.4SwedenGarden plantsSurface runoff[72]
3.3–30.40.11–0.32ArgentinaNo-tillageCover cropsRainfall[73]
4.30.04SwedenSilty loamBarley, grassSubsurface[74]
28.5–40.00.7–4.3East Asia-Rice, PaddySubsurface[75]
4.5–12.9 0.5–2.6East Asia-Rice, PaddySurface runoff[75]
Note: TN = total nitrogen; TP = total phosphorus.
Table 6. The outcomes from different scenarios of composting plants.
ItemsScenario-C1Scenario-C2Scenario-C3Total
Manure typesLarge scaleMedium scale Small scale-
Primarily selected upazilas53138222413
Number of composting plants1542147204
Total capacity of plants, kilotons/day1.52.11.174.78
Total compost production, kilotons/year496.04694.46347.231537.73
Total N supply as Urea, kilotons/year4.115.752.8812.74
Total P supply as P2O5, kilotons/year6.789.494.7521.02
Total K supply as K2O, kilotons/year9.8813.836.9130.61
Total nutrient supply, kilotons/year
(synthetic fertilizer replacement, %)
20.77
(1.66)
29.07
(1.32)
14.54
(1.02)
64.38
(3.996)
The required amount of manure, kilotons/year872.511221.52610.762704.81
Disposed amount of manure, kilotons/year1454.192035.871017.944507.99
Disclaimer/Publisher’s Note: The statements, opinions and data contained in all publications are solely those of the individual author(s) and contributor(s) and not of MDPI and/or the editor(s). MDPI and/or the editor(s) disclaim responsibility for any injury to people or property resulting from any ideas, methods, instructions or products referred to in the content.