Abstract
Most types of packaging that are in contact with food are made of polypropylene (PP), and the environmental impacts of their production and use are still high. Currently, incorporating recycled PP in the food industry is not a viable solution for reducing environmental impacts due to its complexity and high costs. For this reason, understanding how to reduce the environmental impacts derived from the production process of plastic food packaging is essential. This study aims to analyze the environmental performance of the production of single-use PP food-contact packaging using the Life Cycle Assessment approach in order to estimate the effectiveness of proposed solutions to mitigate its impacts. Furthermore, the economic savings from the avoided CO2 emissions were estimated. To achieve these goals, three diverse scenarios with different energy source mixes were studied. The analysis was carried out using SimaPro v9.5 software, the Ecoinvent v3.8 database, and a ReCiPe 2016 impact assessment. The findings show that upstream processes are the main contributors to the environmental profile, with 67% of the total impact, followed by core processes, with 32% of the total impacts. An increase in the use of renewable energy can lead to environmental benefits, with an impact reduction ranging from 13% to 61% depending on the energy source mix. Furthermore, up to EUR 12,458 per 100 tons of units produced was saved due to the lack of CO2 emissions. The results of this research will be useful to encourage the use of renewable energy in the processes of PP packaging production as an alternative when polymer replacement is difficult.
1. Introduction
The production of plastic, a versatile, light, low-priced, and durable material used in diverse, transversal, and dynamic applications, has impacted and continues to affect the lifestyle of humans [1,2,3]. The global production of plastic reached around 400 million tons in 2022, of which 90% were thermoplastics [4]. This production generates a lot of plastic waste, which causes ecological, social, and economic harm [5,6,7,8,9]. China is the main distributor of plastic in the world (29%), followed by the countries of the North American Free Trade Agreement (NAFTA) (19%), Europe (18%), and the rest of Asia (17%) [10]. Due to its many properties and extensive applications, plastic plays a crucial role in disparate fields, from construction to transportation, as well as is used for packaging and medical tools [11,12,13,14].
In particular, plastic has played a fundamental role in packaging, especially in protecting and preserving food from degradation and contamination by biological, physical, and chemical factors [15,16]. Traditional plastic food packaging is made from petroleum-based polymers, usually polyolefins and polyesters [17,18]. This is mainly due to their versatility, lightness, and low price [1,2]. The main types of plastic used for food packaging are polyvinylchloride (PVC), polyethylene terephthalate (PET), polypropylene (PP), polyethylene (PE), polyamide (PA), polystyrene (PS), polylactic acid (PLA), and ethylene vinyl alcohol (EVOH) [19].
In particular, PP has high strength, flexibility, stability, and lightness [20]; low density; and high thermal stability and tolerance for continuous use at high temperatures, factors which are very useful for food-contact applications. Due to the fact that its melting point is at a high temperature (160 °C), PP is applied, for example, in hot-fill packaging [21]. This polymer can also be easily adapted to several uses, adopting different shapes, structures, and degrees of stiffness [22]. A thermoforming process or an injection-molding process can be used following the synthesis of PP. In both cases, the processes allow producers to obtain the shape needed to produce rigid packaging containers suitable for transporting and storing various products [23].
However, the environmental impacts derived from producing and disposing of PP packaging are well known [24]. In particular, the production of PP generates considerable environmental impacts due to greenhouse gas emissions, high consumption of non-renewable resources, air and water pollution, and problems related to the material’s end of life [25,26,27]. In this regard, European legislation only permits the use of recycled plastic in food packaging when its production is authorized and regulated by the European Food Safety Authority (EFSA) to ensure the absence of harmful contaminants [28]. PET is the most widely used recycled plastic material, while PP is only used in limited cases, as its safe recycling is more complex and expensive. For this reason, PP production should be followed by other mitigation strategies [29]. However, it is still necessary to find a strategy to mitigate the environmental impacts of PP packaging.
With this in mind, the objective of this study was to analyze the environmental performance of single-use PP food-contact packaging production and propose a solution to mitigate the impacts of the production process. The analysis was carried out using the Life Cycle Assessment (LCA) approach. LCA analysis is a standardized methodology that allows studies (i) to estimate the environmental impacts of a product or process, (ii) to find the main causes of its impacts, and (iii) to understand which mitigation solution is better [30,31,32,33].
In the literature, several studies have used LCA analysis to evaluate the environmental sustainability of food-contact packaging. Although these studies provide valuable insight, they often present conflicting results depending on the scope, methodology, and materials considered. For instance, Maga et al. [34] found that polystyrene (PS) trays had a lower environmental impact than polypropylene (PP) trays for meat packaging, a finding in contrast with the study of Vigil et al. [35], who showed that innovative PP packaging with ZnO nanoparticles, used for fruits and vegetables, outperformed traditional methods. Again, David et al. [36] suggest that PP is more environmentally friendly than bioplastics such as PHBV and PLA when agricultural residues are used as a filler in tray packaging. In contrast, Snyder and Park [37] found that single-use PP containers had the highest environmental impact compared to reusable and compostable PP options, highlighting the importance of end-of-life scenarios and reusability in determining overall environmental performance. These studies collectively indicate that the environmental sustainability of food-contact packaging is highly dependent on various factors, including the material type, specific application, end-of-life treatment, and methodological choices within the LCA. These studies have focused on the environmental benefits derived from replacing raw materials with biobased or more sustainable polymers. However, there is a lack of research that has evaluated how to reduce impacts by intervening during the production phase.
This is the first study that aims to evaluate the environmental benefits due to mitigation solutions to the production process of food-contact packaging that differs from the replacement of polymers. The results of this study will be useful to stimulate the use of renewable energy in the processes for PP packaging production as an alternative when polymer replacement remains difficult.
2. Materials and Methods
This study was carried out using the LCA methodology, a standardized approach designed to evaluate the environmental impacts of the proposed product system [38]. This method provides a comprehensive, system-wide perspective on production processes by objectively assessing and quantifying energy and environmental burdens, as well as the potential impacts associated with a product, process, or activity throughout its entire life cycle [39]. This study follows the guidelines outlined in the international ISO 14040:2006 and 14044:2006 standards [40,41].
For data processing and model development, the LCA study was carried out using SimaPro 9.5 software [42], developed by Pré Consultants, and Ecoinvent 3.5 [43], which provided a reliable database for environmental impact assessment. In the impact assessment phase, the overall environmental effects were analyzed using the ReCiPe 2016 method [44].
The ReCiPe 2016 Method (Hierarchical version, H) stands for “ReCiPe 2016: A Harmonized Life Cycle Impact Assessment Method at Midpoint and Endpoint Level—Hierarchical Perspective”. The environmental impacts are reported in Points (Pt), a measurement unit representative of one-thousandth of the yearly environmental load of the average European inhabitant [45]. ReCiPe 2016 is a widely used Life Cycle Iimpact Assessment (LCIA) methodology that translates emissions and resource extractions into potential environmental impacts. The Hierarchical (H) version represents a consensus-based perspective, balancing short- and long-term effects by applying assumptions commonly agreed upon by the scientific community regarding environmental mechanisms and time horizons. This approach provides a structured way to assess environmental damage across various impact categories, including human health, ecosystems, and resource availability, which was considered suitable for the system.
2.1. Goal and Scope Definition
Cheese tray 135 In-Mold Labeling (PP-PC) is a food-contact packaging designed explicitly for cheese and refers to a commercially available product. The product is entirely composed of PP, and it is crafted using the injection process. Its net weight and brim-full capacity are 14.1 g and 375 cm3, respectively. Details about the design and dimensions are reported in Figure 1.
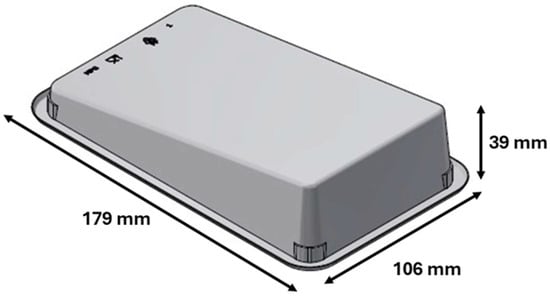
Figure 1.
Cheese tray 135 In-Mold Labeling (PP-PC).
The goal of the analysis is to estimate the environmental impacts of the PP-PC in order to propose alternative solutions for mitigating the impacts. This study wants to answer the following questions:
- What is the most impactful phase for PP-PC production?
- What possible solutions can be proposed to enhance the environmental performance of the product?
- What are the economic savings resulting from the introduction of mitigation actions?
The Functional Unit (FU) is defined as the production of 1 unit of PP-PC corresponding to 14.1 g. According to the Product Category Rules (PCR) 2010:16 Plastics in primary forms v3.0.2 [46], the System Boundaries (SBs) are cradle-to-gate, and they include three different life cycle steps: (i) upstream processes, (ii) core processes, and (iii) downstream processes (Figure 2).
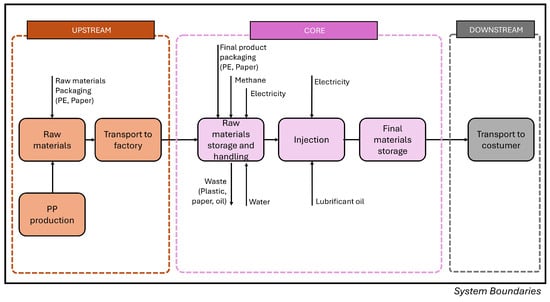
Figure 2.
System Boundaries (SBs) for the LCA.
2.2. Life Cycle Inventory (LCI) Analysis
Primary data were provided by a company which produces food-contact packaging, and the time boundaries refer to 2022. The details regarding materials, processes, quantities, and the database used are presented in Table 1. The inventory was organized in terms of upstream, core, and downstream processes.

Table 1.
Input (I) and output (O) data were used in the Life Cycle Inventory analysis, along with their description and the dataset used from the Ecoinvent database [43]. FU: 1 unit of Cheese tray 135 In-Mold Labeling (PP-PC). Geographical representativeness of Ecoinvent database: RER: Europe, IT: Italy.
2.2.1. Upstream Processes
This phase considers the production of raw materials, the manufacturing of packaging for raw materials and the final product, and the transportation of materials to the factory. All environmental impacts associated with the use of electricity and fuel during these phases are also considered. Background processes for the upstream phase have been sourced from all materials associated with the products, using the Ecoinvent v3.8 database. Based on the data provided by the factory, the raw materials and packaging are sourced from Europe and transported in lorries with a capacity exceeding 7.5 metric tons. The details of the distance assumed for each material are provided in Table S1.
2.2.2. Core Processes
This phase encompasses all production processes within the factory, including manufacturing, injection molding, and auxiliary services such as aeration and illumination. It also involves the treatment of waste generated within the facility and the use of electricity, water, and methane in these stages. The wastewater treatment is not included within the SB, given that the emission values are below the regulatory limits.
2.2.3. Downstream Processes
The downstream phase considers the transportation of the PP-PC, including final packaging, from the facility to a customer. Transportation is carried out in Italy using trucks with a capacity ranging from 7.5 to 16 metric tons.
2.3. Mitigation Scenarios
The control scenario (CTRL) represents the current situation and assumes the same energy mix reported by the Ecoinvent database for Italy. Alternative scenarios were also defined to understand how technological solutions could enhance the environmental performance of the investigated system. Specifically, an analysis of the core phase was carried out, introducing a different energy mix based on a higher share of renewable energy sources. In particular, the alternative scenario 1 (AS1) includes energy from photovoltaic panels, while alternative scenario 2 (AS2) and alternative scenario 3 (AS3) consider the use of green energy in different mixes.
2.3.1. Alternative Scenario 1 (AS1)
In this scenario, the electrical energy used in the core phase was substituted at varying percentages: 25% (AS1a), 50% (AS1b), and 75% (AS1c). These different percentages are considered to simulate and extremize different hypothetical substitution ranges of fossil sources with alternative ones in order to see the impact on the environmental pressure of the product. In this case, energy is ideally sourced from solar multi-Si panels installed on the company’s roof or other dedicated areas. In this case, data are retrieved from the Ecoinvent database [43], described explicitly as “Electricity, low voltage {IT}| electricity production, photovoltaic, 3kWp slanted-roof installation, multi-Si, panel, mounted | Cut-off, S”. This dataset represents the production of grid-connected low voltage electricity with a 3 kWp building-integrated photovoltaic module in Italy.
2.3.2. Alternative Scenarios 2 and 3 (AS2 and AS3)
These scenarios incorporate renewable sources in the core phase of electricity. Two different energy mixes were assessed: AS2 involves energy from geothermal, hydro, and wind power sources, while AS3 incorporates biogas and biomass in addition to the sources of AS2. These scenarios consider the renewable sources currently available in Italy. In particular, the non-renewable part has been replaced by renewable energy, increasing the initial percentages between the different sources. Details about the source of electricity for CTRL, AS1a, AS1b, AS1c, AS2 and AS3 are reported in Table 2.
Table 2.
Energy source of control and mitigation scenarios. All data are reported in percentages. According to the Ecoinvent database, CTRL energy origin refers to the Italian mix in 2020. Abbreviations: control scenario: CTRL; alternative scenario 1: AS1; alternative scenario 2: AS2; alternative scenario 3: AS3.
2.4. Economic Savings Due to the Lack of CO2 Emissions
To better quantify the impacts of the mitigation solutions in the diverse scenarios, the economic savings (ES) due to the lack of CO2 emissions into the atmosphere of a total production of 100 tons of PP-PC (around 7,150,000 pieces) were calculated according to Equation (1):
with GWPri as the CO2 reduction per ton of PP-PC in the i-th alternative scenarios with respect to the CTRL one, and Vi as the economic price related to the amount of CO2 emitted in the atmosphere. In this case, two different values have been used according to different j-th sources in the literature, i.e., EUR 48 per ton of CO2 [47] (also called V1) and EUR 176 per ton of CO2 [48] (also called V2).
ESi,j = 100 tons of PP-PC × GWPri × Vi,j,
3. Results
3.1. What Is the Most Impactful Phase for PP-PC Production?
The environmental profile of 1 unit of PP-PC is shown in Figure 3a. The effects on human health represent the highest contribution (1.29 mPt, 90.7% of the total), followed by impacts on resources (0.08 mPt, 6%) and ecosystems (0.05 mPt, 4%). The upstream stage is the most impactful (Figure 3b), accounting for 0.96 mPt and constituting 67% of the total. This is followed by the core, with 0.46 mPt (32%), and the downstream, with 0.003 mPt (<1%). On the one hand, a deeper examination of the upstream contribution reveals that PP production is responsible for the highest impact, with almost 80% of the total at this stage. On the other hand, regarding the core phase, the most impactful process is the use of electricity, which accounts for around 84% of the total contribution of this stage. As regards Global Warming Potential (GWP), PP-PC has a total impact of 4.47 × 10⁻² kg CO2 eq per FU (Table S2). The upstream stage contributes with 3.05 × 10⁻² kg CO2 eq (68% of the total), followed by the core with 1.41 × 10⁻² kg CO2 eq (32%). The contributions of the downstream stage are negligible (1.03 × 10⁻⁴, i.e., less than 1%). Another relevant impact category is Fine Particulate Matter Formation (PMFP); in this case, the PP-PC impact is equal to 3.96 × 10⁻⁵, where the upstream stage contributes with 2.49 × 10⁻⁵ (63% of the total), the core stage with 1.46 × 10⁻⁵ (37%), and the downstream stage with 8.76 × 10⁻⁸ (<1%). The impacts in these categories are mainly due to the production of PP in the upstream phase and the electricity consumption in the core phase.
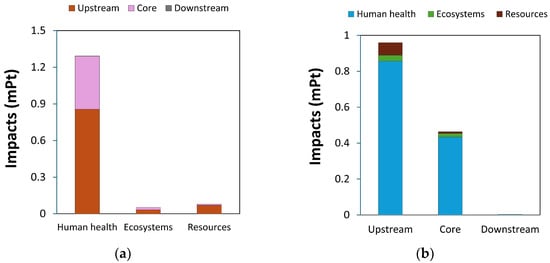
Figure 3.
Environmental profile of CTRL scenario per (a) endpoint categories and (b) process phases. FU: 1 unit of Cheese tray 135 In-Mold Labeling (PP-PC).
3.2. What Possible Solutions for Enhancing the Environmental Performance of the Product Can Be Proposed?
Figure 4 compares CTRL and mitigation scenarios (AS1a, AS1b, AS1c, AS2, and AS3). Generally, introducing renewable energy in the core phase brings several benefits to the environmental profile. In detail, compared to the CTRL (0.443 mPt), the impact of the core phase is reduced by 13% for AS1a (0.405 mPt), 25% for AS1b (0.347 mPt), 38% for AS1c (0.289 mPt), 58% for AS2 (0.111 mPt), and 61% for AS3 (0.094 mPt). On the one hand, human health is the endpoint category that benefits the most from the use of photovoltaic and green energy, while in photovoltaic scenarios, the endpoint related to the ecosystem experiences a slight increase. The analysis of the impact categories indicates that the use of renewable energy mainly reduces GWP (1.41 × 10⁻² kg CO2 eq for core of CTRL): −17% for AS1a (1.17 × 10⁻² kg CO2 eq), −35% for AS1b (9.25 × 10⁻³ kg CO2 eq), −52% for AS1c (6.82 × 10⁻³ kg CO2 eq), −65% for AS2 (4.92 × 10⁻³ kg CO2 eq), and −70% for AS3 (4.24 × 10⁻³ kg CO2 eq). Also, a significant reduction in PMFP (1.46 × 10⁻⁵ kg PM2.5 eq for core of S1) has been highlighted, with −12% for AS1a (1.28 × 10⁻⁵ kg PM2.5 eq), −24% for AS1b (1.11 × 10⁻⁵ kg PM2.5 eq), −37% for AS1c (9.29 × 10⁻⁶ kg PM2.5 eq), −59% for AS2 (5.16 × 10⁻⁵ kg PM2.5 eq), and −64% for AS3 (5.95 × 10⁻⁵ kg PM2.5 eq) (Table S3). However, regarding photovoltaic scenarios, Human Non-Carcinogenic Toxicity (HTPnc) (7.93 × 10⁻³ kg 1,4-DCB for the core of CTRL) presents a minimal increase: 13% for AS1a (8.89 × 10⁻³ kg 1,4-DCB), 23% for AS1b (9.85 × 10⁻³ kg 1,4-DCB), and +7% for AS1c (1.08 × 10⁻² kg 1,4-DCB). This is due to the materials used for the construction of photovoltaic panels. Finally, considering the entire environmental profile, the impacts compared to the CTRL scenarios (1.43 mPt) are reduced by 4% in AS1a (1.37 mPt), 8% in AS1b (1.31 mPt), 12% in AS1c (1.25 mPt), 25% in AS2 (1.07 mPt), and 26% in AS3 (1.06 mPt).
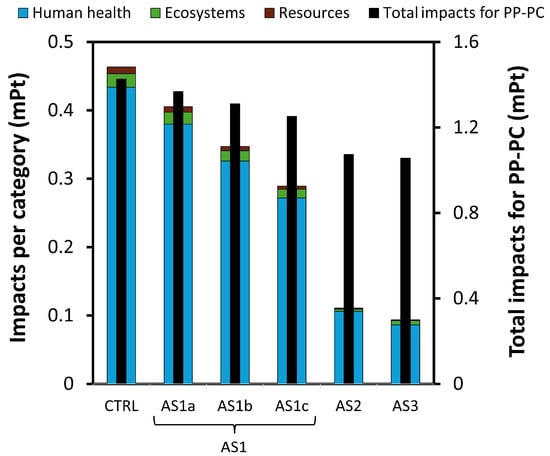
Figure 4.
Comparison of environmental impact mitigation scenarios. The left y-axis refers to the impacts in the core phase while the right y-axis refers to the total impact for PP-PC production. FU: 1 unit of Cheese tray 135 In-Mold Labeling (PP-PC). CTRL: control scenario; AS1: alternative scenario 1; AS2: alternative scenario 2; AS3: alternative scenario 3.
3.3. What Is the Economic Saving Resulting from Introducing Mitigation Actions?
Table 3 reports an estimation of the reduction in CO2 emissions and economic savings by introducing renewable energy in the core phase in the case with the production of 100 tons of PP-PC.
Table 3.
CO2 emissions reduction and EUR saved per 100 tons of Cheese tray 135 In-Mold Labeling (PP-PC). CTRL: control scenario; AS1: alternative scenario 1; AS2: alternative scenario 2; AS3: alternative scenario 3.
The analysis indicates that between 17 and 71 tons of CO2 could be saved per 100 tons of PP-PC production, which translates into an economic value ranging from EUR 824 to EUR 3398 per 100 tons of PP-PC production, considering V1. Instead, considering V2, the economic savings range from EUR 3020 to EUR 12,458 per 100 tons of PP-PC production.
4. Discussion
Plastic is the most widely used material in food packaging, especially in food-contact packaging. For this reason, many studies are examining ways to reduce environmental impacts by making plastic more sustainable. Most studies consider replacing virgin polymers with bio-based materials, but this approach is often hampered by legislation due to the difficulties in granting the same safety standards. This study analyzed the environmental performance of a PP tray used in food-contact and evaluated the benefits of using electricity from different renewable sources.
The results indicate that the entire production process of PP-PC primarily affects human health, accounting for 1.29 mPt (90% of the total). In particular, the main impacts are due to the upstream processes, with 0.96 mPt (67% of the total). This is mainly due to the production process of PP. The study of Vigil et al. [35] confirms the significant environmental impacts during the upstream production phase. Furthermore, the results show that the PP-PC unit produces 0.045 kg CO2 eq. This finding aligns closely with the research of Maga et al. [34], which calculated a similar GWP of 0.049 kg CO2 eq per PP tray.
The mitigation scenario analysis demonstrates that incorporating energy from renewable sources in the core phase would yield clear benefits. Integrating 75% of photovoltaic energy (AS1c) could lead to a 38% reduction in the environmental pressures. Adopting green energy could result in a reduction in environmental impacts by 58% to 61%.
Renewable energy sources demonstrate substantial potential for significantly mitigating the environmental impacts of the product. These measures contribute to a considerable decrease in CO2 eq emissions (ranging from −65% to −70%) and align with eco-design principles, promoting sustainability throughout the product life cycle. The comprehensive approach to energy utilization presents a compelling case for enhancing environmental and operational efficiencies within the examined system.
In this study, the use of green energy leads to economic savings up to EUR 12,458 per 100 tons of PP-PC production. Policy mechanisms such as carbon pricing, including taxes and cap-and-trade systems, can accelerate this transition by internalizing the cost of emissions and making fossil fuel-based energy less competitive. Assigning a price to CO2 emissions aligns economic activities with climate goals, stimulating producers to switch to alternative energy sources. Policies that implement effective carbon pricing mechanisms, such as taxes or trading systems, are effective in promoting sustainable practices [49]. Additionally, financial incentives such as subsidies for renewable energy adoption or tax credits for investments in sustainable production processes could improve cost-effectiveness and encourage the decarbonization of the entire sector. In the literature, Liu et al. [50] integrated an LCA and a Life Cycle Cost analysis to estimate the costs of CO2 emissions to enable cost-effective and environmentally sustainable decision-making of a pavement’s life cycle. In another application, Baltrocchi et al. [51] related the environmental prices to the environmental impacts of a drinking water treatment plant. However, the number of studies that relate costs to environmental impacts is limited. Nevertheless, thanks to its main advantages, this approach should be further studied in the future.
The main limitations of this work are given by the assumptions made during the definition of the model and by the impact method used to perform the LCA analysis. In this sense, a further step could be to use primary data on raw material production and extend the model to different years for better representativeness. Furthermore, the reliance on generic European datasets from the Ecoinvent database for PP production may not reflect regional variations, such as energy mix differences between a single country and the rest of Europe. This could lead to an overestimation of environmental impacts in the upstream phase. Regarding the economic analysis, although CO2 price values are provided by published studies, they may differ significantly in the European context. For this reason, the analysis could be extended through a comparison with other European systems such as the EU Emissions Trading System (EU ETS). In the future, the analysis can also be extended by comparing it with recycled or biobased raw materials, considering the products’ end-of-life, and conducting a Life Cycle Cost analysis. This can help to assess the costs associated with each phase of the process and intervene in synergy with the environmental mitigation systems proposed above. Furthermore, the research could be extended by performing a sensitivity analysis on the most impactful parameters.
5. Conclusions
This study evaluated the environmental profile of single-use PP food-contact packaging production and proposed a solution to mitigate the impacts on production. The results show that the most affected endpoint category is human health, constituting 90.7% of the total impacts (i.e., 1.29 mPt). Upstream processes predominantly shape the environmental profile, accounting for over 65% of the total impact, followed by core processes, which account for approximately 30%. Regarding GWP, the product has a total impact of 4.47 × 10⁻² kg CO2 eq per FU. Upstream processes emit 3.05 × 10⁻² kg CO2 eq, followed by core processes with 1.41 × 10⁻² kg CO2 eq, equal to 68% and 32% of the total, respectively. Focusing on mitigation scenarios, this research indicates that the benefits of using renewable energy’s environmental impacts range from 13% to 61%. The best solution is green energy, which involves energy from geothermal, hydro, wind, biogas, and biomass sources. From an economic point of view, introducing green energy can bring savings ranging from EUR 824 to EUR 12,458 per 100 tons of PP-PC production. This study contributes to the scientific literature by proposing a new perspective on mitigating environmental impacts in single-use PP food-contact packaging production and can support production plants that perform injection molding of thermoplastics. This research highlights the need to consider incorporating renewable energy into the production process, not just substituting raw materials to enhance the sustainability of single-use packaging.
Supplementary Materials
The following supporting information can be downloaded at https://www.mdpi.com/article/10.3390/cleantechnol7030070/s1, Table S1: Life Cycle Inventory analysis transport details. The values are referred to 1 unit of Cheese tray 135 In-Mold Labeling (PP-PC). Geographical representativeness of Ecoinvent database: RER: Europe; Table S2: Environmental impacts of control scenario: characterized results per 1 unit of Cheese tray 135 In-Mold Labeling (PP-PC); Table S3: Environmental impacts of mitigation scenarios: characterized results per 1 unit of Cheese tray 135 In-Mold Labeling (PP-PC). AS1: alternative scenario 1; AS2: alternative scenario 2; AS3: alternative scenario 3.
Author Contributions
Conceptualization, A.P.D.B. and F.R.; methodology, A.P.D.B. and M.C.M.; software, A.P.D.B.; validation, F.R., M.C.M. and V.T.; formal analysis, A.P.D.B.; investigation, A.P.D.B.; data curation, A.P.D.B.; writing—original draft preparation, A.P.D.B.; writing—review and editing, F.R., M.C.M. and V.T.; visualization, A.P.D.B. and M.C.M.; supervision, V.T.; project administration, V.T.; funding acquisition, F.R. and V.T. All authors have read and agreed to the published version of the manuscript.
Funding
This research was financially supported by MPG Manifattura Plastica S.p.A.
Data Availability Statement
The original contributions presented in this study are included in the article/Supplementary Materials.
Acknowledgments
The authors thank MPG Manifattura Plastica S.p.A. for providing the primary data for the analysis.
Conflicts of Interest
The authors declare that they have no known competing financial interests or personal relationships that could have appeared to influence the work reported in this paper.
Abbreviations
The following abbreviations are used in this manuscript:
| AS1 | Alternative Scenario 1 |
| AS2 | Alternative Scenario 2 |
| AS3 | Alternative Scenario 3 |
| CTRL | Control Scenario |
| EFSA | European Food Safety Authority |
| EVOH | Ethylene Vinyl Alcohol |
| FU | Functional Unit |
| GWP | Global Warming Potential |
| HDPE | High-Density Polyethylene |
| HTPnc | Human Non-Carcinogenic Toxicity |
| LCA | Life Cycle Assessment |
| LCI | Life Cycle Inventory |
| LCIA | Life Cycle Impact Assessment |
| NAFTA | North American Free Trade Agreement |
| PA | Polyamide |
| PCR | Product Category Rules |
| PE | Polyethylene |
| PET | Polyethylene Terephthalate |
| PHBV | 3-hydroxybutyrate-co-3-hydroxyvalerate |
| PLA | Polylactic Acid |
| PMFP | Fine Particulate Matter Formation |
| PP | Polypropylene |
| PP-PC | Cheese Tray 135 In-Mold Labeling |
| PS | Polystyrene |
| PVC | Polyvinylchloride |
| SB | System Boundaries |
References
- Marsh, K.; Bugusu, B. Food Packaging—Roles, Materials, and Environmental Issues. J. Food Sci. 2007, 72, R39–R55. [Google Scholar] [CrossRef] [PubMed]
- Park, J.H.; Koo, M.S.; Cho, S.H.; Lyu, M.-Y. Comparison of Thermal and Optical Properties and Flowability of Fossil-Based and Bio-Based Polycarbonate. Macromol. Res. 2017, 25, 1135–1144. [Google Scholar] [CrossRef]
- Majder-Łopatka, M.; Węsierski, T.; Ankowski, A.; Ratajczak, K.; Duralski, D.; Piechota-Polanczyk, A.; Polanczyk, A. Thermal Analysis of Plastics Used in the Food Industry. Materials 2022, 15, 248. [Google Scholar] [CrossRef]
- Oladele, I.O.; Okoro, C.J.; Adelani, S.O.; Agbeboh, N.I.; Betiku, O.T. Current Application of Recycled Waste Plastics as a Sustainable Materials: A Review on Availability, Processing and Application. J. Thermoplast. Compos. Mater. 2024, 38, 277–301. [Google Scholar] [CrossRef]
- Williams, A.T.; Rangel-Buitrago, N. Marine Litter: Solutions for a Major Environmental Problem. J. Coast. Res. 2019, 35, 648–663. [Google Scholar] [CrossRef]
- Wan, Y.; Wu, C.; Xue, Q.; Hui, X. Effects of Plastic Contamination on Water Evaporation and Desiccation Cracking in Soil. Sci. Total Environ. 2019, 654, 576–582. [Google Scholar] [CrossRef]
- Hurley, R.; Horton, A.; Lusher, A.; Nizzetto, L. Chapter 7—Plastic Waste in the Terrestrial Environment. In Plastic Waste and Recycling; Letcher, T.M., Ed.; Academic Press: Cambridge, MA, USA, 2020; pp. 163–193. ISBN 978-0-12-817880-5. [Google Scholar]
- Carnevale Miino, M.; Galafassi, S.; Zullo, R.; Torretta, V.; Rada, E.C. Microplastics Removal in Wastewater Treatment Plants: A Review of the Different Approaches to Limit Their Release in the Environment. Sci. Total Environ. 2024, 930, 172675. [Google Scholar] [CrossRef]
- Baltrocchi, A.P.D.; Maggi, L.; Carnevale Miino, M.; Torretta, V.; Rada, E.C. Comparison of Mixed and Door-to-Door Systems for Urban Waste Collection in Terms of Effectiveness and Greenhouse Gas Emissions: A Case Study from Two Mountainous Italian Valleys. Resources 2024, 13, 17. [Google Scholar] [CrossRef]
- Nayanathara Thathsarani Pilapitiya, P.G.C.; Ratnayake, A.S. The World of Plastic Waste: A Review. Clean. Mater. 2024, 11, 100220. [Google Scholar] [CrossRef]
- Thompson, R.C.; Moore, C.J.; vom Saal, F.S.; Swan, S.H. Plastics, the Environment and Human Health: Current Consensus and Future Trends. Philos. Trans. R. Soc. B Biol. Sci. 2009, 364, 2153–2166. [Google Scholar] [CrossRef] [PubMed]
- Singh, N.; Hui, D.; Singh, R.; Ahuja, I.P.S.; Feo, L.; Fraternali, F. Recycling of Plastic Solid Waste: A State of Art Review and Future Applications. Compos. B Eng. 2017, 115, 409–422. [Google Scholar] [CrossRef]
- Millican, J.M.; Agarwal, S. Plastic Pollution: A Material Problem? Macromolecules 2021, 54, 4455–4469. [Google Scholar] [CrossRef]
- Jaideva, R.; Mondal, S. Polypropylene Homopolymer/Unmodified Minor Mineral Fuller’s Earth Composites: A Comprehensive Experimental Study on Mechanical and Thermal Properties. Iran. Polym. J. 2024, 33, 659–669. [Google Scholar] [CrossRef]
- Steinmetz, Z.; Wollmann, C.; Schaefer, M.; Buchmann, C.; David, J.; Tröger, J.; Muñoz, K.; Frör, O.; Schaumann, G.E. Plastic Mulching in Agriculture. Trading Short-Term Agronomic Benefits for Long-Term Soil Degradation? Sci. Total Environ. 2016, 550, 690–705. [Google Scholar] [CrossRef]
- Velásquez, E.; de Dicastillo, C.L.; Rojas, A.; Garrido, L.; Pérez, C.J.; Lira, M.; Guarda, A.; Galotto, M.J. Multiple Mechanical Recycling of a Post-Industrial Flexible Polypropylene and Its Nanocomposite with Clay: Impact on Properties for Food Packaging Applications. Food Packag. Shelf Life 2024, 43, 101272. [Google Scholar] [CrossRef]
- Beltran, M.; Tjahjono, B.; Bogush, A.; Julião, J.; Teixeira, E.L.S. Food Plastic Packaging Transition towards Circular Bioeconomy: A Systematic Review of Literature. Sustainability 2021, 13, 3896. [Google Scholar] [CrossRef]
- Ahmad, A.; Qurashi, A.; Sheehan, D. Nano Packaging—Progress and Future Perspectives for Food Safety, and Sustainability. Food Packag. Shelf Life 2023, 35, 100997. [Google Scholar] [CrossRef]
- Asgher, M.; Qamar, S.A.; Bilal, M.; Iqbal, H.M.N. Bio-Based Active Food Packaging Materials: Sustainable Alternative to Conventional Petrochemical-Based Packaging Materials. Food Res. Int. 2020, 137, 109625. [Google Scholar] [CrossRef] [PubMed]
- Longo, C.; Savaris, M.; Zeni, M.; Brandalise, R.N.; Grisa, A.M.C. Degradation Study of Polypropylene (PP) and Bioriented Polypropylene (BOPP) in the Environment. Mater. Res. 2011, 14, 442–448. [Google Scholar] [CrossRef]
- Strupinsty, G.; Brody, A.L. Packaging Applications for High Temperature Plastics. In Applications of High Temperature Polymers; CRC Press: Boca Raton, FL, USA, 2018; pp. 181–202. [Google Scholar]
- Freudenthaler, P.J.; Fischer, J.; Liu, Y.; Lang, R.W. Polypropylene Post-Consumer Recyclate Compounds for Thermoforming Packaging Applications. Polymers 2023, 15, 345. [Google Scholar] [CrossRef]
- Tsioptsias, C.; Leontiadis, K.; Tzimpilis, E.; Tsivintzelis, I. Polypropylene Nanocomposite Fibers: A Review of Current Trends and New Developments. J. Plast. Film Sheeting 2021, 37, 283–311. [Google Scholar] [CrossRef]
- Poore, J.; Nemecek, T. Reducing Food’s Environmental Impacts through Producers and Consumers. Science 2018, 360, 987–992. [Google Scholar] [CrossRef]
- Kan, M.; Miller, S.A. Environmental Impacts of Plastic Packaging of Food Products. Resour. Conserv. Recycl. 2022, 180, 106156. [Google Scholar] [CrossRef]
- Alsabri, A.; Tahir, F.; Al-Ghamdi, S.G. Environmental Impacts of Polypropylene (PP) Production and Prospects of Its Recycling in the GCC Region. Mater. Today Proc. 2022, 56, 2245–2251. [Google Scholar] [CrossRef]
- Ritchie, H.; Rosado, P.; Roser, M. Environmental Impacts of Food Production. Available online: https://ourworldindata.org/environmental-impacts-of-food (accessed on 5 November 2024).
- Matthews, C.; Moran, F.; Jaiswal, A.K. A Review on European Union’s Strategy for Plastics in a Circular Economy and Its Impact on Food Safety. J. Clean. Prod. 2021, 283, 125263. [Google Scholar] [CrossRef]
- Ogunola, O.S.; Onada, O.A.; Falaye, A.E. Mitigation Measures to Avert the Impacts of Plastics and Microplastics in the Marine Environment (a Review). Environ. Sci. Pollut. Res. 2018, 25, 9293–9310. [Google Scholar] [CrossRef]
- Ferronato, N.; Baltrocchi, A.P.D.; Romagnoli, F.; Calle Mendoza, I.J.; Gorritty Portillo, M.A.; Torretta, V. Environmental Life Cycle Assessment of Biomass and Cardboard Waste-Based Briquettes Production and Consumption in Andean Areas. Energy Sustain. Dev. 2023, 72, 139–150. [Google Scholar] [CrossRef]
- Dal Lago, B.; Krelani, V.; Visconti, D.; Berisha, E.; Baltrocchi, A.P.D.; Torretta, V. Comparison of the Environmental Impact of Similar Prefabricated Industrial Structures Made of Precast Concrete or Steel; Springer Nature: New York, NY, USA, 2025; Volume 573, ISBN 9783031806711. [Google Scholar]
- Baltrocchi, A.P.D.; Lotti, D.; Carnevale Miino, M.; Maggi, L.; Rada, E.C.; Torretta, V. Environmental Impact of Three Different Engineering Thermoplastics: How Much Does It Change When Using Recycled Polyamide? J. Clean. Prod. 2025, 514, 145769. [Google Scholar] [CrossRef]
- Baltrocchi, A.P.D.; Carnevale Miino, M.; Maggi, L.; Rada, E.C.; Torretta, V. A Comprehensive Critical Review of Life Cycle Assessment Applied to Thermoplastic Polymers for Mechanical and Electronic Engineering. Environ. Technol. Rev. 2025, 14, 458–470. [Google Scholar] [CrossRef]
- Maga, D.; Hiebel, M.; Aryan, V. A Comparative Life Cycle Assessment of Meat Trays Made of Various Packaging Materials. Sustainability 2019, 11, 5324. [Google Scholar] [CrossRef]
- Vigil, M.; Pedrosa-Laza, M.; Cabal, J.V.A.; Ortega-Fernández, F. Sustainability Analysis of Active Packaging for the Fresh Cut Vegetable Industry by Means of Attributional & Consequential Life Cycle Assessment. Sustainability 2020, 12, 7207. [Google Scholar] [CrossRef]
- David, G.; Croxatto Vega, G.; Sohn, J.; Nilsson, A.E.; Hélias, A.; Gontard, N.; Angellier-Coussy, H. Using Life Cycle Assessment to Quantify the Environmental Benefit of Upcycling Vine Shoots as Fillers in Biocomposite Packaging Materials. Int. J. Life Cycle Assess. 2021, 26, 738–752. [Google Scholar] [CrossRef]
- Snyder, W.R.; Park, J. Environmental and Economic Analysis of Reusable and Single-Use Food Packaging Formats in University Campus Food Services. Packag. Technol. Sci. 2024, 37, 841–855. [Google Scholar] [CrossRef]
- Pelaracci, S.; Rocchi, L.; Romagnoli, F.; Boggia, A.; Paolotti, L. Agricultural Co-Product Management: An LCA Perspective on the Use of Safflower Oilcake from Bio-Oil Production in Umbria Region, Italy. Environ. Clim. Technol. 2022, 26, 25–35. [Google Scholar] [CrossRef]
- Romagnoli, F.; Paoli, R.; Arias, A.; Entrena-Barbero, E.; Ilmjärv, T.; Elvevold, K.; Moreira, M.T. Furcellaria Lumbricalis Macroalgae Cascade Biorefinery: A Life Cycle Assessment Study in the Baltic Sea Region. J. Clean. Prod. 2024, 478, 143861. [Google Scholar] [CrossRef]
- ISO 14040; Environmental Management—Life Cycle Assessment—Principles and Framework. ISO: Geneva, Switzerland, 2006.
- ISO 14044; Environmental Management—Life Cycle Assessment—Requirements and Guidelines. ISO: Geneva, Switzerland, 2006.
- PRé Sustainability BV. SimaPro 9.5 What’s New? PRé Sustainability BV: Amersfoort, The Netherlands, 2023. [Google Scholar]
- Ecoinvent Database. Available online: https://ecoinvent.org/database/ (accessed on 3 April 2025).
- Goedkoop, M.; Heijungs, R.; Huijbregts, M.; De Schryver, A.; Struijs, J.; Van Zelm, R. ReCiPe 2008: A Life Cycle Impact Assessment Method Which Comprises Harmonised Category Indicators at the Midpoint and the Endpoint Level; Ministry of Housing, Spatial Planning and the Environment: The Hague, The Netherlands, 2009. [Google Scholar]
- Paoli, R.; Feofilovs, M.; Kamenders, A.; Romagnoli, F. Peat Production for Horticultural Use in the Latvian Context: Sustainability Assessment through LCA Modeling. J. Clean. Prod. 2022, 378, 134559. [Google Scholar] [CrossRef]
- UN CPC 347; EPD International AB Product Category Rules (PCR) Plastics in Primary Forms Product Category Classification. EPD International AB: Stockholm, Sweden, 2022.
- Interagency Working Group on Social Cost of Greenhouse Gases, United States Government. Technical Support Document: Social Cost of Carbon, Methane, and Nitrous Oxide Interim Estimates Under Executive Order 13990; U.S. Government: Washington, DC, USA, 2021. [Google Scholar]
- Rennert, K.; Errickson, F.; Prest, B.C.; Rennels, L.; Newell, R.G.; Pizer, W.; Kingdon, C.; Wingenroth, J.; Cooke, R.; Parthum, B.; et al. Comprehensive Evidence Implies a Higher Social Cost of CO2. Nature 2022, 610, 687–692. [Google Scholar] [CrossRef] [PubMed]
- Samuel, S.A. Carbon Pricing Mechanisms for Reducing Greenhouse Gas Emissions and Encouraging Sustainable Industrial Practices. World J. Adv. Res. Rev. 2025, 25, 001–024. [Google Scholar] [CrossRef]
- Liu, Y.; Li, H.; Wang, H.; Wang, Y.; Han, S. Integrated Life Cycle Analysis of Cost and CO2 Emissions from Vehicles and Construction Work Activities in Highway Pavement Service Life. Atmosphere 2023, 14, 194. [Google Scholar] [CrossRef]
- Baltrocchi, A.P.D.; Carnevale Miino, M.; Katsoyiannis, I.A.; Tolkou, A.K.; Maggi, L.; Rada, E.C.; Torretta, V. Assessment of Environmental Sustainability of Drinking Water Treatments for Arsenic Removal. Resour. Conserv. Recycl. 2024, 211, 107878. [Google Scholar] [CrossRef]
Disclaimer/Publisher’s Note: The statements, opinions and data contained in all publications are solely those of the individual author(s) and contributor(s) and not of MDPI and/or the editor(s). MDPI and/or the editor(s) disclaim responsibility for any injury to people or property resulting from any ideas, methods, instructions or products referred to in the content. |
© 2025 by the authors. Licensee MDPI, Basel, Switzerland. This article is an open access article distributed under the terms and conditions of the Creative Commons Attribution (CC BY) license (https://creativecommons.org/licenses/by/4.0/).