3.2. Effects of Pyrolysis Parameters
The effects of pyrolysis parameters, namely, pyrolysis temperature, hold time, nitrogen flow rate, and heating rate, on the pore characteristics of active biocarbons with fixed activation conditions were studied experimentally.
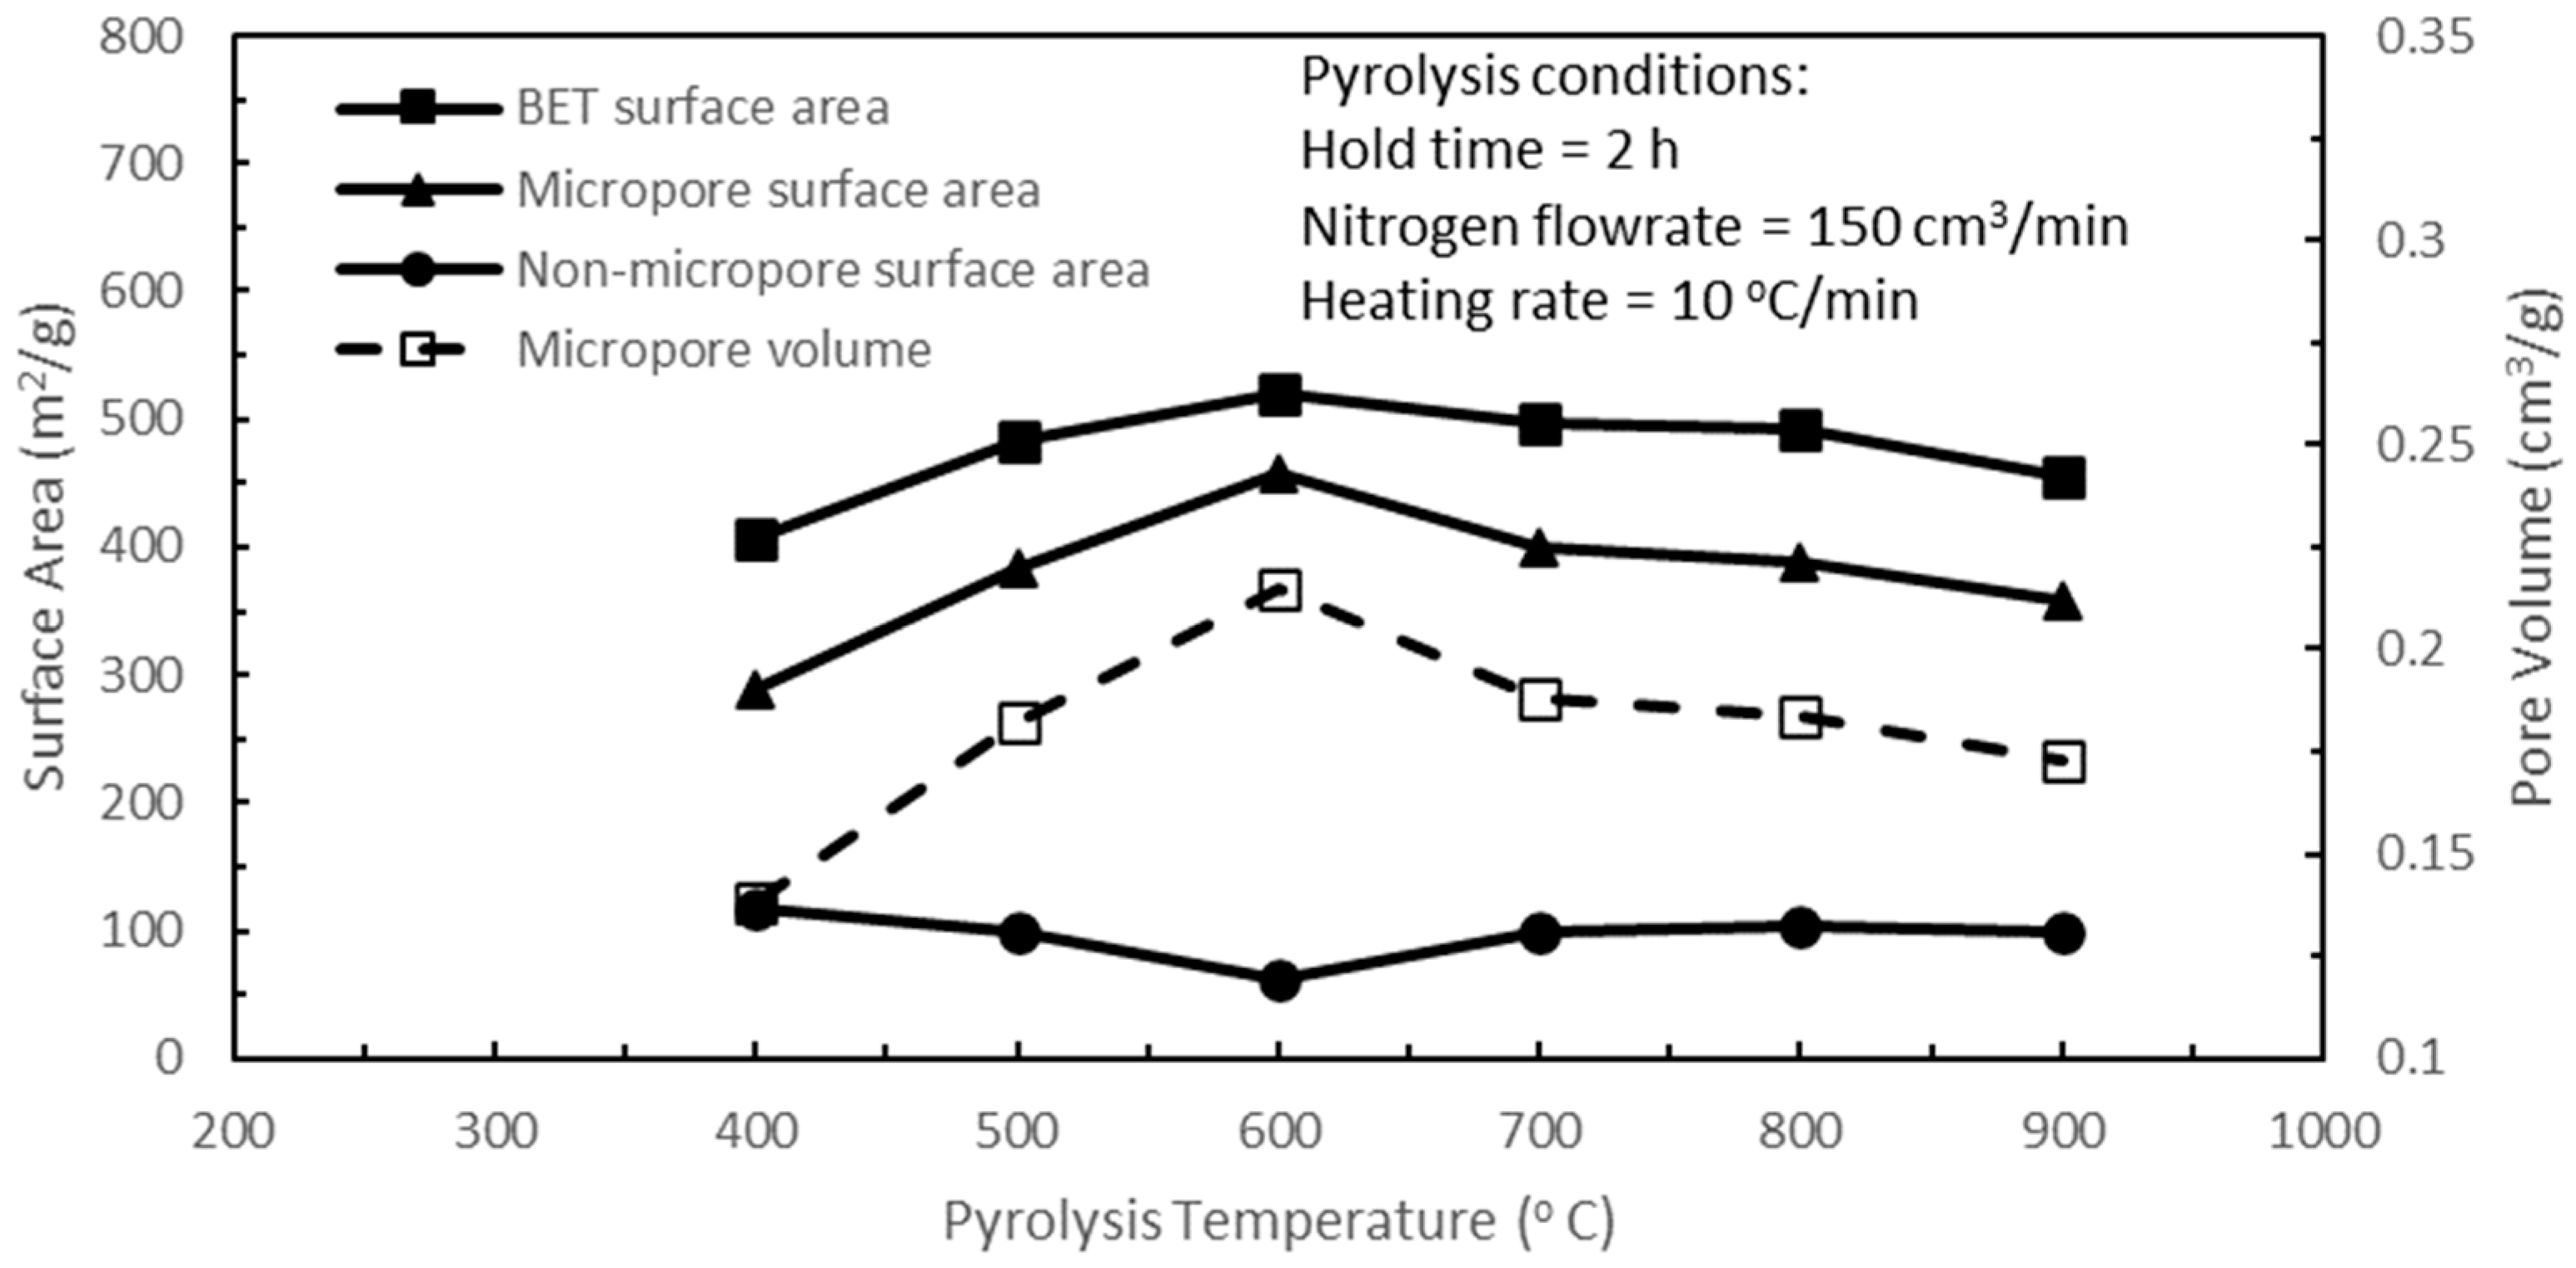
Figure 2 shows the effects of pyrolysis temperature on the BET, micropore, and non-micropore surface areas, and the micropore volume of the active biocarbons, while the rest of the pyrolysis parameters were held constant. Increasing the pyrolysis temperature from 400 to 600 °C progressively improved all the pore characteristics of the active biocarbons except for the non-micropore surface area. The purpose of pyrolysis is to release the volatiles from the shell structures and to form rudimentary pores within the biochar structures. The rudimentary pore structures form the tortuous passages or pathways for the diffusion of CO
2 molecules into the inner pore structures of the biochar during CO
2 activation. As a result, pore development within the existing biochar structures is enhanced, and additional new pores are formed in the active biocarbons. Oil palm kernel shell is a lignocellulosic biomass whose main constituents are cellulose (40–50%), hemicellulose (15–25%), and lignin (15–30%) [
20]. At the pyrolysis temperature of 400 °C, the BET, micropore, and non-micropore surface areas of the resultant active biocarbon were 407.4, 289.82, and 117.58 m
2/g, respectively. At the pyrolysis temperature of 400 °C, the rudimentary pore structures in the biochar were developed due to the release of water and volatile contents from the oil palm shell biomass. Spanning the temperature range from room temperature to 400 °C, cellulose polymers underwent dehydration to water and depolymerisation of cellulose led to the formation of low molecular compounds such as glycoaldehyde, furan, hydroxyl acetaldehyde, formic acid, and CO
2 for pyrolysis temperatures from 150 to 300 °C [
21,
22]. For pyrolysis temperatures between 300 and 390 °C, cellulose depolymerisation resulted in the breakdown of the glycosidic bonds and the formation of levoglucosan and levoglucosenone [
23]. Hemicellulose in oil palm shells exists as angiosperm hemicellulose, which contains mostly xylan, a polysaccharide. For hemicellulose pyrolysis, the release of water due to dehydration reactions within the polysaccharides became significant at 200 °C. During the early stage of xylan decomposition, the highest production of methanol, formic acid, and acetic acid occurred at 230 °C because of fragmentation reactions. At a temperature of 240 °C, the glycosidic linkages between monomer units for xylan became extremely unstable, and a rapid depolymerisation occurred. The rapid depolymerisation of the main xylopyranose chain occurred at around 290 °C, leading to the formation of H
2O, CO
2, and CO and the production of condensable volatile compounds such as anhydro-saccharides, furans, furfural, hydroxyacetaldehyde, hydroxyacetone, and 1-hydroxy-2-butanone [
23]. (Depolymerisation consists in the breaking of the bonds between the monomer units of the polymers, whereas fragmentation consists in the breaking of the linkage of many covalent bonds of the polymer, even within the monomer units.) For lignin pyrolysis, the main decomposition activity of lignin occurred over a large temperature range from 200 to 450 °C, with the highest decomposition rate generally occurring between 360 and 400 °C. During this temperature range, eugenol, cresol, guaiacol, syringol, and phenol were released. The fragmentation of the methoxy groups in lignin led to an important formation of methanol at 400 °C [
23].
When the pyrolysis temperature was increased to 500 °C and then further to 600 °C, the continued release of the volatile contents provided more rudimentary pores in the biochar structure. The subsequent CO
2 activation of these biochars enhanced pore development and increased the formation of new pores, especially micropores, contributing to further increases in the BET and micropore surface areas and the micropore volume of the resultant active biocarbon, whilst there was a continuous slight dip in the non-micropore surface area with increasing the pyrolysis temperature from 400 to 600 °C as seen in
Figure 2. This slight dip in the non-micropore surface area could probably be attributed to the increasing merging of two or more non-micropores during activation, for increasing pyrolysis temperature to form new larger non-micropores. Accompanying increasing pyrolysis temperature from 400 to 600 °C, increasing amounts of volatiles were released, resulting in more non-micropores as well as micropores being formed and in closer proximity to each other. During activation, pore widening due to the CO
2–carbon reaction and the eventual collapse of some pore walls can forge the merging of pores, with the merging of non-micropores being more predominant than that of micropores and hence resulting in gradual decreases in the non-micropore surface area with increasing pyrolysis temperature from 400 to 600 °C. Over the pyrolysis temperature span from 400 to 600 °C, methyl substituents in cellulose are converted into methane by a mechanism of demethylation for pyrolysis temperatures from 500 to 600 °C, whilst methyl substituents in hemicellulose are converted to methane by demethylation with a maximum methane production at 550 °C [
23]. The fragmentation of the methoxy groups in lignin is the source of CH
4 production at 430 °C [
23]. The pyrolysis of lignin releases a significant amount of CO between 500 and 800 °C, which is due to the depolymerisation of the ether bonds [
23]. The depolymerisation of ether could be verified by the FTIR (Fourier transform infrared spectrometry) spectrum of the diminishing presence of the ether group in the biochar at a pyrolysis temperature of 600 °C compared to the FTIR spectrum of the biochar pyrolysed at 400 °C, which was shown in the research study of the pyrolysis of oil palm stones by Guo and Lua [
24]. The release of these volatile organic compounds over the pyrolysis temperature increase from 400 to 600 °C contributed to further rudimentary pore structures in the biochar.
Subsequent increases in pyrolysis temperature from 600 to 900 °C yielded continual decreases in the BET and micropore surface areas and the micropore volume of the active biocarbons, as shown in
Figure 2. However, the non-micropore surface area increased with an increase in pyrolysis temperature from 600 to 700 °C and thereafter remained almost constant up to the pyrolysis temperature of 900 °C. Increasing the pyrolysis temperature from 600 to 900 °C resulted in increasing release of more volatile organic compounds and hence increasing rudimentary pores in the biochar, which resulted in enhancing pore development and the formation of new pores in the active biocarbon. During CO
2 activation, the development of new micropores, in part due to the continual release of volatile matters, and pore widening occur concurrently due to the CO
2–carbon reaction. For these increasing pyrolysis temperatures, with the increasing rudimentary pores available in the biochar, the pore widening of micropores into non-micropores and the merger of pores to form non-micropores were more predominant than the formation of micropores, resulting in decreasing micropore surface area and decreasing BET surface area with increasing pyrolysis temperature from 600 to 900 °C, and a corresponding increase in the non-micropore surface area for the pyrolysis temperature increase from 600 to 700 °C. However, for pyrolysis temperatures from 700 to 900 °C, the non-micropore surface area remained almost constant for the following reasons. The increasing rudimentary pores available as a result of increasing the pyrolysis temperature from 700 to 900 °C and with pore widening of micropores during CO
2 activation formed non-micropores and hence increased the non-micropore surface area with increasing pyrolysis temperature. On the other hand, the collapse of some pore walls and the merger of two or more non-micropores to form larger non-micropores decreased the non-micropore surface area with increasing pyrolysis temperature. If a net zero balance was achieved for these two opposing effects, the resulting effect would produce a constant non-micropore surface area with increasing the pyrolysis temperature from 700 to 900 °C, as seen in
Figure 2. Overlapping this pyrolysis temperature span of 600 to 900 °C, CO is formed due to the conversion of the phenol rings present in lignin over the temperature range of 550 to 800 °C. The release of H
2 over the temperature range of 480 to 800 °C is mainly due to dehydrogenation reactions during the formation of a more condensed structure arising from the conversion of short substituents of the aromatic rings in xylan during hemicellulose pyrolysis [
23]. Both of these conversions of the volatile contents in the biochar had also occurred in the previous pyrolysis temperature range of 400 to 600 °C. The previously stated depolymerisation of the ether bonds between 500 and 800 °C is also applicable to this pyrolysis temperature range of 600 to 900 °C. The FTIR spectrum of the biochar pyrolysed at 800 °C verified the absence of the ether group as reported by Guo and Lua [
24]. At the pyrolysis temperature of 900 °C, the carbonyl group of ketones disappeared, leaving the aromatic benzene rings and the carbonyl group of quinones remaining in the biochar [
24].
There are three possible end paths for the condensable volatile organic compounds released by the pyrolysis process. Most of them will be deposited and collected in the pyrolysis oil residue, whilst some of them can be redeposited on the biochar surfaces. A small remnant of the volatile contents can remain within the pore structures of the biochar. The released water due to dehydration reactions is also collected in the pyrolysis residue. However, incondensable gases such as CO
2, CO, CH
4 and H
2 are emitted to the surrounding environment. Based on the largest BET surface area in
Figure 2, the optimum pyrolysis temperature was 600 °C. Hence, a pyrolysis temperature of 600 °C was used for the subsequent optimisation of the remaining pyrolysis parameters.
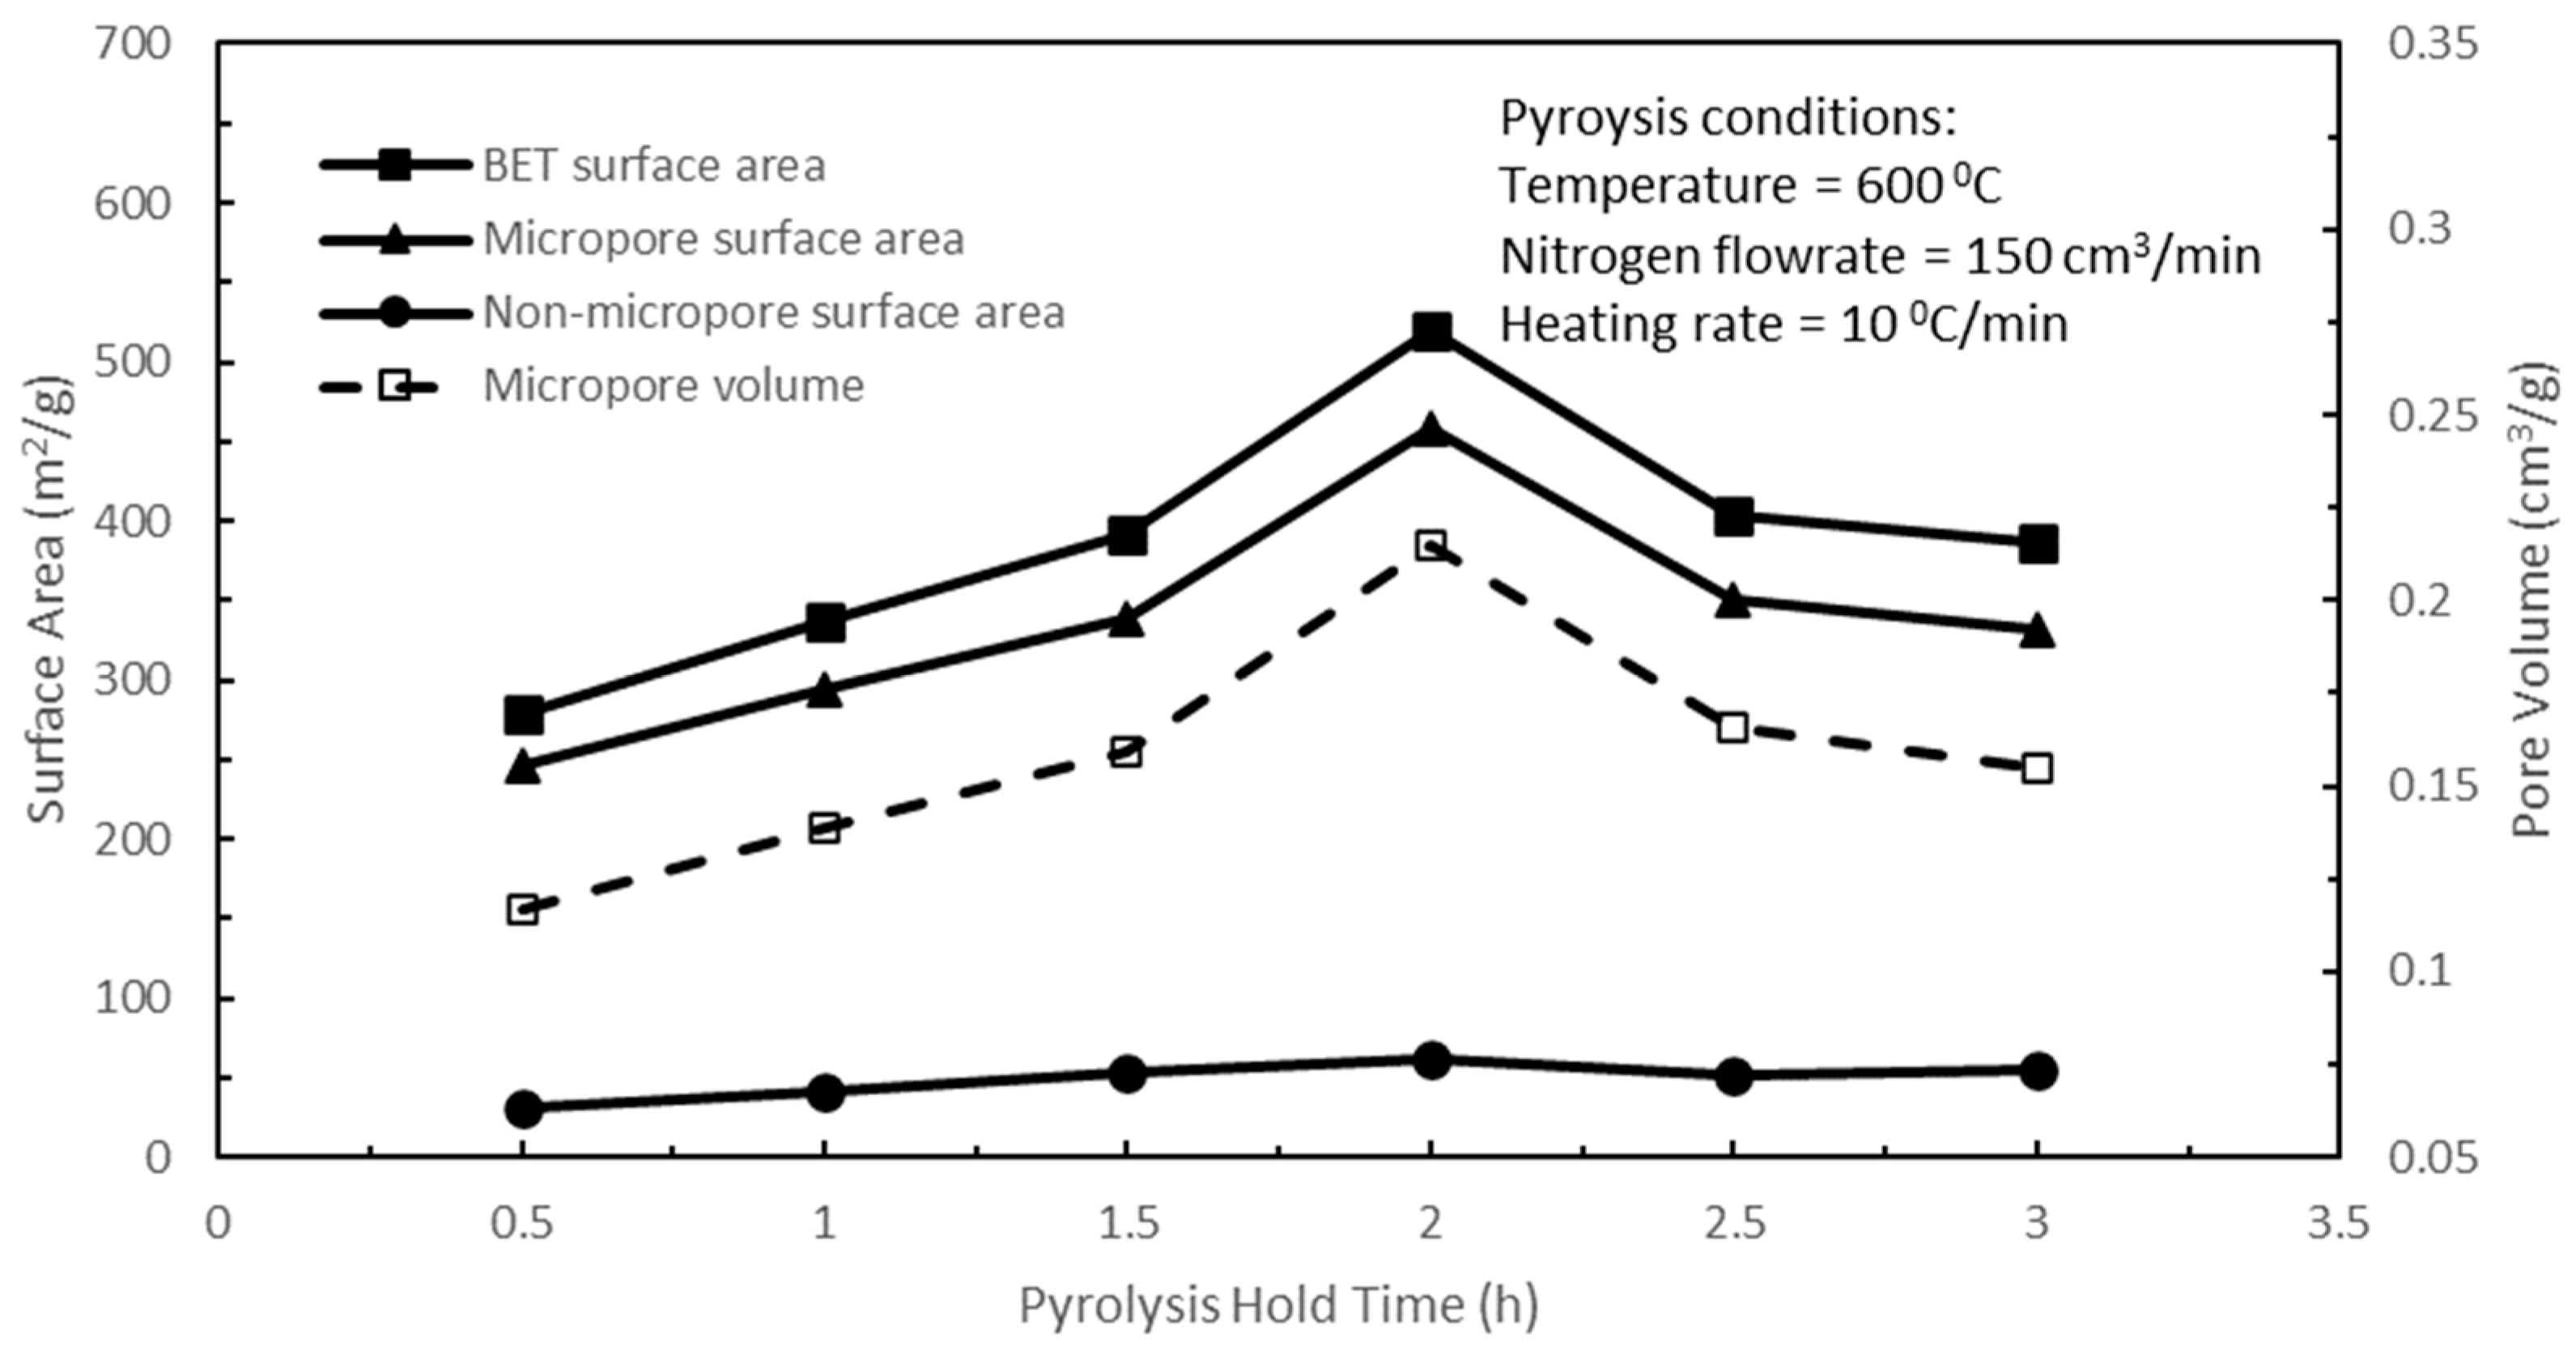
With the optimum pyrolysis temperature set at 600 °C, the effects of pyrolysis hold time on the pore properties of active biocarbons were studied next, while the rest of the pyrolysis parameters were held constant. In
Figure 3, increasing the pyrolysis hold time from 0.5 to 2 h yielded increasing release of low-molecular-weight volatiles and resulted in increasing tiny pores in the biochar structure, which led to an increasing rudimentary pore structure within the biochar. Hence, increasing the hold time from 0.5 to 2 h resulted in increasing the BET, micropore, and non-micropore surface areas, and the micropore volume of the active biocarbons upon subsequent CO
2 activation. However, beyond a 2 h pyrolysis hold time, the textural characteristics of the active biocarbons deteriorated with increasing the hold time from 2 to 3 h. Prolonged and sustained heat treatment during pyrolysis at 600 °C for more than a 2 h hold time leads to the softening and sintering of the residual low-molecular-weight volatiles in the biochar, giving rise to the closing and sealing of part of the pore structure of the biochar. These masses of low-molecular-weight volatiles remaining in the biochar structure could impede and reduce the CO
2–carbon reaction during CO
2 activation and therefore decrease the BET and micropore surface areas and the micropore volume of the resulting active biocarbons with increasing the pyrolysis hold time from 2 to 3 h, even though these effects were much less significant for the non-micropore surface area. Based on the largest BET surface area in
Figure 3, the optimum pyrolysis hold time was 2 h. Hence, a pyrolysis temperature of 600 °C and a pyrolysis hold time of 2 h were used for the subsequent optimisation of the remaining pyrolysis parameters.
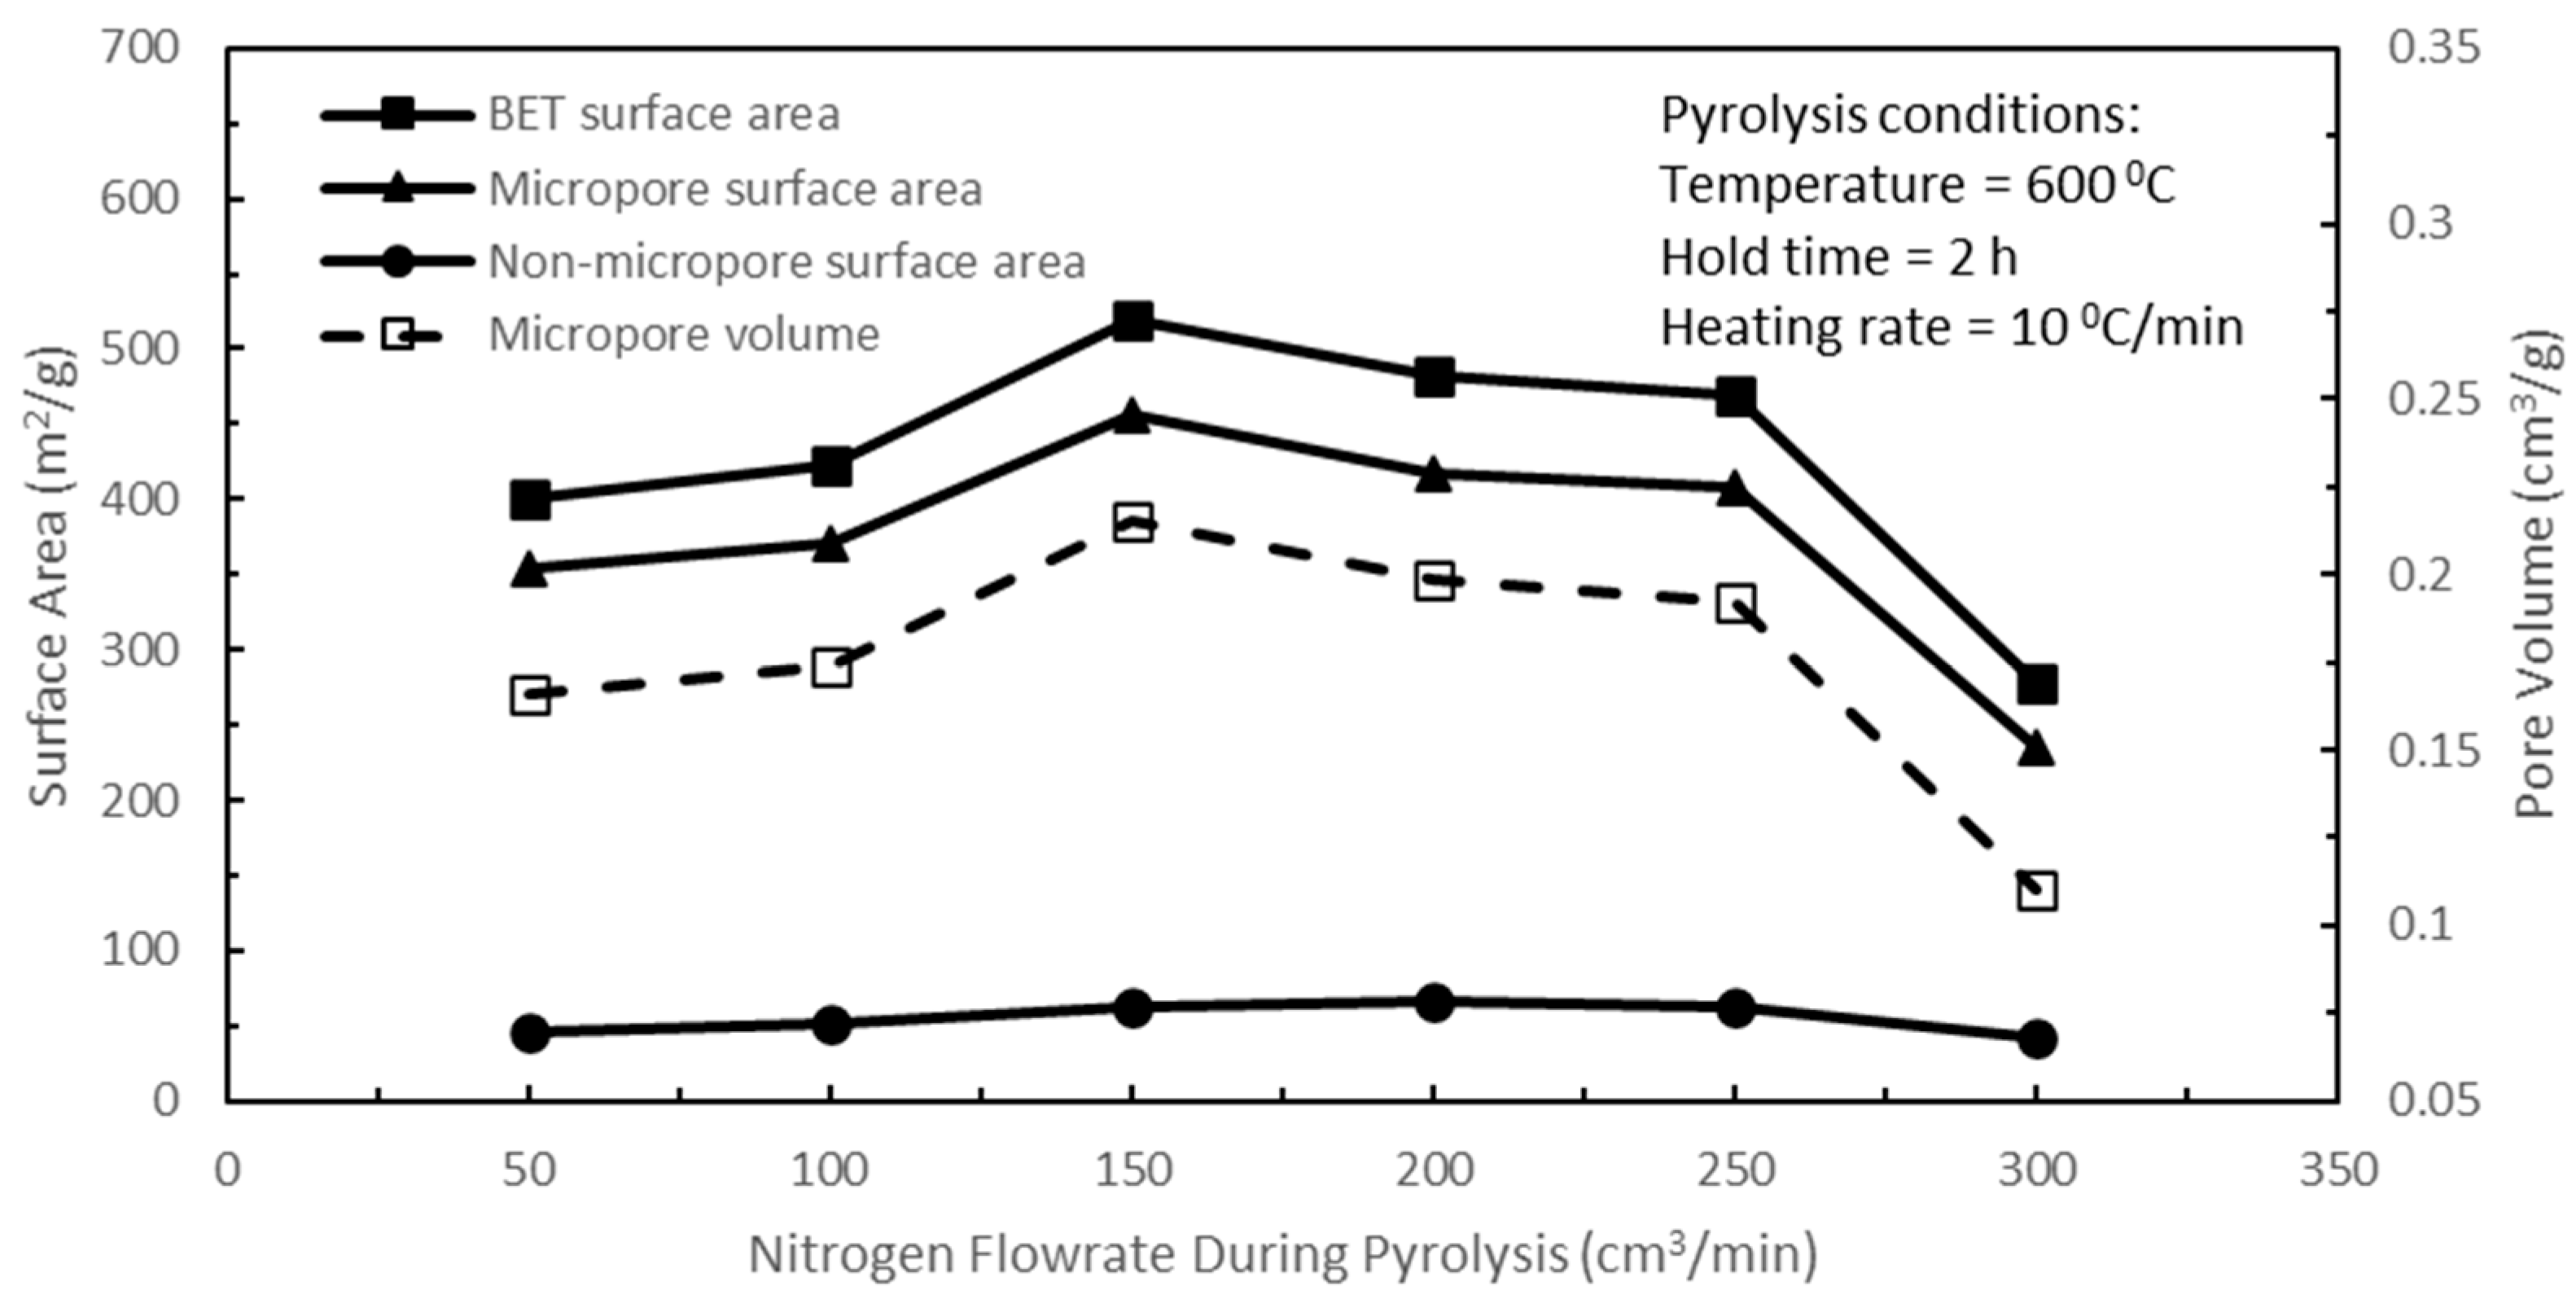
With the optimum pyrolysis temperature set at 600 °C and the pyrolysis hold time at 2 h, the effects of nitrogen flow rate during pyrolysis on the pore characteristics of active biocarbons were studied next, while the rest of the pyrolysis parameters were held constant. The functions of nitrogen flow are firstly to provide an inert atmosphere for the pyrolysis reaction and secondly to entrain the released volatiles in the nitrogen flow, thereby removing them from the reactor. In
Figure 4, the results show that increasing the nitrogen flow rate during pyrolysis from 50 to 150 cm
3/min (50 to 200 cm
3/min for the non-micropore surface area) resulted in increasing BET and micropore surface areas, micropore volume, and non-micropore surface area of the resulting CO
2-activated biocarbons; however, further increases in the nitrogen flow rate up to 300 cm
3/min had adverse effects, which resulted in continual decreases in these pore characteristics. Increasing the nitrogen flow rate from 150 to 300 cm
3/min (200 to 300 cm
3/min for the non-micropore surface area) had the effect of reducing the surface temperature on the biochar surfaces, resulting in a lower pyrolysis reaction rate and decrease in the release of volatiles, which led to decreasing pore development with the steepest decrease at 300 cm
3/min. Hence, a nitrogen flow rate of 150 cm
3/min yielded the largest BET surface area in the resulting active biocarbon. For the optimisation of the last remaining pyrolysis heating rate parameter, a pyrolysis temperature of 600 °C, a pyrolysis hold time of 2 h, and a nitrogen flow rate of 150 cm
3/min during pyrolysis were used.
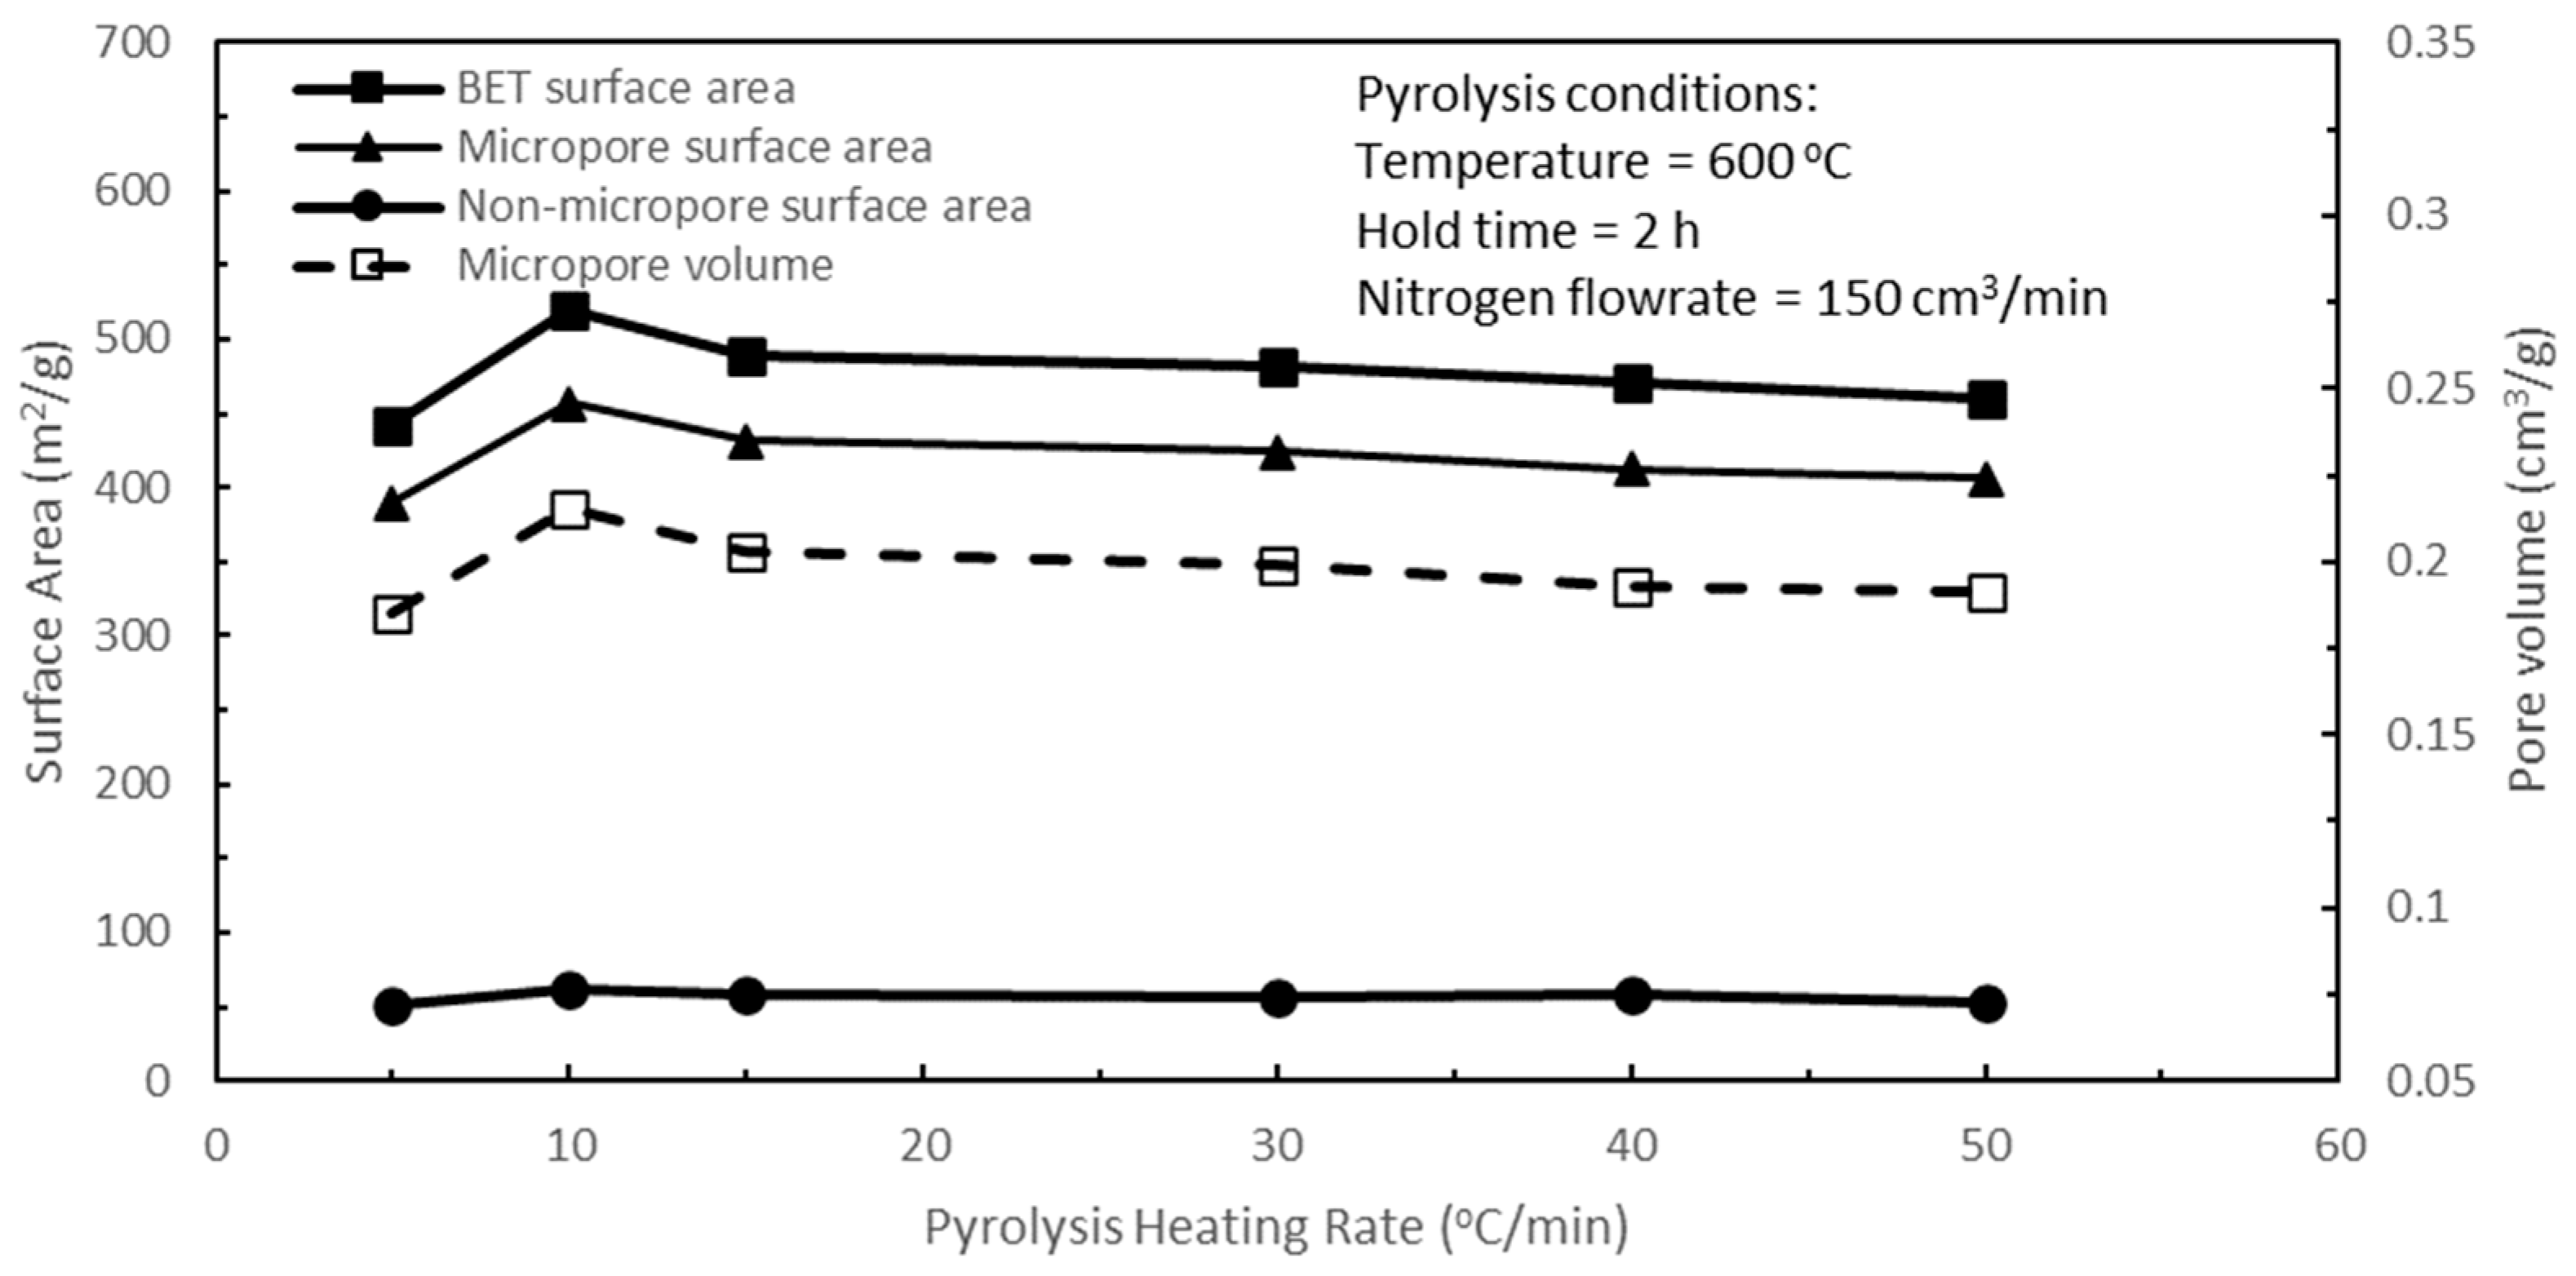
Figure 5 shows the effects of pyrolysis heating rate on the pore characteristics of the active biocarbons for a span of pyrolysis heating rates from 5 to 50 °C/min. Increasing the heating rate from 5 to 10 °C/min increased the BET and micropore surface areas, micropore volume, and non-micropore surface area. However, increasing the heating rates from 10 to 50 °C/min resulted in decreasing pore characteristics in the active biocarbons, with very gradual progressive reductions in these pore characteristics from 15 to 50 °C/min. The optimum pyrolysis heating rate was shown to be 10 °C/min. The pyrolysis heating rate will have a direct consequence and impact on the temperature ramp-up time from room temperature to the final pyrolysis temperature, which will ultimately affect the residence time of the biochar during pyrolysis. Increasing the heating rate shortens the temperature ramp-up time from room temperature to the final pyrolysis temperature in the reactor and vice versa. Reducing the pyrolysis heating rate from 10 °C/min to 5 °C/min was tantamount and comparable to subjecting the biochar to the detrimental effects of prolonged hold time, as discussed earlier for the effects of an excessively long hold time on the biochar in
Figure 3. Hence, the BET and micropore surface areas, micropore volume, and non-micropore surface area of the resulting active biocarbon decreased with a lower heating rate of 5 °C/min when compared to the heating rate of 10 °C/min, as seen in
Figure 5. However, increasing the pyrolysis heating rate from 10 to 50 °C/min resulted in decreasing temperature ramp-up time, thereby leading to decreasing pyrolysis residence time for the biochar and hence reducing the amounts of volatiles released. This had the effect of decreasing rudimentary pore development in the biochar, and therefore, there was a small progressive decrease in the BET and micropore surface areas, micropore volume, and non-micropore surface area of the active biocarbons with increasing heating rate. For the range of pyrolysis heating rates studied, increasing the heating rate from 5 to 50 °C/min decreased the temperature ramp-up time from 1.9 to 0.19 h, respectively.
Pore development in biochar during pyrolysis is desirable as the release of the volatile matter contents generates rudimentary pores in the biochar structure. This facilitates and enhances the BET and micropore surface areas, micropore volume, and non-micropore surface area of the active biocarbon by promoting the diffusion of CO
2 molecules into the pores and thereby increasing the CO
2–carbon reaction, which creates more pores in the active biocarbon. For the pyrolysis parameters studied, the optimum pyrolysis conditions were a pyrolysis temperature of 600 °C, a pyrolysis hold time of 2 h, a nitrogen flow rate of 150 cm
3/min during pyrolysis, and a pyrolysis heating rate of 10 °C/min to produce a resulting active biocarbon with a BET surface area of 519.1 m
2/g, a micropore area of 456.94 m
2/g, a non-micropore area of 62.17 m
2/g, and a micropore volume of 0.215 cm
3/g. The proximate analysis of this biochar is given in
Table 4, which shows a large decrease in the volatile organic matter content as the volatiles were mainly released during pyrolysis and resulted in the yield of biochar at 34.80%. Pyrolysis does not consume any carbon, and hence the carbon content increased to 77.95% because of the significant reduction in weight of the biochar compared to the starting raw material. All these biochars were converted into active biocarbons under fixed activation conditions as stated in
Section 2.2, which constituted part of the pyrolysis optimisation process. The above optimum pyrolysis conditions were used for the optimisation of the activation conditions for the active biocarbons.
3.3. Effects of Activation Parameters
The effects of varying activation temperature on the pore characteristics of the active biocarbons prepared from oil palm kernel shells were studied first, while the other activation parameters, namely, carbon dioxide flow rate, heating rate, and hold time were held constant at 100 cm
3/min, 10 °C/min, and 3 h, respectively.
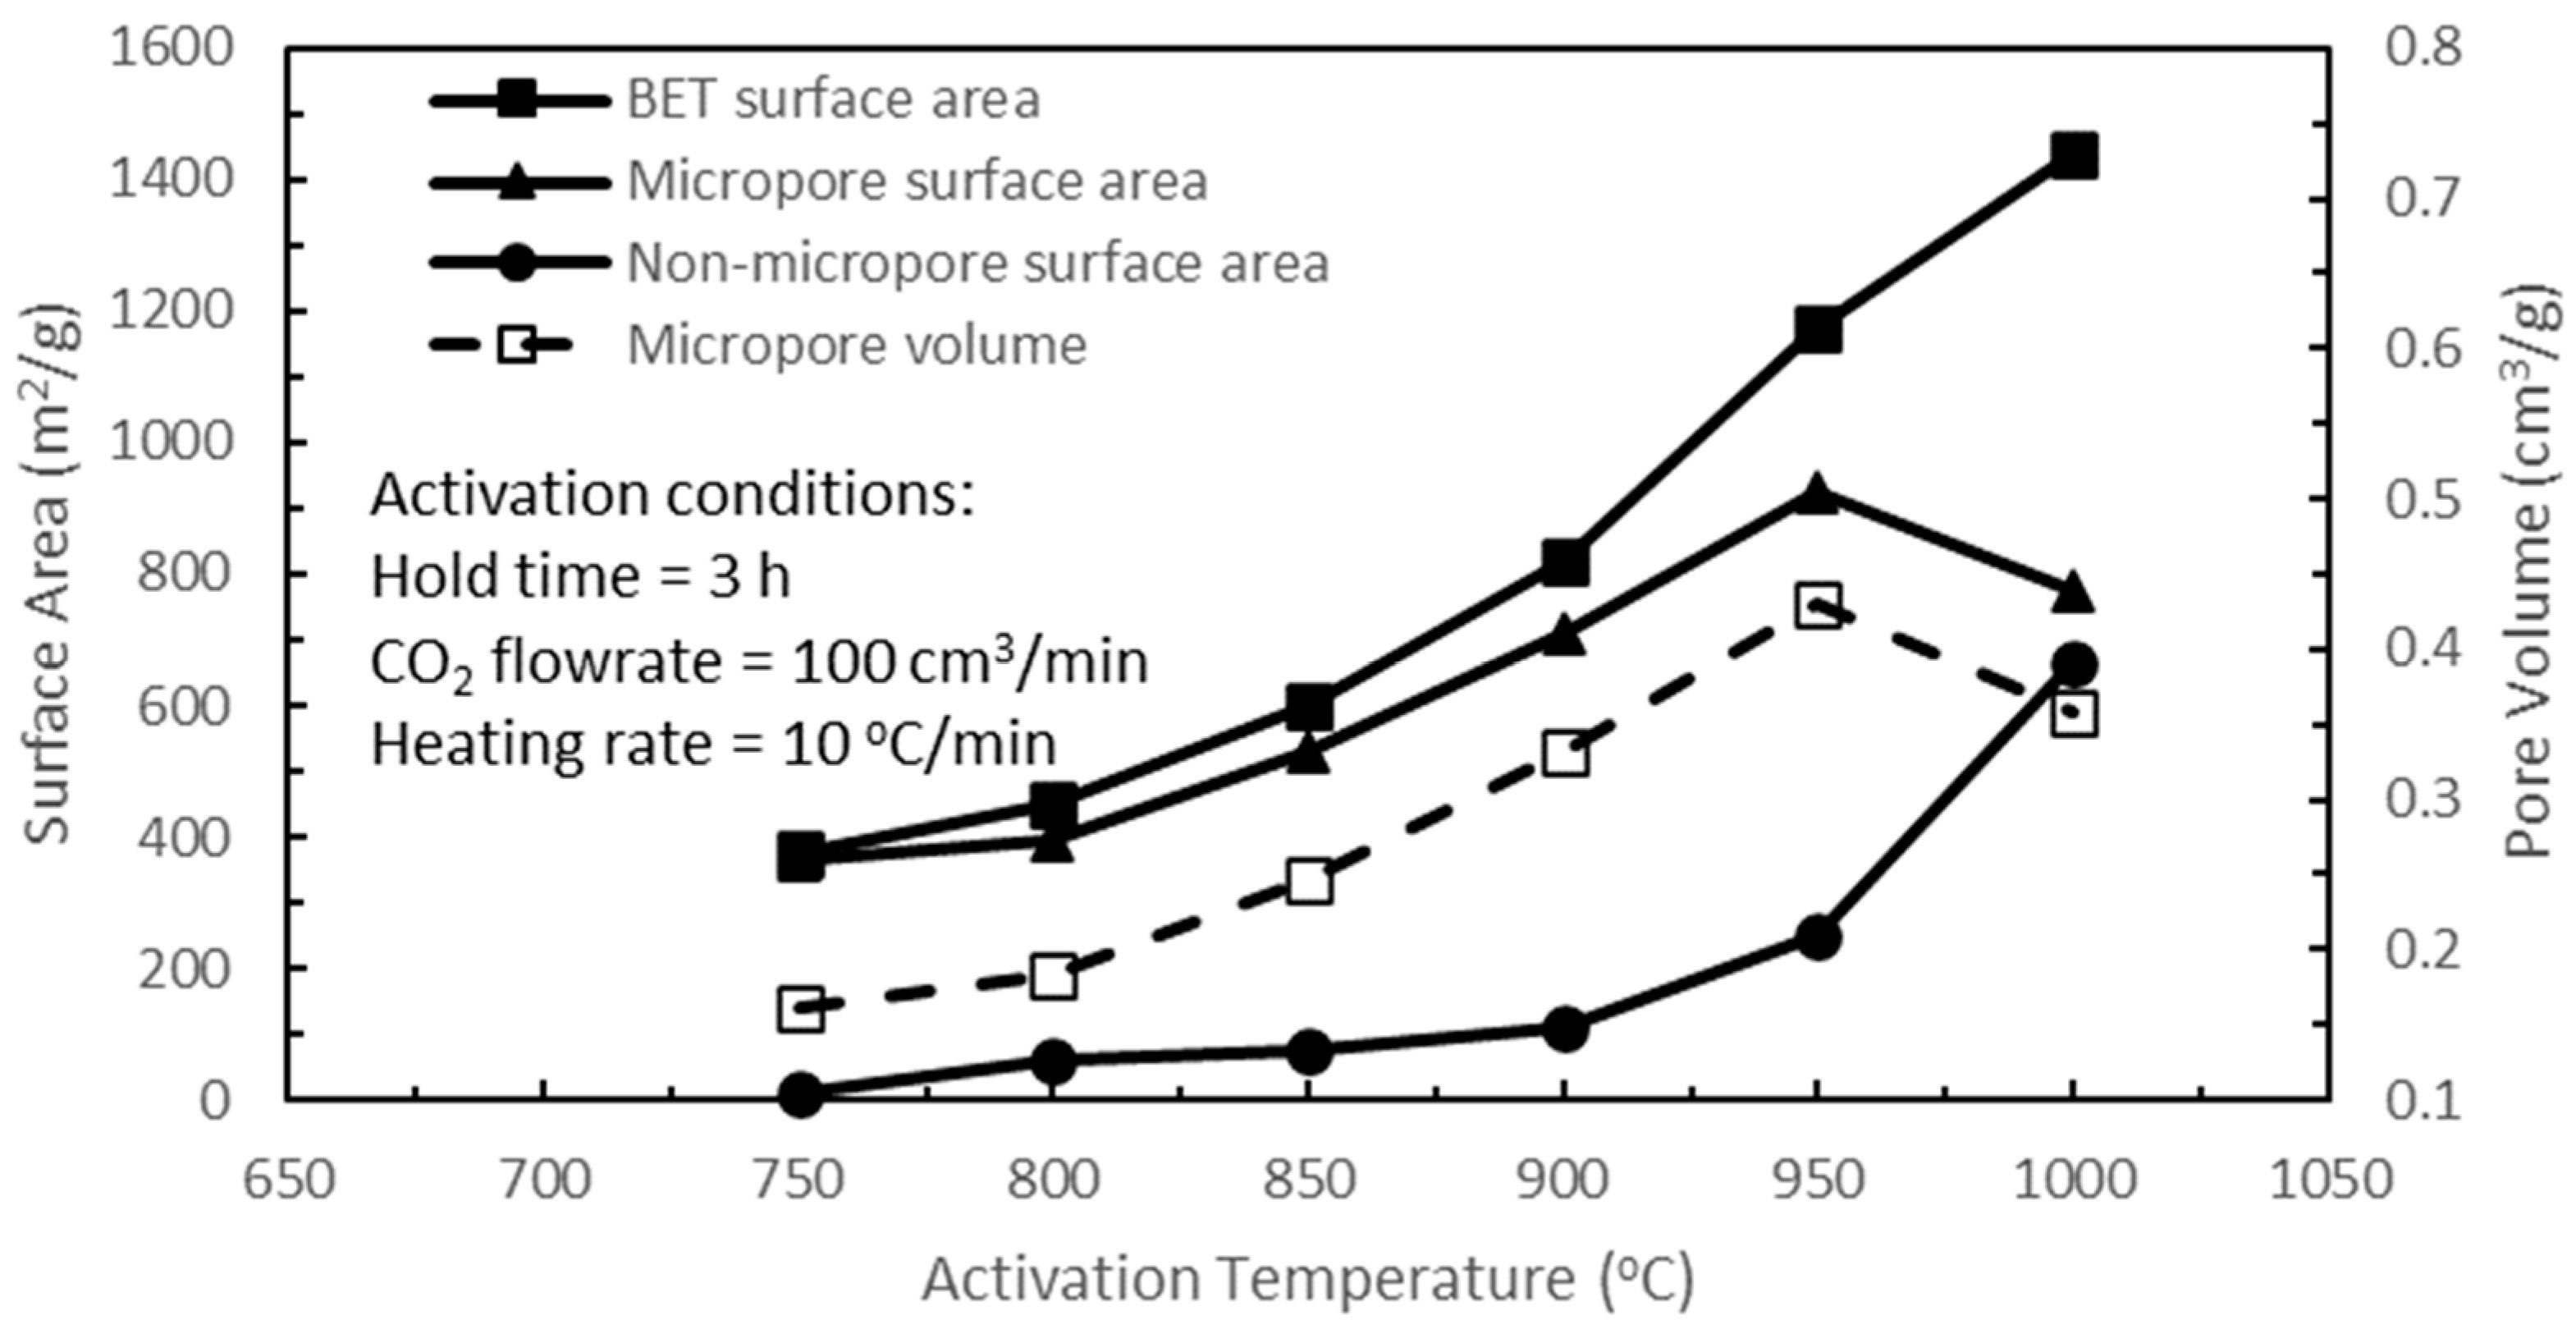
Figure 6 shows the effects of activation temperature on the pore characteristics of the active biocarbons. Increasing the activation temperature from 750 to 950 °C yielded increasing BET, micropore, and non-micropore surface areas, and micropore volume. These increasing trends were attributed to the increasing CO
2–carbon reaction with increasing activation temperature, which caused increasing ‘carbon burn-offs’ within the pore structure, producing more porosities in the active biocarbon by enhancing and enlarging existing pores and the formation of new pores. At the same time, increasing activation temperature would release increasing remnant volatile matters, especially high-molecular-weight volatiles, which were still present in the starting biochars, thereby contributing to increasing new pores in the active biocarbons, namely, in the sites vacated by the volatiles. Guo and Lua [
24] reported the removal of the carbonyl group of quinones when the activation temperature was increased from 900 to 950 °C, which gave credence to the continual release of volatile matters over this temperature interval. Another factor that could contribute to increasing new pores with increasing the activation temperature from 750 to 950 °C (even up to 1000 °C) was the continual release of volatile matters in the biochars during the initial temperature ramp-up time from room temperature to the final selected activation temperature with N
2 gas stream flushing through the reactor. Guo and Lua [
24] reported the presence of the carbonyl group of ketones at a pyrolysis temperature of 800 °C, but it was absent at 900 °C when the pyrolysis temperature was increased from 800 to 900 °C, which therefore supported the thesis of continual release of volatile matters over this temperature interval. This volatile release could be considered as an extension to the pyrolysis process, accompanied by a longer ‘perceived hold time’ for a higher activation temperature. This ramp-up time varied from 1.20 to 1.62 h for 750 to 1000 °C activation temperatures, respectively. Thereafter, increasing the activation temperature from 950 to 1000 °C increased the BET and non-micropore surface areas but decreased the micropore surface area and the micropore volume. At this high activation temperature of 1000 °C, there were pore enlargements and specifically more pronounced pore widening of micropores into mesopores and even macropores, resulting in an increase in the BET surface area and a steep increase in the non-micropore surface area but reductions in the micropore surface area and micropore volume. On the other hand, there was the formation of new micropores for this temperature range from 950 to 1000 °C due to the continual release of remaining high-molecular-weight volatiles, which Guo and Lua [
24] reported on the presence of aromatic benzene rings in the active biocarbons at the activation temperature of 950 °C, but their increases were probably overshadowed by the significant decrease in existing micropores due to the pore widening into mesopores and macropores. Hence, there were declines in micropore surface area and micropore volume from 950 to 1000 °C, as shown in
Figure 6. The yields of active biocarbons for varying activation temperatures are shown in
Table 5. It shows that the yield decreased with increasing activation temperature, reaching a very low yield of 4.71% for the activation temperature of 1000 °C due to the severe CO
2–carbon reaction and the continual devolatilisation process, which persisted at this late stage as the proximate analysis of the final active biocarbon for the activation temperature at 1000 °C showed the presence of volatile contents as given in
Table 5. The adsorption isotherms of the active biocarbons for the various activation temperatures from 800 to 1000 °C are shown in
Figure 7. The adsorbed volume increased with increasing activation temperature from 800 to 1000 °C, which corresponded to an increase in the BET surface area for the same increasing temperature range as seen in
Figure 6. The plateau of the isotherm showed the adsorption capacity limit of the mesopores, in which the isotherm for the activation temperature of 1000 °C was representative of the Type IV isotherm under the IUPAC classifications of physisorption isotherms. The supposedly linear curve at the initial low relative pressure, P/P
o, was indicative of micropore filling, while the uptake in adsorption at high relative pressure, P/P
o, was associated with capillary condensation occurring in mesopores. A typical adsorption–desorption isotherm of an active biocarbon prepared from oil palm kernel shell was reported by the author [
4].
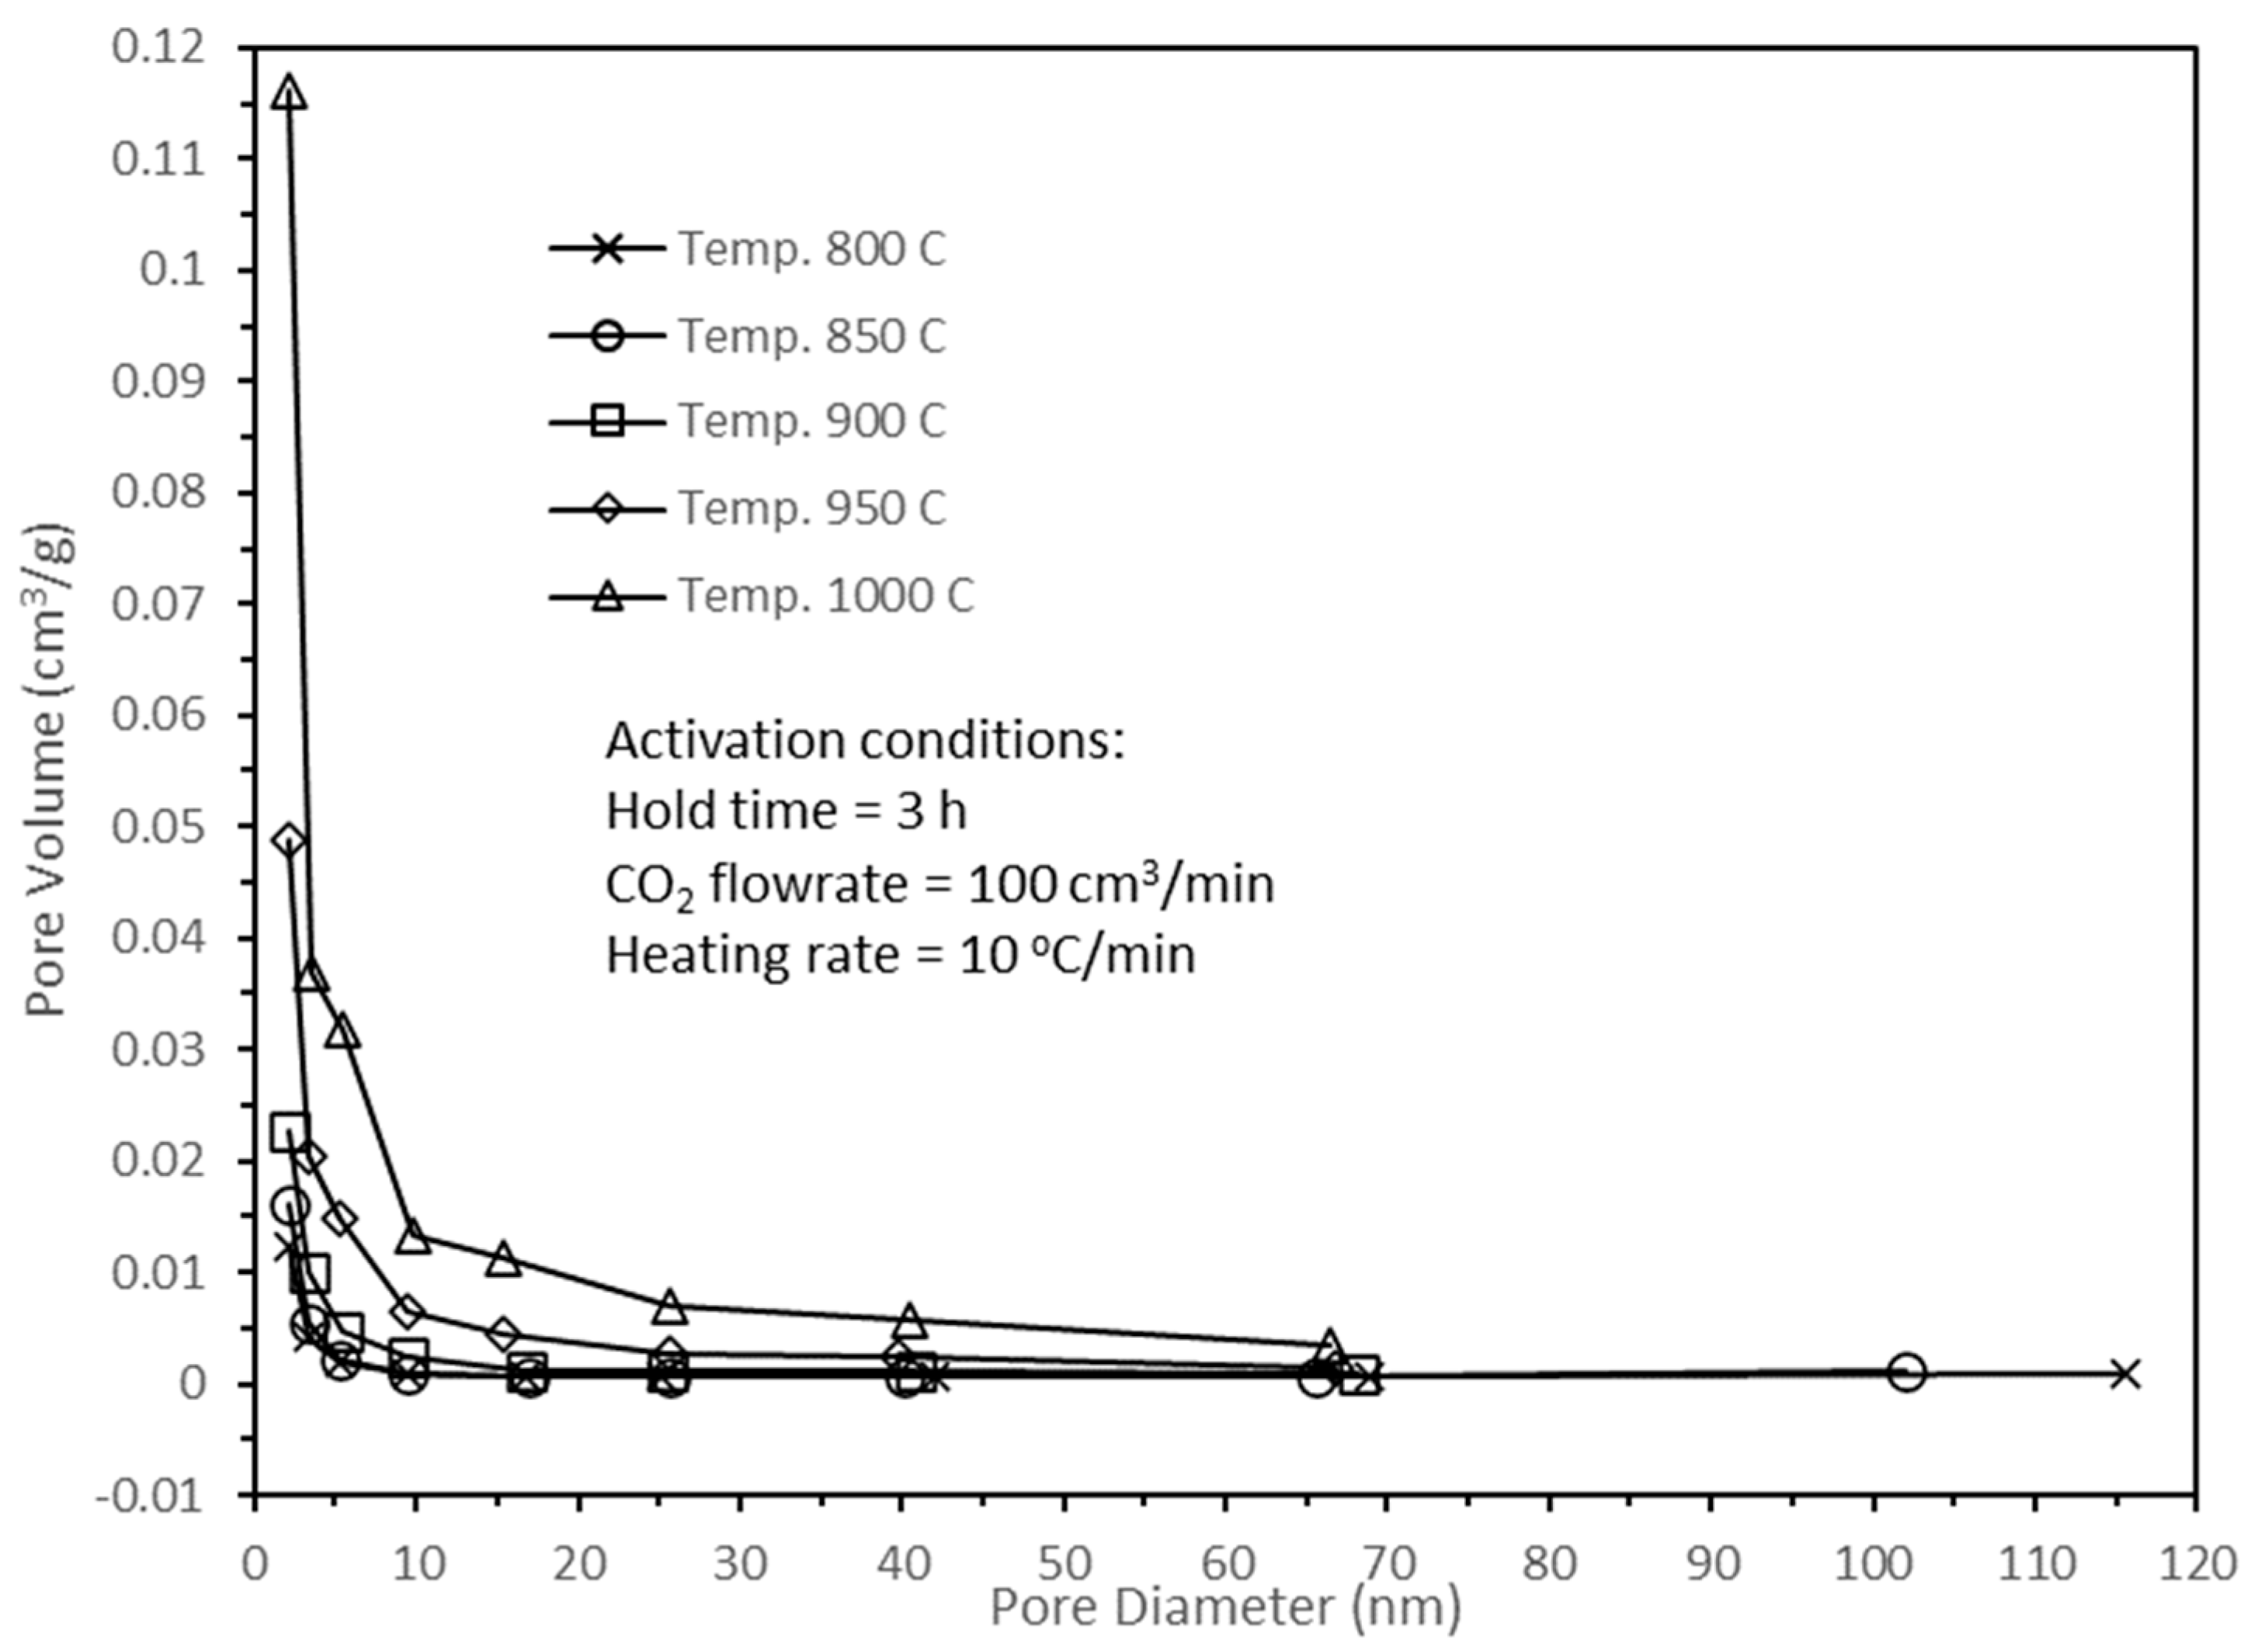
Figure 8 illustrates the pore size distributions of active biocarbons subjected to various activation temperatures, and their pore sizes ranged from less than 2 nm for micropores, 2 to 50 nm for mesopores, and greater than 50 nm for macropores.
Figure 8 shows that the active biocarbons consisted more of micropores than mesopores, with the least amount in macropores, which were consistent with the results in
Figure 6. From the results in
Figure 6, the activation temperature of 950 °C resulted in the largest micropore surface area, which was ideal for gas adsorption, and hence, the optimum activation temperature of 950 °C was used to optimise the remaining activation parameters.
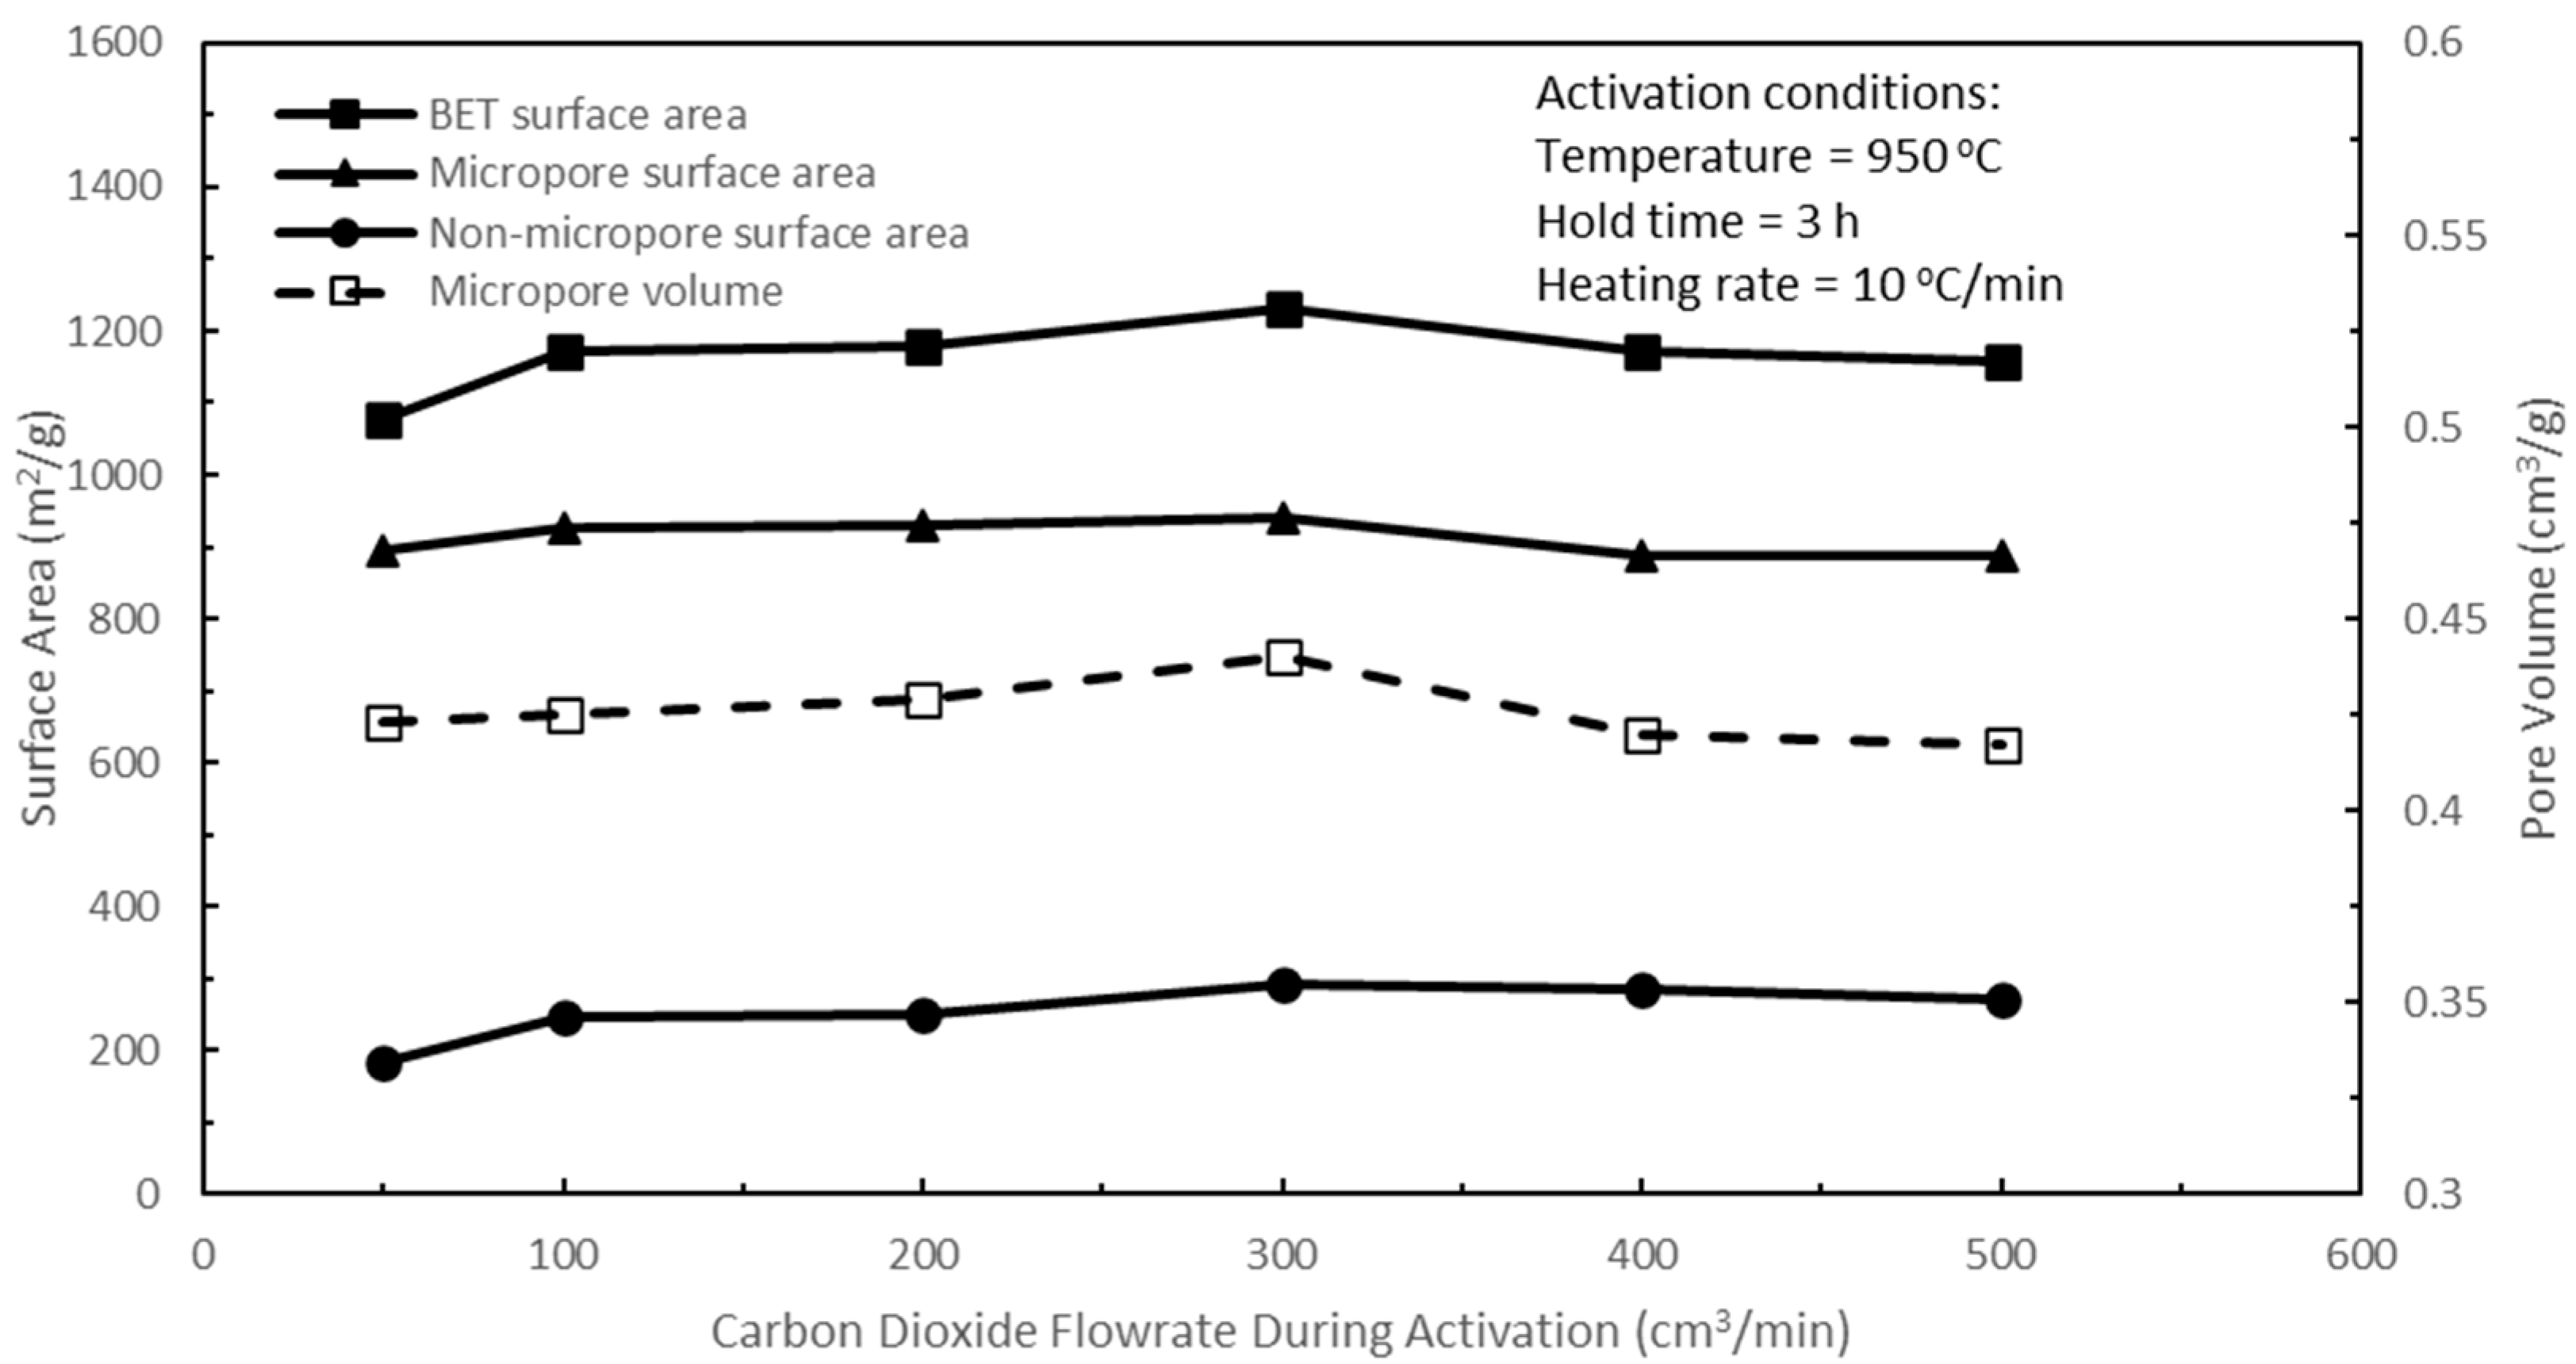
The next activation parameter to optimise was the carbon dioxide flow rate, while the rest of the activation parameters were held constant.
Figure 9 shows the effects of carbon dioxide flow rate during activation on the pore characteristics of the active biocarbons for a range of volume flow rates from 50 to 500 cm
3/min. During activation, carbon dioxide reacts with carbon in the reaction
under a high temperature (such as 750 to 1000 °C used in this study) to form porosities in the physical carbon structure. Therefore, it is imperative that different CO
2 flow rates have consequences on the pore surface areas of the resulting active biocarbons. Increasing the CO
2 flow rate from 50 to 300 cm
3/min increased the BET, micropore, and non-micropore surface areas, and the micropore volume of the active biocarbons due to the increasing CO
2–carbon reaction, which gave rise to new pore development, predominantly micropores, and pore widening actions, giving rise to increases in non-micropores. After peaking at 300 cm
3/min, further increases in CO
2 flow rate to 400 cm
3/min and finally to 500 cm
3/min resulted in decreases in these pore area formations due to excessive CO
2–carbon reactions, which caused pore enlargements, resulting in the conversion of micropores into mesopores, and mesopores into larger mesopores or even macropores. This excessive CO
2–carbon reaction was verified by the significant reductions in the fixed carbon content of the resulting active biocarbons, as shown in
Table 5, especially for the CO
2 flow rate of 500 cm
3/min.
Figure 9 shows that a CO
2 flow rate of 300 cm
3/min yielded the largest micropore surface area in the resulting active biocarbon, and therefore, this CO
2 flow rate of 300 cm
3/min was used to optimise the two remaining activation parameters.
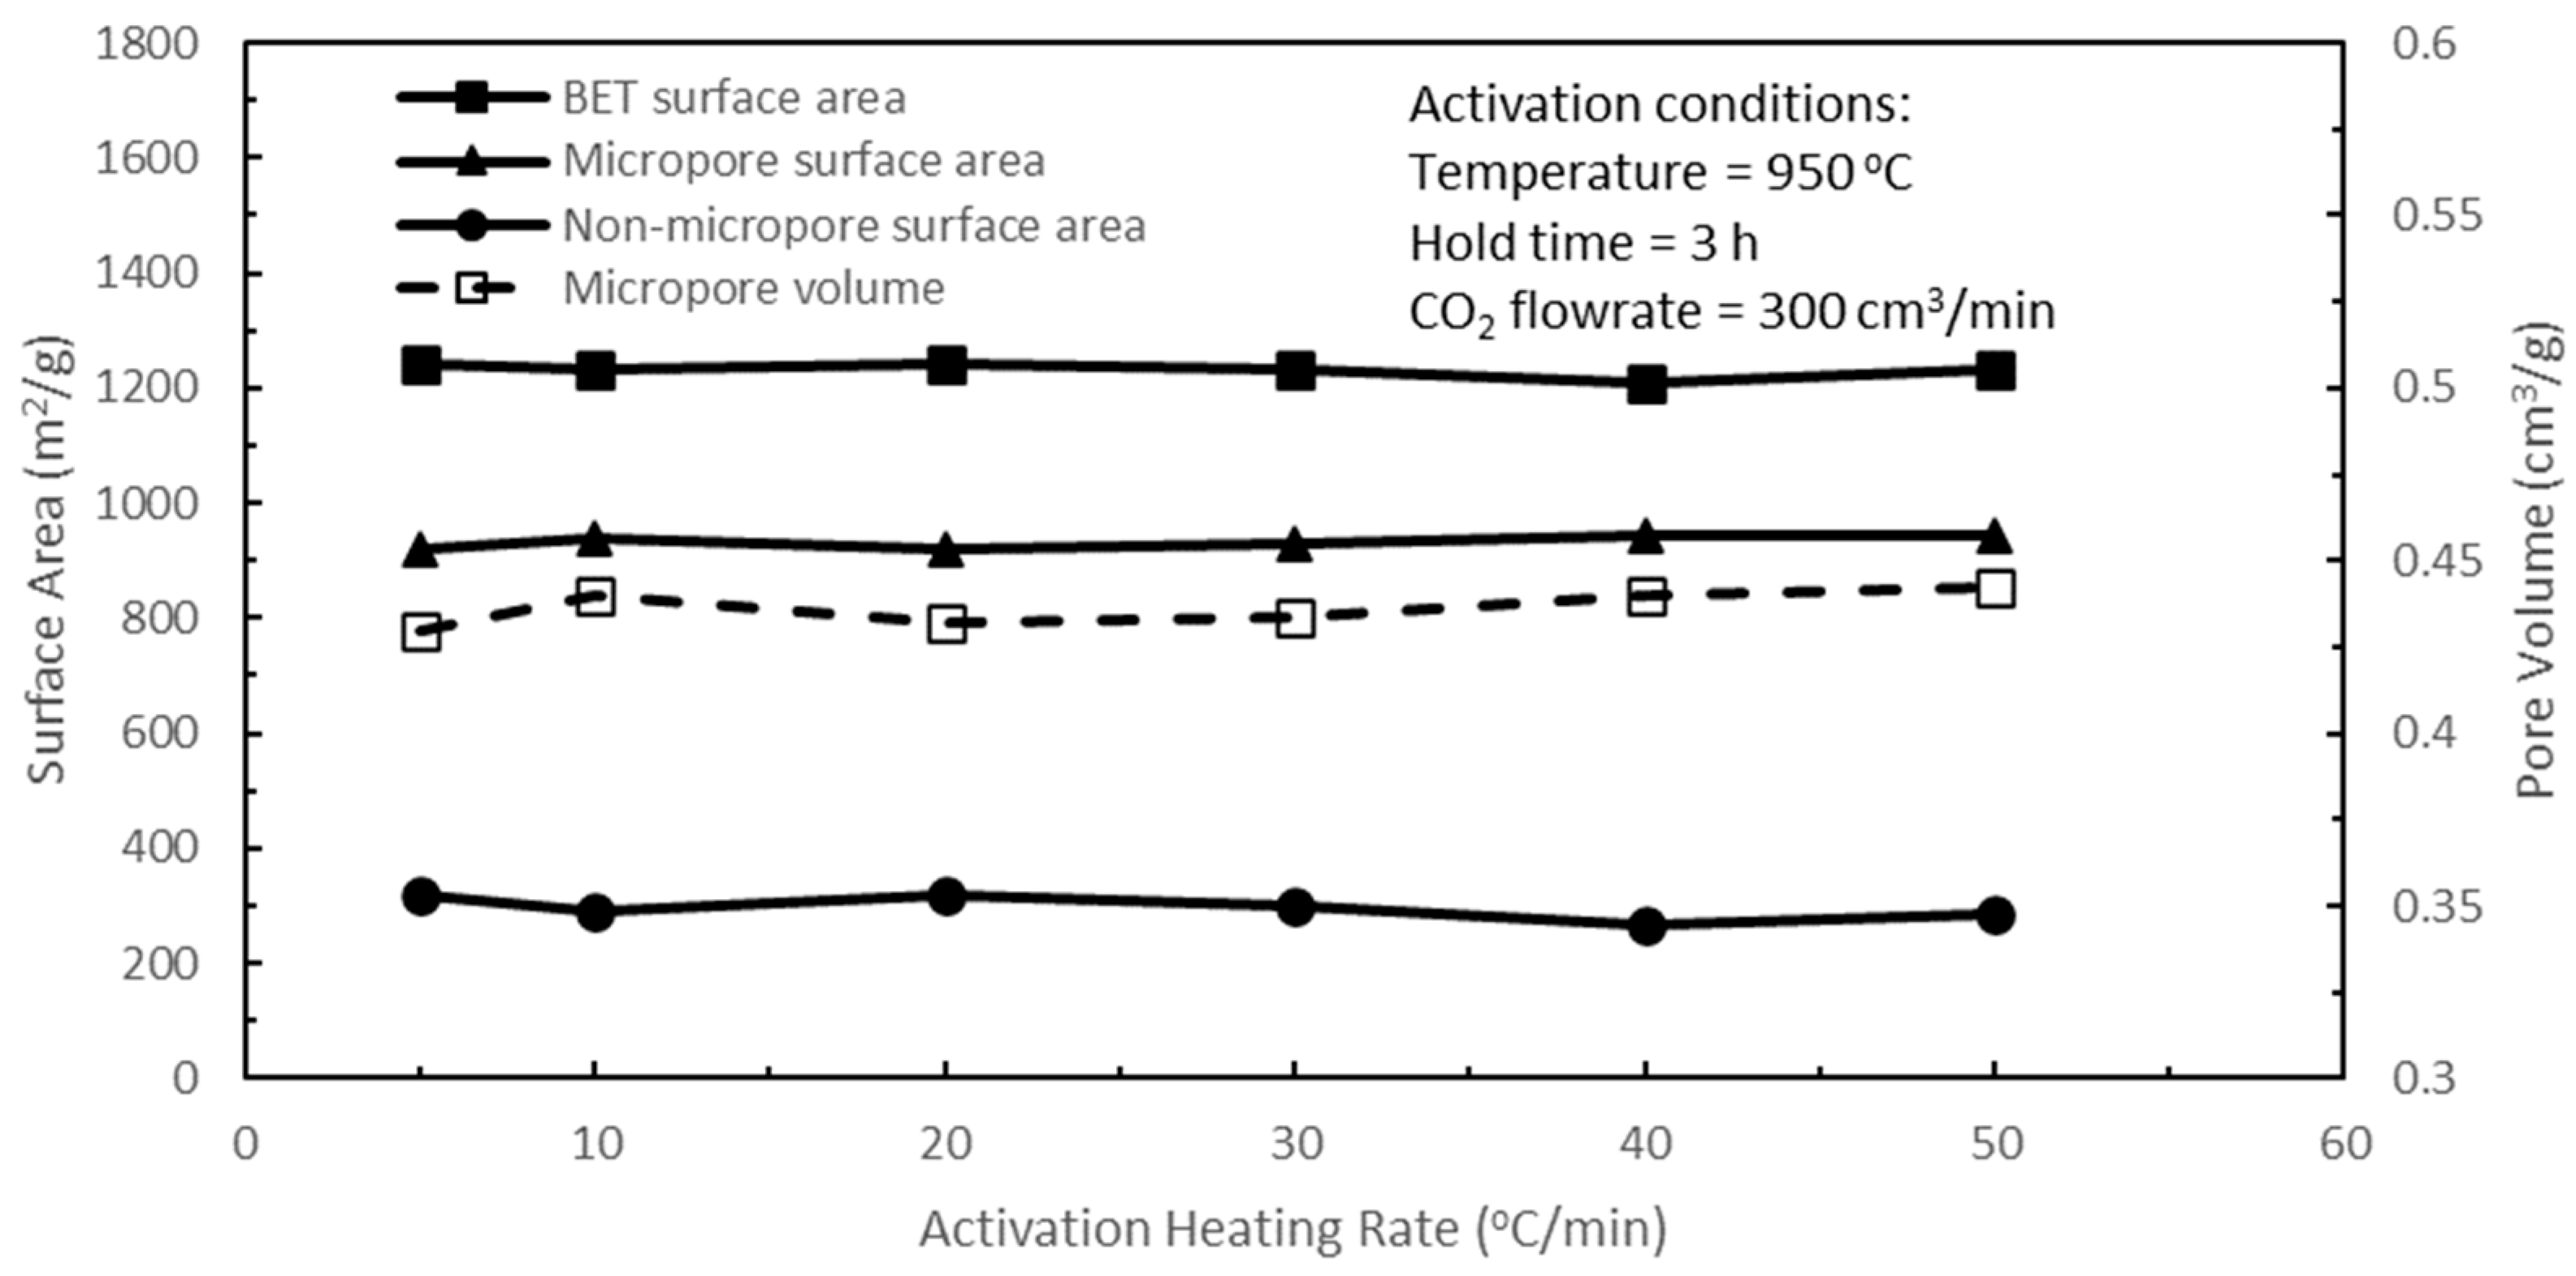
Figure 10 shows the effects of activation heating rate on the pore characteristics of the active biocarbons for a range of heating rates from 5 to 50 °C/min. Overall, the activation heating rate had a lesser influence or weak effect on the variations in the BET, micropore, and non-micropore surface areas, and the micropore volume of the resulting active biocarbons for the heating rates used in these tests. However, in terms of micropore surface area, the heating rate of 10 °C/min had a slight lead over the heating rates of 5, 20, and 30 °C/min, and was comparable with heating rates of 40 and 50 °C/min. The temperature ramp-up time from room temperature to the activation temperature of 950 °C for the heating rate of 10 °C/min was 1.53 h compared to 0.38 and 0.31 h for the heating rates of 40 and 50 °C/min, respectively. As there were still volatile matters in the biochar, this ramp-up duration was an extension of the pyrolysis process, where there could be further release of volatile contents during this period and hence more rudimentary pore development before CO
2 activation. A closer examination of
Figure 10 revealed that the best micropore/BET surface area combination is for a heating rate of 10 °C/min, and hence, the heating rate of 10 °C/min was used for optimising the last remaining activation parameter of hold time.
Using the optimised activation parameters, namely, a temperature of 950 °C, a CO
2 flow rate of 300 cm
3/min, and a heating rate of 10 °C/min, the effects of activation hold time on the pore characteristics of the active biocarbons were studied and presented in
Figure 11. Increasing hold time increased the time duration for the release of any remaining volatile matters still present in the biochar to form more porosities, and at the same time, it also increased the residence time for the CO
2–carbon reaction, which would result in increasing pore development in the active biocarbon due to increasing carbon burn-off. These phenomena could be concurred by the reducing yield of the active biocarbons with increasing the activation hold time as shown in
Table 5, reaching a very low yield of 4.67% for a hold time of 4 h.
Figure 11 shows that the BET and non-micropore surface areas progressively increased with increasing the hold time from 1 to 4 h. However, the micropore surface area and the micropore volume of the active biocarbon peaked at a hold time of 3 h, and thereafter these pore characteristics decreased when the hold time was increased to 4 h. At the hold time of 4 h, it is surmised that there could be excessive carbon burn-off, which resulted in significant pore enlargements and pore wall thinning and collapse, particularly at the surfaces of the active biocarbons, converting micropores into mesopores and macropores. Hence, the BET and non-micropore surface areas continued to increase at the hold time of 4 h. Increasing the hold time from 3 to 4 h, the decreases in the micropore surface area and the micropore volume were gradual, suggesting that the excessive carbon burn-off was a surface phenomenon and the micropores in the interior of the active biocarbon were less affected. A hold time of 3 h was optimal to achieve the largest micropore surface area in the resulting active biocarbon.
To produce an active biocarbon with the largest micropore surface area or the best micropore/BET surface area combination from the pyrolysed biochar, the optimum parameters for the activation process were a temperature of 950 °C, a CO
2 flow rate of 300 cm
3/min, a heating rate of 10 °C/min, and a hold time of 3 h. The largest micropore area or the best micropore/BET surface area combination of the active biocarbon selected for each activation parameter is indicated in
Table 5. The biochar was prepared to yield the largest BET surface area under the optimum pyrolysis conditions, which were a pyrolysis temperature of 600 °C, a pyrolysis hold time of 2 h, a nitrogen flow rate of 150 cm
3/min during pyrolysis, and a pyrolysis heating rate of 10 °C/min. The active biocarbon produced under these optimum pyrolysis and activation conditions had the following physical characteristics, namely, a BET surface area of 1232.3 m
2/g, a micropore surface area of 941.0 m
2/g, a non-micropore surface area of 291.3 m
2/g, and a micropore volume of 0.440 cm
3/g. This active biocarbon consisted of 76.36% micropores, and the remaining 23.64% pores consisted of mesopores and macropores. The proximate analysis of this active biocarbon is given in
Table 4, which shows its yield was 10.05% and this was a significant decrease from the 34.80% yield of its preceding biochar. This decrease in yield was due to the significant weight loss in the fixed carbon content because of the CO
2–carbon reaction, the continual release of the remaining volatile matters within the carbon structure, and the total loss of moisture. The fixed carbon constituted the dominant species composition of the active biocarbon, thereby justifying that the precursor for active biocarbon should have high carbon content. Lastly, highly microporous active biocarbons produced from oil palm kernel shells by pyrolysis in the N
2 stream and physical activation by CO
2 are ideal and suitable for gaseous adsorption and in applications such as CO
2 capture to mitigate global warming impacts on climate change. The feasibility and viability of active biocarbons prepared by CO
2 physical activation of lignocellulosic biomasses for CO
2 capture could be seen in some research studies reported in the literature. Rashidi and Yusup [
16] reported on the preparation of active biocarbon from palm kernel shell (which was the same precursor used in this study here) by one-stage CO
2 physical activation at 850 °C for the uptake of CO
2 at 25 °C and atmospheric pressure of 1 bar, and obtained a maximum CO
2 adsorption capacity of 2.13 mmol/g in a CO
2 environment for an active biocarbon with a BET surface area of 303.9 m
2/g. In another study using similar palm kernel shells as the raw materials for the preparation of active biocarbons by a two-stage process, namely, pyrolysis under N
2 flow followed by activation in CO
2 flow, Nasri et al. [
14] obtained active biocarbon with a BET surface area of 167.08 m
2/g under a pyrolysis temperature of 700 °C and an activation temperature of 800 °C. They further carried out a CO
2 adsorption test for this active biocarbon and obtained a CO
2 adsorption capacity of 1.66 mmol/g in a CO
2 environment under a room temperature of 30 °C and a pressure of 1 bar. From these two studies [
14,
16], CO
2 adsorption by active biocarbon is directly proportional to its BET surface area (inclusive of the micropore surface area) as expected. When compared to the active biocarbons prepared in these two studies [
14,
16], the active biocarbon prepared in this work, with a much greater BET surface area of 1232.3 m
2/g and consisting of a high 76.36% of micropore surface area, certainly surpasses the CO
2 adsorption capacities of the two former active biocarbons. This study also highlighted the importance of optimising the pyrolysis and activation conditions to obtain a maximum possible micropore surface area for the resulting active biocarbon to enhance its CO
2 adsorption capability. Some other studies using two other lignocellulosic biomasses as precursors for preparing active biocarbons by CO
2 physical activation and subsequently used in adsorbing CO
2 are briefly highlighted. Some information and results of these research studies, i.e., the type of biomass, BET surface area, and CO
2 adsorption capacity, are (i) coconut shell: BET surface area of 1327 m
2/g, CO
2 adsorption of 3.9 mmol/g in a CO
2 environment at 25 °C and 760 mm Hg [
25]; (ii) coconut shell: BET surface area of 1046 m
2/g, CO
2 adsorption of 5.0 mmol/g in a CO
2 environment at 0 °C and 1 bar [
26]; and (iii) date seed: BET surface area of 798.38 m
2/g, CO
2 adsorption of 141.14 mg/g (3.21 mmol/g) under a CO
2 flow at 20 °C and atmospheric pressure [
27]. In using other biomasses besides oil palm kernel shell, these studies [
25,
27] also indicated that the CO
2 adsorption capacity was directly proportional to the BET surface area of the active biocarbon under quite similar adsorption temperatures and the same adsorption pressure. It is to be noted that the active biocarbon prepared by Prauchner et al. [
26] yielded a smaller BET surface area than that of Ello et al. [
25] but had a higher CO
2 adsorption capacity because of its lower adsorption temperature of 0 °C. In all these studies [
14,
16,
25,
26,
27], there was no systematic optimisation of the pyrolysis parameters and their subsequent activation parameters to achieve the largest possible BET surface area for each lignocellulosic biomass. In this study, the parameters for pyrolysis, namely, temperature, hold time, N
2 flow rate, and heating rate, and the parameters for the activation process, namely, temperature, hold time, CO
2 flow rate, and heating rate, were thoroughly and fully studied to determine the optimum operating parameters to achieve the largest possible micropore surface area for the final active biocarbons using oil palm kernel shells as the starting materials. This study also provides a blueprint of the process parameters and know-how for the commercial production of active biocarbons from oil palm kernel shells and their possible use to capture CO
2 to mitigate global warming and climate change.


