Article

CFD Simulation of the Interaction Between a Macrobubble and a Dilute Dispersion of Oil Droplets in Quiescent Water

by
Saad N. Saleh
1 and
Shahzad Barghi
2,*
1
Department of Chemical Engineering, Tikrit University, Tikrit 34001, Iraq
2
Department of Chemical and Biochemical Engineering, Western University, London, ON N6A 5B9, Canada
*
Author to whom correspondence should be addressed.
Clean Technol. 2025, 7(3), 65; https://doi.org/10.3390/cleantechnol7030065 (registering DOI)
Submission received: 15 May 2025 / Revised: 23 June 2025 / Accepted: 1 July 2025 / Published: 3 August 2025

Abstract

Wastewater generation is a growing concern in the preliminary treatment of heavy crude oil and tar sand. The separation of fine oil droplets from water by flotation is a critical process in the production of bitumen from tar sand. The flow structure from a high-resolution simulation of a single air macrobubble (>3 mm diameter) rising through water in the presence of a very dilute dispersion of mono-sized oil microdroplets (30 μm) under quiescent conditions is presented. A combined model of computational fluid dynamics (CFD), a volume of fluid (VOF) multiphase approach, and the discrete phase method (DPM) was developed to simulate bubble dynamics, the trajectories of the dispersed oil droplet, and the interaction between the air bubble and the oil droplet in quiescent water. The CFD–VOF–DPM combined model reproduced the interacting dynamics of the bubble and oil droplets in water at the bubble–droplet scale. With an extremely large diameter ratio between the bubble and the dispersed oil droplet, this model clearly demonstrated that the dominant mechanism for the interaction was the hydrodynamic capture of oil droplets in the wake of a rising air macrobubble. The entrainment of the oil droplets into the wake of the rising bubbles was strongly influenced by the bubble’s shape.

1. Introduction

With decreasing sources of crude oil in the world and an increasing demand for energy, tar sand and oil shale are considered attractive commodities for the production of crude oil. Tar sand is a solid material containing sand, minerals, water, and bitumen. Bitumen is a very viscous black oil like heavy crude oil. Bitumen is extracted from tar sand in a complex and expensive process with a negative environmental footprint due to the large amount of water used and the toxicity of the ingredients existing/generated during the extraction process.
Despite the different methods employed in bitumen extraction from tar sand, flotation is a common process that depends on the physical properties of the materials involved. In this process, fine oil droplets are separated from water by attaching to gas/air bubbles and accumulating on top of the vessel in a froth layer. The froth layer is separated later for further processing. This step is crucial not only to increase bitumen production but also for the partial treatment of the generated wastewater. Solvents such as kerosene and surfactants may be used in the flotation process to improve oil separation efficiency.
Multiphase flows, including rising bubbles, have several important industrial applications, such as multiphase reactors, flotation, etc. The production and processing of crude oil, for instance, mainly generate a large amount of oily wastewater, in which oil droplets are the major contaminants [1,2,3,4]. For the removal of fine droplets (<20 μm) such as emulsified oil droplets, a gas flotation process using a surfactant is commonly used due to its high separation efficiency and low operational costs [5,6,7,8]. Without the addition of flocculants, gas flotation also operates effectively when the dispersed oil droplets are larger than 20 μm in diameter [4]. By this process, the contaminated oil droplets are attached to the dispersed bubbles and move toward the water surface, where the contaminants can be removed by skimming.
Based on the bubble generation method, two main types of column flotation units are employed in the oil industry: induced and dissolved gas flotation. In induced gas flotation, the generated bubbles have diameters in the range of 100–1000 μm, whereas in dissolved gas flotation, the bubbles are much finer, with diameters in the range of 10–100 μm [4,9,10]. The generation of fine bubbles substantially enhances the removal efficiency of oil droplets because of the large air bubble interfacial area. However, some drawbacks are associated with the microbubbles generated within the flotation column; for example, the attachment of oil droplets and microbubbles is hindered because both their charges are negative, and operation costs are high due to the additional energy needed to produce microbubbles [11].
Efficient flotation for removing the dispersed oil droplets from wastewater also requires the existence of a quiet-flow hydrodynamic region that can be approximately realized in the flotation column [6,12]. This region is created using a long and narrow column in which the bubbles rise faster than oil droplets. The latter can then approach the surface of the bubble by following the water streamlines that are created by the bubble. This enhances the collision between the oil droplets and the bubbles to form bubble–oil droplet aggregates that rise to the liquid surface. Furthermore, oil flotation efficiency may be improved through the modification of the generated bubble size within the flotation column. In addition to the generation of microbubbles, the generation of macrobubbles with diameters in the range of 0.5–20 mm, also referred to as millibubbles, enhances oil droplet separation [13,14]. The existence of macrobubbles that have a higher rising velocity than microbubbles provides a higher lift to float the oil droplets and subsequently reduces the residence time in the flotation column [15]. It was experimentally demonstrated that for different milli-sized bubbles and droplets, a larger-diameter ratio between the bubble and the oil droplet causes a higher increase in the droplet velocity [16]. As a result, the improved removal efficiency of oil droplets can be attained by using a variety of air bubble sizes.
Oil droplet–bubble attachment is preceded by the collision of oil droplets and gas bubbles. Various mechanisms have been proposed to describe bubble–droplet collision, depending generally on the size ratio of the bubble to the droplet [17,18,19]. Detailed explanations of these mechanisms have been reported in the literature [4,20,21,22]. Briefly, direct impingement with encapsulation of the gas bubble by the oil droplet is the major collision mechanism when the droplet size approaches dimensions of the same order as those of the bubbles. On the contrary, in the case of fine droplets (micrometers), a mechanism of hydrodynamic wake capture was proposed as a plausible mechanism for the capture of oil droplets in the wake of a rising gas bubble, leading to bubble–droplet collision [23]. The wake created by the rising bubble can induce fluid motion, leading to the entrainment of oil droplets. As the bubble rises, it entrains droplets into its wake, carrying them along with the fluid motion. The wake structure typically involves vortices and flow patterns that result from the bubble’s motion. These vortices can affect the overall drag on the bubble, influencing its velocity and trajectory [24].
The mechanism of movement of micro-sized droplets to the surface of a macrobubble is mainly governed by two forces: the inertial and the hydrodynamic drag forces. A comprehensive description of this mechanism can be characterized by considering the fluid streamlines around the bubble, the shape of the droplet trajectory in the fluid flow, and the interactions between the droplet and the bubble surfaces [25]. This description is generally based on the determination of the following dimensionless groups: the droplet Stokes number ( S t d ) and the bubble Reynolds number ( R e b ) that are calculated by Equations (1) and (2).
S t d = ρ d   u b   d d 2 9   d b   μ l
R e b = ρ l   u b   d b   μ l
Here, ρ d is the droplet’s density, u b is the bubble rising velocity, d d represents the droplet’s diameter, ρ l and   μ l represent the liquid density and viscosity, respectively, and d b represents the bubble’s diameter. Based on the droplet Stokes number, which depends on droplet inertia, the finer droplets follow the fluid streamline easily compared to bigger ones. When the Stokes number is large, the droplet motion is dominated by its inertia and is not sensitive to the diverged flow direction. As the Stokes number approaches zero, the inertial forces have practically no effect on the motion of the droplets, which can be considered as inertia-free movement [26].
Identifying the flow regime in proximity to a bubble can be determined by predicting the bubble Reynolds number, at which the behavior of the fluid streamlines around the bubbles can be estimated. In relation to the bubble Reynolds number, two extreme flow types have been depicted: the Stokes and potential flow. The Stokes flow occurs when the R e b is very much less than unity and potential flow occurs at (80 < R e b < 500), at which the flow behaves like nearly in an inviscid flow [27]. In general, when R e b < 500 and the initial velocity of the liquid phase caused by the rising bubble is nearly zero, the single bubble flow is assumed to be laminar [28]. For instance, for a rising bubbles in a micro-sized (<20 μm) oil droplet–water system, the calculated Stokes number is less than one over a range of macrobubbles (>1 mm diameter), thus indicating that the mechanism of hydrodynamic wake capture is the dominant factor for bubble–droplet collision.
Computational fluid dynamics (CFD) has been used as a sophisticated modeling technique to investigate the mechanism of bubble–droplet collision. Cai et al. [29] developed a CFD model combined with a Population Balance model to study the collision and coalescence process of oil droplets. However, little attention has been paid to the CFD modeling in the study of hydrodynamics. Xu et al. [30] developed a coupled VOF-DPM model to simulate the motion of an individual bubble in an air–water–resin particle system. Their simulated results showed that the particle was moved up due to the bubble wake flow, and the particle’s removal was increased with increasing the bubble size. Numerical investigations of the wake structure of a rising bubble with entrained particles in a liquid–solid system revealed that there are typically three regions that have been distinguished in the bubble wake. These regions are called the stable bubble wake region, fluctuating bubble wake region, and vortex tail region [31].
The aim of this paper is to develop a CFD model to clearly simulate the dynamic behavior of a single air macrobubble of the size range of 3–10 mm rising in very dilute dispersed oil mono-sized microdroplets in a water system under a quiescent condition. This paper also aims to demonstrate that the mechanism of the microbubble–oil droplet interaction is the hydrodynamic capture of dispersed oil droplets in the wake of a rising air macrobubble.

2. CFD Model Formulation

A combined model (bubble–droplet scale) composed of the volume of fluid model (VOF) and the discrete phase method (DPM) was developed to capture the interaction between a rising macrobubble and a very dilute dispersion of an oil droplet–water system under a quiescent condition. Three bubble sizes were considered in this work: 3, 6, and 10 mm. Table 1 lists the main physical properties of the system simulated by the CFD model. The concentration of oil (Cyclohexane) in the system is present in minute quantities at a ppm level with a monodispersed oil droplet of 30 μm in size. Under isothermal conditions, it is a reasonable assumption to neglect the gas density variation, and, consequently, the system of rising bubbles in quiescent liquid can be modeled by the Eulerian approach [32,33].

2.1. Governing Equations

Both the air bubble and liquid phases, assumed to be continuous and incompressible, were modeled using the Eulerian approach, sharing the same continuity and momentum equations. Due to their low volume fraction, oil droplets were considered the discrete phase and modeled using the Lagrangian method.
The continuity and momentum equations of incompressible fluid are
· u = 0
ρ u t + · ρ u u = p + · μ   u + u T + ρ g + F s f + F d
where u represents the velocity vector, p represents the pressure, and g represents the gravitational acceleration vector. The volume fraction averaged density ( ρ ) and viscosity ( μ ) of the mixture follow the mixing rule outlined below:
ρ =   α l · ρ l + 1 α l · ρ g
μ = α l · μ l + 1 α l · μ g
where α l is the volume fraction of the liquid phase.
F s f , F d in Equation (4) denote the phase interaction forces from bubbles and droplets. F s f   represents the surface tension force, and F d represents the momentum exchange force acting on the fluid phase from the droplet.

2.2. Volume of Fluid Model

The VOF model can model two-phase or more immiscible fluid flow by solving a single set of momentum equations and tracking the volume fraction of each of the fluids throughout the domain [34,35]. The tracking of the interface(s) is accomplished by the solution of a continuity equation for the volume fraction of one (or more) of the phases.
The volume fraction continuity equation is given by
α l t   + u l · α l = 0
Since the volume fractions of all phases must add up to one, the volume fraction of the gas phase ( α g   ) can be calculated using the following constraint:
α l + α g =   1
The surface tension F s f plays a crucial role in determining the shape of the bubble and can be computed using the continuum surface force (CSF) model [36]. F s f can be expressed as
F s f = σ ρ κ α 0.5   (   ρ g ρ l )
where σ is the surface tension coefficient and κ is the gas–liquid interface curvature, which is defined in terms of the divergence of the normal unit vector, n ^   :
κ = · n ^
where
n ^ = n n , n = α l  

2.3. Discrete Phase Model

Since the volume fraction of the dispersed oil droplets is lower than 10% in most applications of oil-in-water emulsion systems, the DPM model based on the Lagrangian approach is adopted to simulate the oil droplet phase. The trajectory of an individual droplet is calculated by integrating the forces on the droplet within a Lagrangian reference frame [37], assuming no collisions. This force balance equates the droplet inertia with the forces acting on the droplet according to Newton’s second law. The motion of a single droplet without collision can be written as follows:
d u d d t = F D u l u d + g ( ρ d ρ ) ρ d
where u l is the liquid velocity vector, u d is the droplet velocity vector, and the force F D u l u d represents the drag exerted on the droplet by the liquid flow, which is calculated using F D , defined as
F D = 18 μ l ρ d   d d 2 C D   R e d 24
where R e d is the Reynolds number of the droplets, which is defined as follows:
R e d = ρ l d d     u d u l μ l
C D represents the droplet–liquid drag force coefficient, which is defined as
C D = a 1 + a 2 R e d + a 3 R e d 2
where a1, a2, and a3 are constant parameters depending on the R e d [38].
The forces acting on a droplet from the liquid principally is the drag force F D u l u d [39].
That is
F d = F D u l u d
It is noted that the DPM model is acceptable with the limitation that the discrete phase volume fraction is less than 15% [40,41]. In most applications for disperse flow, the volume fraction of the disperse phase is very small (<10−4), and, therefore, the particles have a negligible effect on the motion of the continuous phase [42,43]. In this study, the droplet volume fraction lies well below the constraint.

3. Numerical Solution

Studies show that two-dimensional numerical simulations can provide plausible results for single rising bubbles, particularly when the flow is axisymmetric under a laminar condition, such as for a single spherical bubble rising in quiescent water [44,45]. For axisymmetric cases, 2D models can capture essential features like vortex shedding with reasonable accuracy. In addition, 2D models are computationally efficient and simpler and faster, making them practical for preliminary analysis. While 2D simulations are feasible, they have limitations, especially for capturing complex 3D effects. It seems likely that for larger bubbles or higher Reynolds numbers, where the bubble may deform significantly or follow non-axisymmetric paths (e.g., zigzag or spiral), 2D models may miss critical phenomena. However, in the current study, the simulation was carried out for a short distance from the release point (around 9 db (bubble diameter)), where the bubbles conserve the axisymmetric shape and largely ascend in a rectilinear path prior to the development of the zigzag or spiral motion [46]. A transient two-dimensional computational model was used to simulate and analyze the fluid dynamics of the collision mechanism at the bubble–droplet scale. The simulations were performed on a rectangular computational domain of length (L) and height (H) in Cartesian coordinates (x, y), as shown in Figure 1. According to the macrobubble diameter db, the computational domain was designed to closely resemble the rising and deformation of the macrobubble where the domain size in the vertical direction is taken as H = 10 db and in the horizontal direction is taken as L = 6 db. This ensures that the side vertical wall effect on the rising bubble is negligible in the simulation, allowing the domain to be treated as an infinite medium. The initial configuration is identical for the three applied cases and consists of a circular bubble of diameter db centered at (0, 1db) in the rectangular domain (Figure 1). The free slip boundary condition is applied at the bottom and vertical side walls, whereas a flow-out boundary condition is applied at the top outlet in order to avoid reflection issues. Sixty streams of oil droplets (30 µm) were injected in a straight line of 2 db long above the bubble with 2 db from the bottom boundary. The CFD software ANSYS-Fluent R16.0 software package was applied for the numerical simulation of the CFD–VOF–DPM combined model presented in Section 2. The 2D geometry was created in Ansys using Design Modeler. The domain was then meshed using Ansys Meshing. The computational domain was meshed into a structured grid of quadrilateral elements. The grid mesh must be sufficiently fine in order track the liquid–bubble interface precisely and capture the movement of the oil droplets. A mesh independence study was conducted using different element sizes of db/35, db/50, and db/70, which correspond to 210 × 350, 300 × 500, and 420 × 700 grid meshes, respectively. The influence of grid size on the simulation results was tested by computing the rising velocity of the bubble with a diameter of 3.00 mm in quiescent water. Figure 2 shows the influences of the grid size on the simulation results, where the bubble’s motion was tracked over a period of 0.10 s. It can be seen that the profiles of bubble rising velocity were nearly identical for grid meshes of 300 × 500 and 420 × 700, while a noticeable deviation appeared with the coarse 210 × 350 grid. It indicated that the grid meshes of 300 × 500 and 420 × 700 were considered sufficiently fine for reliable simulations, and the coarse grid mesh of 210 × 350 might lead to discrepancies. It was found that the grid mesh of 300 × 500 with fifty cells across the bubble diameter was sufficient for the numerical simulations. This grid mesh was finer compared with numerical studies [44,45] in which the bubble was meshed with about twenty-five mesh elements. This means that the 3, 6, and 10 mm diameter bubbles were resolved with element sizes of 0.06, 0.12, and 0.2 mm, respectively.
The governing equations of the combined model were discretized numerically using the finite volume technique in the ANSYS-Fluent R16.0 software package. Then, the discretized equations for the discrete and continuous phases were solved sequentially. Unsteady particle tracking treatment was used in the DPM method at a particle time step size of 1 × 10 5 s. The maximum number of tracking steps was set at 5000 to ensure completeness of particle tracking. A total physical flow time of 0.5 s was applied. For the pressure velocity coupling scheme, the SIMPLE algorithm was used. The geo-reconstruct scheme was used as the spatial discretization for the volume fraction to track the free surface between the gas and the liquid. The second-order upwind scheme was adopted as the spatial discretization for momentum. The convergence criterion that is adopted to ensure simulation accuracy was set at 1 × 10 6 .

4. Results and Discussion

4.1. Model Validation

CFD simulations of rising bubbles in quiescent water are frequently validated by qualitatively comparing the bubble shape evolution with images from corresponding experiments [47,48,49]. Various dimensionless numbers, such as the Morton (M) and Eötvös (Eo) numbers, have been used to describe the rising bubble shape [50]. The bubble M and Eob numbers are defined as
E o b =   ρ   g   d b 2 σ , M =   ρ   g   μ l 4   ρ l 2   σ 3
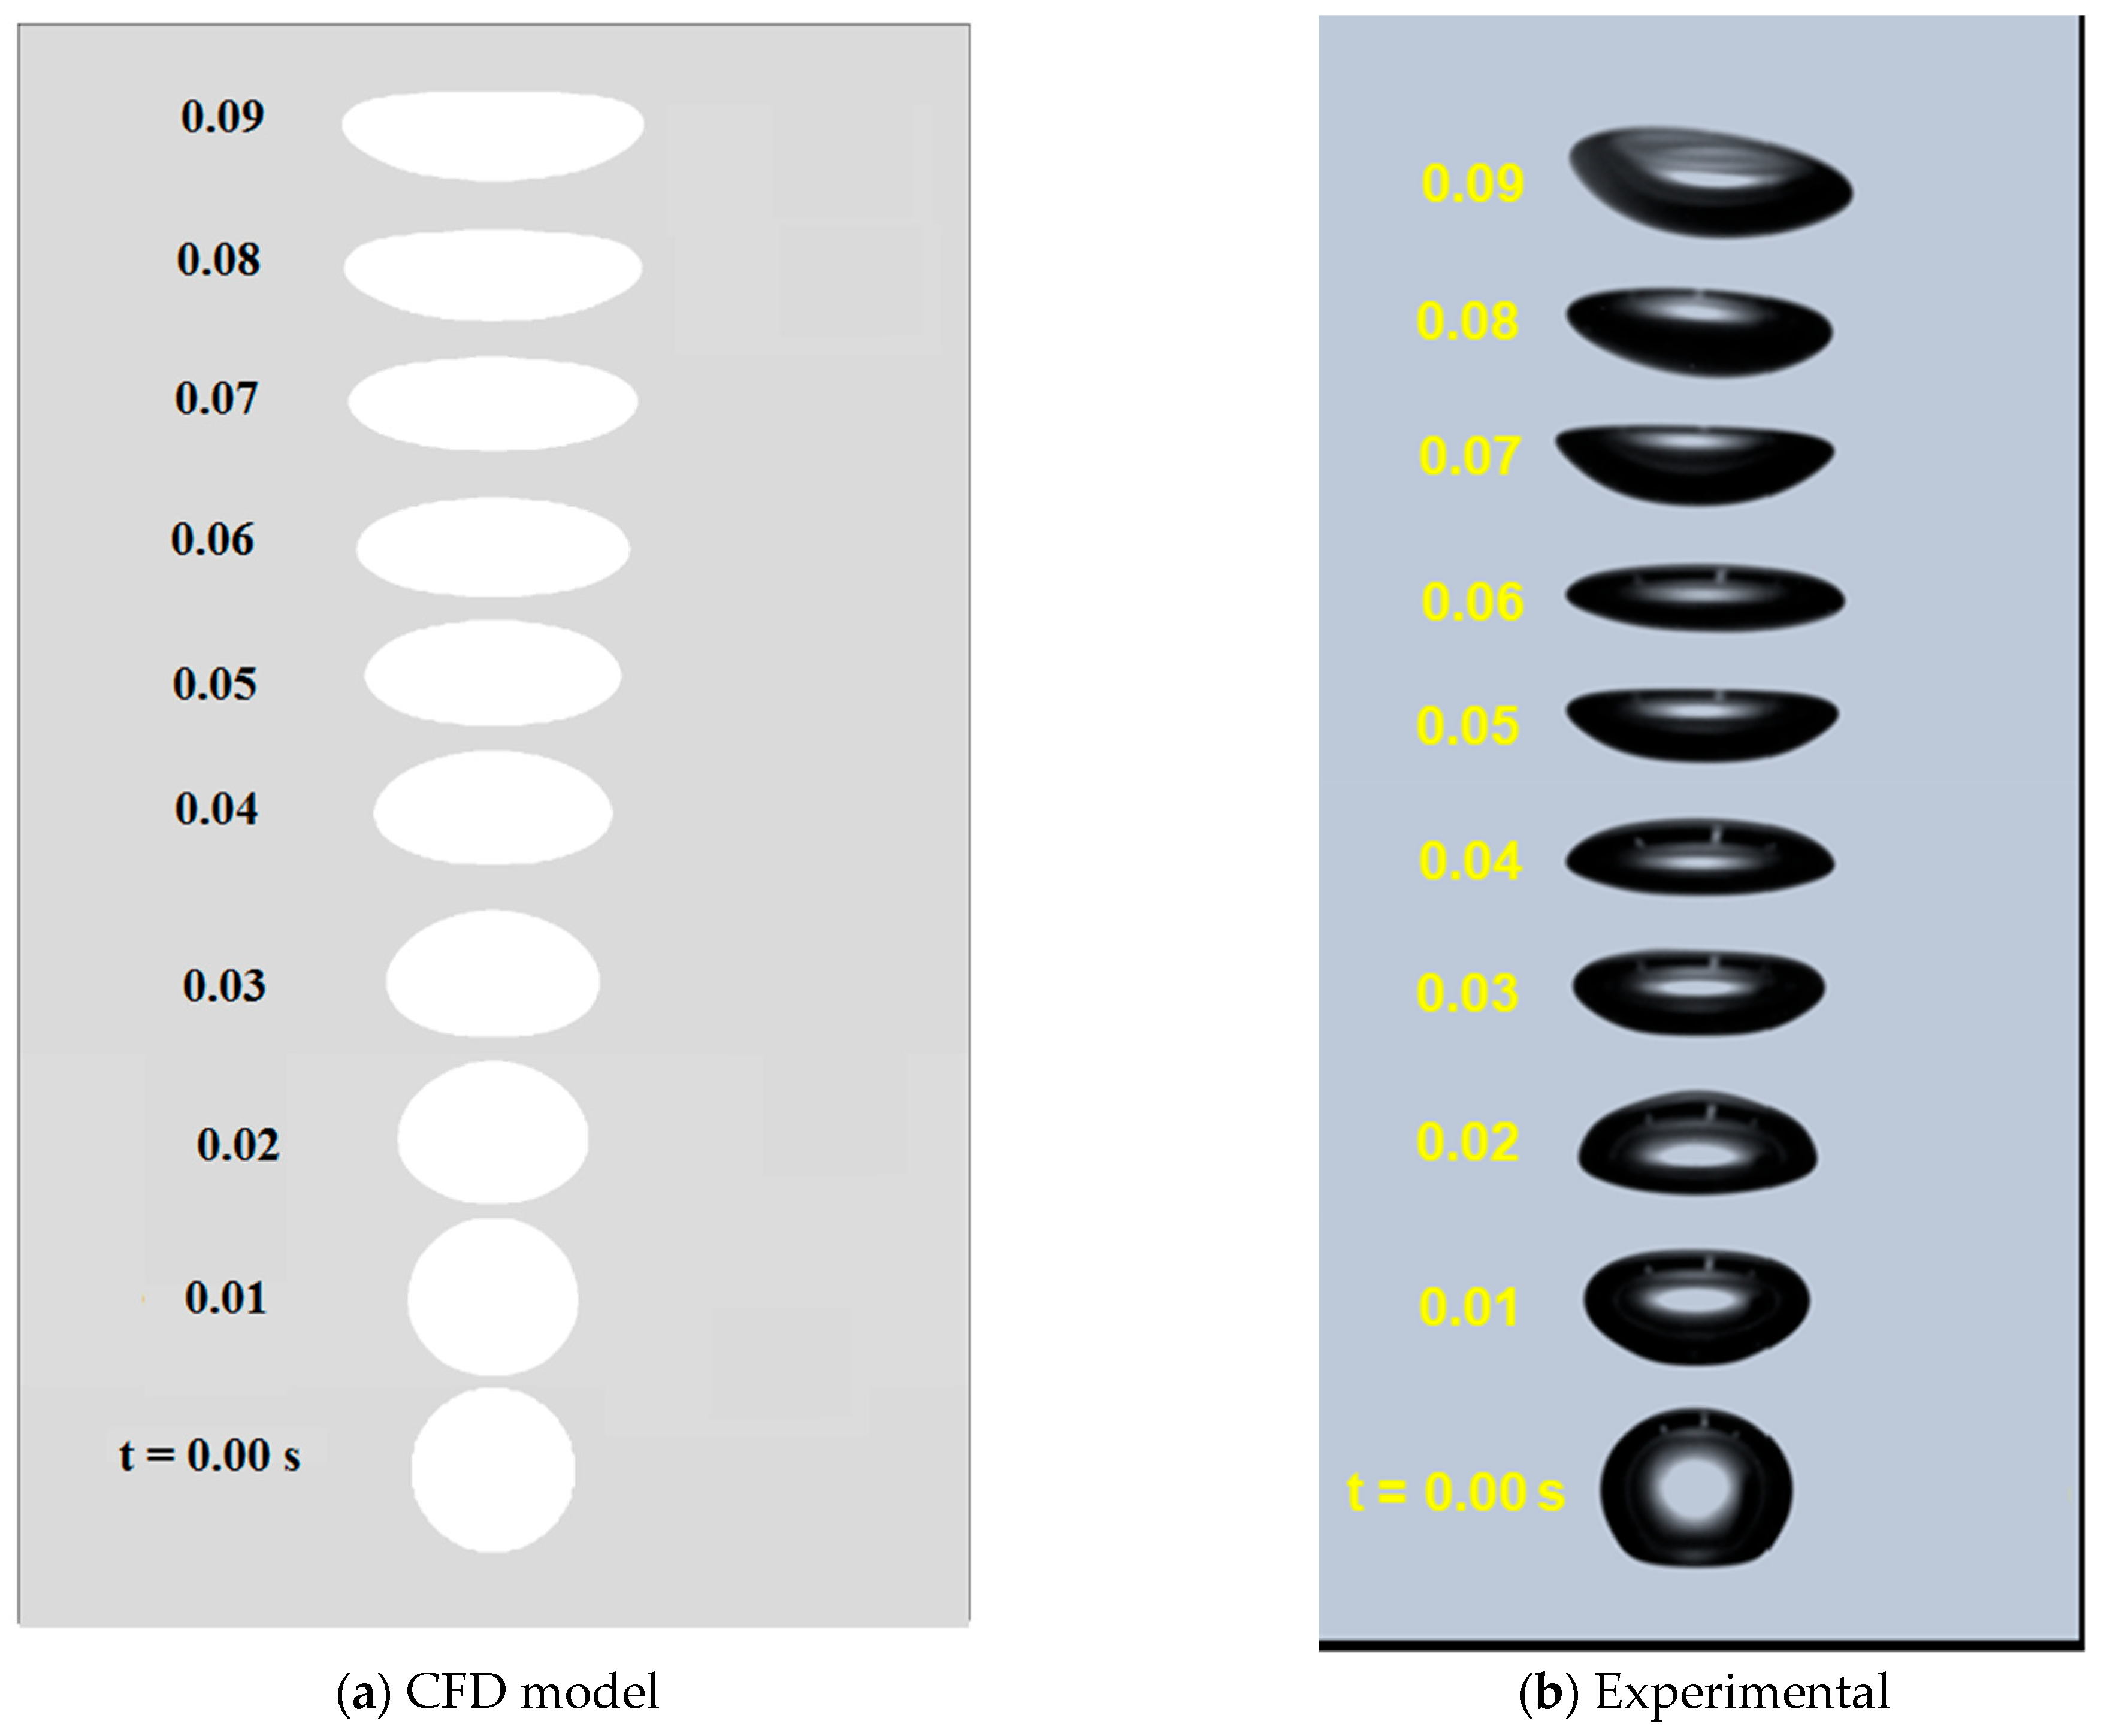
The validation was performed by analyzing how the simulated bubble shape evolves and comparing its aspect ratio with updated experimental results for a bubble size of 3.08 mm under the condition of a very low Morton number (2.60 × 10⁻¹¹).
As shown in Figure 3, the evolution of the simulated shape of the bubble CFD that was simulated was in excellent agreement with the experimentally observed bubble shapes reported by Hoque et al. [46] under the same conditions of Reb and Eob and physical properties.
Based on a comparison with the experimental observations published in the literature [50], the CFD simulation of a rising macrobubble in quiescent water can be further validated quantitatively by considering the changing of the bubble aspect ratio with time. The aspect ratio is defined as the ratio between the diameters perpendicular and parallel to the direction of motion of the bubble [51,52].
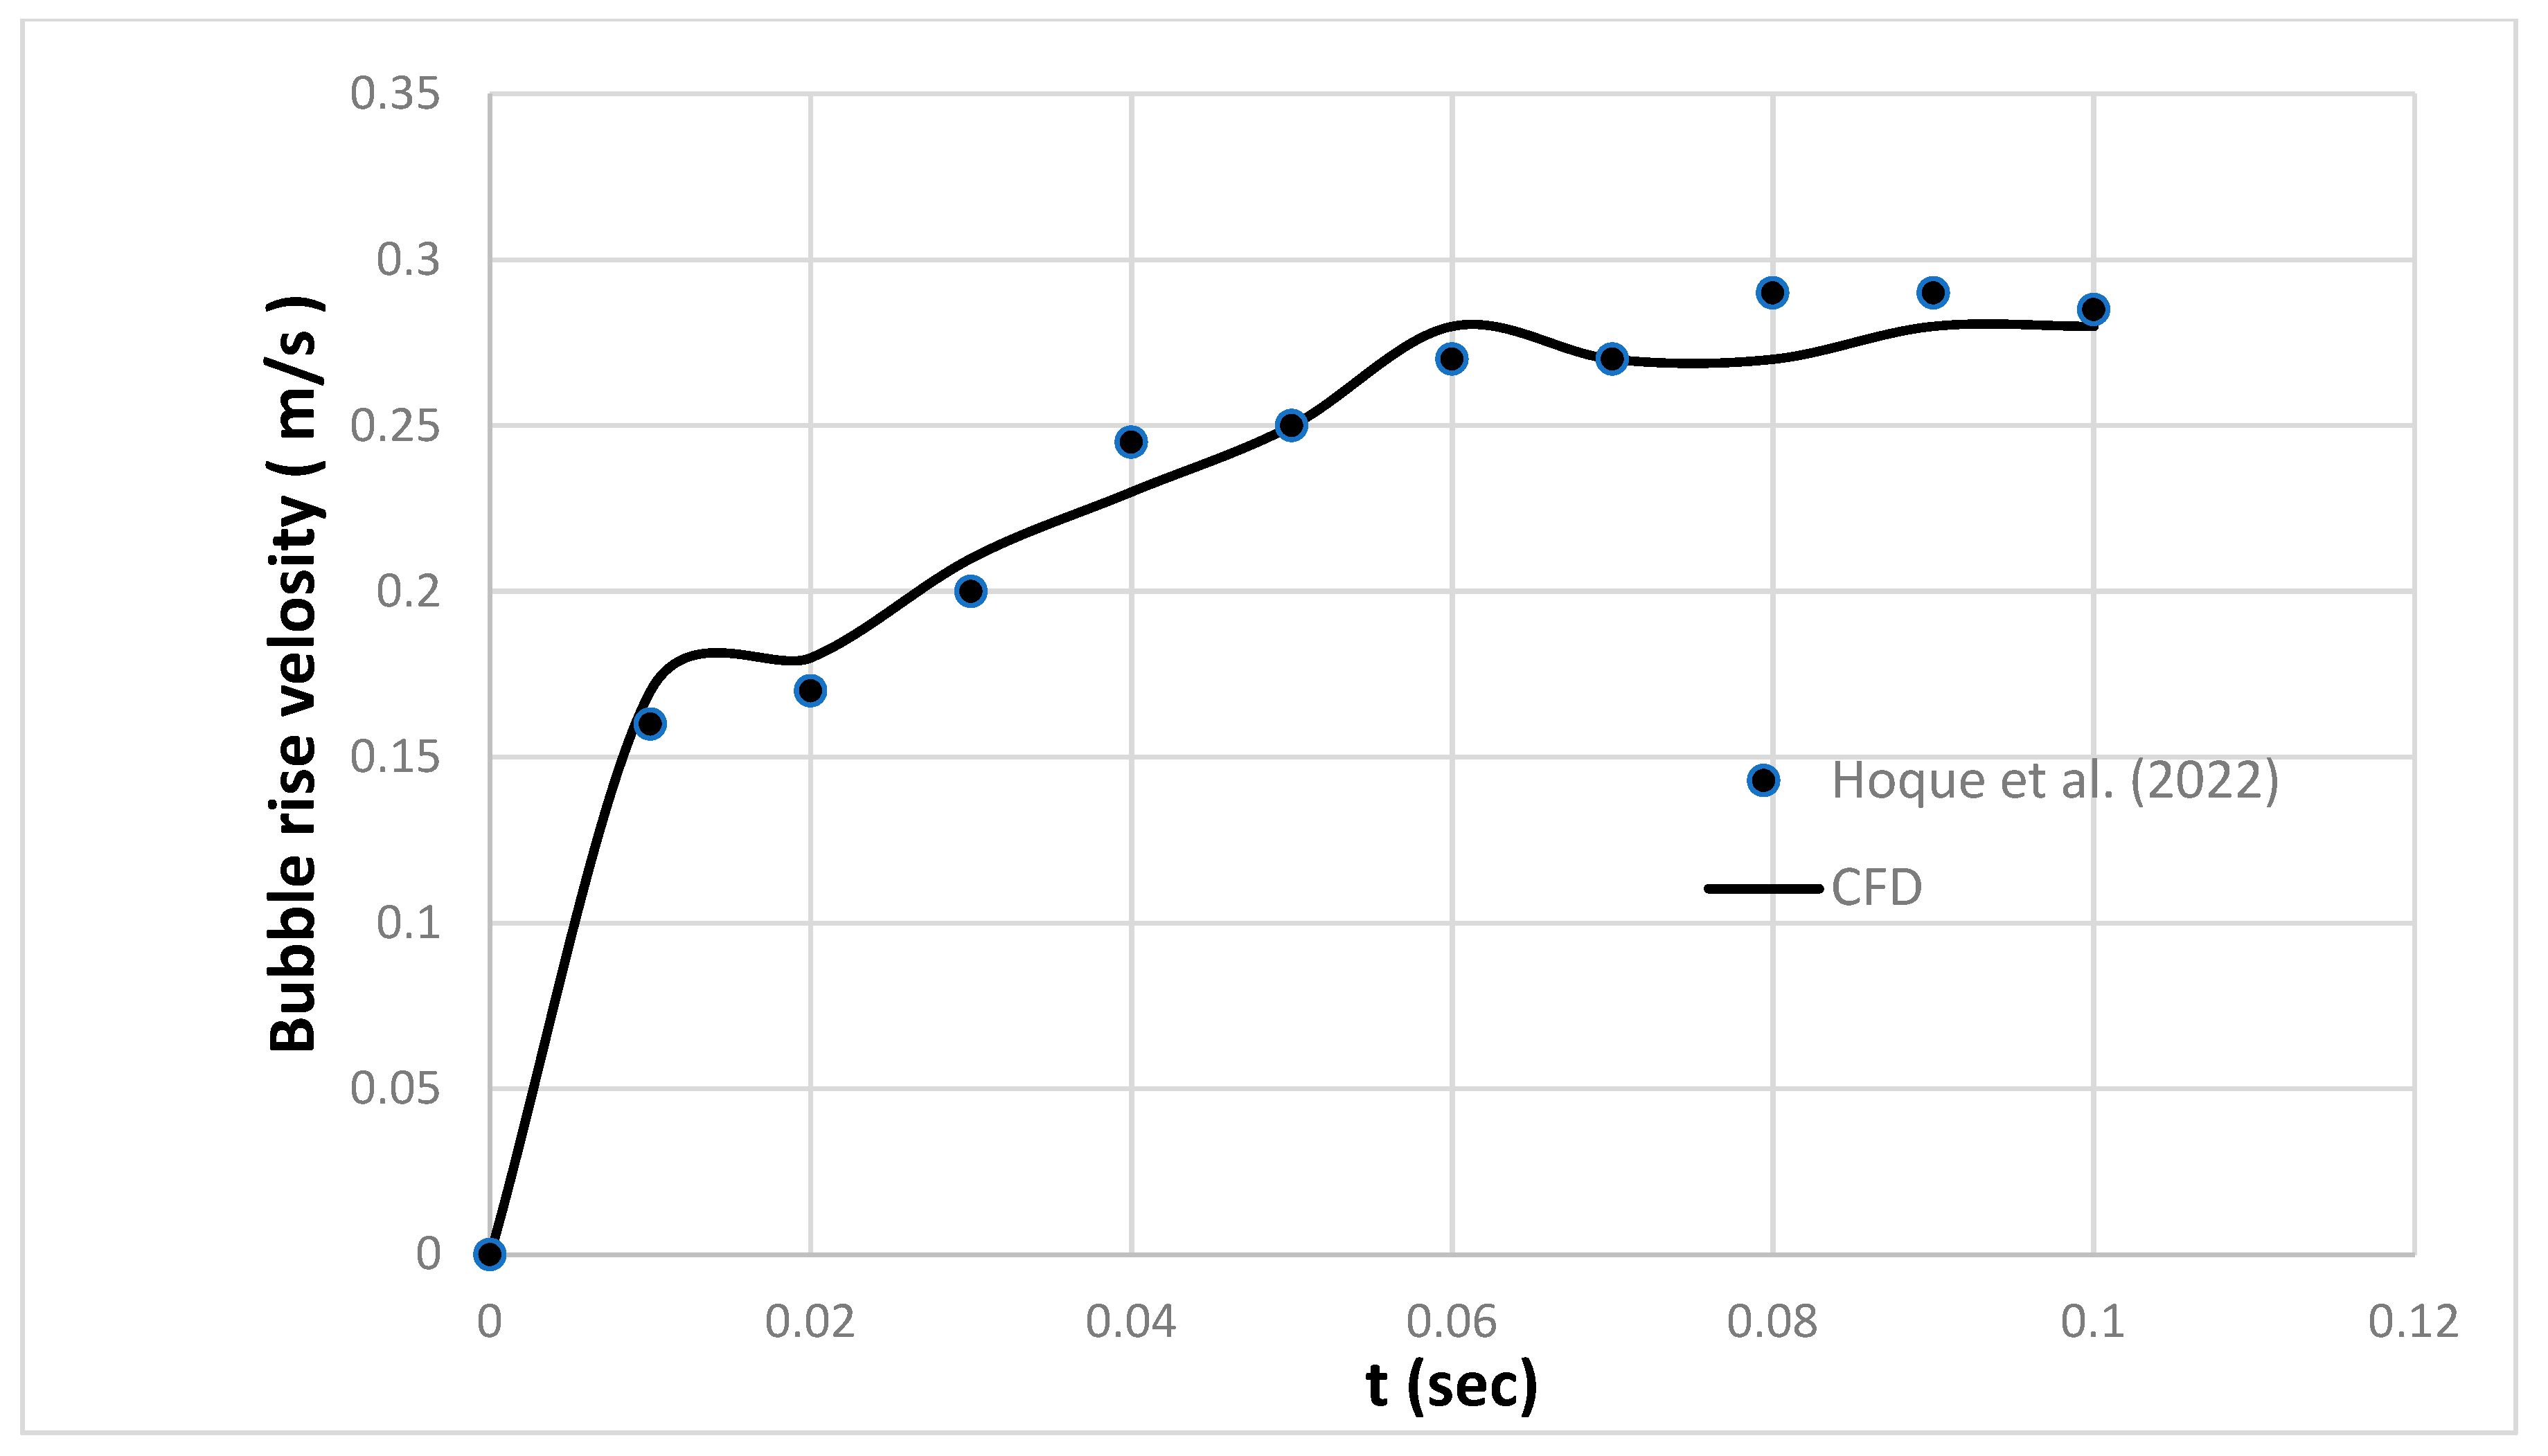
The simulated result of the bubble aspect ratio against the time is shown in Figure 4. The simulated aspect ratio curve gradually increases with time, and an excellent agreement with the experimental data [46] is demonstrated, confirming the model’s validity and accuracy. Figure 5 demonstrates an additional quantitative validation where the simulated bubble rise velocity of a bubble of 3.53 mm in quiescent water shows a good agreement with the experimental data [46], supporting the reliability of the VOF approach in capturing both bubble dynamics.

4.2. Bubble Dynamics

Numerous experimental studies have been conducted on the movement of air bubbles in various fluids, analyzed as a function of dimensionless numbers like the bubble Reynolds (Re), Morton (M), and Eötvös (Eo) numbers [53,54,55,56]. Under the condition of a very low Morton number (2.60 × 10⁻¹¹), air macrobubbles in the size range of 3–10 mm highlight the regime of wobbling shape according to the Grace Diagram [50]. These bubbles exhibit oscillations in their shape and movement, driven by the bubble wake defined as the downstream region with non-zero vorticity [57].
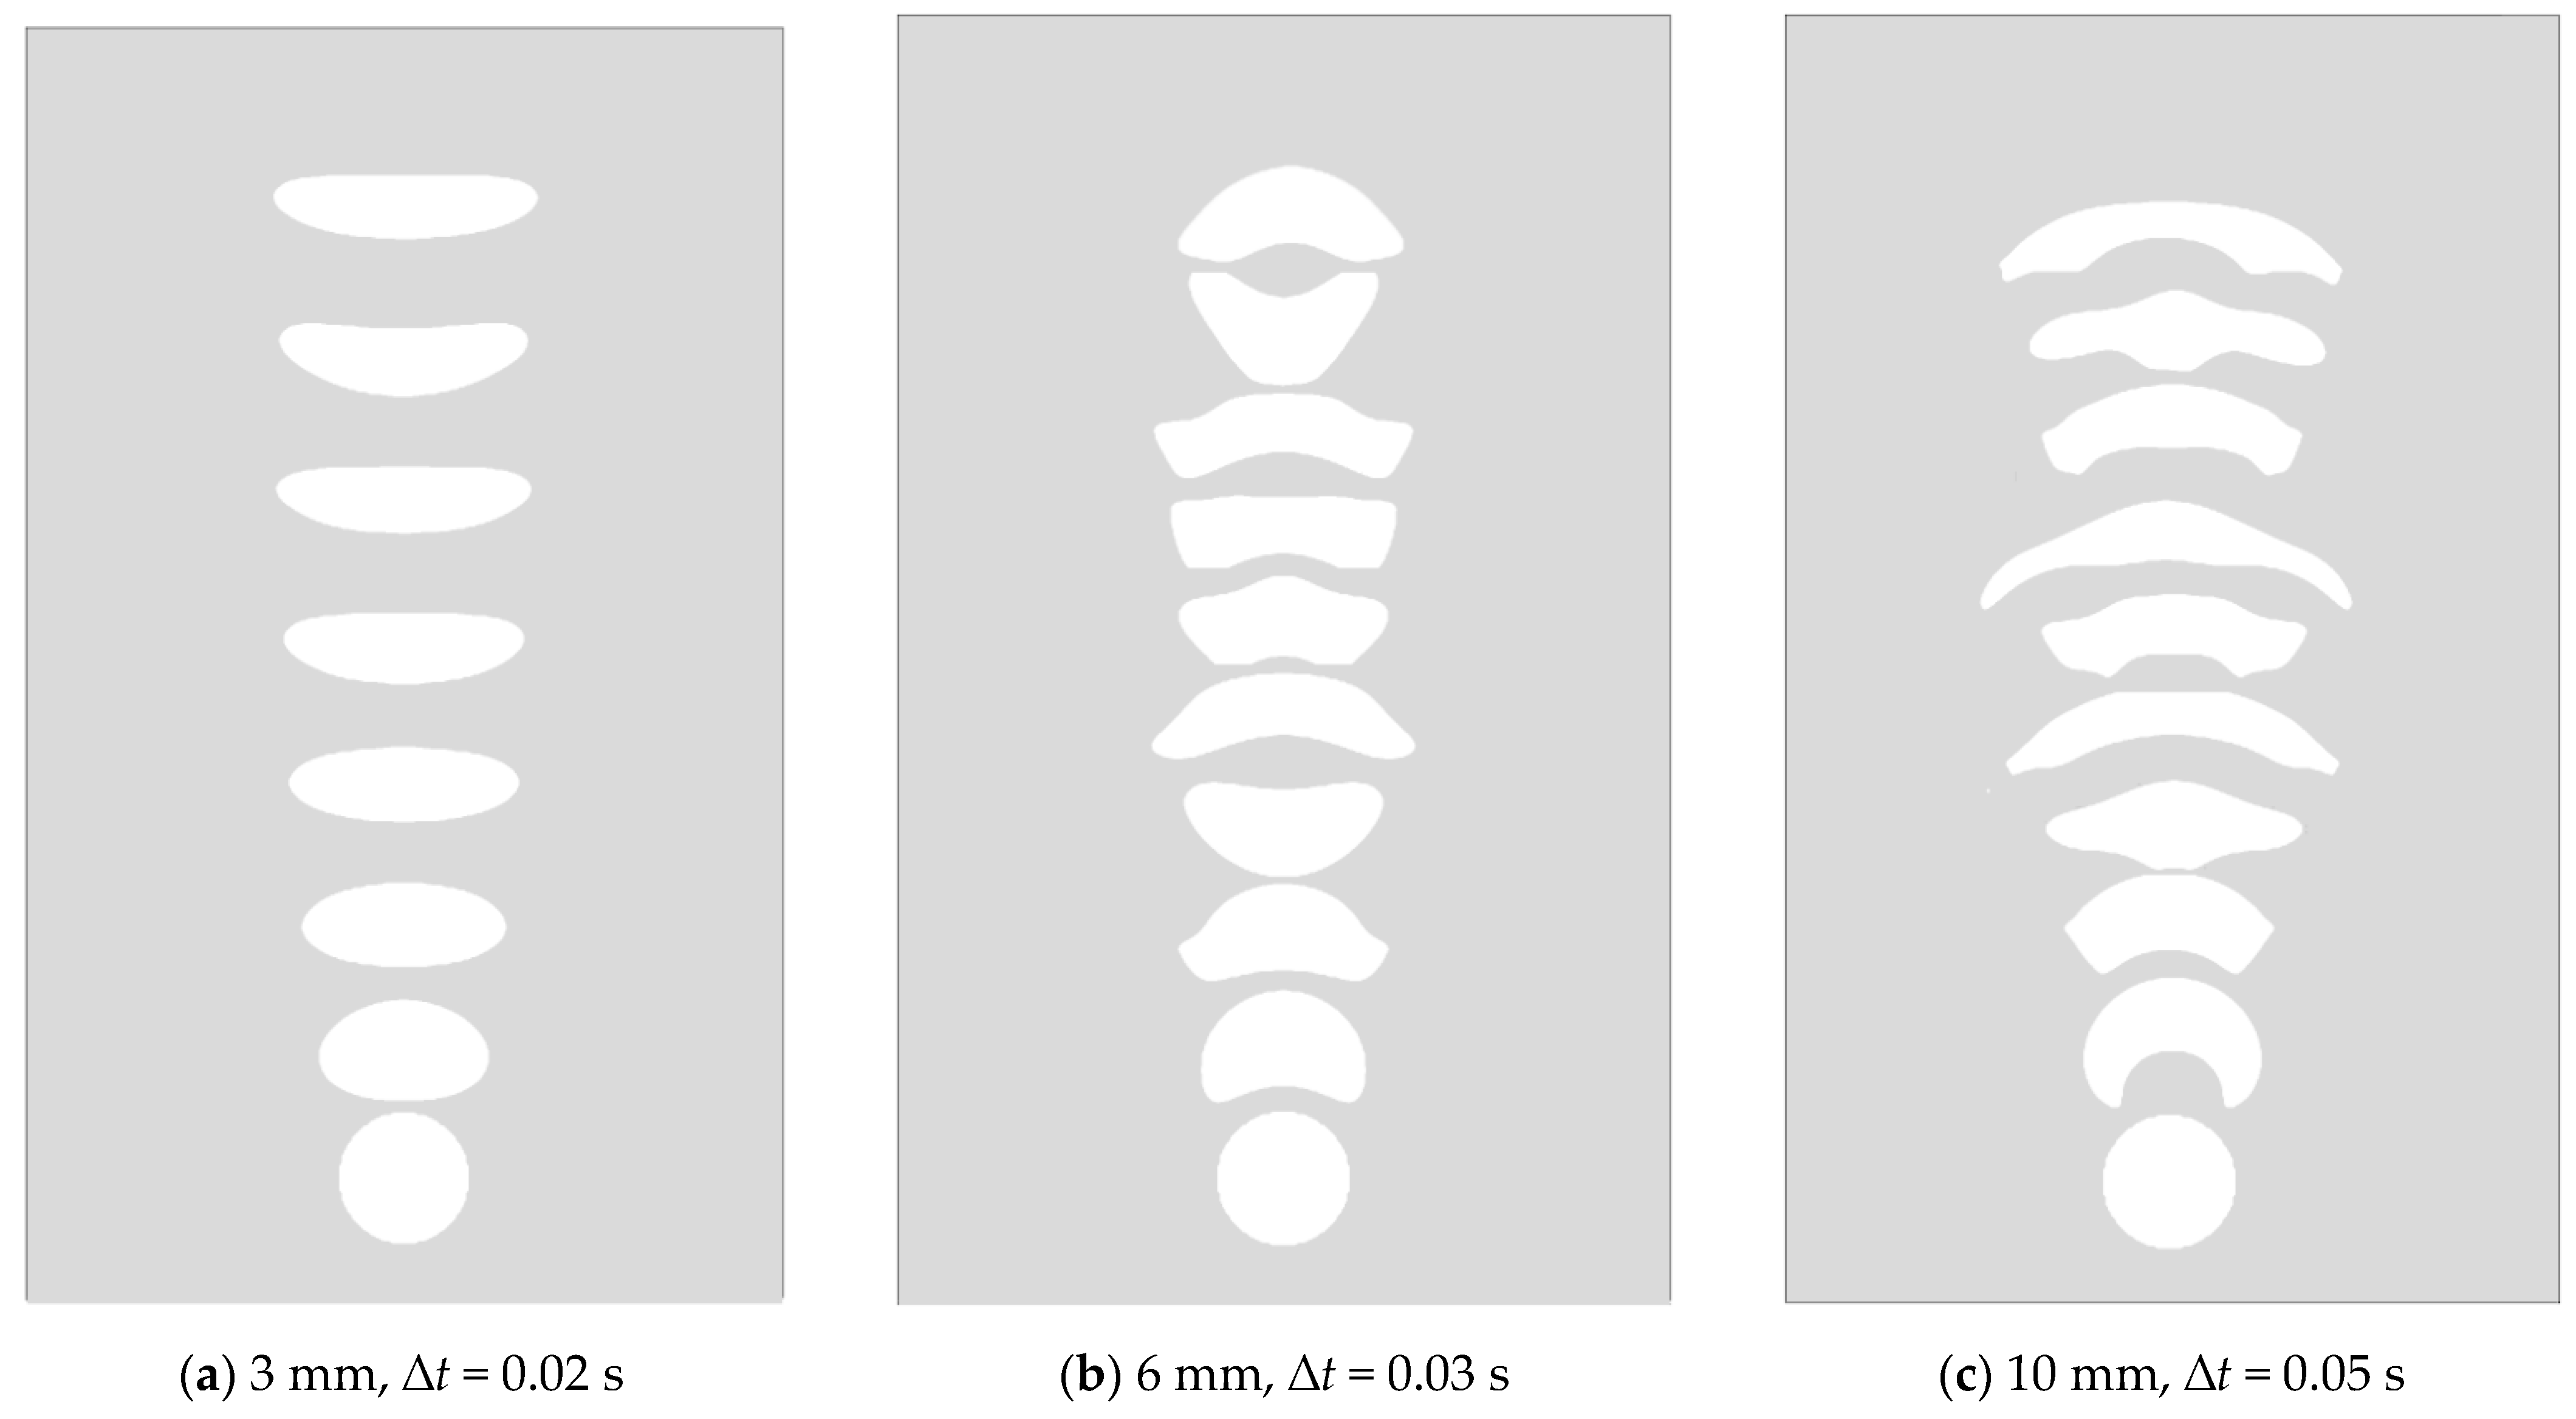
Figure 4 illustrates the time evolution of the rising bubble shape for 3-, 6- and 10-mm bubble sizes which correspond to Eob of 1.3, 4.9, 13.6 respectively. In general, the simulated bubble rises in a straight trajectory with the evolution of the shape from an initial spherical form to distinctly different shapes according to the bubble size. The evolution of the final bubble shape was consistent with the bubble shape classifications outlined in the Grace Diagram [56]. As shown in Figure 6a, the smaller bubble (3 mm) takes on an elliptical shape with a smooth surface, whereas, for the larger bubbles (6 and 10 mm), the surface becomes disrupted, and the shapes grow irregularly. The evolution of the shape into like a bird flapping its wings was very clear in the case of the 10 mm bubble in Figure 6c. Flapping wing bubbles have been reported in many studies [58,59,60]. The evolution of the simulated shape of the 10 mm bubble was in excellent agreement with the experimentally observed bubble shapes reported by Krishna [58] under the same conditions of Reb and Eob and physical properties. It is worth noting that the simulated bubble shape was like that observed in the single-phase liquid [46], where the simulated bubble shape was not influenced by the presence of the oil droplets and its momentum can be ignored when compared to the forces affecting the bubble shape.

4.3. Hydrodynamic Flow Field

In addition to the bubble shape evolutions, hydrodynamic flow fields induced by the rising of macrobubbles were considered by analyzing the simulated axial liquid velocity through the domain. The rising bubble significantly affects the flow patterns according to its size and shape.
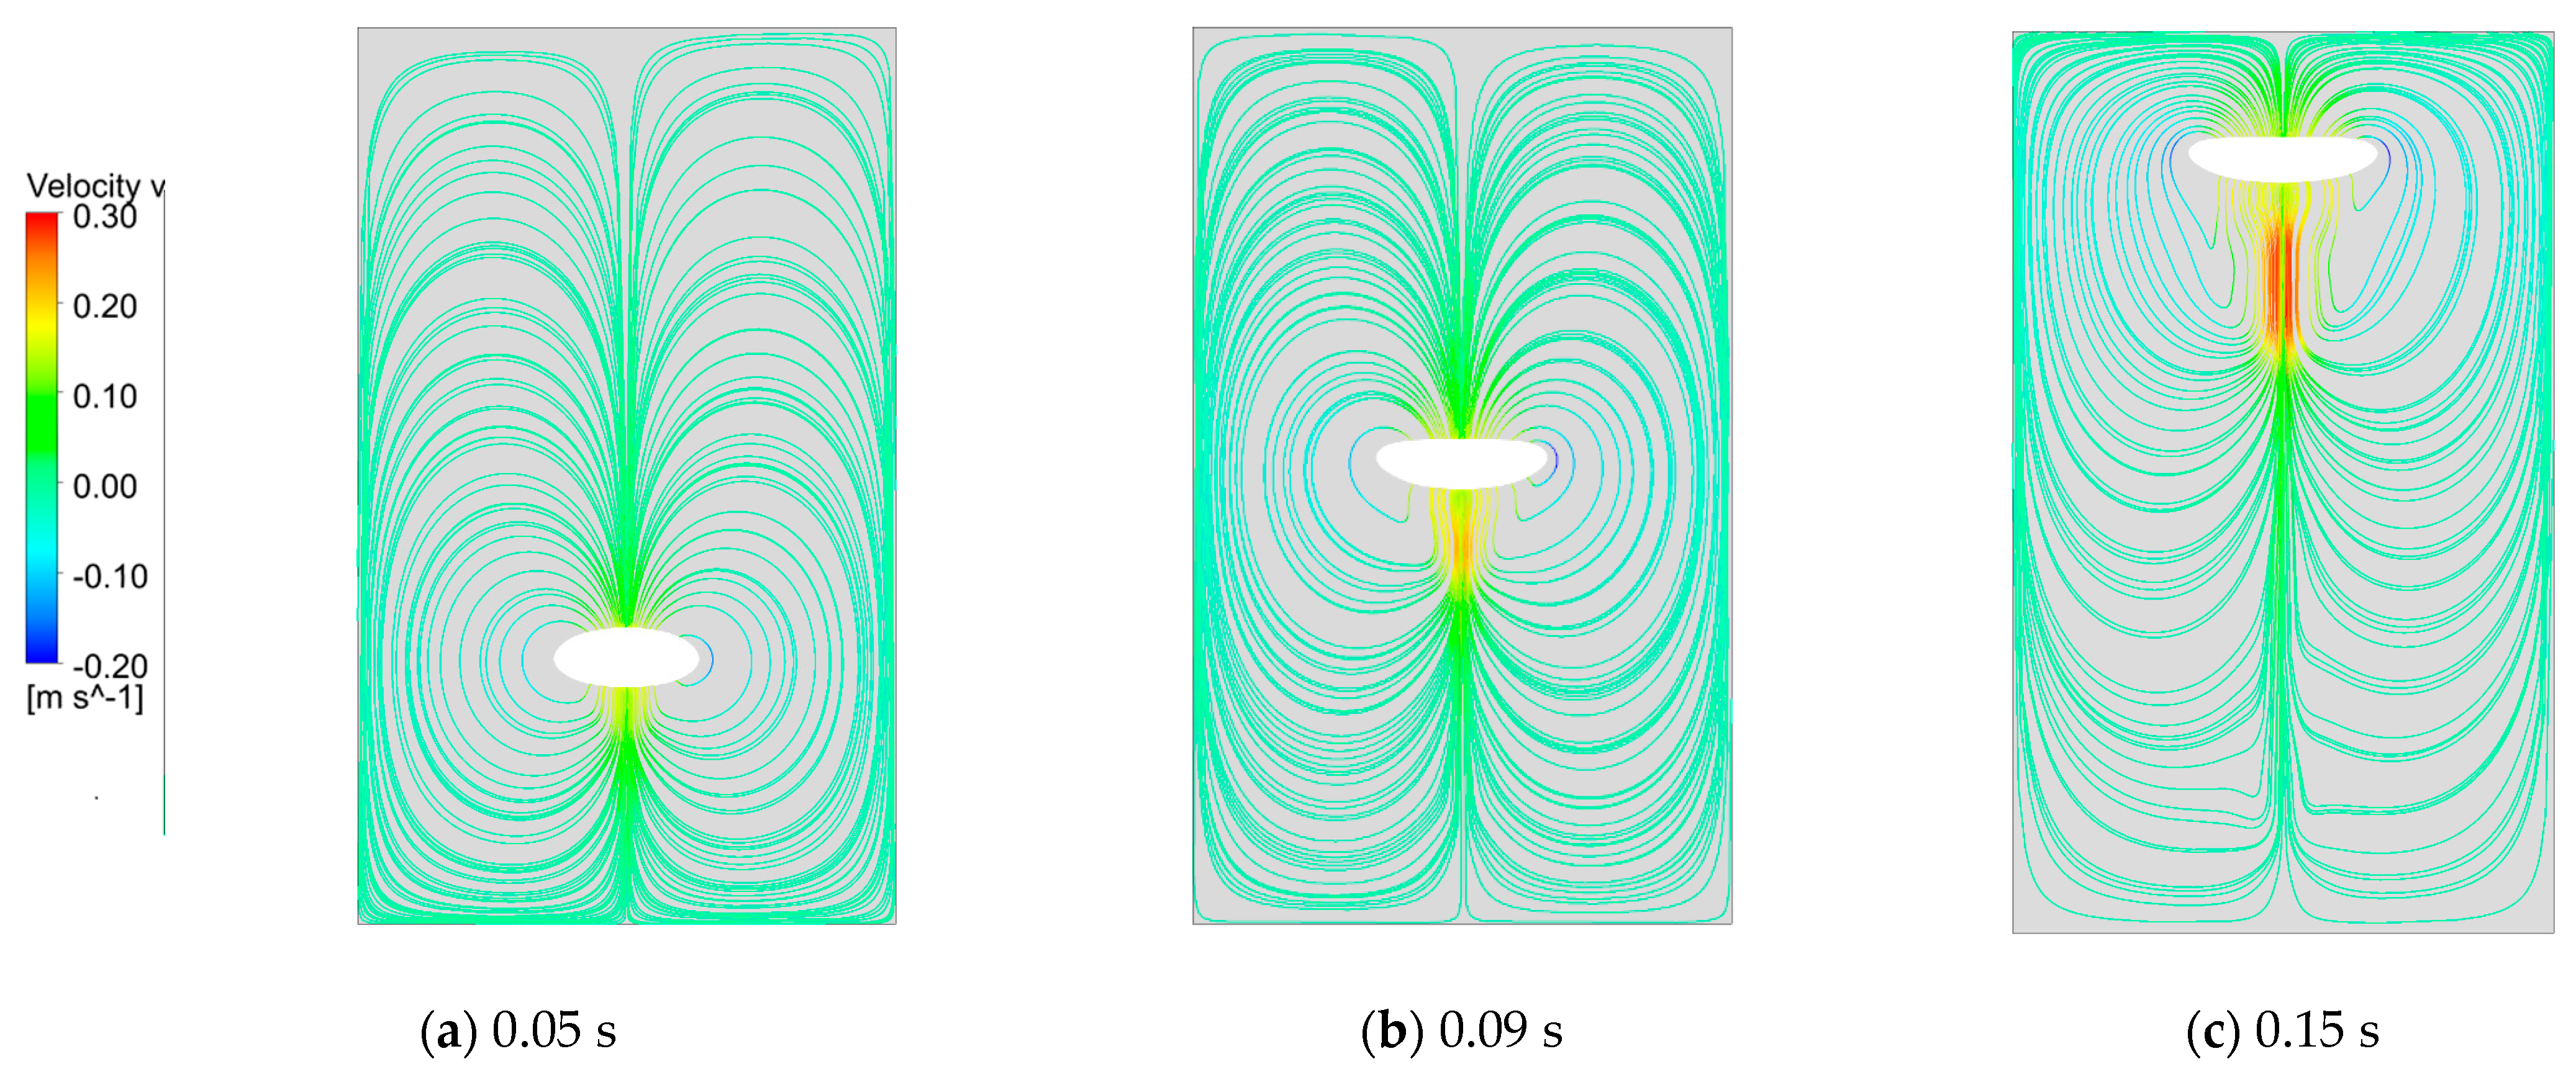
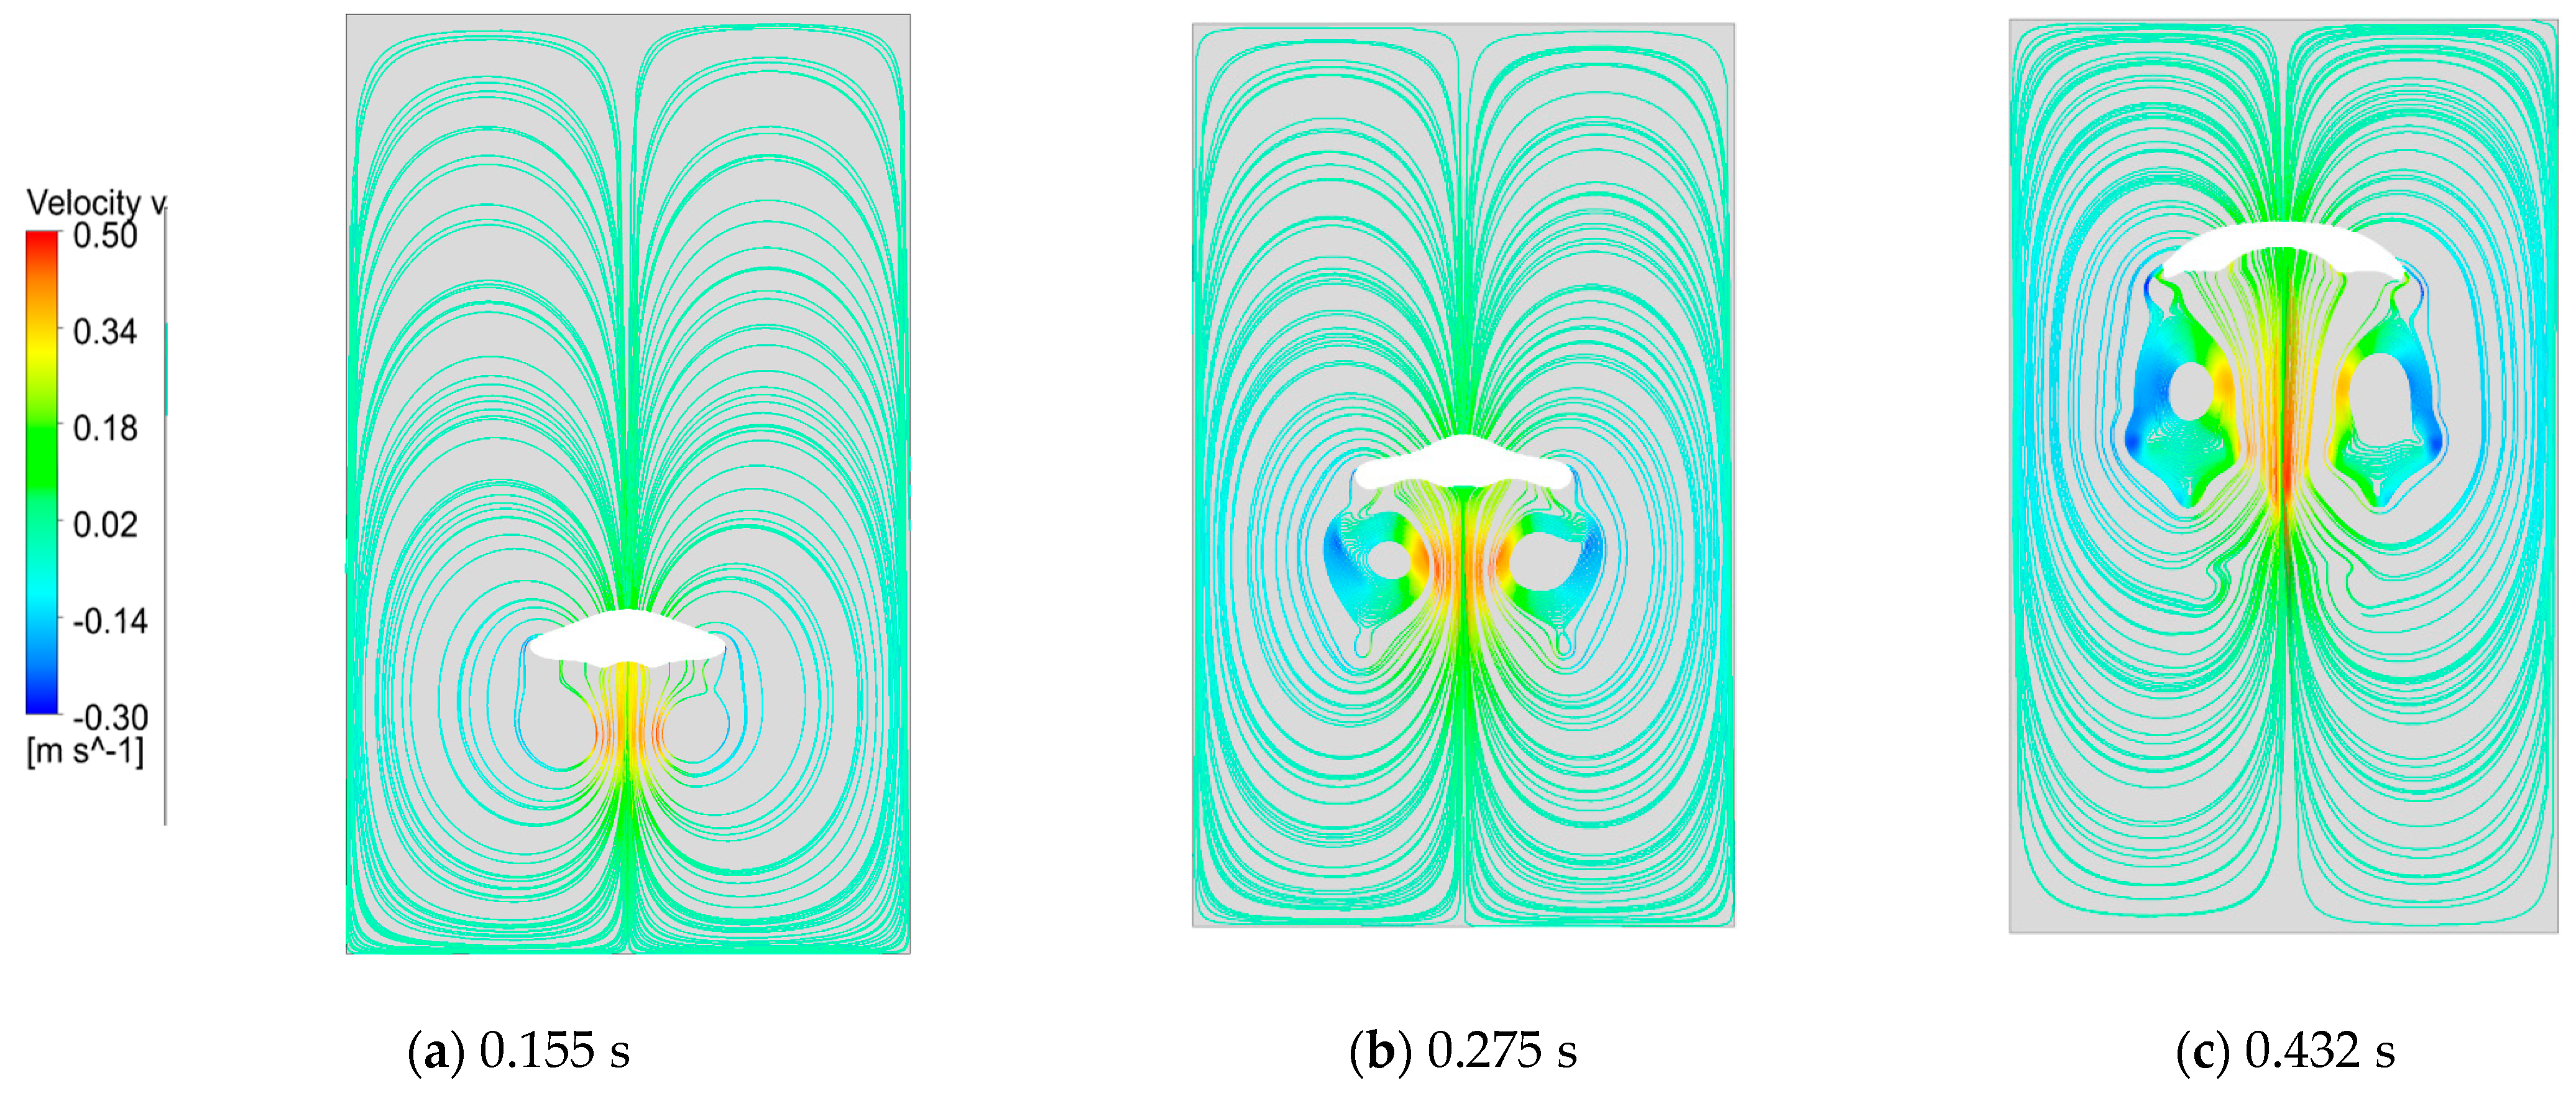
Figure 7 shows a series of snapshots of the axial liquid velocity at three different time instances for the 3 mm bubble size. The structure of the flow field around the bubble exhibited an evolution of a pair of counter-rotating vortices within the bubble during the rise of the bubble. These vortices are symmetrical and rise with the bubbles. The air bubble rises due to buoyant forces, and this upward movement induces water motion. The streamlines of wake flow also illustrate the development of a liquid jet of high velocity beneath the bubble. The liquid jet moving at a higher velocity than the bubble rising velocity can push the bubble upward. Simultaneously, this jet compresses the bubble, shortening its vertical length. This wake structure may be stable, and, therefore, no vortex shedding occurs.
For the 6 mm bubble size (Figure 8), the streamlines of wake flow clearly illustrate the development of main vortices located across the air–liquid interface during the bubble rise. The wake structure is advected upstream, forming a vortex shedding regime on both sides of the jet. It is believed that the generation of the vortex shedding regime leads to periodical deformation of the bubble, as shown in Figure 6b.
A series of snapshots of the axial liquid velocity for the case of the bubble size of 10 mm is shown in Figure 9. A symmetric flow pattern is observed where the two identical main vortices appear in the rear of the rising bubble. Apparently, the wake structure gradually develops as the bubble shape changes. The vortex shedding regime was also formed on both sides of the jet. The simulation results agree with the analyses conducted on the wake structure behind bubbles rising in stagnant fluids [45,61].
As shown in the previous figures (Figure 7, Figure 8 and Figure 9), it can be briefly stated that the axisymmetric wake structure may be characterized by the vortex shedding behind a rising wobbling bubble larger than 6 mm. Bubble sizes of 6 and 10 mm exhibit a wobbling shape associated with vortex shedding in the wake of a bubble.

4.4. Oil Droplet Dynamics

The behavior of oil droplets rising through a stagnant liquid may be described by understanding the interaction between oil droplets and the wake regions following the bubble. These wake regions can be classified into three regions: the stable bubble wake, the fluctuating bubble wake, and vortex tail regions [62]. Briefly, the stable bubble wake region may be characterized by entraining a significant portion of droplets near the base of the bubble. The fluctuating bubble wake region is accompanied by entraining droplets into the vortex shedding region, while the vortex tail region has a columnar distribution of droplets beneath the center of the bubble [31]. The entrainment of oil droplets into the vortex tail region is dominated by the liquid jet.
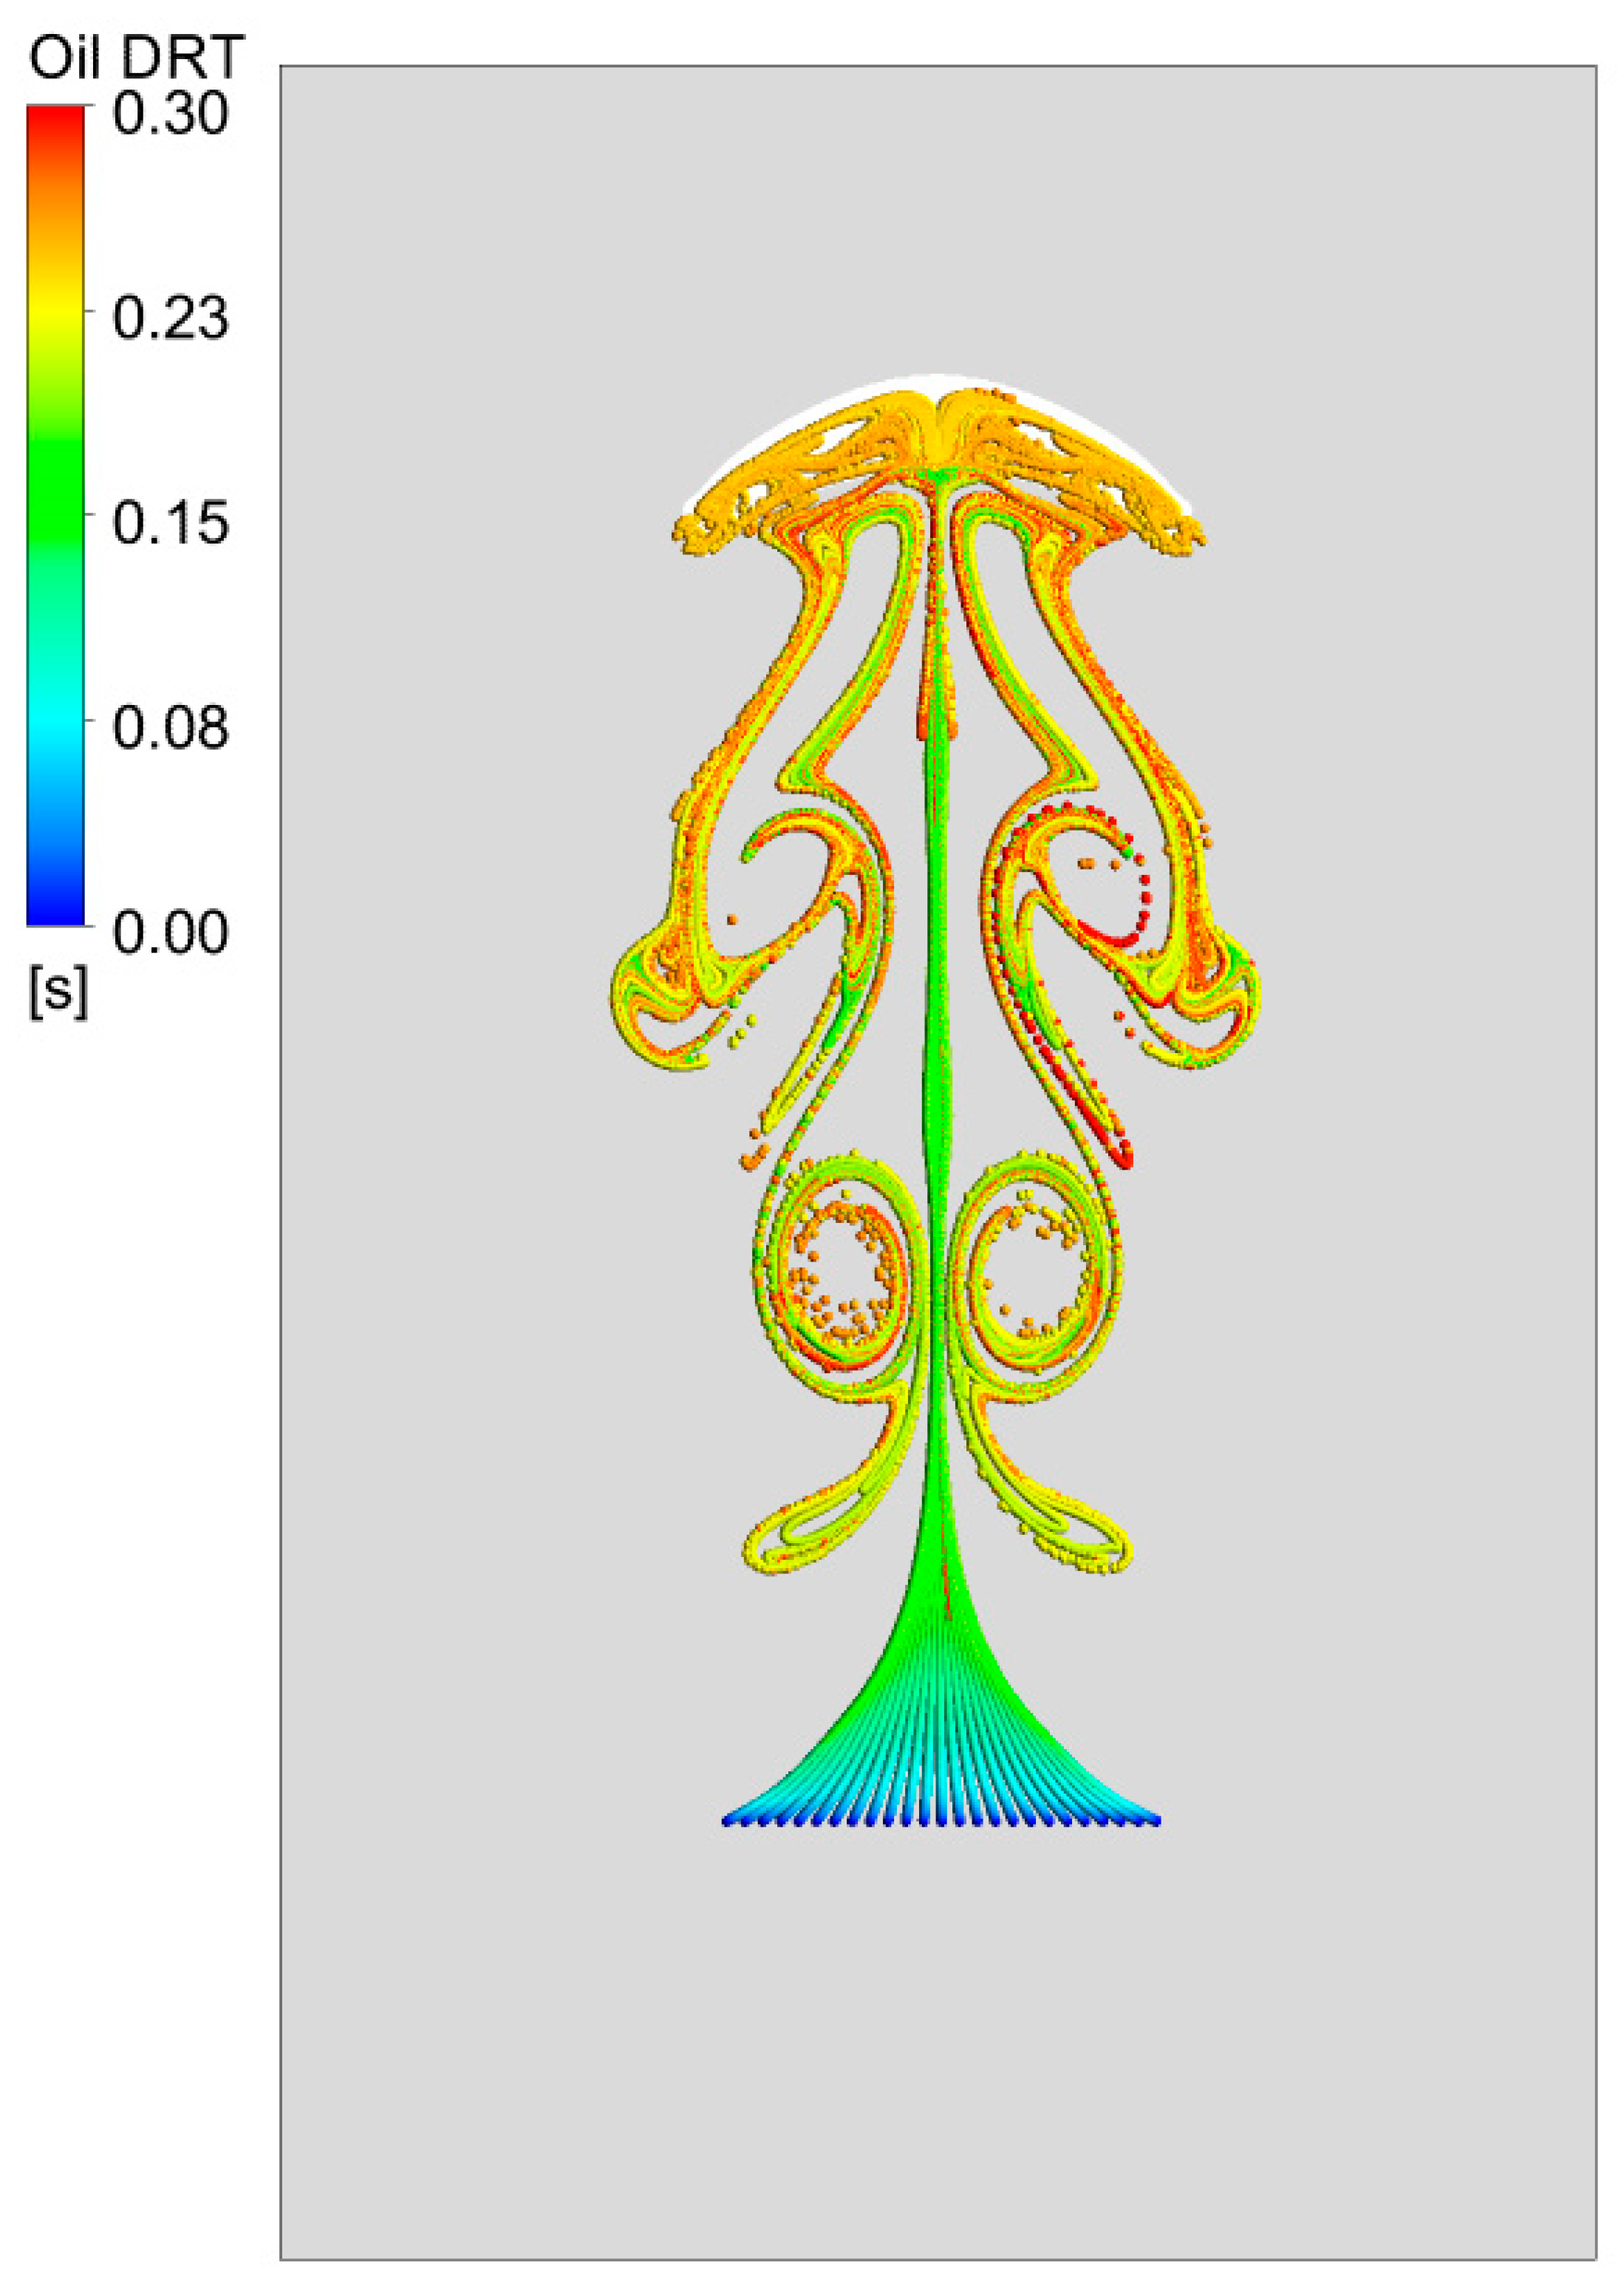
The interaction dynamics between the droplets and bubbles in quiescent water can be depicted by computation of the Droplet Residence Time (DRT), which reflects the characterization of the internal flow, such as determining the degree of the internal recirculation of droplets and identifying the stagnation zones. The DRT is defined as the residence duration of a droplet that remains within the computational domain from the injection point until it exits or is captured. By using the DPM model, the DRT is obtained by tracking the motion of individual droplets by computing the force balance equation (Equation (12)) and summing the elapsed time between consecutive time steps [41].
As shown in Figure 10, for the droplet trajectories beneath the bubble of 3 mm in size rising in stagnant water, the DRT clearly showed that the droplets’ distribution was dominated by the existence of the stable bubble wake and vortex tail regions. A major portion of the droplets were entrained and settled down into the symmetric vortices beneath the bubble, while the remaining portion of droplets was entrained into the vortex tail region that had a narrow and long distribution.
The droplet trajectories beneath the bubble of 6 mm size (Figure 11) indicated the presence of a stable bubble wake and fluctuating bubble wake regions where the vortex shedding played a dominant role in entrainment of oil droplets. A significant portion of droplets settled down in the vortex shedding region. It is worth noting that the oil microdroplets behaved like a tracer in revealing the wake structure through following the water streamlines closely.
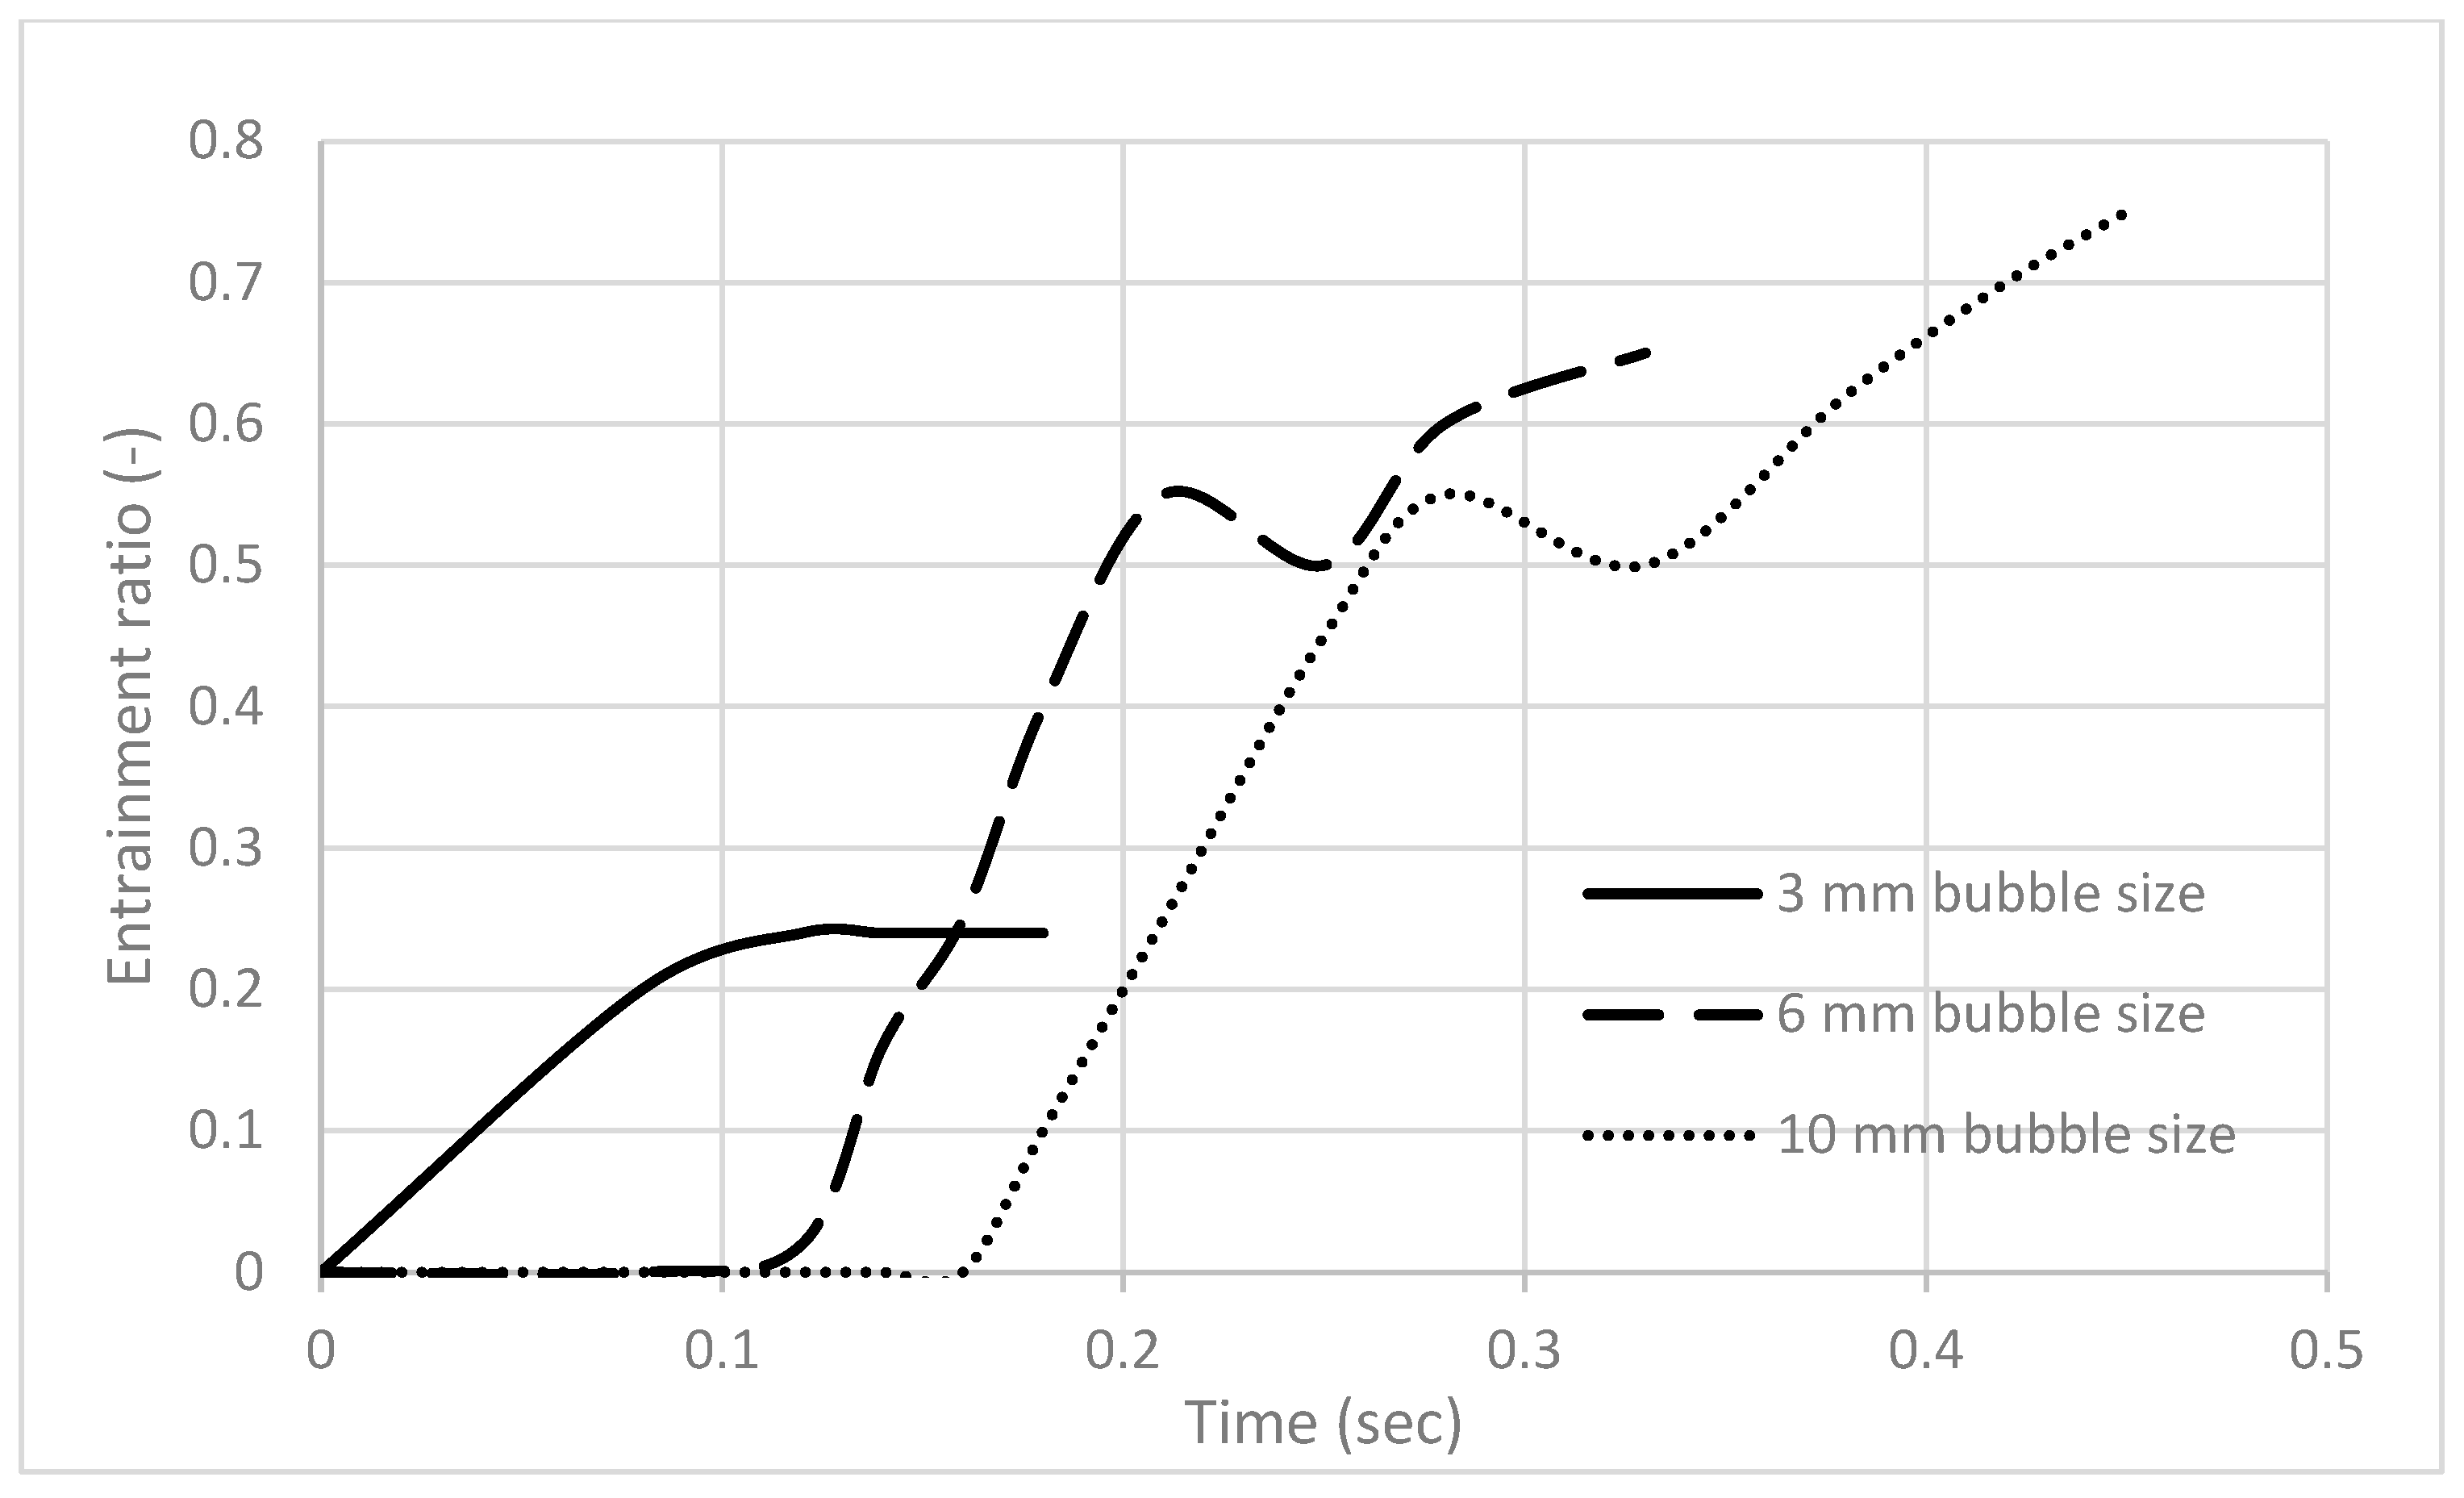
Figure 12 shows the oil droplet trajectories beneath the bubble of 10 mm in size. The fluctuating bubble wake region expanded to occupy a large area of the domain, and a major portion of oil droplets settled down to the secondary vortices that are far away from the bubble. The oil droplets in these vortices exhibited circular trajectories before settling down into the core of the vortices, forming clusters corresponding to the vortex core. It is important to note that a higher DRT caused more droplets to entrain into the fluctuating bubble wake region. A more detailed quantitative analysis can be performed by evaluating the droplet entrainment ratio in the wake of the single bubble. As proposed in relevant literature [31], the entrainment zone is defined as the region where droplets rise to a specific height. In this study, oil droplets are considered entrained once they reach a height equivalent to 40% of the computational domain, which marks the entrainment zone. The droplet entrainment ratio is calculated as the number of entrained droplets divided by the total number of droplets. Figure 13 illustrates the variation in the entrainment ratio within the entrainment zone over time for the 3, 6, and 10 mm bubble sizes. In general, the number of entrained droplets increases with bubble size. Due to the bubble wake structure, as shown in Figure 10, Figure 11 and Figure 12, the 6 mm and 10 mm bubble sizes exhibited relatively higher entrainment ratios of 0.65 and 0.75, respectively. In contrast, the smallest bubble (3 mm) maintained a relatively stable number of entrained droplets and showed the lowest entrainment ratio of 0.25, attributed to the smaller bubble size and its wake.

5. Conclusions

A transient 2D CFD modeling approach based on coupling VOF with DPM models was shown here to simulate the hydrodynamic interaction between rising bubbles and oil droplets. The hydrodynamic flow field demonstrated that for certain bubble sizes (6 and 10 mm) in the wobbling regime, vortex shedding occurs, which in turn enhances the entrainment of the oil droplets into the bubble wake. A comprehensive simulation of the dynamics of a rising macrobubble in a very dilute dispersion of an oil microdroplet–water system revealed that the key mechanism of the interaction was the hydrodynamic capture of the oil droplets in the bubble wake, which can enhance fine oil droplet separation from water in the flotation process.

Author Contributions

Conceptualization, S.N.S. and S.B.; methodology, S.N.S.; software, S.N.S.; validation, S.N.S. and S.B.; formal analysis, S.N.S.; investigation, S.N.S. and S.B.; resources, S.N.S.; data curation, S.N.S. and S.B.; writing—original draft preparation, S.N.S. and S.B.; writing—review and editing, S.N.S. and S.B.; visualization, S.N.S.; supervision, S.N.S.; project administration, No funding; S.B. All authors have read and agreed to the published version of the manuscript.

Funding

This research received no external funding.

Institutional Review Board Statement

Not applicable.

Informed Consent Statement

Not applicable.

Data Availability Statement

The original contributions presented in this study are included in the article.

Conflicts of Interest

The authors declare no conflicts of interest.

Nomenclature

a1a3constants
CDdroplet-liquid drag force coefficient
dbbubble diameter (mm)
dddroplet diameter (µm)
EoEötvös number
F b d phase interaction forces from bubbles and droplets (N)
Fbbubble–liquid interface coupling interaction force (N)
Fddroplet–liquid interface coupling interaction force (N)
FDdrag force (N)
F s f surface tension force
g gravitational acceleration vector (m/s2)
MMorton number
n ^ normal unit vector
ppressure (pa)
rbubble radius (mm)
ReReynolds number
S t d droplet Stokes number
ttime (s)
t*dimensionless time (-)
u velocity vector (m/s)
ubgas bubble rise velocity (m/s)
ugsuperficial gas velocity (m/s)
Greek Letters
α volume fraction scalar
μ viscosity (Pa.s)
ρ density (kg/m3)
σ surface tension force (N/m)
κ free surface curvature
Subscripts
bbubble index
ddroplet index
ggas index
lliquid index

References

  1. Fakhru’L-Razi, A.; Pendashteh, A.; Abdullah, L.C.; Biak, D.R.A.; Madaeni, S.S.; Abidin, Z.Z. Review of technologies for oil and gas produced water treatment. J. Hazard. Mater. 2009, 170, 530–551. [Google Scholar] [CrossRef]
  2. Dudek, M.; Kancir, E.; Øye, G. Influence of the Crude Oil and Water Compositions on the Quality of Synthetic Produced Water. Energy Fuels 2017, 31, 3708–3716. [Google Scholar] [CrossRef]
  3. Amakiri, K.T.; Canon, A.R.; Molinari, M.; Angelis-Dimakis, A. Review of oilfield produced water treatment technologies. Chemosphere 2022, 298, 134064. [Google Scholar] [CrossRef] [PubMed]
  4. Piccioli, M.; Aanesen, S.V.; Zhao, H.; Dudek, M.; Øye, G. Gas Flotation of Petroleum Produced Water: A Review on Status, Fundamental Aspects, and Perspectives. Energy Fuels 2020, 34, 15579–15592. [Google Scholar] [CrossRef]
  5. Shen, W.; Mukherjee, D.; Koirala, N.; Hu, G.; Lee, K.; Zhao, M.; Li, J. Microbubble and Nanobubble-Based Gas Flotation for Oily Wastewater Treatment: A review. Environ. Rev. 2022, 30, 359–379. [Google Scholar] [CrossRef]
  6. Li, X.B.; Liu, J.T.; Wang, Y.T.; Wang, C.Y.; Zhou, X.H. Separation of oil from wastewater by column flotation. J. China Univ. Min. Technol. 2007, 1, 546–551. [Google Scholar] [CrossRef]
  7. Moosai, R.; Dawe, R.A. Oily Wastewater Cleanup by Gas Flotation. West Indian. J. Eng. 2002, 25, 25–41. [Google Scholar]
  8. Huang, Q.; Long, X. Analysis of the influencing factors on oil removal efficiency in large-scale flotation tanks: Experimental observation and numerical simulation. Energies 2020, 13, 927. [Google Scholar] [CrossRef]
  9. Rubio, J.; Souza, M.L.; Smith, R.W. Overview of flotation as a wastewater treatment technique. Miner. Eng. 2002, 15, 139–155. [Google Scholar] [CrossRef]
  10. Owens, N.; Lee, D.W. The Use of Micro-Bubble Flotation Technology in Secondary & Tertiary Produced Water Treatment a Technical Comparison with Other Separation Technologies. In Proceedings of the TUV NEL, 5th Produced Water Workshop, Aberdeen, Scotland, 30–31 May 2007; pp. 1–19. [Google Scholar]
  11. Edzwald, J.K. Dissolved air flotation and me. Water Res. 2010, 44, 2077–2106. [Google Scholar] [CrossRef] [PubMed]
  12. Hassanzadeh, A.; Safari, M.; Hoang, D.H.; Khoshdast, H.; Albijanic, B.; Kowalczuk, P.B. Technological assessments on recent developments in fine and coarse particle flotation systems. Miner. Eng. 2022, 180, 107509. [Google Scholar] [CrossRef]
  13. Van Le, T.; Imai, T.; Higuchi, T.; Yamamoto, K.; Sekine, M.; Doi, R.; Vo, H.T.; Wei, J. Performance of tiny microbubbles enhanced with “normal cyclone bubbles” in separation of fine oil-in-water emulsions. Chem. Eng. Sci. 2013, 94, 1–6. [Google Scholar]
  14. Khuntia, S.; Majumder, S.K.; Ghosh, P. Microbubble-aided water and wastewater purification: A review. Rev. Chem. Eng. 2012, 28, 191–221. [Google Scholar] [CrossRef]
  15. Lim, M.W.; Lau, E.V.; Poh, P.E. Micro-bubbles interactions and its application in flotation technology for the recovery of high-density oil from contaminated sands. J. Petrol. Sci. Eng. 2018, 161, 29–37. [Google Scholar] [CrossRef]
  16. Federle, M.E.; Das, A.; Mathai, V.; Zenit, R. The interaction of an oil droplet and a gas bubble rising in a quiescent fluid. Int. J. Multiph. Flow 2023, 171, 104682. [Google Scholar] [CrossRef]
  17. Oliveira, R.C.G.; Gonzalez, G.; Oliveira, J.F. Interfacial studies on dissolved gas flotation of oil droplets for water purification. Colloids Surf. 1999, 154, 127–135. [Google Scholar] [CrossRef]
  18. Rawlins, C.H. Flotation of Fine Oil Droplets in Petroleum Production Circuits. In Mineral Processing Plant Design; Society for Mining, Metallurgy, and Exploration and The Minerals, Metals, and Materials Society: Tucson, AZ, USA, 2009. [Google Scholar]
  19. Yan, S.; Yang, X.; Bai, Z.; Xu, X.; Wang, H. Drop attachment behavior of oil droplet-gas bubble interactions during flotation. Chem. Eng. Sci. 2020, 223, 115740. [Google Scholar] [CrossRef]
  20. Moosai, R.; Dawe, R.A. Gas attachment of oil droplets for gas flotation for oily wastewater cleanup. Sep. Purif. Tech. 2003, 33, 303–314. [Google Scholar] [CrossRef]
  21. Rawlins, C. Hank Mechanisms for Flotation of Fine Oil Droplets; SME Annual Meeting & Exhibit: Littleton, CO, USA, 2011; pp. 1–11. [Google Scholar]
  22. Dudek, M. Produced Water Quality and Microfluidic Methods for Studying Drop-Drop and Drop-Bubble Interactions in Produced Water. Ph.D. Thesis, Norwegian University of Science and Technology NTNU, Trondheim, Norway, 2018. [Google Scholar]
  23. Saththasivam, J.; Loganathan, K.; Sarp, S. An overview of oil–water separation using gas flotation systems. Chemosphere 2016, 144, 671–680. [Google Scholar] [CrossRef] [PubMed]
  24. Räbiger, N. Hydrodynamics and Mass Transfer in Loop-Reactors with Three-Phase Flow-an Overview with New Perspective. In Proceedings of the 2nd International Symposium on Multiscale Multiphase Process Engineering, Hamburg, Germany, 24–27 September 2014. [Google Scholar]
  25. Ralston, J.; Dukhin, S.S.; Mishchuk, N.N. Wetting film stability and flotation kinetics. Adv. Colloid Interface Sci. 2002, 95, 145–236. [Google Scholar] [CrossRef]
  26. Federle, M.; Zenit, R. Physical conditions for droplet–bubble coalescence in flotation. Int. J. Multiph. Flow 2024, 179, 104933. [Google Scholar] [CrossRef]
  27. Miettinen, T.; Ralston, J.; Fornasiero, D. The limits of fine particle flotation. Miner. Eng. 2010, 23, 420–437. [Google Scholar] [CrossRef]
  28. Chen, H.; Li, Y.; Xiong, Y.; Wei, H.; Saxén, H.; Yu, Y. Effect of particle holdup on bubble formation in suspension medium by VOF–DPM simulation. Granul. Matter 2022, 24, 120. [Google Scholar] [CrossRef]
  29. Cai, X.; Chen, J.; Liu, M.; Ji, Y.; Ding, G.; Zhang, L. CFD simulation of oil-water separation characteristics in a compact flotation unit by population balance modeling. J. Dispers. Sci. Technol. 2017, 38, 1435–1447. [Google Scholar] [CrossRef]
  30. Xu, Y.G.; Ersson, M.; Jonsson, P.G. A numerical study about the influence of a bubble wake flow on the removal of inclusions. ISIJ Int. 2016, 56, 1982–1988. [Google Scholar] [CrossRef]
  31. Zhang, W.; Chen, X.; Pan, W.; Jian-liang, X. Numerical simulation of wake structure and particle entrainment behavior during a single bubble ascent in liquid-solid system. Chem. Eng. Sci. 2022, 253, 117573. [Google Scholar] [CrossRef]
  32. Hua, J.; Stene, J.F.; Lin, P. Numerical simulation of 3D bubbles rising in viscous liquids using a front tracking method. J. Comput. Phys. 2008, 227, 3358–3382. [Google Scholar] [CrossRef]
  33. Zhang, A.; Guo, Z.; Wang, Q. Three-dimensional numerical simulation of bubble rising in viscous liquids: A conservative phase-field lattice-Boltzmann study. Phys. Fluids 2019, 31, 063106. [Google Scholar] [CrossRef]
  34. Akhtar, A.; Pareek, V.; Tade, M. CFD simulations for continuous flow of bubbles through gas-liquid columns: Application of VOF method. Chem. Prod. Process Model. 2007, 2, 9. [Google Scholar] [CrossRef]
  35. Inguva, V.; Schulz, A.; Kenig, E. On methods to reduce spurious currents within VOF solver frameworks. Part 1: A review of the static bubble/droplet. Chem. Prod. Process Model. 2020, 17, 121–135. [Google Scholar] [CrossRef]
  36. Pourtousi, M.; Ganesan, P.; Kazemzadeh, A.; Sandaran, S.C.; Sahu, J.N. Methane bubble formation and dynamics in a rectangular bubble column: A CFD study. Chemom. Intell. Lab. Syst. 2015, 147, 111–120. [Google Scholar] [CrossRef]
  37. Xia, Y.K. CFD Simulation of Fine Particle Gravity Separation in Hindered-settling Bed Separators. Chem. Prod. Process. Model. 2007, 2, 1–21. [Google Scholar] [CrossRef]
  38. Morsi, S.A.; Alexander, A.J. An investigation of particle trajectories in two-phase flow systems. J. Fluid Mech. 1972, 55, 193–208. [Google Scholar] [CrossRef]
  39. Pan, W.T.; Chen, X.L.; Dai, G.C.; Wang, F.C. Enhanced Effect of Bubble Deformation on Internal Particle Transport. Ind. Eng. Chem. Res. 2020, 59, 905–918. [Google Scholar] [CrossRef]
  40. Yang, X.; Xi, T.; Qin, Y.; Zhang, H.; Wang, Y. Computational Fluid Dynamics–Discrete Phase Method Simulations in Process Engineering: A Review of Recent Progress. Appl. Sci. 2024, 14, 3856. [Google Scholar] [CrossRef]
  41. ANSYS, Inc. ANSYS Fluent Theory Guide, Release 15.0, November 2013. Available online: http://www.ansys.com/ (accessed on 14 May 2025).
  42. Elghobashi, S. Particle-laden turbulent flows: Direct simulation and closure models. Appl. Sci. Res. 1991, 48, 301–314. [Google Scholar] [CrossRef]
  43. Saleh, S.N. CFD Simulations of a co-current spray dryer. World Acad. Sci. Technol. 2010, 62, 772–777. [Google Scholar]
  44. Hua, J.; Lou, J. Numerical simulation of bubble rising in viscous liquids. J. Comput. Phys. 2007, 222, 769–795. [Google Scholar] [CrossRef]
  45. Smolianski, A.; Haario, H.; Luukka, P. Vortex shedding behind a rising bubble and two-bubble coalescence: A numerical approach. Appl. Math. Model. 2005, 29, 615–632. [Google Scholar] [CrossRef]
  46. Hoque, M.M.; Moreno-Atanasio, R.; Doroodchi, E.; Joshi, J.; Evans, G.M.; Mitra, S. 20 Dynamics of a single bubble rising in a quiescent medium. Exp. Therm. Fluid Sci. 2022, 132, 110546. [Google Scholar] [CrossRef]
  47. Bhaga, D.; Weber, M.E. Bubbles in viscous liquids, shapes, wakes and velocities. J. Fluid Mech. 1981, 105, 61–85. [Google Scholar] [CrossRef]
  48. Krishna, R.; Van Baten, J.M. Rise characteristics of gas bubbles in a 2D rectangular column: VOF simulations vs experiments. Int. Commun. Heat Mass Transf. 1999, 26, 965–974. [Google Scholar] [CrossRef]
  49. Abbassi, W.; Besbes, S.; Elhajem, M.; Aissia, H.; Ben Champagne, J.Y. Numerical simulation of free ascension and coaxial coalescence of air bubbles using the volume of fluid method (VOF). Comput. Fluids 2018, 161, 47–59. [Google Scholar] [CrossRef]
  50. Grace, J.R.; Wairegi, T.; Nguyen, T.H. Shapes and velocities of single drops and bubbles moving freely through immiscible liquids. Trans. Inst. Chem. Eng. 1976, 54, 167. [Google Scholar]
  51. Clift, R.; Grace, J.R.; Weber, M.E. Bubbles, Drops, and Particles; Academic Press: London, UK, 1978. [Google Scholar]
  52. Kracht, W.; Finch, J.A. Effect of frother on initial bubble shape and velocity. Int. J. Miner. Process. 2010, 94, 115–120. [Google Scholar] [CrossRef]
  53. Chakraborty, I.; Biswas, G.; Ghoshdastidar, P.S. A coupled level-set and volume of- fluid method for the buoyant rise of gas bubbles in liquids. Int. J. Heat Mass Transf. 2013, 58, 240–259. [Google Scholar] [CrossRef]
  54. Kulkarni, A.A.; Joshi, J.B. Bubble formation and bubble rise velocity in gas-liquid systems: A review. Ind. Eng. Chem. Res. 2005, 44, 5873–5931. [Google Scholar] [CrossRef]
  55. Ziegenhein, T.; Lucas, D. Observations on bubble shapes in bubble columns under different flow conditions. Exp. Therm. Fluid Sci. 2017, 85, 248–256. [Google Scholar] [CrossRef]
  56. Sharaf, D.M.; Premlata, A.R.; Tripathi, M.K.; Karri, B.; Sahu, K.C. Shapes and paths of an air bubble rising in quiescent liquids. Phys Fluids 2017, 29, 122104. [Google Scholar] [CrossRef]
  57. Meehan, R.O.; Donnelly, B.; Nolan, K.; Persoons, T.; Murray, D.B. Flow structures and dynamics in the wakes of sliding bubbles. Int. J. Multiph. Flow. 2016, 84, 145–154. [Google Scholar] [CrossRef]
  58. Krishna, R. A scale up strategy for a commercial scale bubble column slurry reactor for Fischer Tropsch synthesis. Oil Gas Sci. Technol. 2000, 55, 359–393. [Google Scholar] [CrossRef]
  59. Dai, J.; Sterling, J.D.; Nadim, A. Numerical Simulation of Air Bubbles Rising in Water Using an Axisymmetric VOF method. In Proceedings of the 2nd International Conference on Computational Methods in Multiphase Flow, Santa Fe, NM, SAD, 3–5 November 2003; pp. 343–351. [Google Scholar]
  60. Krishna, R.; Van Baten, J.M. Simulating the Rise Characteristics of Gas Bubbles in Liquids Using CFD. Chem. Eng. Technol. 2001, 24, 427–430. [Google Scholar] [CrossRef]
  61. Cao, Y.; Macián-Juan, R. The wobbling motion of single and two inline bubbles rising in quiescent liquid. Phys. Fluids 2021, 33, 073305. [Google Scholar] [CrossRef]
  62. Kitano, K.; Fan, L.-S. Near-Wake Structure of a Single Gas Bubble in a Two-Dimensional Liquid-Solid Fluidized Bed: Solids Holdup. Chem. Eng. Sci. 1988, 43, 1355–1361. [Google Scholar] [CrossRef]
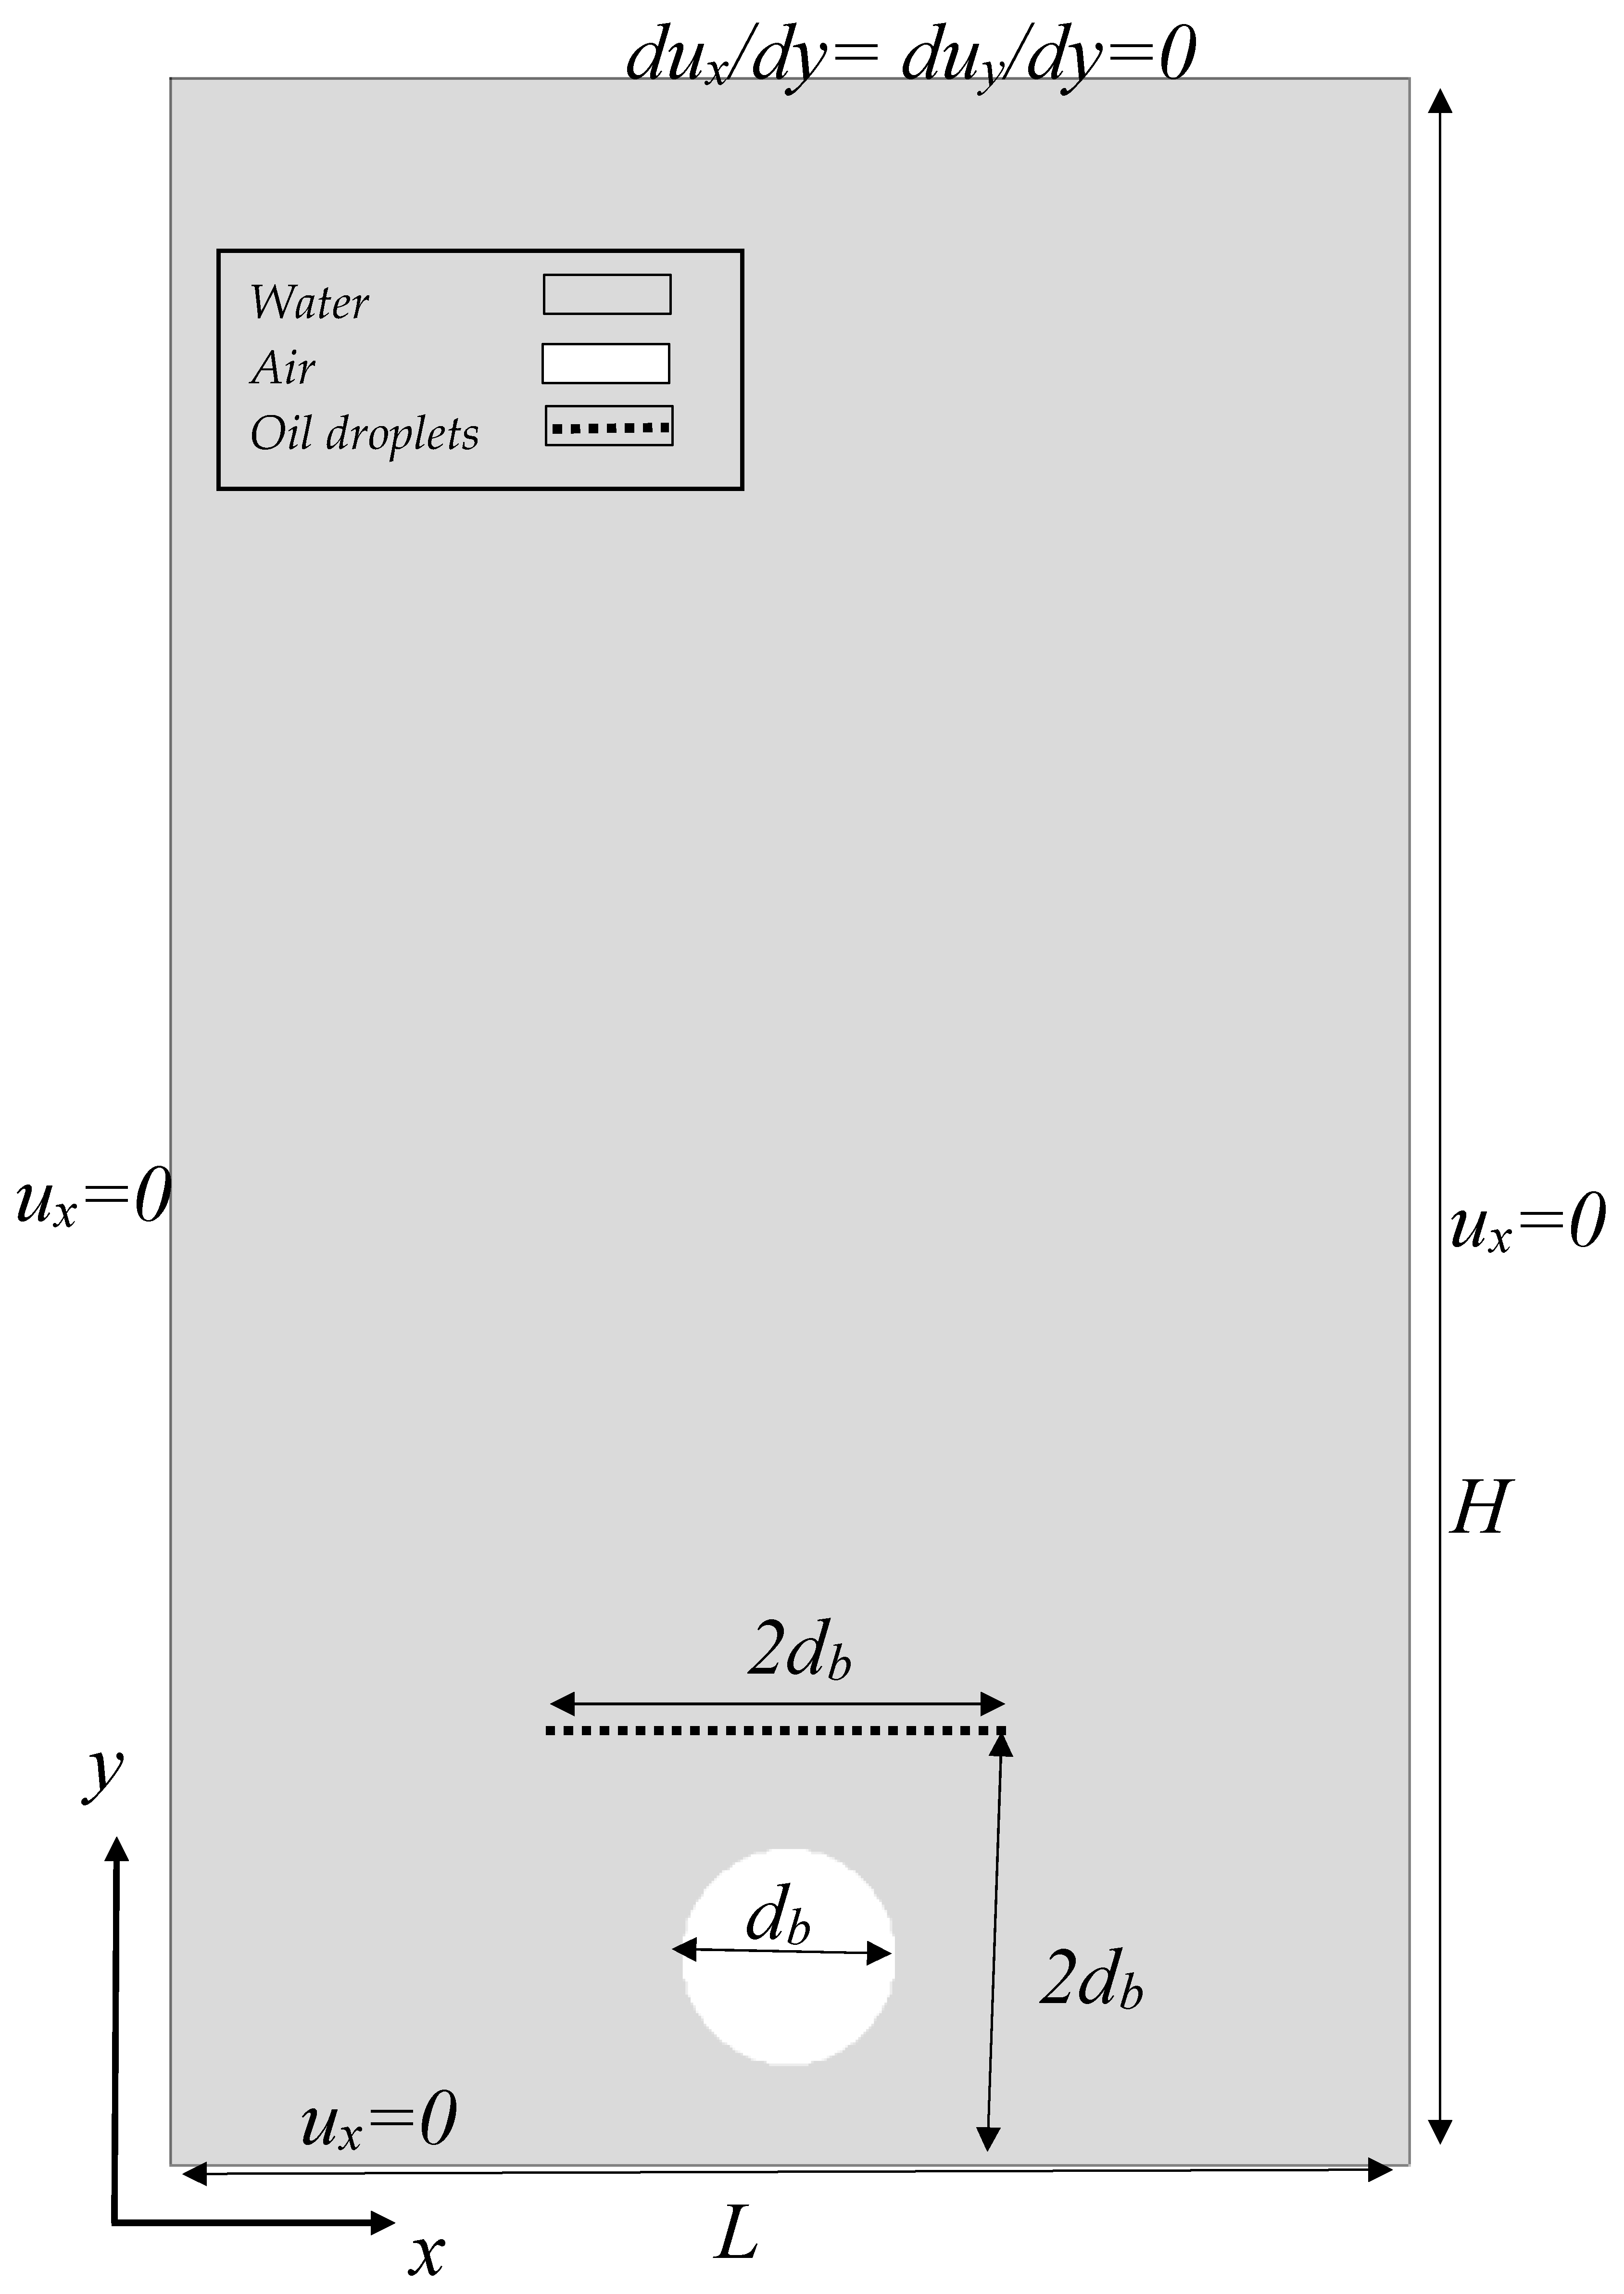
Figure 1. Initial configuration and boundary conditions for simulating rising bubbles in quiescent water. The streams of oil droplets are shown as the dotted black line above the bubble.
Cleantechnol 07 00065 g001
Figure 2. Influences of grid mesh on simulation results of the rising velocity of the bubble with a diameter of 3.00 mm in quiescent water.
Cleantechnol 07 00065 g002
Figure 3. Comparison of simulation with experimental results from Hoque et al. [46] for shape evolution of rising bubble with diameter of 3.08 mm.
Cleantechnol 07 00065 g003
Figure 4. Comparison of experimental results from Hoque et al. [46] and simulation results of instantaneous bubble’s aspect ratio.
Cleantechnol 07 00065 g004
Figure 5. Comparison of experimental results from Hoque et al. [46] and simulation results of rising velocity of bubble of 3.53 mm in quiescent water.
Cleantechnol 07 00065 g005
Figure 6. The evolution of the terminal bubble shape for different bubble sizes at a Morton number of 2.60 × 10⁻¹¹; ∆t denotes the time interval between two successive instantaneous shapes of the bubble.
Cleantechnol 07 00065 g006
Figure 7. The liquid streamlines and liquid axial velocity fields at different instantaneous times for the 3 mm bubble size.
Cleantechnol 07 00065 g007
Figure 8. The liquid streamlines and liquid axial velocity fields at different instantaneous times for the 6 mm bubble size.
Cleantechnol 07 00065 g008
Figure 9. The liquid streamlines and liquid axial velocity fields at different instantaneous times for the 10 mm bubble size.
Cleantechnol 07 00065 g009
Figure 10. The oil droplet trajectories with the oil DRT beneath the 3 mm bubble.
Cleantechnol 07 00065 g010
Figure 11. The oil droplet trajectories with the oil DRT distribution beneath the 6 mm bubble.
Cleantechnol 07 00065 g011
Figure 12. The oil droplet trajectories with the oil DRT distribution beneath the 10 mm bubble.
Cleantechnol 07 00065 g012
Figure 13. The oil droplet entrainment ratio with time for the 3, 6, and 10 mm bubble sizes.
Cleantechnol 07 00065 g013
Table 1. Main physical properties of the applied system.
Parameter
LiquidWater
GasAir
OilCyclohexane
Liquid density, kg/m3998
Gas density, kg/cm31.225
Oil density, kg/m3779
Liquid viscosity, 10−3 Pa.s1.003
Gas viscosity, 10−3 Pa.s0.018
Oil viscosity, 10−3 Pa.s0.883
Water–air interfacial tension, 10−3 N.m−172
Oil–air interfacial tension, 10−3 N.m−124.4
Oil–water interfacial tension, 10−3 N.m−126.3
Disclaimer/Publisher’s Note: The statements, opinions and data contained in all publications are solely those of the individual author(s) and contributor(s) and not of MDPI and/or the editor(s). MDPI and/or the editor(s) disclaim responsibility for any injury to people or property resulting from any ideas, methods, instructions or products referred to in the content.