Article

Comparative Life Cycle and Techno-Economic Assessment of Constructed Wetland, Microbial Fuel Cell, and Their Integration for Wastewater Treatment

1
School of Environmental Science and Engineering, Tianjin University, Tianjin 300072, China
2
Department of Civil Engineering, Morgan State University, 1700 E Cold Spring Ln, Baltimore, MD 21251, USA
3
Department of Industrial and Systems Engineering, Morgan State University, 1700 E Cold Spring Ln, Baltimore, MD 21251, USA
*
Authors to whom correspondence should be addressed.
Clean Technol. 2025, 7(3), 57; https://doi.org/10.3390/cleantechnol7030057
Submission received: 9 May 2025 / Revised: 17 June 2025 / Accepted: 30 June 2025 / Published: 10 July 2025
(This article belongs to the Collection Water and Wastewater Treatment Technologies)

Abstract

This study systematically compares the environmental and economic performance of three wastewater treatment systems: constructed wetlands (CWs), microbial fuel cells (MFCs), and their integration (CW–MFC). Lab-scale units of each system were constructed using a multi-media matrix (gravel, zeolite, and granular activated carbon), composite native wetland species (Juncus effusus, Iris sp., and Typha angustifolia), carbon-based electrodes (graphite), and standard inoculum for CW and CW–MFC. The MFC system employed carbon-based electrodes and proton-exchange membrane. The experimental design included a parallel operation of all systems treating domestic wastewater under identical hydraulic and organic loading rates. Environmental impacts were quantified across construction and operational phases using life cycle assessment (LCA) with GaBi software 9.2, employing TRACI 2021 and ReCiPe 2016 methods, while techno-economic analysis (TEA) evaluated capital and operational costs. The key results indicate that CW demonstrates the lowest global warming potential (142.26 kg CO2-eq) due to its reliance on natural biological processes. The integrated CW–MFC system achieved enhanced pollutant removal (82.8%, 87.13%, 78.13%, and 90.3% for COD, NO3, TN, and TP) and bioenergy generation of 2.68 kWh, balancing environmental benefits with superior treatment efficiency. In contrast, the stand-alone MFC shows higher environmental burdens, primarily due to energy-intensive material requirements and fabrication processes. TEA results highlight CW as the most cost-effective solution (USD 627/m3), with CW–MFC emerging as a competitive alternative when considering environmental benefits and operational efficiencies (USD 718/m3). This study highlights the potential of hybrid systems, such as CW–MFC, to advance sustainable wastewater treatment technologies by minimizing environmental impacts and enhancing resource recovery, supporting their broader adoption in future water management strategies. Future research should focus on optimizing materials and energy use to improve scalability and feasibility.

1. Introduction

Conventional wastewater treatment technologies are essential for removing contaminants and enhancing environmental quality and treatment efficiency. Over the decades, a range of methods, such as activated sludge systems, reverse osmosis, trickling filters, and membrane filters, have been widely adopted for effective wastewater management [1,2]. However, these conventional methods are known to be energy-intensive and impose significant environmental impacts [1,3]. With growing attention on sustainability, as emphasized in the United Nations’ Sustainable Development Goals (SDGs), numerous alternative technologies have been introduced for wastewater treatment. A key challenge that remains is determining which of these sustainable options offers the lowest environmental impact [4,5,6,7]. The overarching goal of wastewater treatment systems is to protect the environment from the load of nutrients and other forms of contaminants by meeting water quality parameters [8]. According to Dixon et al. [9], if reducing environmental impacts is a primary goal of wastewater treatment systems, they should be designed to minimize their overall environmental footprint, taking the entire life cycle of the system into account [3,8,9].
Life cycle assessment (LCA) serves as a systematic tool for assessing the overall environmental impacts associated with wastewater treatment technologies throughout their entire life span [10]. This systematic method examines the inputs, outputs, and potential environmental impacts of technological products across their entire life cycle, from the cradle to the grave [11,12]. Like other analytical system tools such as environmental impact assessment (EIA) and multi-criteria decision analysis (MCDA), LCAs simplify complex realities. Although LCAs are limited in their understanding of processes, prediction of the future, and site-specificity, the distinct feature of LCAs is that they predict potential rather than actual impacts on the environment [13,14]. LCA enables a comprehensive evaluation of products or systems, offering insight into the origins and consequences of their environmental impacts [3]. As noted by Weiss et al. [15], LCA serves as a valuable decision-making tool by highlighting areas within a system that require additional research, improvement, or development.
Previous studies in this regard have extensively focused on the assessment of CW in comparison with other technologies. For example, Deo and Ferrar [16] evaluated LCA during the design phase of two onsite small-scale wastewater treatment systems (CW and activated sludge system) employing three different impact assessment methods: IPCC 2007, Ecological footprints, and ReCiPe 2008 H. Likewise, Yildirim and Topkaya [17] carried out a comparative LCA of three treatment technologies (CW, activated sludge system, and vegetated land treatment) for small communities using SimaPro 7.1 software. Their analysis aimed to assess the environmental trade-offs among these systems. Likewise, studies by Yildirim and Topkaya [17], Nogueira et al. [18], and Garfi et al. [19] explored various wastewater treatment alternatives for decentralized applications. Nogueira et al. [18] specifically evaluated the economic and environmental performance of CW, slow-rate infiltration systems, and activated sludge system, utilizing SimaPro 7 software for impact modeling. Similarly, Garfi et al. [19] conducted a comparative LCA of CW, high-rate algal ponds, and an activated sludge system using SimaPro 8, applying the ReCiPe midpoint method to evaluate environmental impacts. Flores et al. [20] assessed the carbon footprint of constructed wetlands for winery wastewater treatment and compared the results to those from third-party management and CAS systems. Their analysis measured both direct and indirect greenhouse gas (GHG) emissions of the three technologies on-site. Their study measured both direct and indirect greenhouse gas (GHG) emissions generated on-site. The results revealed that CWs had the lowest carbon footprint (1.2 kg CO2eq mwater−3), while third-party management and the CAS systems exhibited significantly higher carbon footprints at 521.2 kg CO2eq mwater−3 and 4.51.2 kg CO2eq mwater−3, respectively. Additionally, their techno-economic analysis, which compares the capital cost and the operation and maintenance costs of each system, showed that CWs offered considerable cost savings, with potential reductions in capital expenditure of up to 50% and operation and maintenance costs by as much as 98%, positioning CWs as an economically and environmentally favorable option for winery wastewater management.
Across all these studies, including earlier studies performed by [3], as shown in Table 1, CW consistently emerged as the most environmentally favorable option based on LCA analysis. However, with the emergence of microbial fuel cells integrated into constructed wetlands, very few studies have assessed the environmental impact of CW–MFC. Corbella et al. [21] conducted the first LCA on CW–MFC system, comparing three configurations: a CW integrated with a gravel-based anode MFC, another with a graphite-based anode MFC, and a traditional CW configuration. Using SimaPro 8 software, their comparative LCA study revealed that all systems had comparable environmental impacts across most categories, with the exception of abiotic depletion potential (ADP), where differences were observed. Among the systems analyzed, the CW–MFC utilizing a gravel-based anode showed nearly double the environmental burden in the ADP category compared to both the conventional CW and the graphite-anode CW–MFC. Consequently, the graphite-based CW–MFC was identified as the most sustainable configuration, demonstrating the potential to replace traditional CW systems while achieving a reduction of up to 20% in overall environmental footprint.
On the other hand, in a recent study, Fang et al. [22] evaluated and assessed the environmental impacts and economic performance of conventional CW and bio-electrochemical-constructed wetland (ECW) using the LCA method. Their results showed that the ECW functioning similarly to CW–MFC significantly impacted the aquatic environment (marine aquatic ecotoxicity). Based on the differing results, Fang et al. [22] concluded their study by stating clearly that the sustainability of ECW is still debatable. This creates a latitude for a more rigorous assessment of CW–MFC than its conventional systems. Table 1 shows that previous LCAs have predominantly compared CWs with conventional technologies, such as activated sludge systems or vegetated land treatment. Few studies include MFCs or CW–MFCs as part of the comparison (e.g., Fang et al. [22]), and the results remain inconsistent or incomplete regarding economic and environmental trade-offs.
In response to these gaps, the present study offers a novel and holistic evaluation of three wastewater treatment technologies (CW, MFC, and CW–MFC), focusing on both environmental impact and economic feasibility. This work distinguishes itself by employing advanced impact assessment tools, including TRACI 2021 and ReCiPe 2016, to comprehensively address critical indicators such as eutrophication, eco-toxicity, and human health impacts. The use of the latest GaBi LCA software 9.2 with Education Database Edition 2020 and updated methodologies aligned with the Intergovernmental Panel on Climate Change (IPCC) AR5 and AR6 enables more accurate and robust environmental decision-making. Additionally, this study specifically evaluates the construction and operation phases of each system, providing a life cycle perspective that enhances the reliability and applicability of the findings. Through this integrated approach, the study aims to clarify the sustainability potential of CW–MFC systems and guide future design and policy directions in wastewater treatment technology.

2. Materials and Methods

A comprehensive method for evaluating the environmental impact of wastewater treatment technologies is through life cycle assessment. This approach systematically examines the inputs, outputs, and potential environmental effects of a product or technology across its entire lifespan, from production to disposal. Like other system analysis tools, LCA helps distil complex processes into more manageable assessments [13].
In this study, following the ISO14040:2006 procedure for LCA [14] as shown in Figure 1, GaBi software alongside TRACI 2021 and ReCiPe 2016 Endpoint methods were used to perform a comparative environmental impact assessment and economic viability of CW, MFC, and CW–MFC with a focus on the construction and operation phases [16].

2.1. Goal of the LCA

The LCA aims to assess and compare the potential environmental impacts of CW, MFC, and CW–MFC as substitute technologies or best available technology (BAT) for domestic waste management and energy recovery. The functional unit was 1 m3 of treated wastewater.

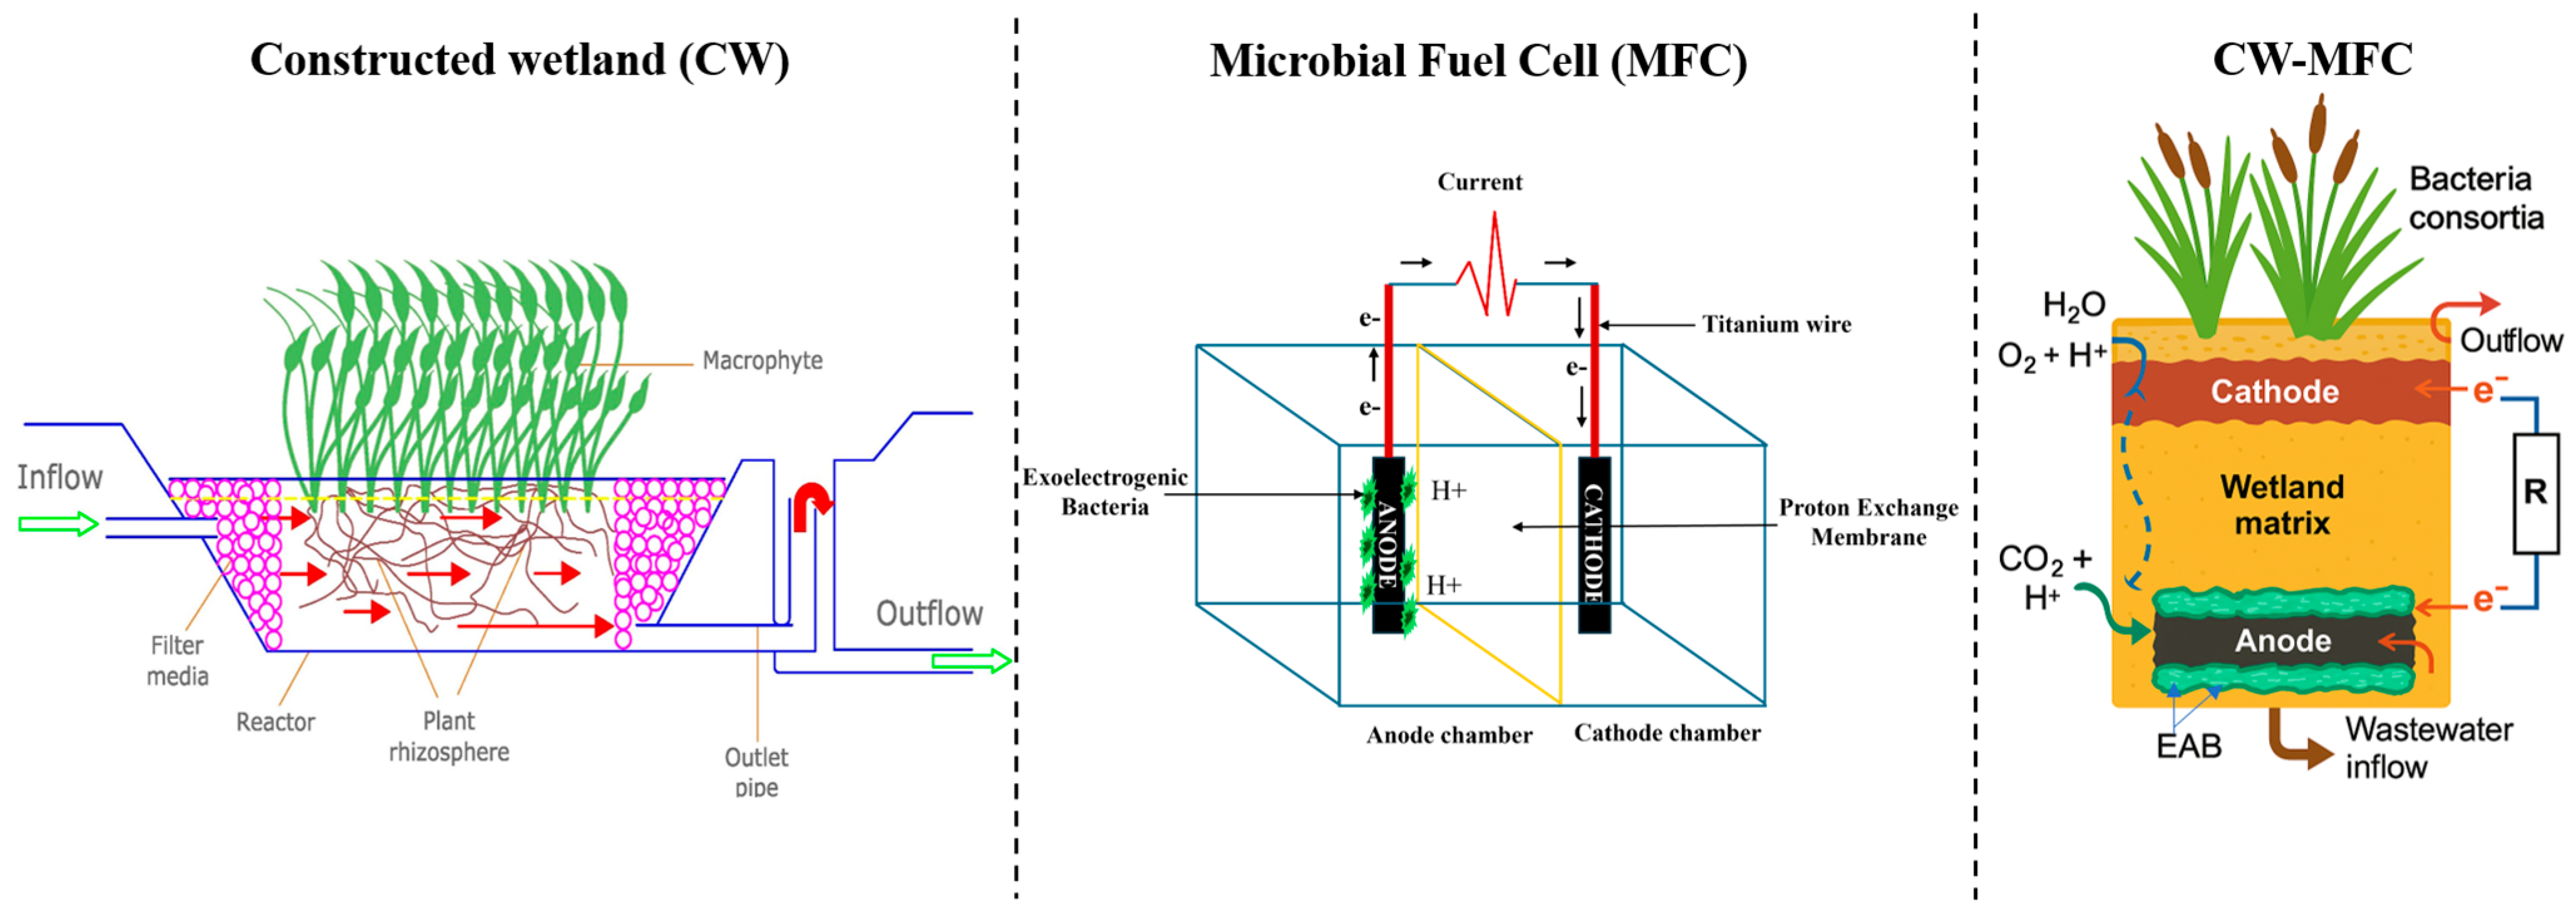
2.2. System Description

Three lab-scale microcosms of CW, MFC, and CW–MFC were fabricated to treat domestic wastewater, as shown in Figure 2. The CW and CW–MFC microcosms were fabricated using a polyethylene high-density container with dimensions 0.3 m ∗ 0.24 m ∗ 0.24 m and a working volume of 0.016 m3. They were filled with a multi-mixed media of zeolite, gravel, and activated carbon overlaid at different depths of the reactor. The porosity for each media was determined to be 59%, 55%, and 47%. Each reactor was planted with Juncus effusus and Iris pseudacorus as the macrophyte species. The CW–MFC was also installed with a graphite plate electrode as both the anode and cathode material for current collection. The surface area of the anode and cathode material was measured to be 450 cm2 and 230 cm2. The design of these microcosms was to treat typical domestic wastewater with the following influent contaminant concentrations: COD (1500 mg/L), TN (68 mg/L), NO3 (85 mg/L), and TP (95 mg/L). Systems were operated at a flow rate of 23 mL/min and HRT of 3 days. The effluent characteristics are listed in the inventory.
The microbial fuel cell microcosm was constructed using a 2 cm thick transparent acrylic sheet shaped like a rectangular prism. The anodic electrodes were made of a 368.4 cm2 graphite plate with carbon felt. The entire anode chamber with an internal volume of 1.5 L was separated from the cathode chamber by a 336 cm2 cation-exchange membrane (CEM, CMI-7000S, Membranes International Inc., Ringwood, NJ, USA). The cathode chamber was a rectangular acrylic sheet cuboid with an internal volume of 1 L at an elongated height of 20 cm. A titanium wire was used to connect both electrodes to an external load. With similar wastewater concentrations as CW and CW–MFC, the MFC had a total working volume of 0.0015 m3 and was operated under a flow rate of 18 min/mL and HRT of 3.5 days. The effluent concentration of wastewater after treatment is detailed in the inventory.

2.3. System Boundary for LCA

The systems under investigation include three (3) different wastewater treatment technologies: CW, MFC, and CW–MFC. The LCA is conducted using a cradle-to-gate approach, encompassing both construction and operation phases for each system. The demolition or disposal phase is excluded from the analysis, based on the assumption that most of the structural materials are either recycled or reused, resulting in negligible environmental impacts compared to the construction and operation phases [8,21].
As illustrated in Figure 3a, the system boundary is clearly defined to include all foreground processes directly associated with the construction (e.g., material preparation and transportation) and operation (e.g., material preparation and chemical inputs) of the treatment systems. Inputs such as electricity, construction materials, and operational chemicals, as well as outputs like emissions, effluents, treated water, and energy produced, were all considered within this boundary.
Figure 3b presents a detailed process flow diagram developed using GaBi software, which maps the movement of materials and energy across the construction and operational phases. The diagram includes upstream flows, such as electricity from the regional grid, diesel fuel for transportation (e.g., 20-ton truck), and raw material inputs, and connects these with background data from GaBi’s life cycle inventory database. This modular representation enables accurate and transparent modeling of the environmental burdens associated with each life cycle stage.

2.4. Inventory Data Collection, Classification, and Characterization

Inventory data were collected and calculated for the construction and operational stages of all three technologies. Inventory data were related to the processes of GaBi databases. The following aspects and phases were considered in the inventory data collection: construction materials, sewerage system, electricity, chemical use, emissions to air and water, and discharge values to evaluate comparative impact assessment and to determine the phase that influences the performance of a treatment system. The environmental loads from the inventory analysis were further classified and assigned to their related impact categories. The following impact categories were selected for the study: abiotic depletion, global warming, ozone layer depletion, eutrophication, and acidification [15]. In addition, each of the environmental loads identified and assigned to a class were characterized using the TRACI 2.1 Midpoint method. This is because it is one of the few that considers nutrients (phosphorus and nitrogen) and organic matter as emissions. Characterization is essential for better interpretation of results [15]. The impact assessment method was based on the TRACI 2.1 baseline methodology. Characterization factors and local parameters are summarized in Supplementary Table S1. Detailed process flows and inventories for the three systems are illustrated in Figure 3a,b and Table 2, respectively. For the local data parameters, we used the electricity mix from the USA grid (East coast) since the research project location was in Maryland, USA. For the diesel fuel used for truck transportation, we selected the diesel mix at the refinery in the USA as our local parameter. Transportation distances and operational parameters are provided in the life cycle inventory sheet shown in Table 2.
Environmental impacts were not only calculated as total aggregated values but also disaggregated to show the contributions of major processes and components, as shown in Table S2. This was achieved by tracking input–output flows for each subsystem in the GaBi software and assigning impacts based on their inventories.

2.5. Techno-Economic Analysis

The economic evaluation of the three wastewater treatment technologies: CW, MFC, and the hybrid CW–MFC was conducted using a bottom-up costing approach in Microsoft Excel, based on the life cycle assessment inventory data developed for each system. The analysis focused on three cost categories: (i) construction cost (excluding land acquisition), (ii) annual operation and maintenance (O&M) costs, and (iii) material and energy input costs. Costs were calculated using unit prices sourced from recent market data, scientific literature, and supplier quotations, reflecting current values in USD. The construction cost included expenses related to materials such as substrates, piping, electrodes, membranes, and structural components. Operation and maintenance costs accounted for energy consumption and energy generation, component replacement, and labor requirements. All cost values were calculated on a per-functional-unit basis (i.e., per m3 of wastewater treated), allowing for direct comparison between systems. In addition, the energy generation from MFC and CW–MFC systems was monetized based on average local electricity tariffs and used to offset the annual O&M costs. This provided a simplified estimate of net operational costs over one year without incorporating long-term discounting or discount cash flow (DCF) modeling.

3. Results and Discussion

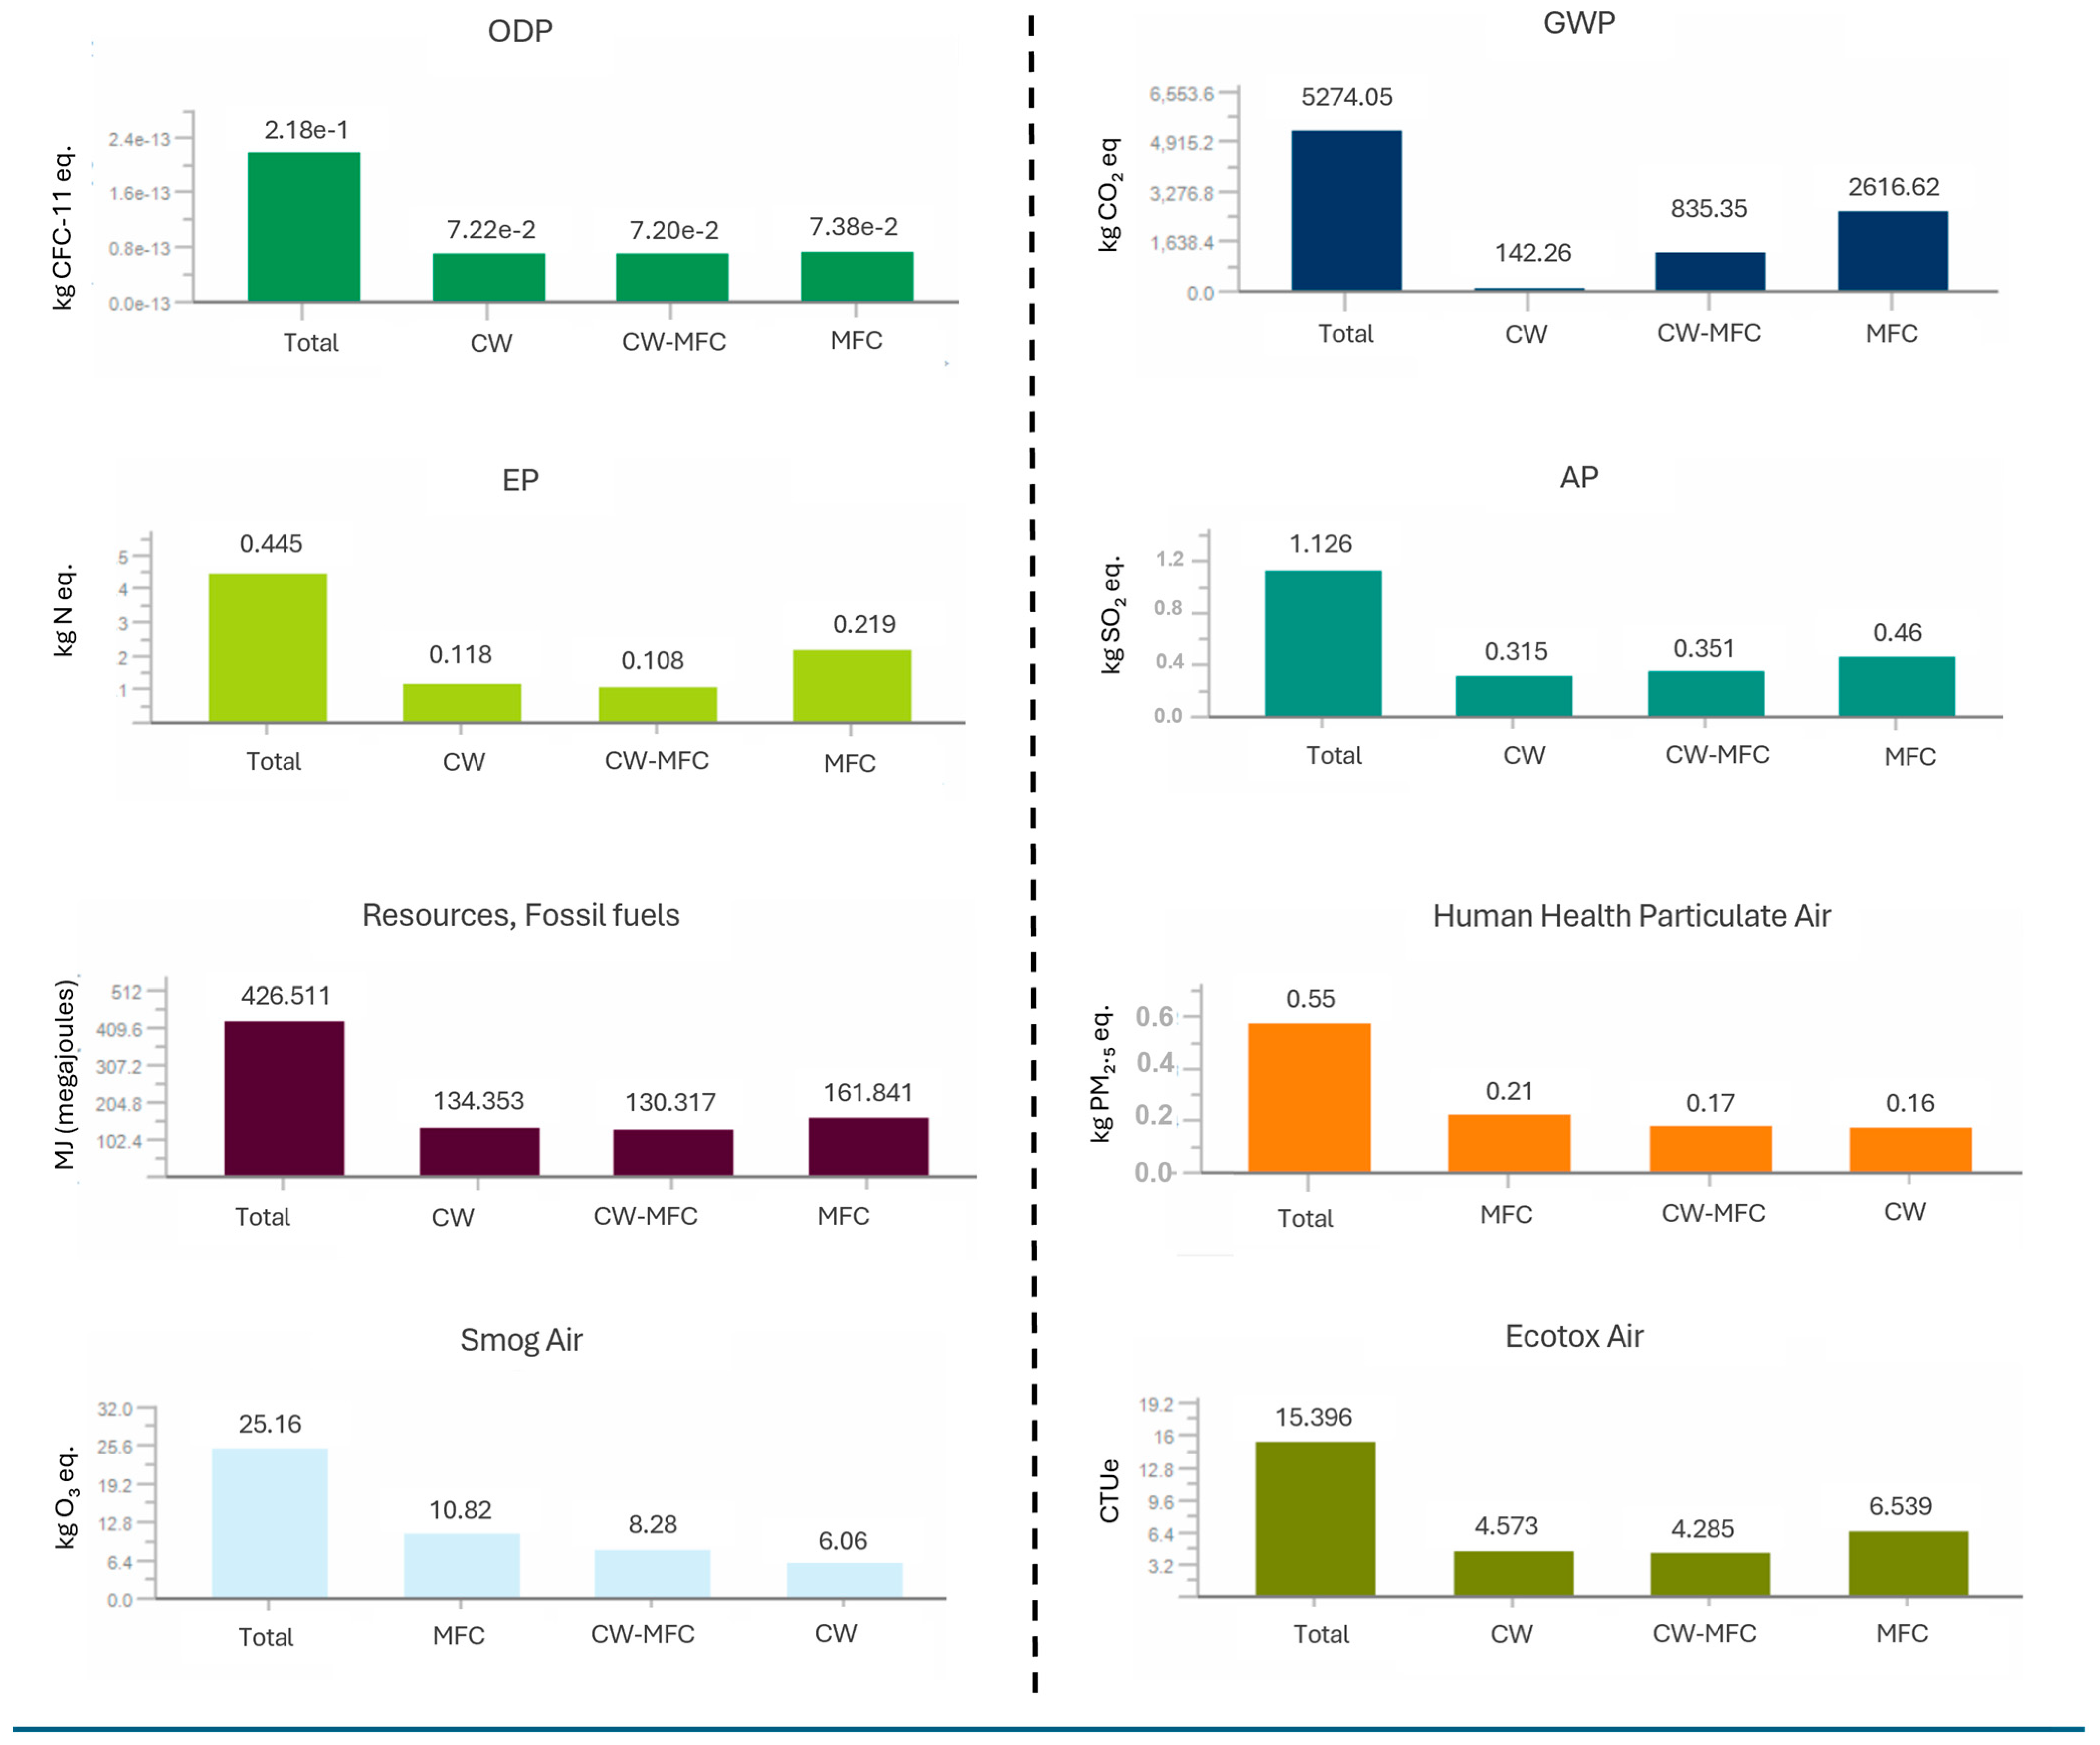
3.1. Impact Assessment

Following the ISO standard procedure, potential environmental impacts were evaluated using the TRACI 2.1 method. The impact analysis was centered on the following categories: ozone depletion, carcinogenic and non-carcinogenic, respiratory effects, eutrophication, acidification, smog, fossil fuel depletion, global warming, and ozone ecotoxicity.
The results from Figure 4 indicate a minimal impact of CW and CW–MFC on ozone depletion compared to MFC due to differences in their materials, design, and reliance on natural processes. In CW and CW–MFCs, minimal use of synthetic chemicals and reliance on energy-intensive processes result in less direct or indirect ozone-depleting substance (ODS) [21,23,24]. However, the high percentage of ozone depletion in MFC can be attributed to the use of materials such as proton-exchange membranes (PEMs), electrodes, and catalysts, often made from specialized polymers and metals whose production involves energy-intensive processes and chemicals that directly or indirectly release ozone-depleting substances (ODSs) [24,25].
Similar reasons can be attributed to the results obtained for the fossil fuel depletion, smog, carcinogenic, and acidification potential categories, especially during the construction phase of MFC, as shown in Figure 5. The extraction of carbon-based electrodes produces nitrogen oxides (NOxs) and volatile organic compounds (VOCs), key contributors to smog. Moreover, due to the energy-intensive manufacturing of advanced materials, such as electrodes used in MFCs, the process can emit acidifying gases, including sulfur dioxide (SO2) and NOx [25,26,27].
In contrast, CW and CW–MFC utilize natural materials and biological processes that emit fewer acidifying substances and smog while mitigating airborne pollutants through plant uptake and microbial activity, reducing SO2 and NOx. In addition, integrating MFCs in CWs enhances the treatment process by reducing emissions from nutrient volatilization, such as ammonia, which contributes to acidification [28,29]. The results also show that CW, CW–MFC, and MFC demonstrated global warming potentials (GWPs) of 142.26 kg CO2-eq, 836.35 kg CO2-eq, and 2615.62 kg CO2-eq, respectively. The relatively lower GWP in CW can be attributed to its primary reliance on natural processes for wastewater treatment, with minimal energy consumption and infrastructure requirements, compared with MFC, which demonstrated the highest GWP [30,31]. Moreover, the disaggregated results (Table S2) show that the operational phase is the major contributor to the GWP across all three systems. Among them, the MFC system had the highest operational emissions (2.77 × 10³ kg CO2 eq), followed by CW–MFC (2.68 × 10³ kg CO2 eq) and CW (2.4 × 10³ kg CO2 eq). Electricity use during operation was consistent (~101 kg CO2 eq), while contributions from construction, diesel, and transportation were relatively minor. This indicates that efforts to reduce GWP should focus primarily on optimizing energy use during the operational phase.
Similar reasons, such as the use of energy-intensive materials, as mentioned above, can be attributed to the values obtained for MFC. In addition, the fabrication and maintenance of MFCs involve industrial processes that result in substantial greenhouse gas (GHG) emissions, compared to the simpler designs of CW and CW–MFC systems. These findings are consistent with Zhang et al. [32], who observed that CWs offer lower carbon footprints due to minimal need for synthetic components and the ability to leverage ambient environmental conditions. Likewise, Jacobs et al. [23] emphasized that the embodied energy of materials, graphite plate, titanium wire, and proton-exchange membranes, significantly increases the life-cycle emissions of MFCs. Moreover, CW–MFCs demonstrated intermediate GWP values. This can be attributed to the hybrid system’s partial use of natural materials (e.g., plants and soil), which have lower embodied energy than synthetic materials used in MFCs alone [23].
Notably, the CW–MFC system’s ability to couple wastewater treatment with bioelectricity production provides some offsetting of emissions, although the benefit is currently limited by scale and conversion efficiency [33,34]. Additionally, Wang et el. [35] highlighted that operational strategies such as optimizing plant selection and electrode spacing can further reduce emissions in CW–MFCs. Hence, while CW remains the lowest GWP option, future CW–MFC designs may improve their environmental profile by incorporating low-carbon materials and recovering more energy.
The eutrophication potential (EP) results indicate the environmental burden of nutrient enrichment due to nitrogen and phosphorus emissions from the three different systems. Under eutrophication potential, CW–MFC demonstrated the lowest eutrophication potential (EP) of 0.108 kg N-eq, outperforming both CW (0.118 kg N-eq) and MFC (0.219 kg N-eq). This reduction is largely due to the enhanced removal of pollutants (nitrogen and phosphorus) and electricity generation resulting from the synergistic effect of the bioelectrochemical processes in CW–MFCs. The integrated processes not only facilitate more effective denitrification but also reduce nutrient leaching and volatilization, which are key contributors to eutrophication and secondary impacts of smog formation [28,36,37]. For example, previous studies by Ge et al. [28], Yang et al. [29], and Zhang et al. [36], have highlighted the superior denitrification efficiency and reduced emissions of ammonia and phosphorus in CW-MFC compared to standalone CW or MFC configurations. This synergy minimizes environmental burdens by combining biological uptake with electrochemical transformations, supporting CW–MFCs as a low-impact and multifunctional alternative for sustainable wastewater treatment.
Although CW generally achieved a lower impact across several categories, the results also reinforce the environmental advantage of hybrid systems like CW–MFC. Integrating microbial fuel cell technology within a constructed wetland benefits the system through filtration processes while generating renewable energy, thereby reducing ecotoxicity, acidification, ozone depletion, and fossil fuel depletion. MFC systems, although innovative for energy recovery, utilize resource-intensive materials and processes that result in higher impacts in these categories.

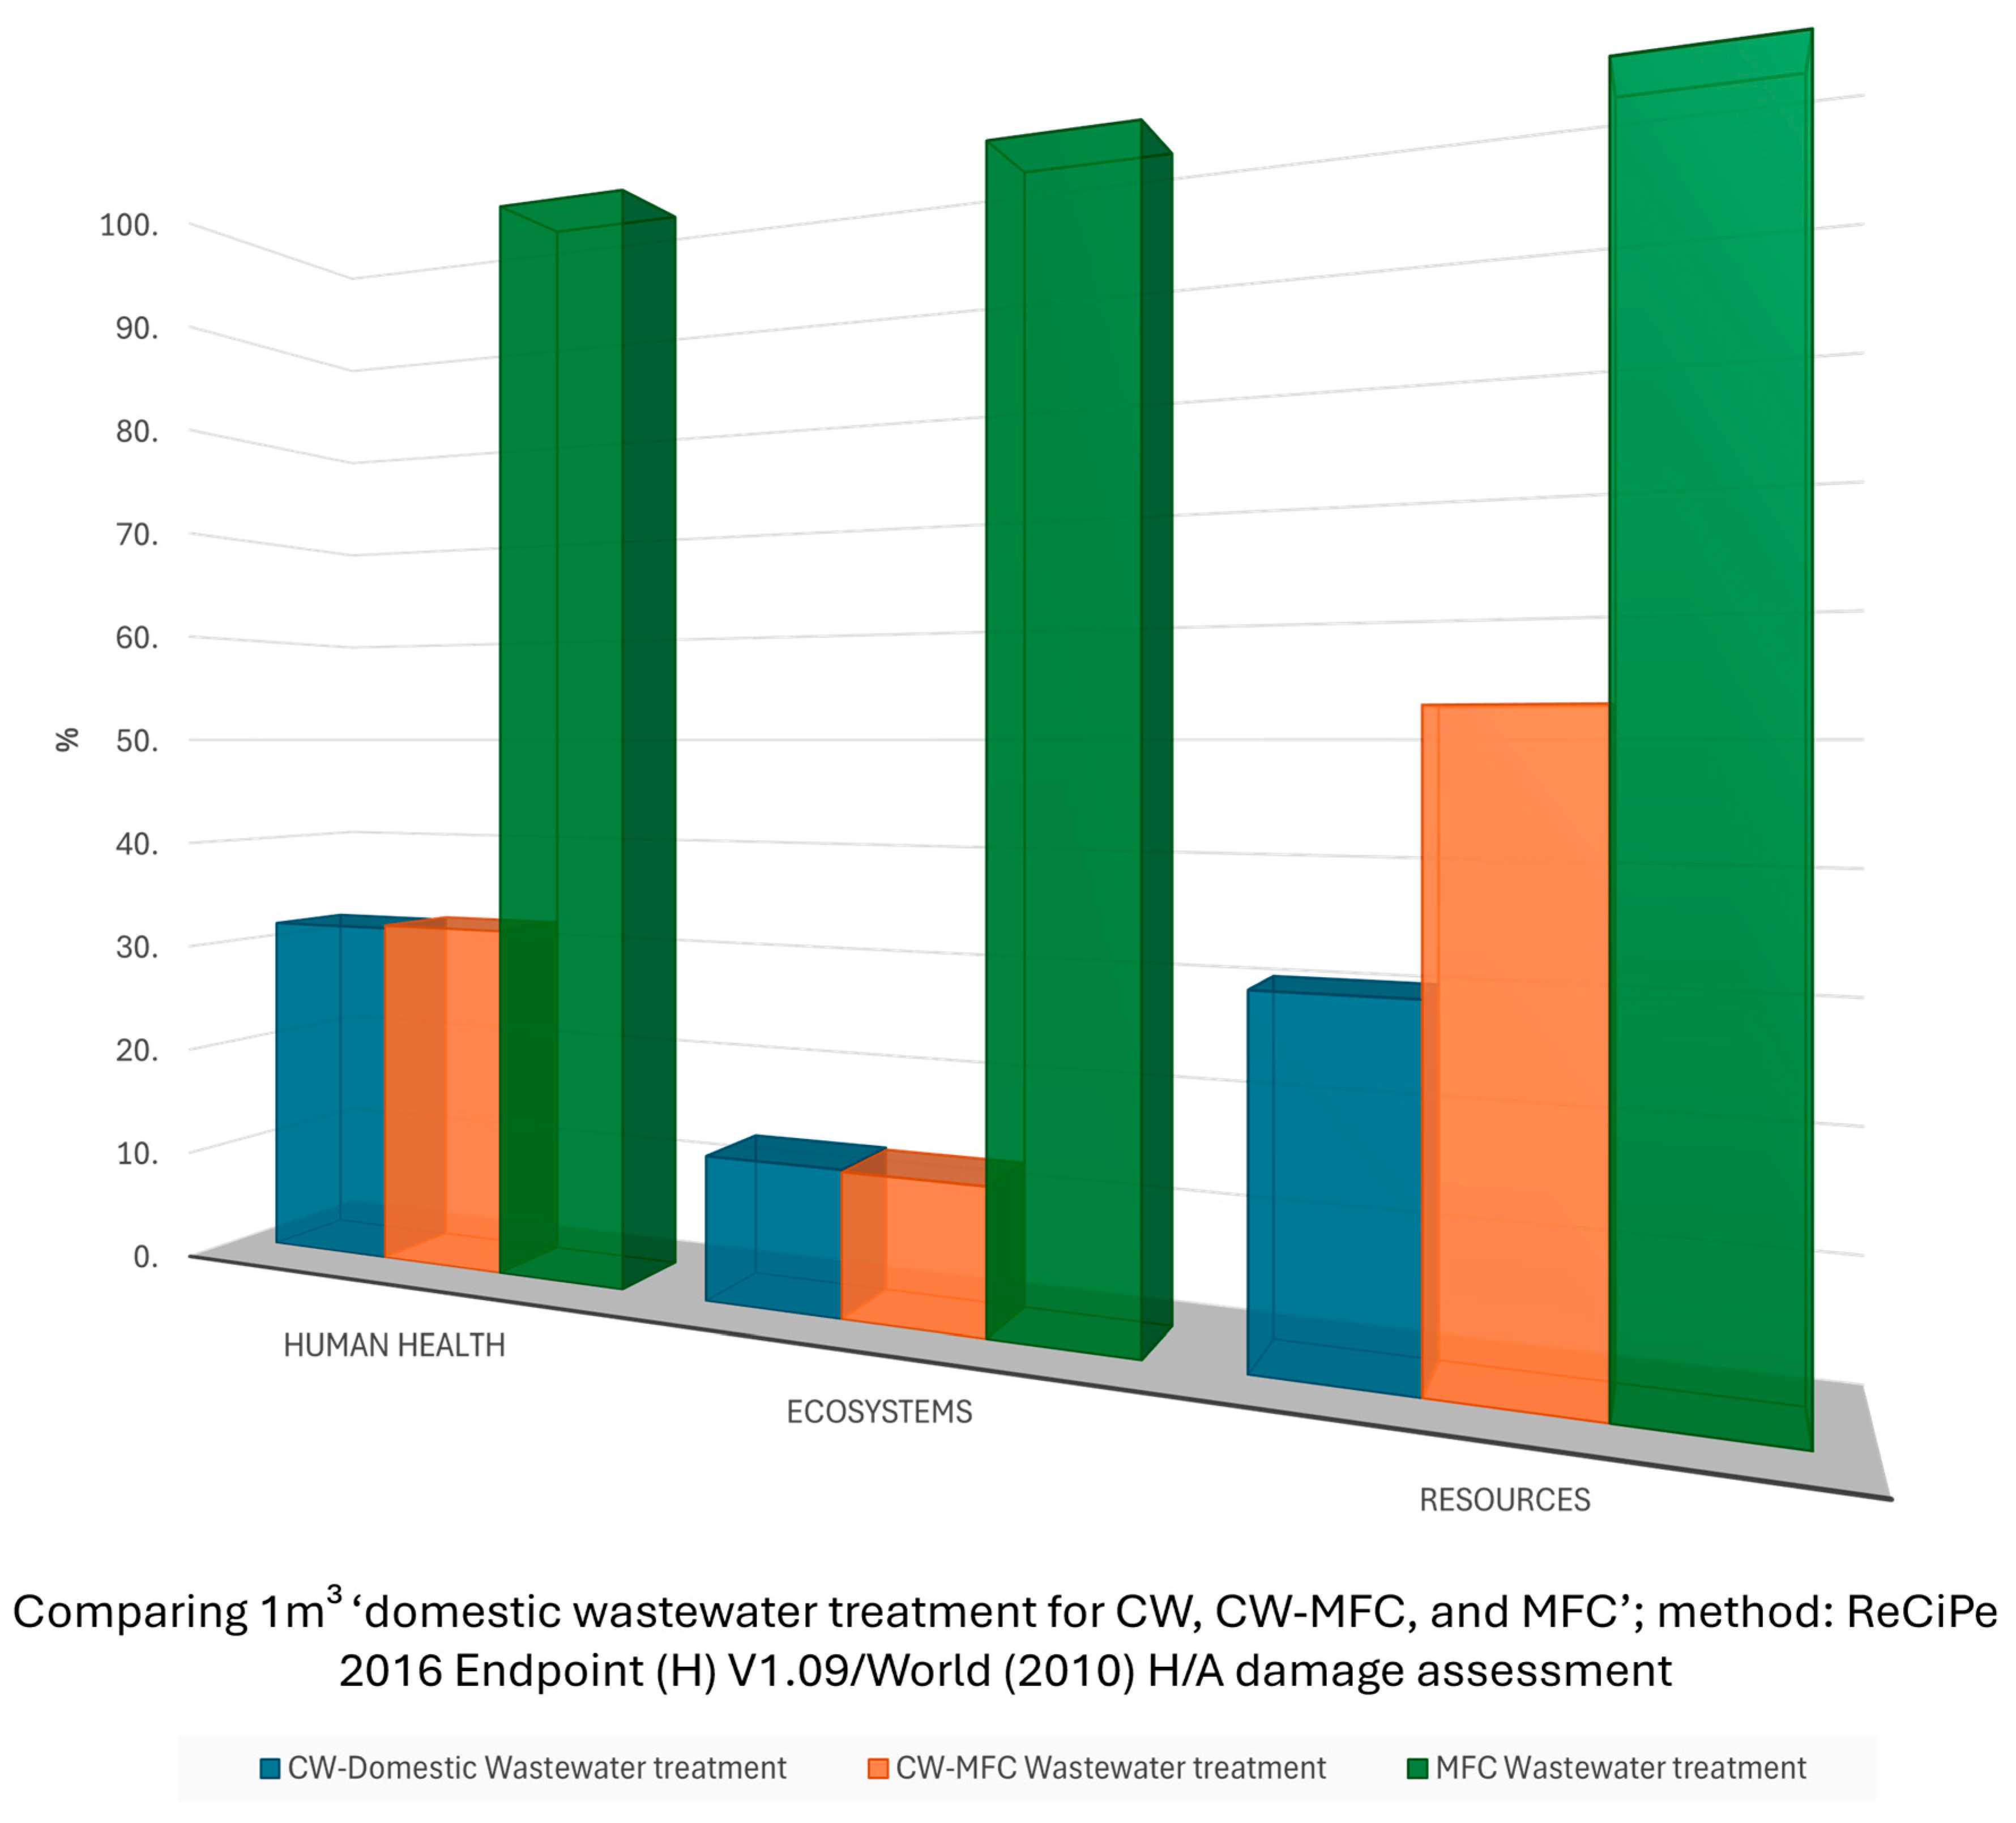
3.2. Damage Assessment

Based on the analysis of the impact categories for CW, MFC, and CW–MFC, the ReCiPe 2016 Endpoint damage assessment method was used to evaluate the holistic environmental impacts of these systems across three categories: human health, ecosystems, and resources, as shown in Figure 6. The results were normalized on a percentage scale. This assessment is crucial because it offers a comprehensive and streamlined approach for evaluating and interpreting impacts relevant to strategic decision-making and stakeholder communication. From Figure 6, the MFC (green) exhibits the highest human health impact compared to the CW–MFC (orange) and CW (blue). The impacts on ecosystems are relatively low across all treatment methods, with the CW system showing slightly lower impacts than the others. The MFC system significantly impacts resource utilization, which is expected due to the resource-intensive nature of MFC fabrication, including the use of specialized materials and high-energy inputs. However, the results indicate that the CW–MFC hybrid system has a lower resource impact than the pure MFC system, which may reflect reduced resource demands resulting from the combination of CWs’ passive treatment [21].
Although the treatment efficiencies of CW were generally lower than those of CW–MFC and MFC for all effluent contaminants, as highlighted in the inventory, the LCA analysis for the construction and operation phases of these technologies shows that CWs are the most ecologically friendly option among the three technologies. Their reliance on passive, natural biological processes results in low resource consumption and minimal environmental impacts, particularly on ecosystems and human health. These findings align with previous studies by Machado et al. [3] and Flores et al. [20], which also identified constructed wetlands as low-impact wastewater treatment systems with favorable sustainability profiles. Moreover, the MFC demonstrated the highest environmental burden, particularly in terms of resource consumption, primarily due to the use of energy-intensive materials, electrode fabrication, and the need for precise operational control [23,25]. These drawbacks raise concerns regarding their feasibility at larger scales unless significant material and process optimization is undertaken. Remarkably, the CW–MFC system presents a middle ground in terms of environmental impact, with the highest treatment efficiency of 82.8%, 87.13%, 78.13%, and 90.3% for COD, NO3, TN, and TP. This supports earlier work suggesting that coupling CWs with bioelectrochemical systems can yield synergistic benefits [28,29,36,38]. However, further efforts must be directed toward reducing the environmental footprint of materials and optimizing operational parameters to make them more competitive for large-scale or decentralized applications.

3.3. Economic Analysis

Table 3 presents the economic analysis results, illustrating the investment and operational costs for each technology. The economic analysis of the three wastewater treatment technologies (CW, MFC, and CW–MFC) highlights significant differences in construction, operation, and total costs. As anticipated, CW has the lowest total cost at USD 627/m3, with construction costs of USD 328.33/m3 and operating costs of USD 299/m3. This is primarily due to the minimal amount of material input required for their assemblage and CW’s reliance on natural processes and simple materials such as gravel, zeolite, and vegetation, which are readily available and inexpensive. The economic viability of CW aligns with findings from Flores et al. [20], who identified CW as a cost-effective technology for winery wastewater treatment, achieving up to a 50% reduction in capital costs and a 98% decrease in operation and maintenance costs compared to conventional activated sludge systems.
On the other hand, microbial fuel cells (MFCs) exhibit the highest total cost at USD 888.90/m3, driven by substantial construction costs of USD 614.90/m3, despite having the lowest operational cost of USD 274/m3. While the lowered operation costs are attributed to estimated revenue generation from their electrical output, the elevated construction costs are attributed to the advanced materials required for MFCs, including proton-exchange membranes (PEMs), graphite electrodes, and specialized catalysts. These components are energy-intensive to produce and contribute significantly to MFC systems’ economic and environmental burden [23]. However, integrating microbial fuel cells within constructed wetlands (CW–MFC) offers a balanced approach, costing USD 718.33/m3, comprising USD 439.33/m3 for construction and USD 279/m3 for operation. These results align with findings in existing literature and underscore the trade-offs between cost, environmental impacts, and system performance.
However, the economic analysis indicates that CW is ideal for cost-sensitive projects. MFC holds potential for innovation and energy recovery but requires cost optimizations. CW–MFC offers a middle ground, delivering both environmental and operational benefits at moderate costs.

4. Conclusions

The comparative analysis of CW, MFC, and CW–MFC reveals significant differences in their environmental and economic performance. CW systems demonstrate the lowest environmental burden, making them a sustainable choice for wastewater treatment. However, integrating MFCs in CW systems enhances treatment efficiency and electricity generation, offering a viable middle ground for balancing environmental and operational benefits. While MFCs promise energy recovery, their high material and fabrication demands currently limit their large-scale applicability.
CW–MFC systems emerge as a promising alternative, combining the ecological benefits of CW with the innovative capabilities of MFC. Future efforts should optimize material and energy use in hybrid systems to improve their environmental competitiveness, economic feasibility, and scalability.
These findings contribute valuable insights into advancing sustainable wastewater treatment by offering a comprehensive performance comparison of three key technologies. The study positions CW–MFCs as a promising low-impact, energy-generating alternative that balances treatment performance with sustainability. It also provides practical guidance on design trade-offs, such as the need to balance material and energy inputs (e.g., electrode and membrane use) with the benefits of enhanced pollutant removal and electricity generation. Optimization strategies through the selection of locally sourced or recycled materials to reduce embodied emissions for system integration to minimize operational burdens. These recommendations support the development of decentralized, best-available technologies (BATs) that are aligned with global sustainable wastewater management goals.

Supplementary Materials

The following supporting information can be downloaded at: https://www.mdpi.com/article/10.3390/cleantechnol7030057/s1, Table S1. Impact categories with characterization factors for impact assessment; Table S2. Component-by-Component Contributions. The Table S1 is adapted from [39].

Author Contributions

Conceptualization, N.M. and J.H.; methodology, N.M. and S.O.A.; software, N.M. and S.O.A.; validation, J.H., G.O. and G.M.; formal analysis, N.M. and S.O.A.; investigation, N.M.; resources, J.H. and G.O.; data curation, N.M.; writing—original draft preparation, N.M.; writing—review and editing, N.M. and N.B.; visualization, N.B.; supervision, J.H. and G.O.; project administration, J.H. All authors have read and agreed to the published version of the manuscript.

Funding

This research received no external funding.

Data Availability Statement

Data will be made available upon request.

Acknowledgments

We acknowledge the support of Morgan State University and Tianjin University for the institutional and technical support given towards the success of this work. While preparing this manuscript/study, we used GaBi, Origin Lab version 2024, for data analysis and visualization. The authors have reviewed and edited the output and take full responsibility for the content of this publication.

Conflicts of Interest

The authors declare no conflicts of interest. The funders had no role in the design of the study; in the collection, analyses, or interpretation of data; in the writing of the manuscript; or in the decision to publish the results.

Abbreviations

The following abbreviations are used in this manuscript:
MFCMicrobial fuel cell
CWConstructed wetland
CW–MFCConstructed wetland–microbial fuel cell
TEATechno-economic analysis
LCALife Cycle Analysis
SDGsSustainable Development Goals
MCDAMulti-criteria Decision Analysis
GHGGreenhouse Gas
CASConventional Activated Sludge
IPCCIntergovernmental Panel on Climate Change
SRI Slow Rate Infiltration
ISOInternational Standards Organization
BAT Best-available technology
CEMCation-Exchange Membrane
CODChemical Oxidation Demand
TNTotal Nitrogen
NO3Nitrate
TPTotal Phosphorus
VOCsVolatile Organic Compounds
EPEutrophication potential
GWPsGlobal warming potentials
ODPOzone Depletion Potential
APAcidification Potential
O&MOperation and Maintenance

References

  1. Odinga, C.A.; Swalaha, F.M.; Otieno, F.A.O.; Ranjith, K.R.; Bux, F. Investigating the efficiency of constructed wetlands in the removal of heavy metals and enteric pathogens from wastewater. Environ. Technol. Rev. 2013, 2, 37–41. [Google Scholar] [CrossRef]
  2. Matesun, J.; Petrik, L.; Musvoto, E.; Ayinde, W.; Ikumi, D. Limitations of wastewater treatment plants in removing trace anthropogenic biomarkers and future directions: A review. Ecotoxicol. Environ. Saf. 2024, 281, 116610. [Google Scholar] [CrossRef] [PubMed]
  3. Machado, A.P.; Urbano, L.; Brito, A.G.; Janknecht, P.; Salas, J.J.; Nogueira, R. Life cycle assessment of wastewater treatment options for small and decentralized communities. Water Sci. Technol. 2007, 56, 15–22. [Google Scholar] [CrossRef] [PubMed]
  4. United Nations. Report of the Secretary-General on SDG Progress 2019: Special Edition; United Nations Publ.: New York, NY, USA, 2019; pp. 1–64. Available online: https://sustainabledevelopment.un.org/content/documents/24978Report_of_the_SG_on_SDG_Progress_2019.pdf (accessed on 23 February 2025).
  5. Obaideen, K.; Shehata, N.; Sayed, E.T.; Abdelkareem, M.A.; Mahmoud, M.S.; Olabi, A.G. The role of wastewater treatment in achieving sustainable development goals (SDGs) and sustainability guideline. Energy Nexus 2022, 7, 100112. [Google Scholar] [CrossRef]
  6. Nishat, A.; Yusuf, M.; Qadir, A.; Ezaier, Y.; Vambol, V.; Khan, M.I.; Moussa, S.B.; Kamyab, H.; Sehgal, S.S.; Prakash, C.; et al. Wastewater treatment: A short assessment on available techniques. Alex. Eng. J. 2023, 76, 505–516. [Google Scholar] [CrossRef]
  7. Sánchez-García, E.; Martínez-Falcó, J.; Marco-Lajara, B.; Manresa-Marhuenda, E. Revolutionizing the circular economy through new technologies: A new era of sustainable progress. Environ. Technol. Innov. 2024, 33, 103509. [Google Scholar] [CrossRef]
  8. Lopsik, K. Life cycle assessment of small-scale constructed wetland and extended aeration activated sludge wastewater treatment system. Int. J. Environ. Sci. Technol. 2013, 10, 1295–1308. [Google Scholar] [CrossRef]
  9. Dixon, A.; Simon, M.; Burkitt, T. Assessing the environmental impact of two options for small-scale wastewater treatment: Comparing a reedbed and an aerated biological filter using a life cycle approach. Ecol. Eng. 2003, 20, 297–308. [Google Scholar] [CrossRef]
  10. Corominas, L.; Foley, J.; Guest, J.S.; Hospido, A.; Larsen, H.F.; Morera, S.; Shaw, A. Life cycle assessment applied to wastewater treatment: State of the art. Water Res. 2013, 47, 5480–5492. [Google Scholar] [CrossRef]
  11. Miwornunyuie, N.; Mao, G.; Benani, N.; Dankwa, J.; Hunter, J. Investigating the research and development status and trends of constructed wetlands: A bibliometric and patent analysis. J. Water Process Eng. 2024, 63, 105430. [Google Scholar] [CrossRef]
  12. Liu, M.; Zhu, G.; Tian, Y. The historical evolution and research trends of life cycle assessment. Green Carbon 2024, 2, 425–437. [Google Scholar] [CrossRef]
  13. Finkbeiner, M.; Inaba, A.; Tan, R.; Christiansen, K.; Klüppel, H.-J. The New International Standards for Life Cycle Assessment: ISO 14040 and ISO 14044. Int. J. Life Cycle Assess. 2006, 11, 80–85. [Google Scholar] [CrossRef]
  14. ISO 14040:2006; Environmental Management—Life Cycle Assessment—Principles and Framework. ISO: Geneva, Switzerland, 2004. Available online: https://www.iso.org/standard/23151.html (accessed on 18 March 2025).
  15. Weiss, P.; Eveborn, D.; Kärrman, E.; Gustafsson, J.P. Environmental systems analysis of four on-site wastewater treatment options. Resour. Conserv. Recycl. 2008, 52, 1153–1161. [Google Scholar] [CrossRef]
  16. De Feo, G.; Ferrara, C. A procedure for evaluating the most environmentally sound alternative between two on-site small-scale wastewater treatment systems. J. Clean. Prod. 2017, 164, 124–136. [Google Scholar] [CrossRef]
  17. Yildirim, M.; Topkaya, B. Assessing environmental impacts of wastewater treatment alternatives for small-scale communities. Clean-Soil Air Water 2012, 40, 171–178. [Google Scholar] [CrossRef]
  18. Nogueira, R.; Brito, A.G.; Machado, A.P.; Janknecht, P.; Salas, J.J.; Vera, L.; Martel, G. Economic and environmental assessment of small and decentralized wastewater treatment systems. Desalin. Water Treat. 2009, 4, 16–21. [Google Scholar] [CrossRef]
  19. Garfí, M.; Flores, L.; Ferrer, I. Life Cycle Assessment of wastewater treatment systems for small communities: Activated sludge, constructed wetlands and high rate algal ponds. J. Clean. Prod. 2017, 161, 211–219. [Google Scholar] [CrossRef]
  20. Flores, L.; García, J.; Pena, R.; Garfí, M. Carbon footprint of constructed wetlands for winery wastewater treatment. Ecol. Eng. 2020, 156, 105959. [Google Scholar] [CrossRef]
  21. Corbella, C.; Puigagut, J.; Garfí, M. Life cycle assessment of constructed wetland systems for wastewater treatment coupled with microbial fuel cells. Sci. Total Environ. 2017, 584–585, 355–362. [Google Scholar] [CrossRef]
  22. Fang, Y.K.; Wang, H.C.; Fang, P.H.; Liang, B.; Zheng, K.; Sun, Q.; Li, X.Q.; Zeng, R.; Wang, A.J. Life cycle assessment of integrated bioelectrochemical-constructed wetland system: Environmental sustainability and economic feasibility evaluation. Resour. Conserv. Recycl. 2023, 189, 106740. [Google Scholar] [CrossRef]
  23. Jacobs, D.G.; Kachienga, L.O.; Rikhotso, M.C.; Abia, A.L.K.; Traoré, A.N.; Potgieter, N. Assessing the current situation of constructed wetland-microbial fuel cells as an alternative power generation and wastewater treatment in developing countries. Front. Energy Res. 2024, 12, 1448730. [Google Scholar] [CrossRef]
  24. Arliyani, I.; Noori, M.T.; Ammarullah, M.I.; Tangahu, B.V.; Mangkoedihardjo, S.; Min, B. Constructed wetlands combined with microbial fuel cells (CW-MFCs) as a sustainable technology for leachate treatment and power generation. RSC Adv. 2024, 14, 32073–32100. [Google Scholar] [CrossRef]
  25. Santoro, C.; Arbizzani, C.; Erable, B.; Ieropoulos, I. Microbial fuel cells: From fundamentals to applications. A review. J. Power Sources 2017, 356, 225–244. [Google Scholar] [CrossRef]
  26. Logan, B.E.; Rabaey, K. Conversion of Wastes into Bioelectricity and Chemicals by Using Microbial Electrochemical Technologies. Science (80-) 2012, 337, 686–690. [Google Scholar] [CrossRef]
  27. Xu, C.; Gong, B.; Zhao, S.; Sun, X.M.; Wang, S.G.; Song, C. Cu(ii) inhibited the transport of tetracycline in porous media: Role of complexation, Environ. Sci. Process. Impacts 2024, 26, 1417–1428. [Google Scholar] [CrossRef]
  28. Ge, X.; Cao, X.; Song, X.; Wang, Y.; Si, Z.; Zhao, Y.; Wang, W.; Tesfahunegn, A.A. Bioenergy generation and simultaneous nitrate and phosphorus removal in a pyrite-based constructed wetland-microbial fuel cell. Bioresour. Technol. 2020, 296, 122350. [Google Scholar] [CrossRef]
  29. Yang, H.; Chen, J.; Yu, L.; Li, W.; Huang, X.; Qin, Q.; Zhu, S. Performance optimization and microbial community evaluation for domestic wastewater treatment in a constructed wetland-microbial fuel cell. Environ. Res. 2022, 212, 113249. [Google Scholar] [CrossRef]
  30. Wu, Y.; Han, R.; Yang, X.; Zhang, Y.; Zhang, R. Long-term performance of an integrated constructed wetland for advanced treatment of mixed wastewater. Ecol. Eng. 2017, 99, 91–98. [Google Scholar] [CrossRef]
  31. Vymazal, J. Constructed Wetlands for Wastewater Treatment: Five Decades of Experience. Environ. Sci. Technol. 2011, 1, 61–69. [Google Scholar] [CrossRef]
  32. Vassalle, L.; Ferrer, I.; Passos, F.; Filho, C.R.M.; Garfí, M. Nature-based solutions for wastewater treatment and bioenergy recovery: A comparative Life Cycle Assessment. Sci. Total Environ. 2023, 880, 163291. [Google Scholar] [CrossRef]
  33. Tamta, P.; Rani, N.; Mittal, Y.; Yadav, A.K. Evaluating the Potential of Multi-Anodes in Constructed Wetlands Coupled with Microbial Fuel Cells for Treating Organic Loads. Energies 2023, 16, 784. [Google Scholar] [CrossRef]
  34. Colares, G.S.; Dell’Osbel, N.; Paranhos, G.; Cerentini, P.; Oliveira, G.A.; Silveira, E.; Rodrigues, L.R.; Soares, J.; Lutterbeck, C.A.; Rodriguez, A.L.; et al. Hybrid constructed wetlands integrated with microbial fuel cells and reactive bed filter for wastewater treatment and bioelectricity generation. Environ. Sci. Pollut. Res. 2022, 29, 22223–22236. [Google Scholar] [CrossRef]
  35. Wang, X.; Tian, Y.; Liu, H.; Zhao, X.; Peng, S. Optimizing the performance of organics and nutrient removal in constructed wetland–microbial fuel cell systems. Sci. Total Environ. 2019, 653, 860–871. [Google Scholar] [CrossRef]
  36. Zhang, Y.; Liu, F.; Lin, Y.; Sun, L.; Guo, X.; Yang, S.; He, J. Enhanced Swine Wastewater Treatment by Constructed Wetland—Microbial Fuel Cell Systems. Water 2022, 14, 3930. [Google Scholar] [CrossRef]
  37. Miwornunyuie, N.; Ugochukwu, G.; Hunter, J. Evolutionary trends and development of constructed wetland coupled microbial fuel cell: A decade of development. J. Environ. Manag. 2025, 373, 123574. [Google Scholar] [CrossRef]
  38. Wang, J.; Ren, K.; Zhu, Y.; Huang, J.; Liu, S. A Review of Recent Advances in Microbial Fuel Cells: Preparation, Operation, and Application. BioTech 2022, 11, 44. [Google Scholar] [CrossRef]
  39. Yu, X.; Sekhari, A.; Nongaillard, A.; Bouras, A.; Yu, S.; Yang, Q. A LCIA Model Considering Pollution Transfer Phenomena. In Proceedings of the Product Lifecycle Management for Society (PLM 2013), Berlin, Heidelberg, 8–10 July 2013; pp. 365–374. [Google Scholar] [CrossRef]
Figure 1. Stages of life cycle analysis according to ISO14040:2006.
Cleantechnol 07 00057 g001
Figure 2. Shows system description of CW, MFC, and CW–MFC.
Cleantechnol 07 00057 g002
Figure 3. System boundary (a) and process flow for LCA models in GaBi (b) for all three systems.
Cleantechnol 07 00057 g003
Figure 4. Impact category for both the construction and operation phases for CW, MFC, and CW–MFC systems.
Cleantechnol 07 00057 g004
Figure 5. This figure shows the impact category for the construction and operation phases of systems.
Cleantechnol 07 00057 g005
Figure 6. Damage assessment for CW, MFC, and CW–MFC.
Cleantechnol 07 00057 g006
Table 1. Presents a summary of existing studies evaluating the sustainability of constructed wetlands (CW), MFC, and CW–MFC relative to other technologies, based on LCA analysis.
ReferenceTechnologiesFunctional UnitLCA ToolSystem Boundary
Dixon et al. [9]Reedbed (CW) and aerated biological filter system(p.e)SimaPro softwareConstruction and operation of the systems but not end-of-life
Machado et al. [3]CW,
slow rate infiltration (SRI), and CAS
120 p.e
120 p.e
500 p.e
CML 2 Baseline 2000Construction, operation and maintenance, dismantling, and final disposal
Lopsik [8]CW and
extended aeration-activated sludge system (CAS)
64 p.e
1020 p.e
SimaPro software Impact 2002+ and ReCiPe assessment methodsConstruction and operation phases
De Feo and Ferrar [16]CW and
CAS
15 p.eIPCC 2007, Ecological Footprints, and ReCiPe 2008Construction, operation and maintenance, dismantling, and final disposal
Yildirim and Topkaya [17]CW,
CAS, and
vegetated land treatment
100 p.e
806 p.e
100 p.e
SimaPro 7.1 softwareConstruction and operation phases
Nogueira et al. [18] CW,
SRI, and
CAS
120 p.e
120 p.e
500 p.e
SimaPro7 softwareConstruction, operation and maintenance, dismantling, and final disposal
Garfi et al. [19]CW,
CAS, and
high-rate algal ponds
1500 p.e
1500 p.e
1500 p.e
SimaPro8 employing the ReCiPe midpoint methodConstruction and operation
Corbella et al. [21]CW,
CW–MFC with gravel-based anode, and
CW–MFC with graphite anode
1500 p.e
1500 p.e
1500 p.e
1 m3
Software SimaPro® 8, using the CML-IA baseline method Construction and operation
Flores et al. [20]CW
third-party management and CAS system
1 m3SimaPro® 8 software and IPCC Global Warming Potential method (IPCC GWP 100 years)Construction and operation
Present studyCW,
MFC,
and CW–MFC
1 m3GaBi + TRACI 2.1
ReCiPe 2016 Endpoint
Construction and operation
Note: The functional unit is defined as the number of ‘population equivalents’ (p.e.), representing daily wastewater production. One population equivalent corresponds to a dry weather flow (DWF) of 0.2 m3/day [9].
Table 2. Inventory sheet for life cycle assessment (LCA).
Treatment TechnologyPhaseMaterialQuantity
Constructed Wetland
(CW)
ConstructionPolypropylene container1.77 kg
Gravel4.54 kg
Activated carbon4.54 kg
Zeolite4.54 kg
Silicon tubes(192 × 0.18 × 0.04) in; 0.132 kg
Drilling appliance0.018 kWh
Transportation5.7 miles
OperationCOD268 mg/L
TN13.79 mg/L
NO314.65 mg/L
TP9.2 mg/L
CH465 kg/yr
CO255 kg/yr
Microbial Fuel Cell
(MFC)
ConstructionAcrylic reactor2.7 kg
Graphite plate electrodes0.0737 kg
Resistance box1
Titanium wire0.0277 kg
Membrane2.01 kg
Silicon tubes(192 × 0.18 × 0.04) in; 0.132 kg
Graphite felt0.027 kg/(3 × 200 × 300) mm
Graphite plate electrodes0.0737 kg
Drilling appliance0.018 kWh
Transportation5.7 miles
OperationPumps36 kWh
Energy-produced72.2 mW/m2
COD417 mg/L
TN317 mg/L
NO313.37 mg/L
TP19.67 mg/L
CH495 kg/yr
CO255 kg/yr
Polypropylene container1.77 kg (2 gallons)
Constructed Wetland–Microbial Fuel Cell
(CW–MFC)
ConstructionGraphite plate electrodes1.8 kg
Resistance box1
Titanium wire0.0277 kg
Silicon tubes(192 × 0.18 × 0.04) in; 0.132 kg
Gravel4.54 kg
Activated carbon4.54 kg
Zeolite4.54 kg
Drilling appliance0.018 kWh
Transportation5.7 miles
OperationPumps36 kWh
Energy-produced22.24 mW/m2
COD259 mg/L
TN7 mg/L
NO310.6 mg/L
TP7.9 mg/L
CH472 kg/yr
CO224 kg/yr
Table 3. Construction, operation, and maintenance costs of the systems in dollars per cubic meter of treated wastewater.
TechnologyConstruction Cost (USD/m3)Operation and Maintenance Cost (USD/m3)Total Cost (USD/m3)
CWUSD 328.33 USD 299.00 USD 627.33
MFCUSD 614.90 USD 274.00 USD 888.90
CW–MFCUSD 439.33 USD 279.00 USD 718.33
Disclaimer/Publisher’s Note: The statements, opinions and data contained in all publications are solely those of the individual author(s) and contributor(s) and not of MDPI and/or the editor(s). MDPI and/or the editor(s) disclaim responsibility for any injury to people or property resulting from any ideas, methods, instructions or products referred to in the content.

