Article

Nitrogen-Doped Porous Waste Biomass as a Sustainable Adsorbent for CO2 Capture: The Influence of Preparation Conditions

by
Christiano B. Peres
1,
Leandro C. Morais
1 and
Pedro R. Resende
2,3,*
1
Institute of Science and Technology, São Paulo State University (UNESP) “Júlio de Mesquita Filho”, Sorocaba Campus, São Paulo 18087-180, Brazil
2
proMetheus, Polytechnic Institute of Viana do Castelo, 4900-347 Viana do Castelo, Portugal
3
CEFT, Faculty of Engineering, University of Porto, 4200-465 Porto, Portugal
*
Author to whom correspondence should be addressed.
Clean Technol. 2025, 7(1), 25; https://doi.org/10.3390/cleantechnol7010025
Submission received: 27 December 2024 / Revised: 25 February 2025 / Accepted: 5 March 2025 / Published: 12 March 2025
(This article belongs to the Special Issue Green Solvents and Materials for CO2 Capture)

Abstract

:
In the context of global warming, technologies and studies aimed at mitigating carbon dioxide (CO2) have become increasingly relevant. One such technology is CO2 capture by activated and functionalized N-doped carbon from biomasses. This paper explores the ways to find the optimal CO2 adsorption conditions, based on the carbonization temperature, impregnation rate, and preparation method, considering four different preparation routes in activated and functionalized carbon-N (PCs) of banana peel biomass residues. PCs were produced and chemically activated by K2C2O4 and H2O and functionalized by ethylenediamine (EDA). Carbon dioxide capture was investigated using functional density theory (DFT). Nitrogen (N) doping was confirmed by X-ray photoelectron spectroscopy (XPS), while the thermal characteristics were examined by thermogravimetric analysis (TGA). Surface morphology was examined by scanning electron microscopy (SEM) with energy dispersive X-ray (EDX) detection, and surface functional groups were characterized using Fourier-transform infrared (FTIR) spectroscopy. In addition, the inorganic components were characterized by X-ray diffraction (XRD). The best performance of CO2 adsorption of 1.69 mmol/g was achieved at 0 °C and 1 bar over the adsorbent synthesized at 600 °C with 60 min residence time, a 1:1 degree of impregnation, and a dry preparation method (single-stage preparation). This work presents as a great innovation the use of biomass as a raw material in the adsorption of the main greenhouse gases, using easy and accessible products.

1. Introduction

It can be noted that atmospheric carbon dioxide (CO2) levels have risen considerably in recent years. Presently, CO2 concentrations surpass 420 ppm, marking a 46.4% rise compared to the pre-Industrial level [1,2]. A significant portion of human-induced CO2 emissions is linked to fossil fuel combustion, land use changes, and deforestation [1,3]. It is essential to emphasize that the concentration of CO2 not only affects the external environment but can also be harmful in indoor environments, where the safe concentration of greenhouse gas is established at 1000 ppm, depending on factors like ventilation, occupancy, and activity levels. Above this level, deleterious health effects such as fatigue, inattention, headaches, and drowsiness may occur. Concentrations exceeding 5000 ppm can lead to more serious health effects, such as inflammation, cognitive decline, kidney calcification, bone demineralization, and endothelial dysfunction [2]. In light of this, efforts are underway to mitigate the release of greenhouse gas emissions and to restrict global temperature increases to 1.5 °C, as outlined in international climate agreements. Data from the Intergovernmental Panel on Climate Change (IPCC) indicate that, to keep global warming around 1.5 °C, as per the Paris Agreement, a 43% reduction in global greenhouse gas emissions by 2030 is necessary [1,4,5]. Thus, several possibilities for reducing CO2 emissions have been discussed, and one of the most promising is carbon capture and sequestration (CCS) [6,7].
Carbon capture and sequestration (CCS) has been identified as one of the most promising approaches to capture CO2 emissions from major polluting sources, with the ability to retain approximately 85–95% of these emissions. However, the global capacity of current CCS facilities remains relatively limited, with around 41 Mt CO2 captured annually, representing just 0.1% of the total fossil fuel emissions each year [5]. Several pilot CCS projects have been initiated worldwide, including the Val Verde natural gas plant in the U.S., the Sleipner Project in Norway, and the Weyburn-Midale Project in Canada [8]. Additionally, Norway’s Northern Lights Project aims to capture 0.8 Mtpa of CO2 from two industrial sources located along the country’s southern coast—a cement plant and a waste recycling facility. CO2 will be conveyed in a liquid state via tankers across an approximate distance of 1000 km to the western coast of Norway, where it will undergo permanent storage within a saline aquifer located at a depth of 2600 m beneath the seabed, existing in a supercritical condition.
According to data from the Global CCS Institute, in South America, there are three CCS projects, all located in Brazil. One of them is under evaluation, which is the FS Lucas do Rio Verde BECCS Project, located in the central region of the country. The project is an ethanol biorefinery complex, and the sequestered CO2 will be stored within a radius of 5 km from the biorefinery. Another Brazilian CCS project is the Miranga CO2 Injection Project, linked to Petrobras, located in Salvador (northeast region). The project started operating in 2009 and is linked to the fertilizer industry. At its inception, Petrobras even injected about 370 tons of CO2 per day into the oil and gas field in Bahia. Finally, Petrobras Santos Basin-Pre Salt Oil Field, located in the Bay of Santos-RJ, is a Petrobras project that started operating in 2008 and is linked to the processing of natural gas. In 2021, about 8.7 million tons of CO2 were injected, reaching a cumulative 30.1 million tons of CO2 since 2008.
A CCS system consists of three primary components: (i) the capture of CO2 from various stationary emission sources, including power plants, cement factories, iron and steel production facilities, and chemical industries; (ii) the transportation of captured CO2 via pipelines, ships, or tanker trucks/trains in its dense phase; and (iii) the injection of CO2 into geological formations, such as saline aquifers, depleted oil or gas fields, or non-mineable coal seams, for long-term storage or its use in industrial processes, such as methanol production and enhanced oil recovery [8,9]. In a typical CCS facility, separation and purification technologies are employed to extract CO2 from exhaust gases and transport it to a designated storage site [5,10].
To date, several CO2 capture technologies have been extensively investigated and implemented, including absorption processes, membrane separation, adsorption, and other similar techniques [5,11,12]. Among CO2 capture technologies, absorption techniques are gradually being discontinued due to the disadvantages of high operating cost and equipment corrosion. Membrane separation is also impractical for large-scale capture because of the substantial investment required for membrane materials and the frequent occurrence of damage.
Adsorption is increasingly acknowledged as a highly effective method for mitigating CO2 emissions, attributed to its operational simplicity, low initial investment, high efficiency in capture, and environmentally sustainable characteristics. Consequently, this technique is widely utilized by various companies engaged in carbon capture and storage (CCS) initiatives, such as Svante, ExxonMobil, Kawasaki Heavy Industries, TDA Research, and Shell [5,12]. A range of porous solid adsorbent materials, including polymers, zeolites, covalent organic frameworks (COFs), metal-organic frameworks (MOFs), mesoporous silicas, and porous carbons (PCs), has attracted considerable attention in the domain of CO2 capture. Notably, carbon-based adsorbents are viewed as the most viable option for CO2 capture, owing to their economical production, elevated surface area, significant porosity, robust chemical and physical stability, minimal energy demands for regeneration, and the potential for tailored porous architectures [12,13,14].
The calculation method based on quantum mechanical simulations known as DFT provides precise quantitative insights into molecular structures and energetic and electronic properties. It has been widely applied in the study of the adsorption of single molecules and organic compounds on heavy metals. Furthermore, DFT is a well-established tool for predicting new hypothetical structures and their properties. This methodology has shown success in structural simulations and analyses of various materials and is also used in the computational characterization and prediction of complex structures, both in adsorption and diffusion studies and in reaction processes [15].
Activated carbon (AC) produced from biomass (like banana peels) stands out as a particularly advantageous choice among porous carbon-based adsorbents. This material presents numerous benefits, such as affordability, widespread availability, and a low environmental impact. The surface of activated carbon has the capacity to adsorb CO2 molecules through Van der Waals forces, a process known as physical adsorption. However, its adsorption capacity remains inadequate when compared to amine-based reference technologies (absorption). To address this limitation, the properties of the adsorbents can be enhanced through various methods of physical, chemical, or physicochemical activation [5,15,16].
Chemical activation is generally the preferred method for AC production due to its lower activation temperature compared to physical activation. The chemical activation process occurs in a single process, called carbonization or pyrolysis, which can occur in a temperature range of 400 °C to 900 °C, in which cellulose is degraded, and usually involves the use of liquid solvents or activating agents, which can modify the surface properties of materials [17,18].
Solvents containing nitrogen (N) and/or oxygen (O) functional groups are recognized for their ability to improve the surface characteristics of materials. This enhancement occurs through the facilitation of interactions between acidic carbon surfaces and CO2 molecules, which subsequently leads to an increase in adsorption capacity due to basic nitrogen functional groups on the surface. However, it is crucial to select the solvent carefully, as the process may require substantial quantities of chemicals. This could lead to higher costs and potential environmental issues, especially if some of these chemicals are highly toxic [5,19].
Several compounds are used in chemical activation, such as potassium hydroxide (KOH) and sodium hydroxide (NaOH), and currently, potassium oxalate hydrate (K2C2O4.H2O) has been shown to be more advantageous and eco-friendlier, with lower toxicity and corrosivity than the other two compounds [17,18,20]. On the other hand, physical activation is normally adopted in two stages: pyrolysis (carbonization) and activation in an oxidizing atmosphere by means of gases. In comparison, chemical activation produces AC with a better porous structure and high CO2 adsorption, in addition to being more economical, as it requires lower activation temperatures [18].
There are parameters that can enhance CO2 capture in the adsorption process. One such parameter is the carbonization temperature. According to a study by Heidarinejad et al. [18], the temperature ranges commonly used in the activation process of activated carbon in the adsorption process with phosphoric acid, zinc chloride, potassium carbonate, sodium hydroxide, and potassium hydroxide are, respectively, 450–600 °C, 400–900 °C, 700–1000 °C, 550–850 °C, and 450–850 °C. The same authors pointed out that the activation process can occur at temperatures in the range of 400–900 °C. Abuelnoor et al. [17], on the other hand, concluded that temperature ranges between 700 and 900 °C favor a greater release of volatile compounds during lignin decomposition. This process contributes to an additional increase in the surface area of the material and favors the formation of micropores, which enhance the capture of CO2. In turn, Quan et al. [21] investigated the effect of the carbonization temperature on the removal of CO2 from the atmosphere using activated carbon and concluded that, with the increase in the carbonization temperature, at first glance, the micropore volume increases to a limit, so that a drop occurs in the sequence, and the same behavior was identified for the capture of CO2.
Another important parameter to be considered in CO2 adsorption is the impregnation rate between the activating agent and the study material. For example, Mohamed Hatta and others [5] studied the effect of various parameters on CO2 adsorption on activated carbon, including the activating agent/activated carbon impregnation ratio (1:1, 2:1, 3:1, 4:1, and 5:1), and Serafin et al. [22] investigated the impregnation rate (activating agent/activated carbon—1:1, 5:1, 2:1, and 3:1) in different activated carbons.
The method of preparation is essential in the process of CO2 capture. Typically, there are two primary techniques for preparing activated carbon through chemical activation: a single-step process known as dry mixing and a two-step process referred to as wet impregnation. In the wet impregnation technique, the initial phase consists of dissolving the biomass in a saturated solution of the chemical activator, ensuring that the chemical agent is fully dissolved. This solution is subsequently dried to create a cake-like substance, which is then subjected to conventional heat treatment via pyrolysis at relatively lower temperatures. Conversely, the single-step dry mixing technique entails the direct application of solid pellets of the chemical activator onto the biomass, followed by pyrolysis. This approach is characterized by its simplicity, energy efficiency, and speed. Furthermore, studies suggest that the dry mixing method typically yields porous materials with greater surface areas when compared to other chemical impregnation methods [17]. For example, a study by Pietrzak et al. [23] revealed an increase in surface area from 796 m2/g to 932 m2/g with the use of the dry mixture.
There are several studies in the literature of CO2 capture in AC. Ahmed et al. [24] studied the adsorption of CO2 in biomasses through chemical activation, producing AC and adopting a pre-pyrolysis method to reduce the amount of chemical reagents and promote cleaner production and reached a reduction value of 70% of chemicals, performing an excellent CO2 capture result (4.22 mmol/g). In turn, Pramanik et al. [25] investigated CO2 sequestration in cotton stems and found adsorption quantities of 6.69 mmol/g at 0 °C and 1 bar and 4.24 mmol/g at 25 °C and 1 bar. Kaya and Uzun [26] investigated the CO2 adsorption capacity in lignocellulosic biomass biochar and obtained a concentration of 3.64 mmol/g at 25 °C. Additionally, Quan et al. [21] analyzed CO2 trapping on activated carbon, reaching a capture capacity of 4.8 mmol/g at 0 °C and 1 bar. Regarding the economic part and feasibility of production on an industrial scale, Pramanik et al. [25] carried out a study of PCs of agro-industrial waste to capture CO2 and made a cost simulation for implementation on an industrial scale, reaching a value of USD 3.78/kg of carbonaceous material produced. In the same study, Pramanik et al. [25] created a comparative table of the cost of producing activated carbon in the literature and found a lower cost of USD 2.33/kg per material produced for almond shell biomass.
To enhance the efficacy of CO2 adsorption, surface modifications of porous carbons (PCs) are undertaken, a process known as carbon functionalization. A significant factor affecting the adsorption capacity of activated carbon (AC) is the presence of heteroatoms, particularly nitrogen. The incorporation of nitrogen into the surfaces of AC leads to an increase in the number of basic functional groups, thereby enhancing the selectivity for acidic species such as CO2 [19]. In this regard, functionalization involves the introduction of diverse functional groups into the activated carbon structure to augment its capacity for CO2 adsorption. For example, nitrogen-rich compounds like ethylenediamine (EDA) are utilized during the functionalization process to optimize performance [17].
Peres et al. [27] studied the adsorption of CO2 in activated carbon from passion fruit peel and reached values of 2.2 mmol/g of gas capture at 0 °C and 1 bar. Additionally, Faisal et al. [28] studied CO2 adsorption on EDA and triethylenetetramine (THETA) functionalized PCs and found the following greenhouse gas capture values: 19.68 mmol/g and 11.24 mmol/g, respectively.
These carbon materials are potentially obtained from renewable organic resource sources, for example, banana peel biomass (BP). Banana is a natural biomass originating in Asia, which has a large production in Brazil (fourth-largest global producer of the fruit, with approximately 7.2 million tons/year). The edible part of the fruit is the pulp, while the peel can be used as organic fertilizer or in animal feed [29]. Several studies have been carried out on the use of BP in various areas, such as medicine, bioethanol fermentation, the manufacture of microbiological media, lactase production, and the synthesis of nanomaterials and PCs [30].
Thus, the objective of this paper is to determine the optimal CO2 adsorption conditions in relation to the carbonization temperature parameters (450 °C/30 min, 600 °C/1 h, and 700 °C/1 h); impregnation rate (1:1, 3:1, and 5:1 reagents/PCs, respectively (mass/mass)); and preparation method (dry and wet), synthesizing PCs through BP residues for the production of functionalized AC. The incorporation of amine functionalization in PCs will be done in order to enhance CO2 capture.

2. Materials and Methods

2.1. Synthesis of Activated Carbon Enhanced with Functional Groups

2.1.1. Carbonization Process for Activated Carbon Synthesis

Porous carbon materials used chemical activation with K2C2O4.H2O (sourced from Neon Comercial Reagentes Analíticos LTDA, São Paulo, Brazil) on biomass derived from banana peels (BPs), which were purchased locally. The banana peels were rinsed with water and dried in an oven at 105 °C for 24 h to eliminate the water content. Subsequently, the dried substances were crushed to decrease the granularity of a material between 0.1 and 0.3 mm. The granular samples were subsequently converted into carbon-rich material through thermal degradation at 450 °C for 30 min in an atmosphere with limited oxygen availability. The result product was designated as BBP (BP biochar).

2.1.2. Treatment of Activated Carbon

A combined process of introducing functional groups onto activated carbon was used by four different routes.
Route 1: Route 1 is the base route, so BBP were combined physically with K2C2O4.H2O and EDA (acquired through Neon Comercial Reagentes Analíticos LTDA, with rate K2C2O4.H2O/BBP and mass EDA/BBP = 1) in a ceramic pen with pistil for 30 min. Next, the solution was heated in a high-temperature furnace at 450 °C for 30 min (heating rate = 20 °C/min). Following thermal decomposition, the mixture was rinsed using highly purified water and 1M HCl to adjust the pH. It was subsequently subjected to a filtration process followed by drying at 105 °C for 24 h. The final product was designated as FACBP-1, where F stands for functionalized, AC represents activated carbon, BP denotes banana peel, and 1 indicates the preparation route number.

2.1.3. Method Preparation

Route 2: Route 2 is the route to evaluate the wet preparation mode, so BBP were mixed with 10 mL of water, K2C2O4.H2O, and EDA (rate K2C2O4.H2O/BBP and bulk EDA/BBP = 1) and stirred for 30 min. Subsequently, the mixture was then filtered to remove impurities and then dried at 105 °C for 24 h, then pyrolyzed in a high-temperature furnace at 450 °C for 30 min (heating rate = 20 °C/min). Following thermal decomposition, the result was rinsed using highly purified water and 1M HCl to adjust the pH, followed by filtration and drying at 105 °C for 24 h. The final product was named FACBP-2W, where 2 indicates the preparation route number, and “W” signifies the “wet” preparation method.

2.1.4. Impregnation Ratio Preparation

Route 3: Route 3 is to evaluate the effect of the chemical activation impregnation rate; therefore, BBP were combined physically with K2C2O4.H2O and EDA at different impregnation rates (K2C2O4.H2O/BBP and mass EDA/BBP = 3 and K2C2O4.H2O/BBP and bulk EDA/BBP = 5) in a ceramic grinding vessel for crushing and grinding for 30 min. The compound was then pyrolyzed in a high-temperature heating device at 450 °C for 30 min (heating rate = 20 °C/min). Following pyrolysis, the mixture was rinsed with highly purified water and 1M HCl to adjust the pH and then dried at 105 °C for 24 h. The end products were named FACBP-33 and FACBP-35, where 3 is the number of the preparation route, and 3 and 5 are the respective impregnation rates.

2.1.5. Carbonization Temperature Preparation

Route 4: Route 4 is to evaluate the effect of the carbonization temperature; thus, BBP were blended with K2C2O4.H2O and EDA (rate K2C2O4.H2O/BBP and bulk EDA/BBP = 1) in a ceramic mortar for 30 min. After that, the results were pyrolyzed in a heating device at different temperatures (600 and 700 °C for 1 h) (heating rate = 5 °C/min). Following pyrolysis, the resulting compound was rinsed using highly purified water and 1M HCl to adjust the pH and then heated in an oven at 105 °C for 24 h. The resulting mixtures were named FACBP-4600 and FACBP-4700, where 4 is the number of the preparation route, and 600 and 700 are the respective carbonization temperatures.

2.2. CO2 Capture Capacity

For the experiments involving CO2 adsorption, the materials underwent an initial drying phase in an oven set at 100 °C for a duration of 24 h. Subsequently, they were pre-treated at 250 °C for 4 h to remove any residual moisture and surface-adsorbed materials. The presence of water vapor can significantly affect the adsorption of carbon dioxide. Water molecules generally compete with CO2 for adsorption sites, especially on hydrophilic surfaces, and consequently, this competition can reduce the capacity and efficiency of CO2 adsorption. After this preparation, the samples were subjected to analysis through CO2 isotherms utilizing density functional theory (DFT). The adsorption isotherms were recorded at a temperature of 0 °C using the Nova 2000 and Quantachrome, Boynton Beach, FL, USA, analyzers.

2.3. Material Analysis Procedures

Thermogravimetric analysis (TG) was performed, adopting a SDT Q600 instrument from TA Instruments, New Castle, DE, USA, (heating rate of 10 °C/min in a nitrogen gas stream and flow rate of 100 mL/min). The X-ray diffraction (XRD) patterns were operated on a diffractometer (Rigaku, Miniflex®, Tokyo, Japan) with a stationary copper tube as the X-ray source (Cu Kα) (λ = 1.5418 Å), operating at 30 kV and 15 mA, with a diffraction angle of 2θ = 90. X-ray photoelectron spectroscopy (XPS) was performed using an X-ray photoelectron spectrometer (Thermo Scientific, Brno, Czech Republic), equipped with an Al-Kα X-ray source (1486.6 eV) and an energy pass of 50 eV. The surface morphology of the materials was examined with a scanning electron microscope (SEM, Leo Electron Microscopy/Oxford, Leo 440i, Oberkochen, Germany) coupled with an energy-dispersive X-ray detector (EDX, 6070), operating at 10 kV with magnifications of ×2000 and ×10,000. The types of chemical groups and the way they are connected in the samples were analyzed using Fourier-transform infrared spectroscopy (FTIR) on a Perkin Elmer Frontier FT-IR spectrometer, Waltham, MA, USA, covering wavelengths from 4000 to 400 cm−1. Elemental analysis (CHN) was conducted in duplicate using Perkin Elmer CHN 2400, Waltham, MA, USA, equipment.
To determine the structural properties, the materials were initially oven-dried at 100 °C for 24 h. They were then pre-treated at 120 °C for 4 h under reduced pressure to eliminate all the liquid content and surface-adsorbed species. Following this, the samples were analyzed using nitrogen and carbon dioxide adsorption isotherms measured at −196 °C and 0 °C in the same order with the Nova 2000e analyzer by Quantachrome, Boynton Beach, FL, USA.

3. Results and Discussion

The results pertinent to the textural parameters, physisorption in CO2/N2, and results of the elementary analyses are shown in Table 1 and Table 2, respectively.
According to Table 1, the textural parameters in N2 sorption were practically null in all the samples studied, most likely due to the interaction of surface nitrogen functional groups (N2) from the EDA with the N2 of the sorption, causing a repulsion of the gas and culminating in almost null values.
In turn, the dry sample (BP), as it is not impregnated with EDA, presented a specific surface area of 1.68 m2/g, a reduced and expected value, since it is a sample without any chemical/thermal treatment.
On the other hand, the textural parameters in CO2 sorption presented interesting results, which will be discussed in the next section of this work.

3.1. CO2 Adsorption Performance of Banana Peel-Impregnated Activated Carbon

3.1.1. Effect of the Method Preparation

The CO2 capture data of the studied samples, considering the preparation effect, are shown in Figure 1.
According to Figure 1, the highest CO2 capture values relative to the preparation model were from the dry method. For the banana samples, the wet preparation model (“wet”) showed a CO2 capture of 1.11 mmol/g, while, in the dry preparation mode, the value was 1.33 mmol/g. A possible explanation for the effect of the preparation mode is given by the textural parameters found (Table 1).
It is mainly related that the BET specific surface area values (Table 1—CO2 sorption) for the dry method are higher when compared to the wet method, and this indication may explain the increase in CO2 capture being greater in the dry preparation method, since there are more active sites available for the adsorption of molecules in the material, providing a greater adsorption efficiency [6,17,23].
The study by Pietrzak et al. [23] confirmed that the dry preparation mode is more effective for capturing CO2, and the authors compared two types of chemical impregnation modes and showed that, in dry mixing, the surface areas increased.
In the dry blend, spraying of the chemical activator solids and their direct mixing with the biomass can lead to a more even distribution of the active components in the blend. This facilitates the interaction between the materials and, consequently, can increase the efficiency of adsorption. Another likely explanation is due to the simplicity of the dry process, as the dry mixing method is simpler compared to wet impregnation, which can lead to fewer barriers to the interaction between the components.
The simplicity of the process may favor the formation of structures more conducive to effective adsorption. The least interaction with water should also be considered, since, in wet impregnation, the presence of water can influence the distribution of the active components and the formation of certain undesired structures. In the dry method, the lower interaction with water can result in solids with characteristics more conducive to adsorption.

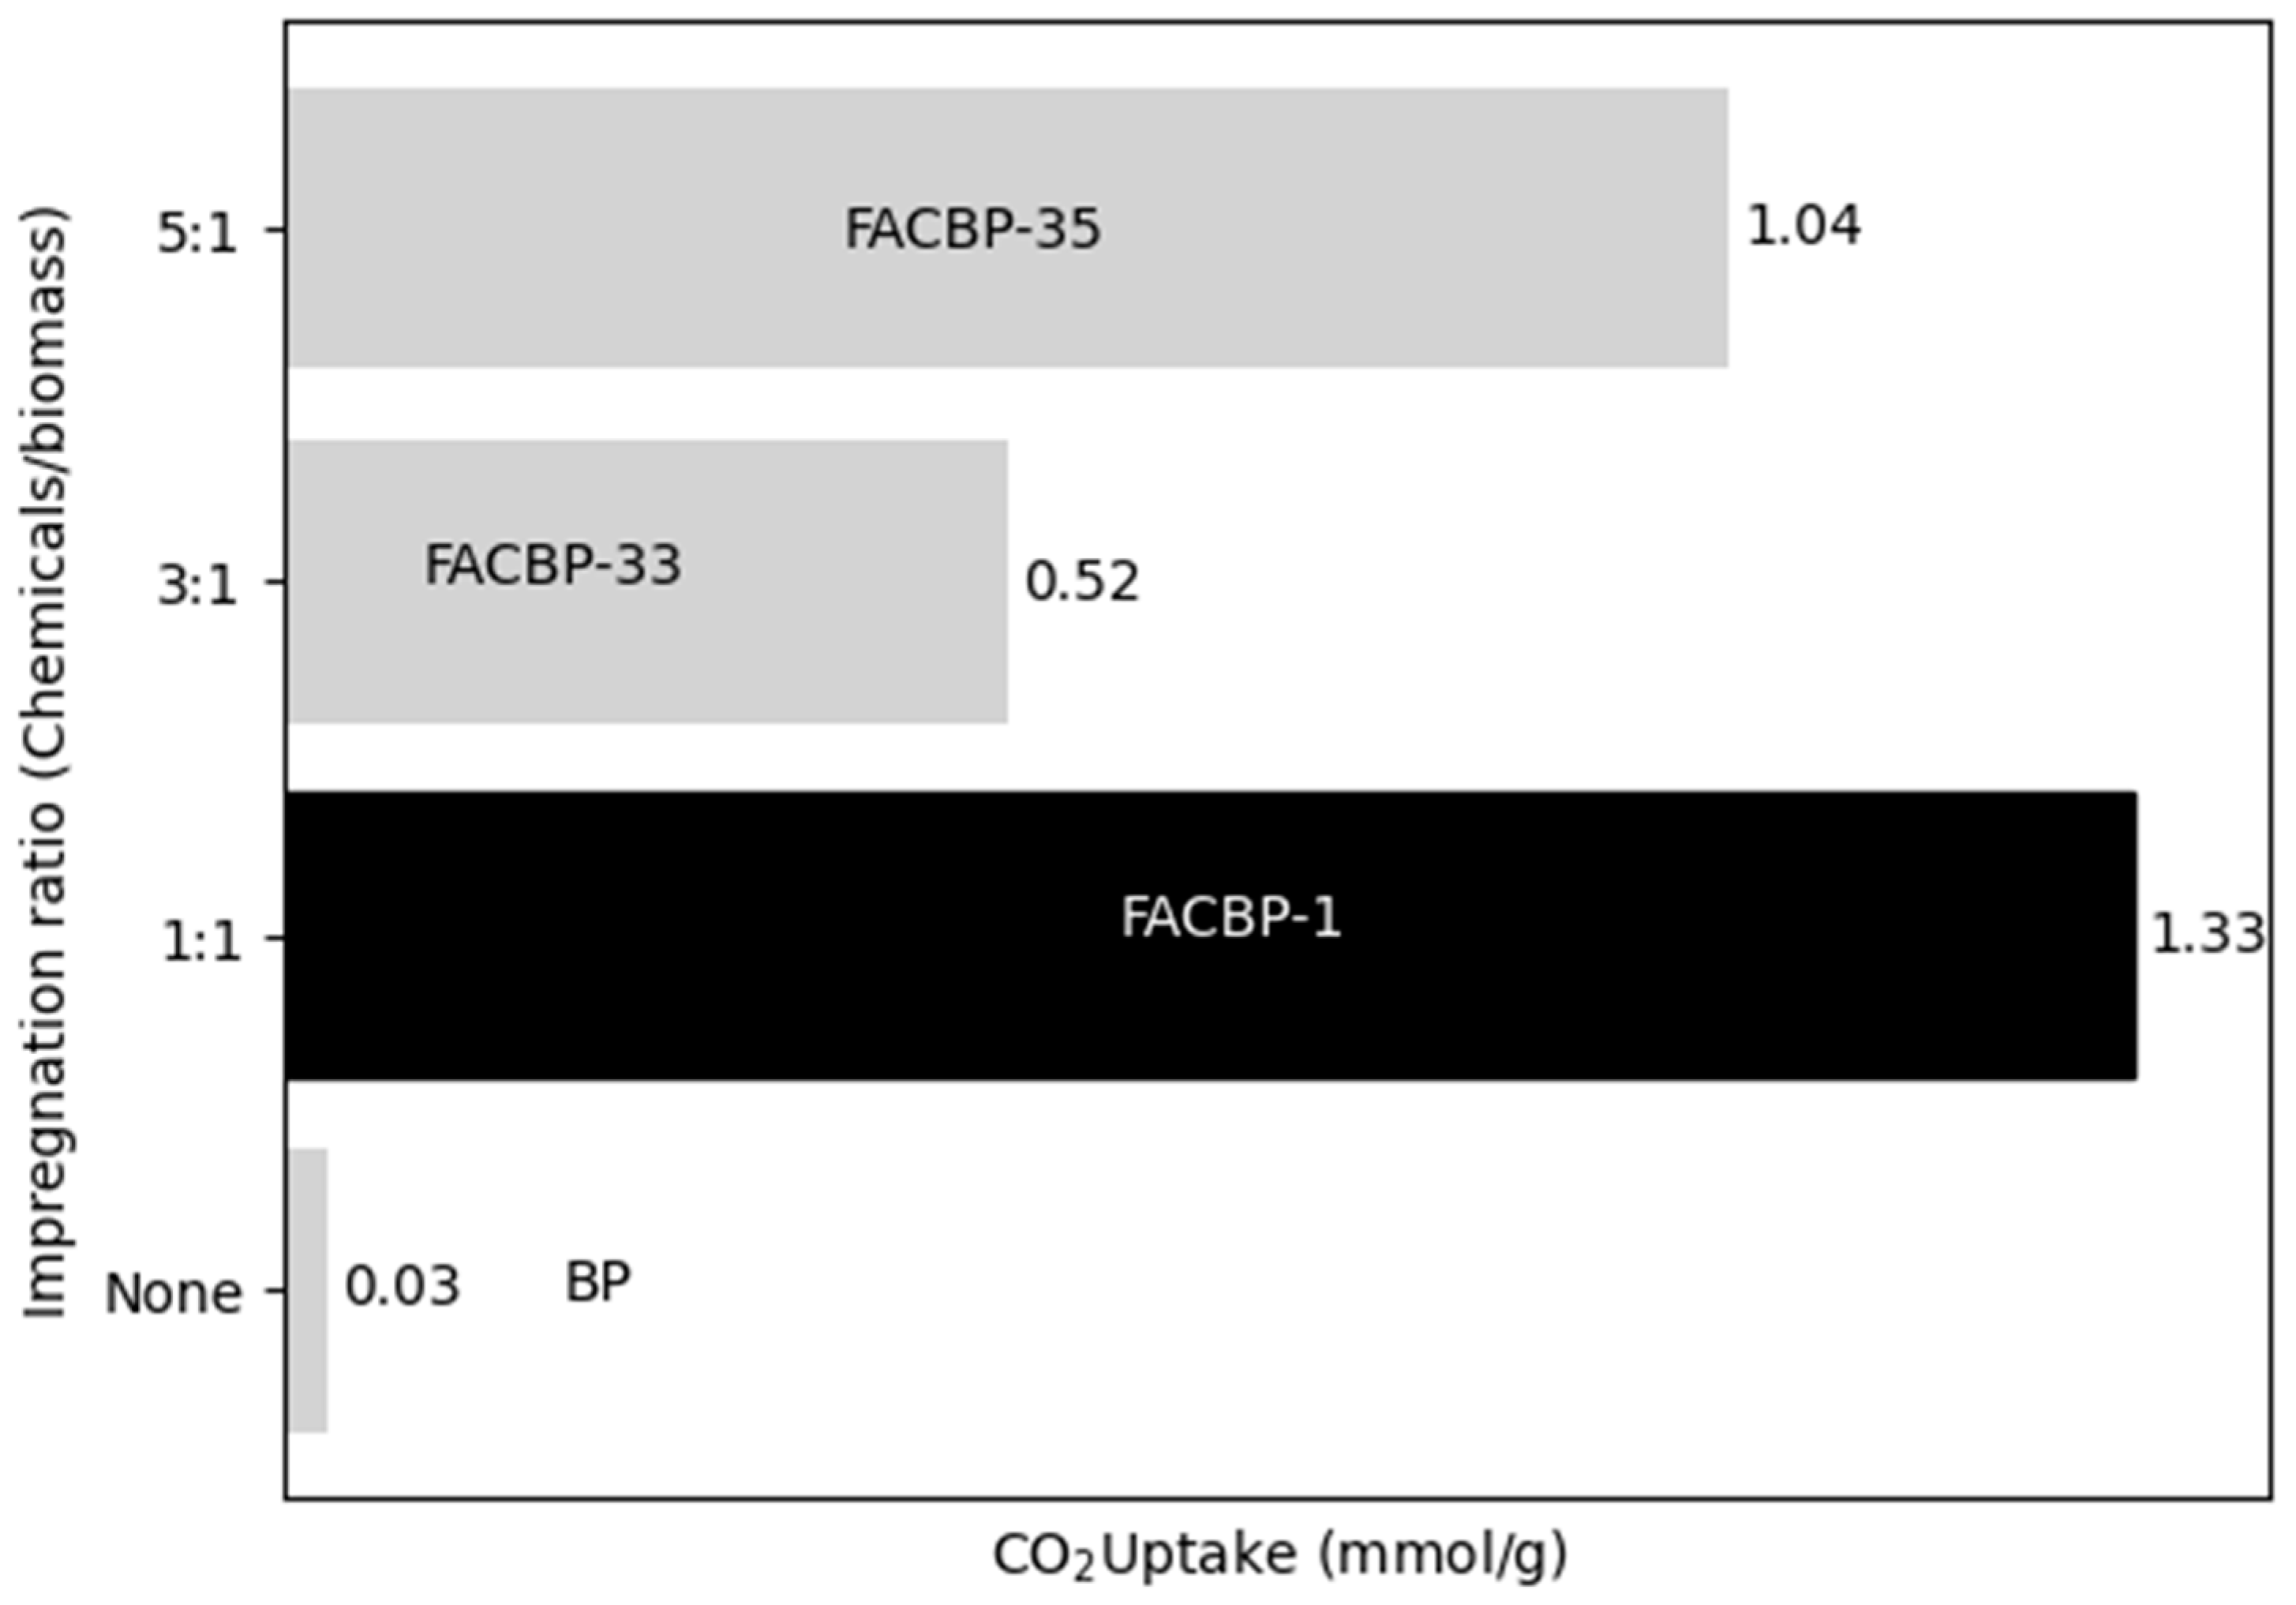
3.1.2. Effect of the Impregnation Ratio

The results regarding the CO2 capture data of the samples studied, considering the effect of the degree of impregnation, are shown in Figure 2.
The best degree of impregnation, considering the specific conditions for this work, was 1:1 (reagents/activated carbon).
For the banana sample, the CO2 capture values at the 1:1, 3:1, and 5:1 impregnation rates were 1.33, 0.52, and 1.04 mmol/g (Figure 2). It is possible that the samples reached a maximum CO2 adsorption at the degree of 1:1 impregnation. By increasing the impregnation rate, a drop in CO2 capture was observed, which was probably due to the blocking of the pores, because they were saturated with the activating agent. Consequently, when the pores were blocked, the adsorption capacity was reduced [5,31].
With pore blockage, the micropore volume tried to decrease, as seen in Table 1. It is also related that the highest BET area values were associated with a 1:1 impregnation rate, which obtained the highest CO2 capture, corroborating the hypothesis that textural parameters directly influence CO2 adsorption [32,33,34].

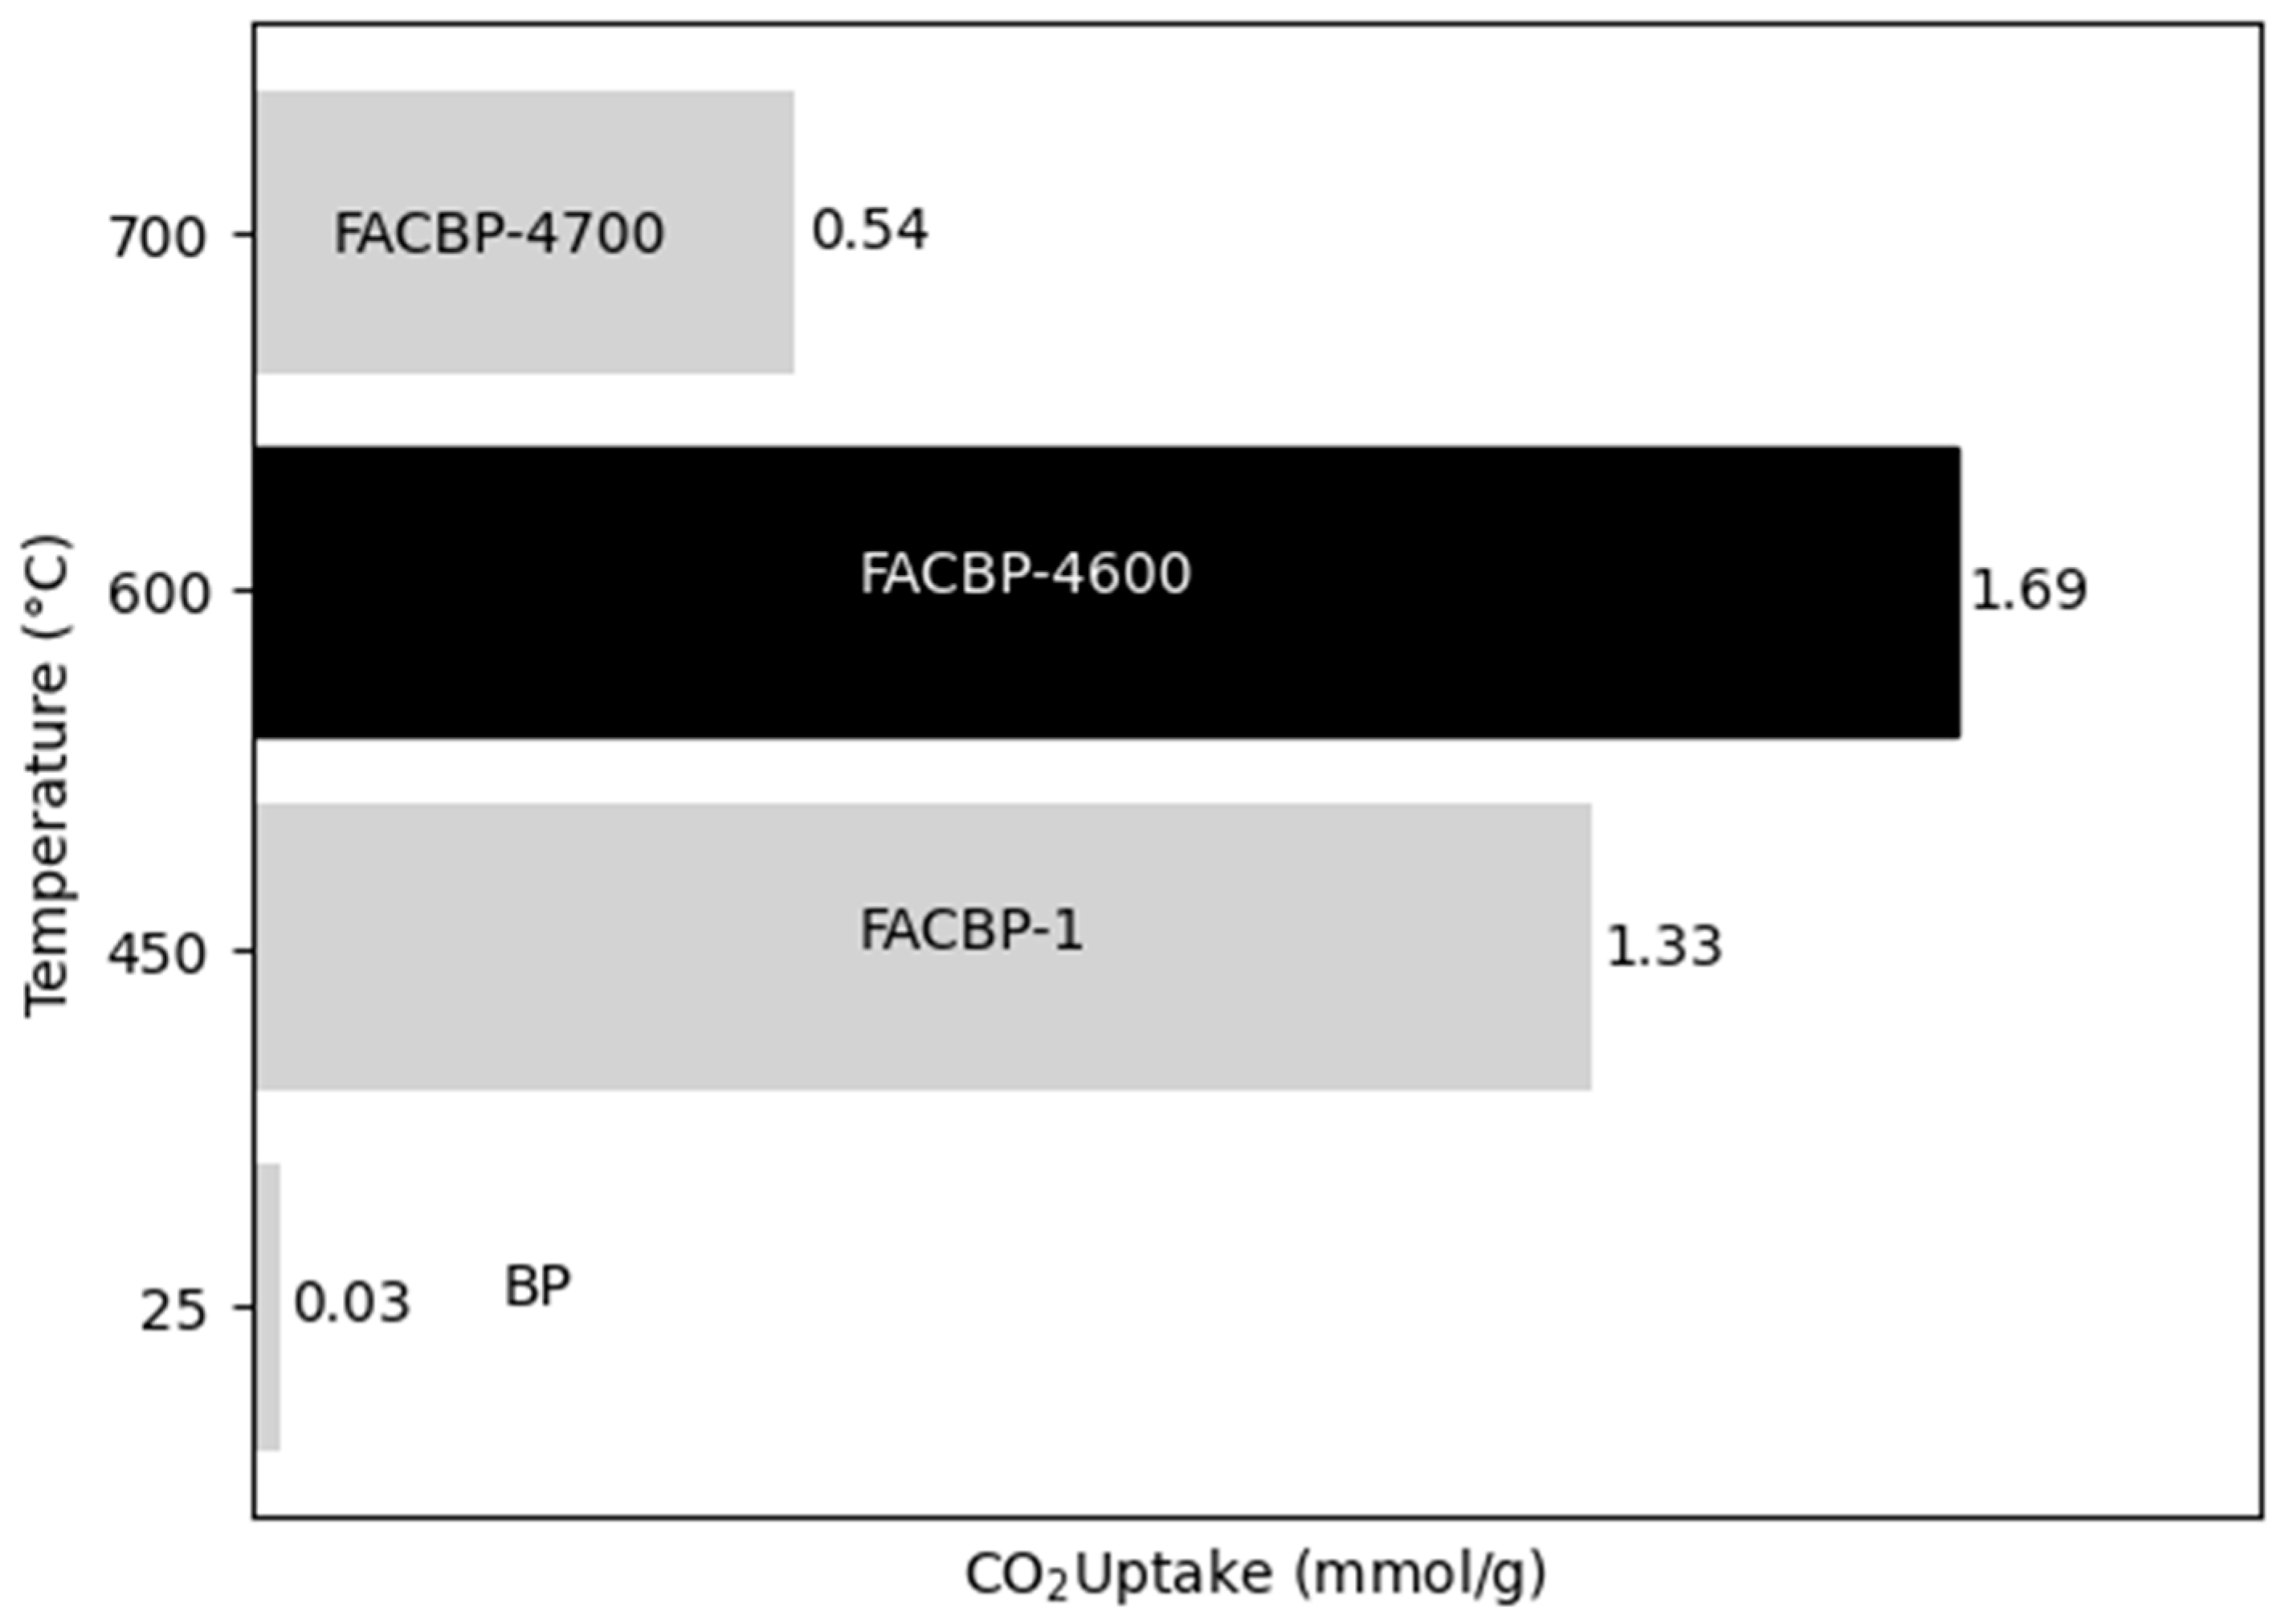
3.1.3. Effect of the Carbonization Temperature

The temperature of carbonization is crucial in influencing pore formation and the establishment of functional groups throughout the processes of activation and functionalization [34]. The results regarding the CO2 capture data of the samples studied, considering the effect of the carbonization temperature, are shown in Figure 3.
For the carbonization temperature, considering the specific conditions of this work, it was observed that the best optimization temperature for CO2 capture was 600 °C (1.69 mmol/g CO2). For the banana samples, the analysis revealed that the capacity for CO2 adsorption initially rose with an increase in temperature, followed by a subsequent decline. This pattern has been a recurring fact in some studies [6,24,32,34].
This pattern of increasing the CO2 capture capacity with increasing the temperature up to a certain limit and then decreasing CO2 adsorption can be explained because, most likely, the increase in temperature intensifies chemical reactions with the activating agent (potassium oxalate) and carbon, culminating in a decrease in carbon atoms, causing pore enlargement during the carbonization process. After a temperature limit, though, this porous structure tends to rupture, collapsing the pores and probably decreasing the BET surface area and micropore volume [6].
In relation to the textual parameters outlined in Table 1 concerning CO2 absorption, the banana sample identified as FACBP-4600 exhibited the most significant values for both the BET surface area and micropore volume, measuring 71.12 m2/g and 0.04 cm3/g, respectively. This observation indicates that samples characterized by an elevated BET surface area and micropore volume are associated with enhanced CO2 capture capabilities. This finding aligns with the existing literature, which supports the notion that increased surface area and micropore volume are critical factors in effective CO2 sequestration [18,21,35].
Quan et al. [21] studied the influence of the carbonization temperature on activated carbon in the capture of CO2 and concluded that the carbonization temperature (activation) exerts a great influence on the specific surface area and the micropore volume, with the increase in the carbonization temperature, the specific area, and the micropore volume tending to increase and later reduce when the same temperature is increased again. In their work, the optimization temperature was also 600 °C.

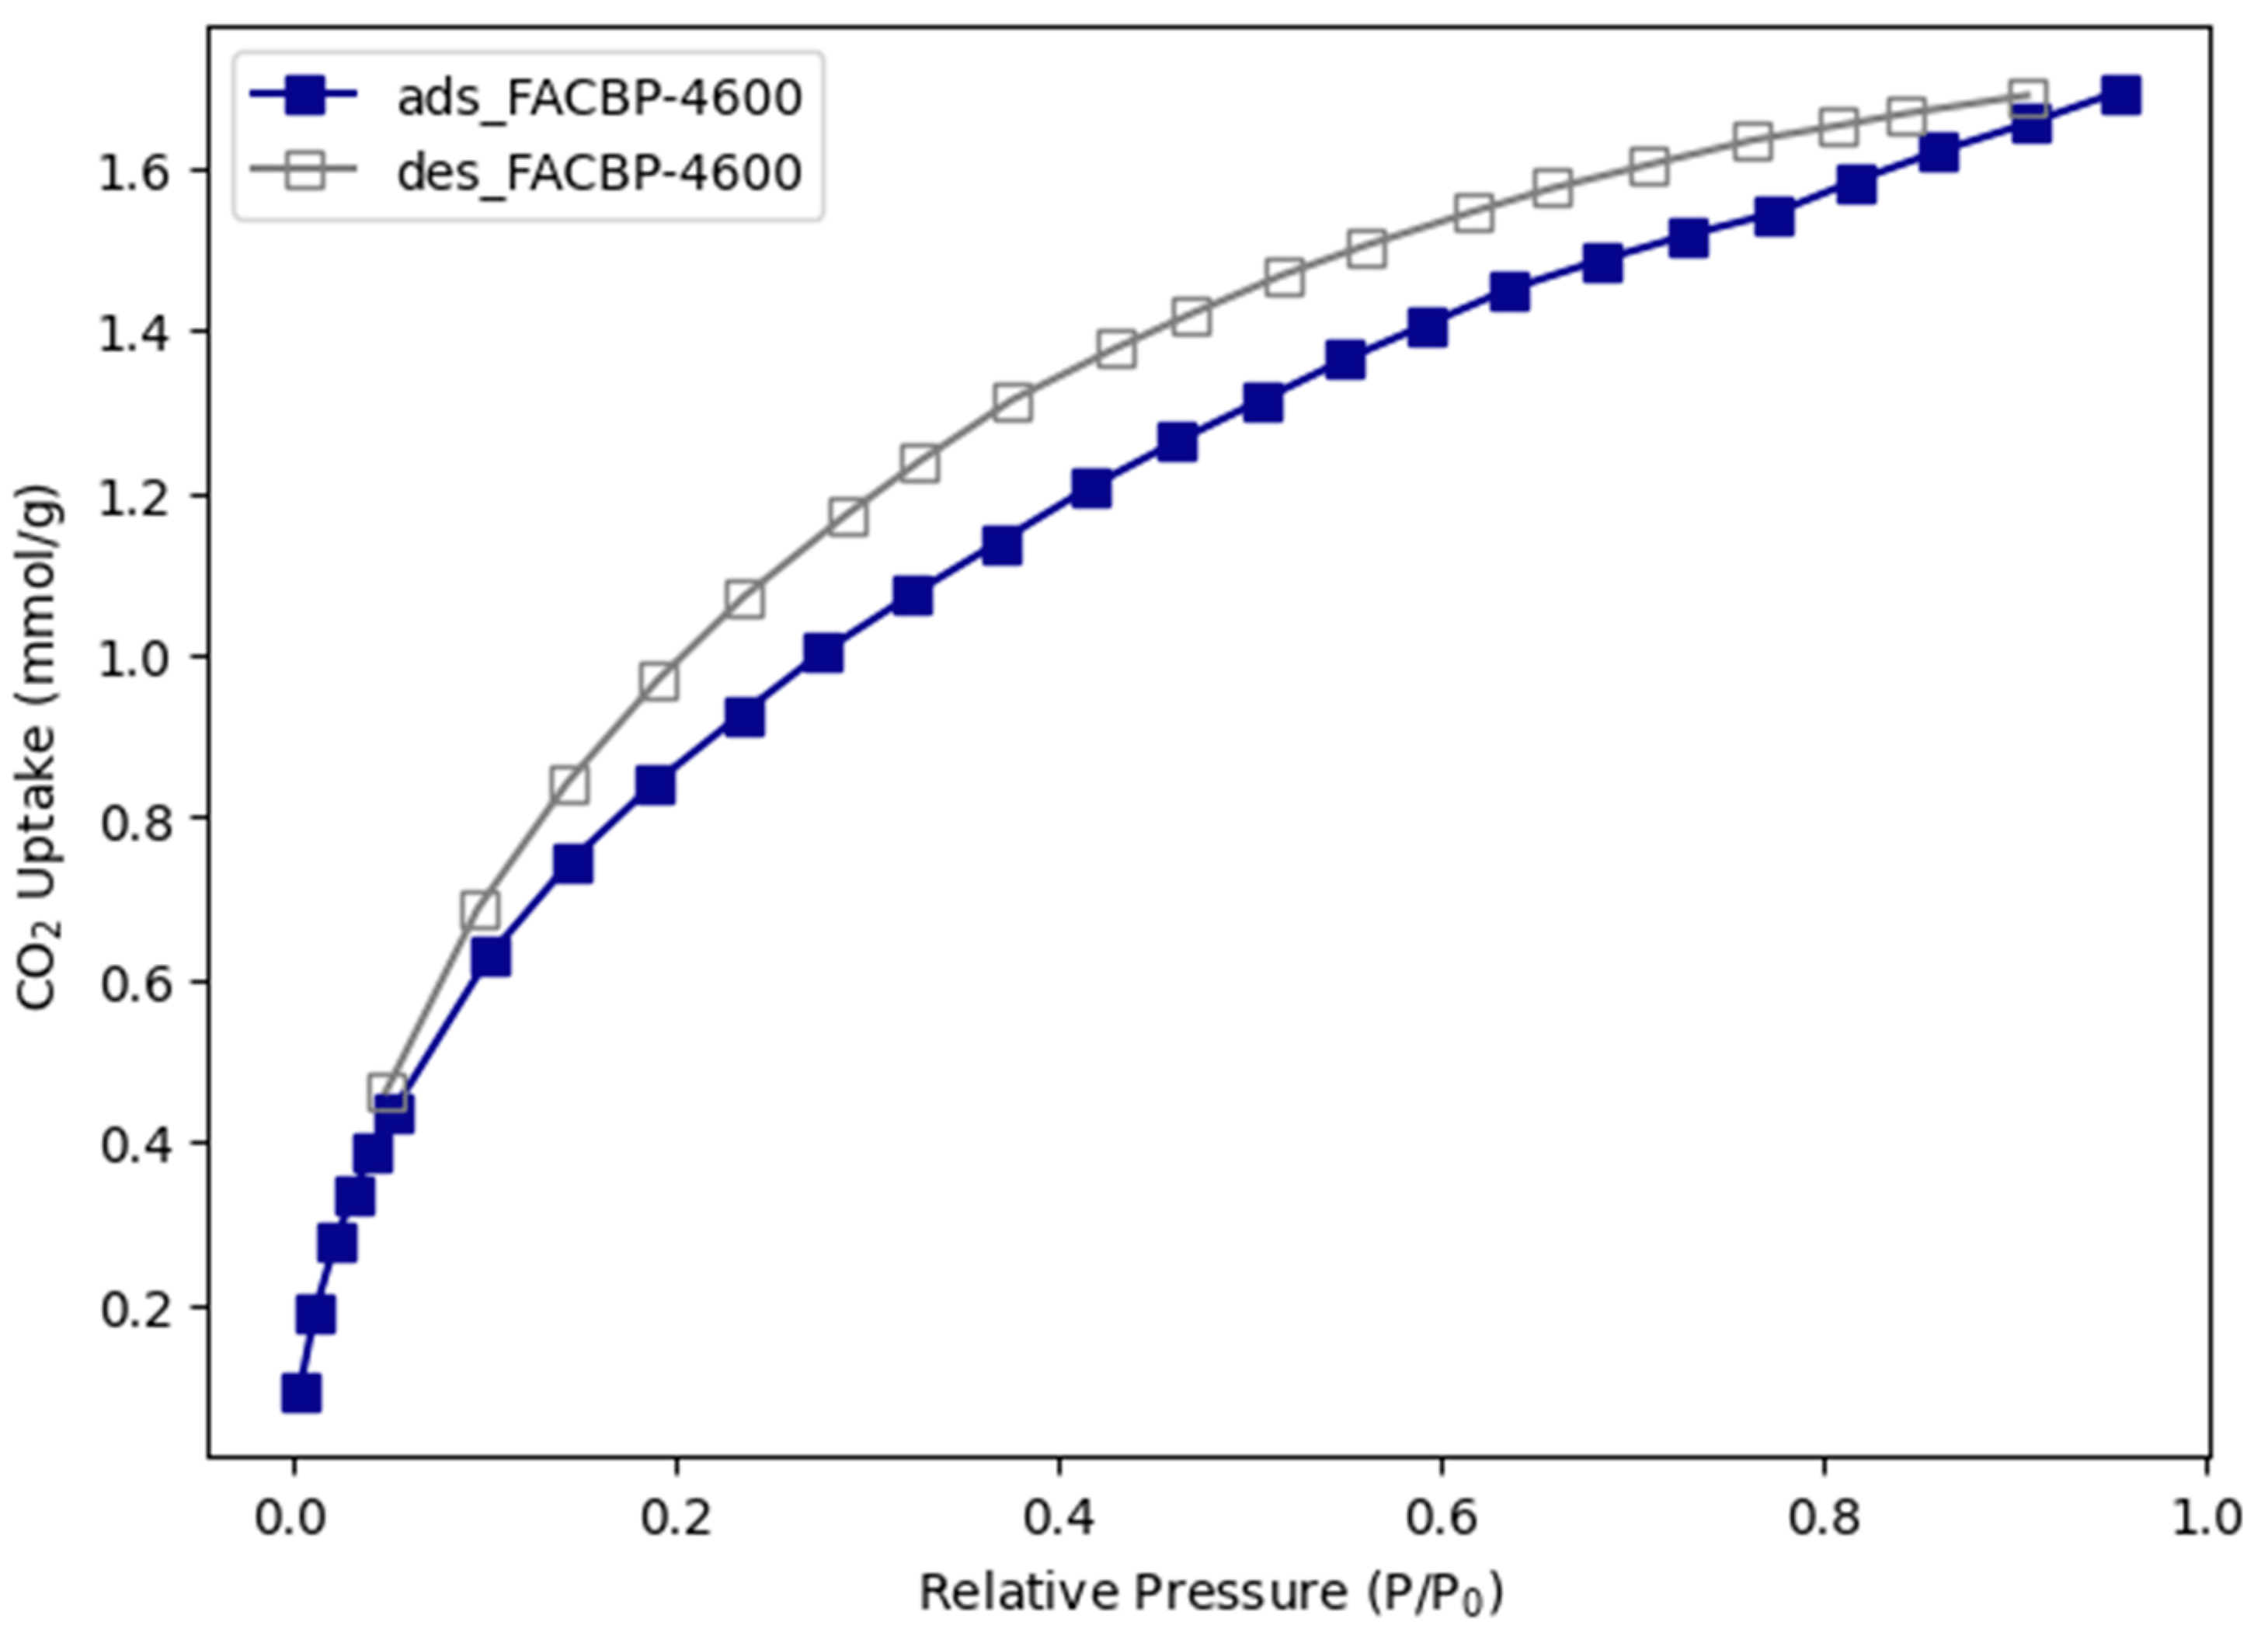
3.1.4. CO2 Adsorption Performance of Banana Peel Functionalized Impregnated Activated Carbon

The adsorption/desorption isotherms of the FACBP-4600 sample at 0 °C and 1 bar are shown in Figure 4.
The CO2 isotherms studied are type I of the International Union of Pure and Applied Chemistry (IUPAC) classification, in which it is characterized by an adsorption curve that shows a rapid and continuous increase in the amount of adsorbate with increasing pressure, reaching a saturation value [16,27]. Serafin et al. [16] studied CO2 adsorption on biomass residues from surgical masks and found the same type of adsorption isotherm.
Sample FACPFP-4600 demonstrates a remarkable maximum CO2 capture capacity, reaching 1.69 mmol/g. The higher CO2 adsorption values shown in Figure 4 are very possibly related to the higher specific surface areas and micropore volume of the same samples, as evidenced in Table 1, in combination with the attractive van der Waals forces (physical adsorption) in the pore system of the samples. This could be explained by the K2C2O4 activation process corroding the carbon surface, justifying the maximum CO2 capture values found [21,24].
The occurrence of a hysteresis loop can also be seen, especially for the FACBP-4600 sample, demonstrating the possible existence of mesopores. The presence of a hysteresis loop is related to nitrogen capillary condensation [6]. The results not only evidence the effectiveness of these samples in capturing CO2 but also provide valuable insights into structural properties, such as the presence of mesopores, which play an important role in gaseous interaction.
Table 3 shows some CO2 capture values found in the literature, showing that the current work is very promising.

3.2. Characterization of the Study

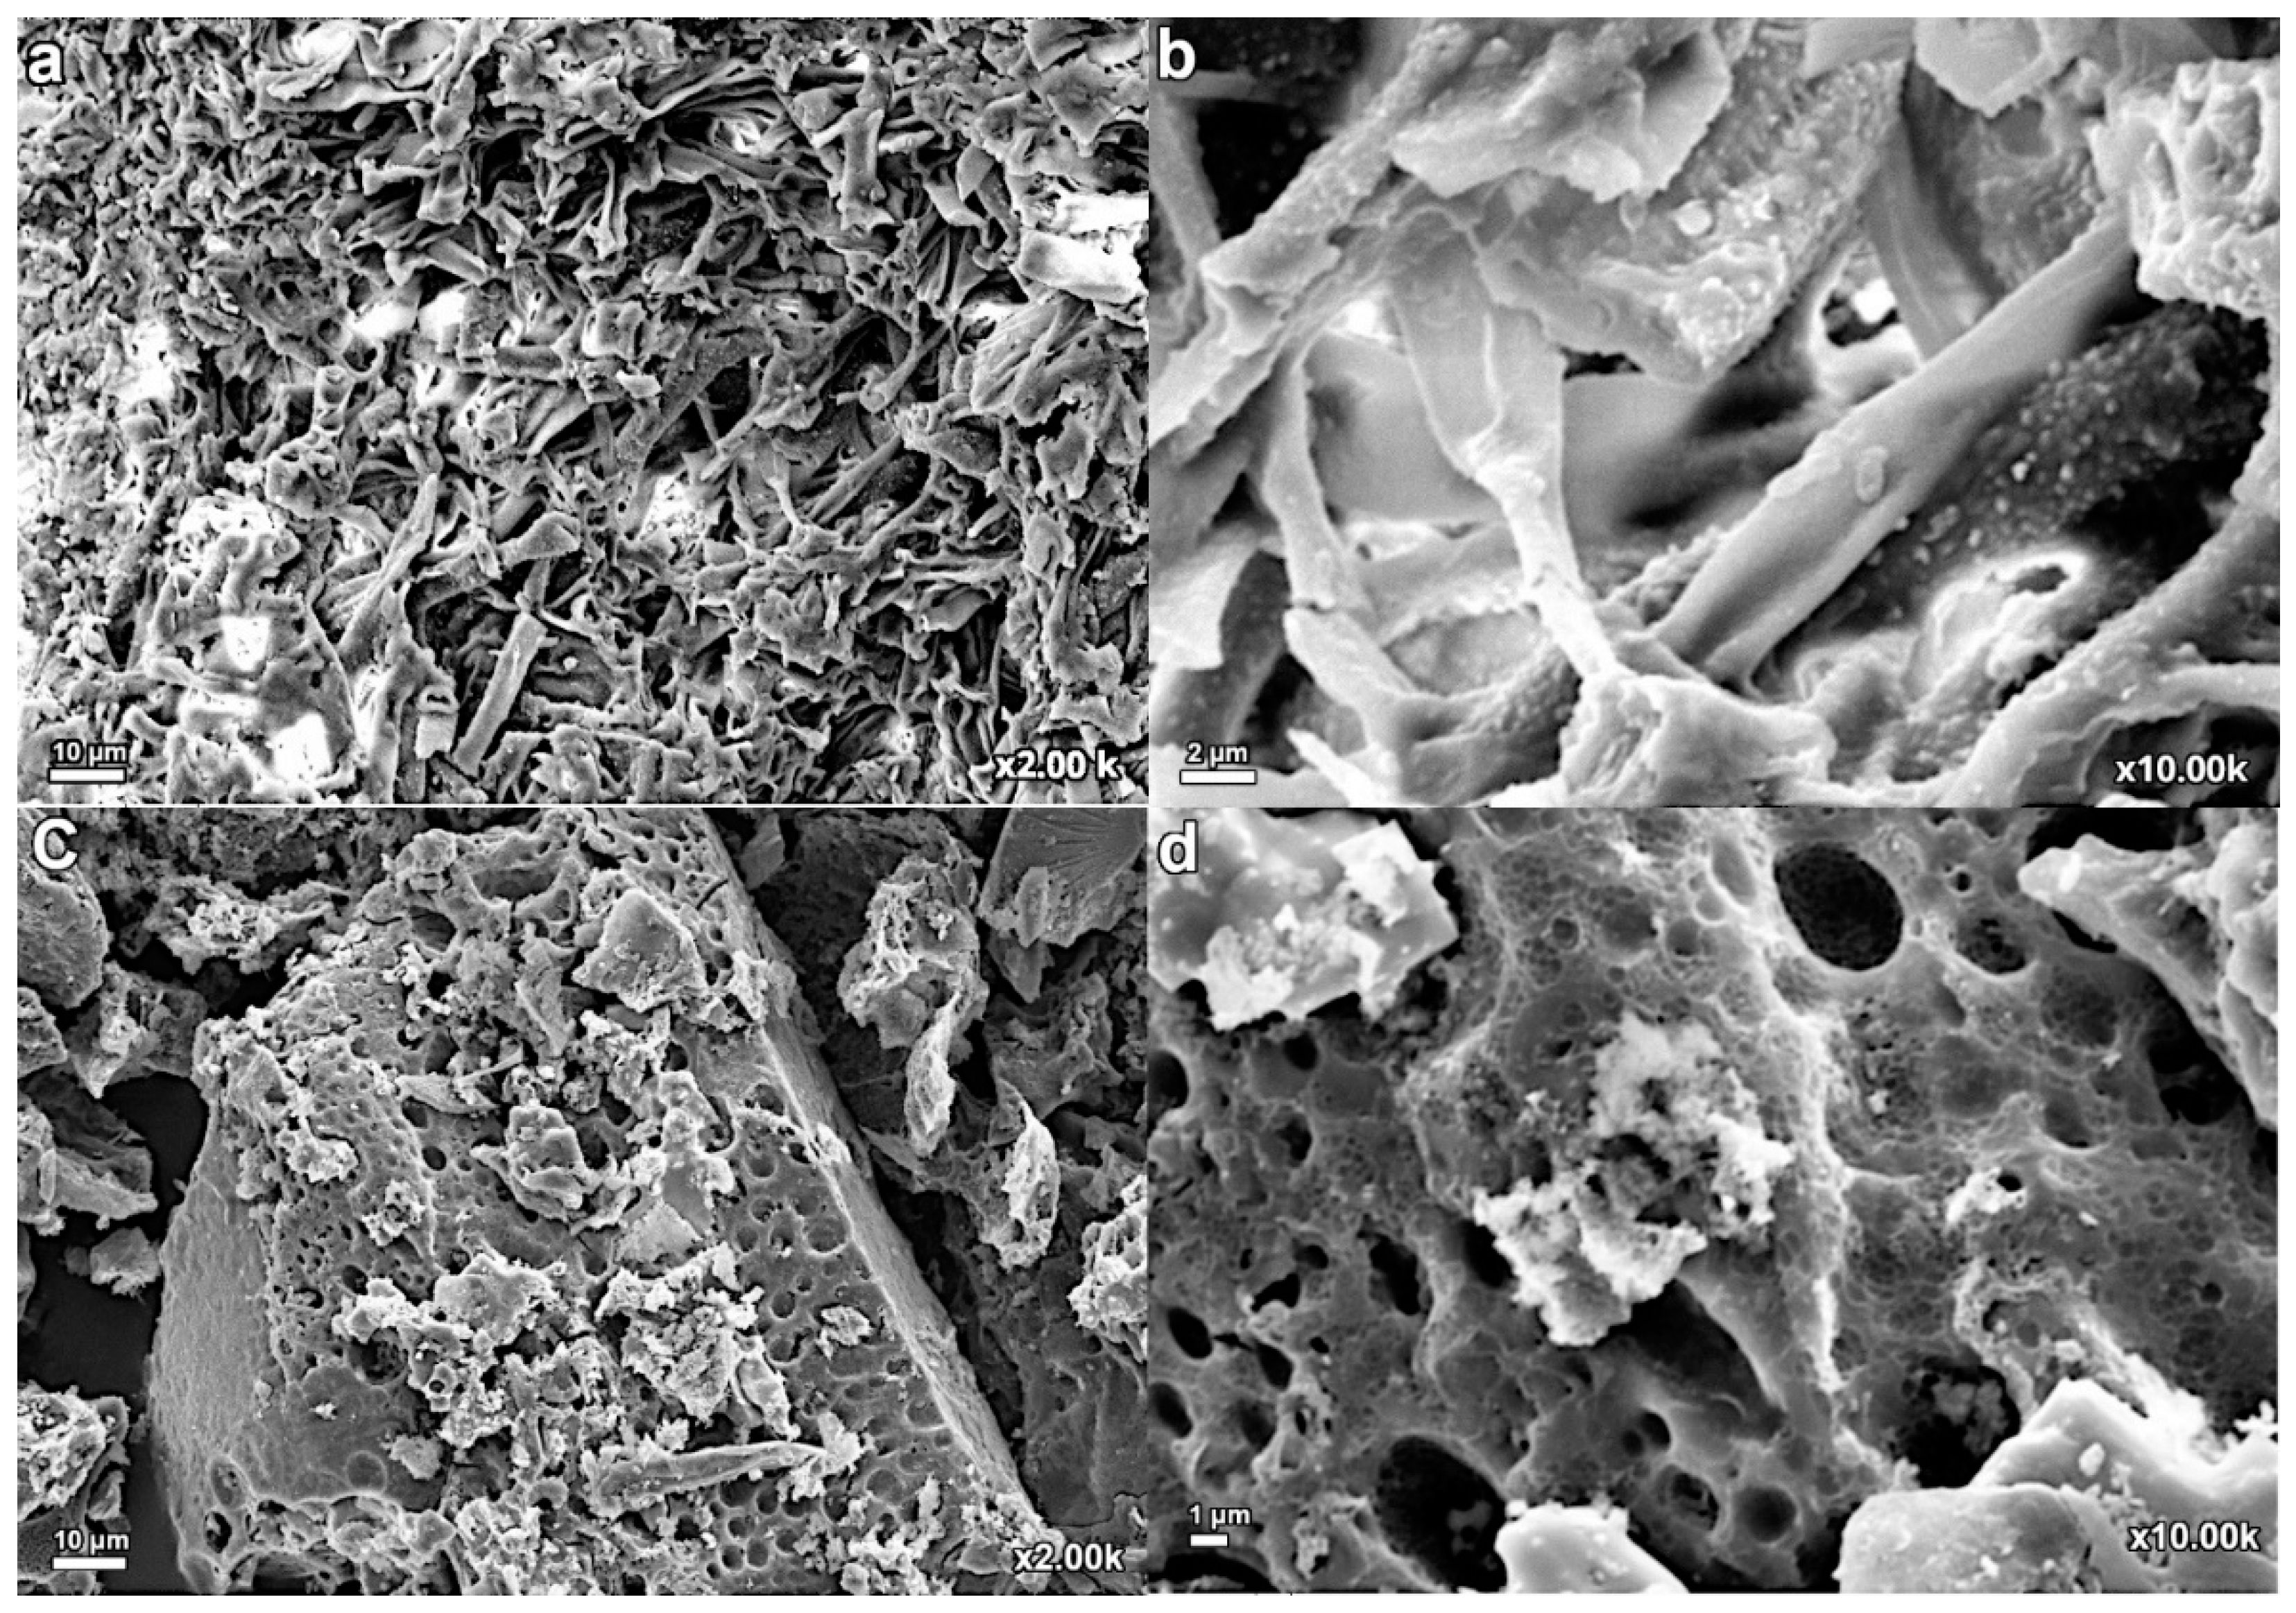
3.2.1. Scanning Electron Microscope Image Analysis (SEM)

The physical structure, microstructure, and EDX analysis of the BP and FACBP-4600 samples are presented in Figure 5 and Table 4, in the same order. For the BP sample (Figure 5a,b), a large aggregate of irregular and rough-shaped particles is visible, along with empty spaces on the banana peel. This same morphological structure is present in [39,40,41]. Alternatively, the FACBP-4600 sample (Figure 5c,d) indicates a small amount of pores with a more regular shape (circular) [6,39], which can be attributed to the activation step using potassium oxalate, which, due to its alkalinity, corrodes carbonaceous materials at high temperatures, resulting in the formation of a large number of pores [6]. The structured hierarchy of pores within the material can significantly improve the capture of CO2, as evidenced by the findings from BET and BJH analyses. These pores possess adequate dimensions to facilitate the movement of CO2 molecules through the interior of the activated and functionalized carbon material, thereby promoting interactions with the surface’s chemical groups, especially those containing nitrogen [6,42].
In the EDX analyses, in addition to the XPS analyses, carbon (63.9%) and oxygen (32.75%) predominate in the composition of the BP, reducing the amount of potassium (2.31%). The KCl the compound is probably a constituent of the biomass [38], and the XRD analyses corroborated this statement, since the KCl compound was found in the same sample by the XRD analyses. Alternatively, for the FACBP-4600 sample, the surface chemical composition is as follows: carbon (55.24%), oxygen (34.69%), potassium (4.68%), chlorine (1.85%), and silicon (1.48%). The almost doubled existence of potassium in this material is a clear sign of the successful activation step using potassium oxalate supported by FTIR analysis. As it was carbonized, as depicted by the TGA analyses, the existence of a few inorganic substances from the biological material was expected, like the increased presence of chlorine and silicon.

3.2.2. Fourier-Transform Infrared (FTIR) Spectroscopy

The FTIR spectra of the materials are found in Figure 6.
The intense peak identified in the bands around 3434–3437 cm−1 may signal the antisymmetric stretching of the N-H/O-H functional groups. This observation is highly indicative of the presence of amines, a strong indication of EDA functionalization in the FACBP-4600 sample, and the presence of phenols (most likely in the BP sample), as reported by X. Guo et al. and He et al. [6,43]. The peak observed at 2920 cm−1 may be due to the C-H saturated aliphatic stretch present in hemicellulose and cellulose [44].
In addition, the peak close to the area of 1618–1631 cm−1 is probably a consequence of the stretching of the C=O bonds, which are typical of carbonyl groups. These bonds may be associated with carboxylic acids found in residual lignin or the C=C double bonds present in the aromatic rings of lignin and cellulose [6,45]. A peak around 1384 cm−1 is also observed, which may be related to the stretching of the C-H bonds present in cellulose or to the vibrations of the C=O/C-O bonds, which were also detected at the peak at 1079 and 1076 cm−1 [11,46]. This same range at 1076–1079 cm−1 may also can be related to the C-N stretching vibration, a clear evidence of the EDA functional groups present in the FACBP-4600 material, and also with the vibrational stretch of aliphatic alcohol from hemicellulose, cellulose, and parts of lignin, present in greater quantity in the BP sample, respectively [28,44]. Finally, it is worth mentioning the peak located in the approximate region of 470 cm−1, which can be associated with the stretching of the C-C bonds [6].

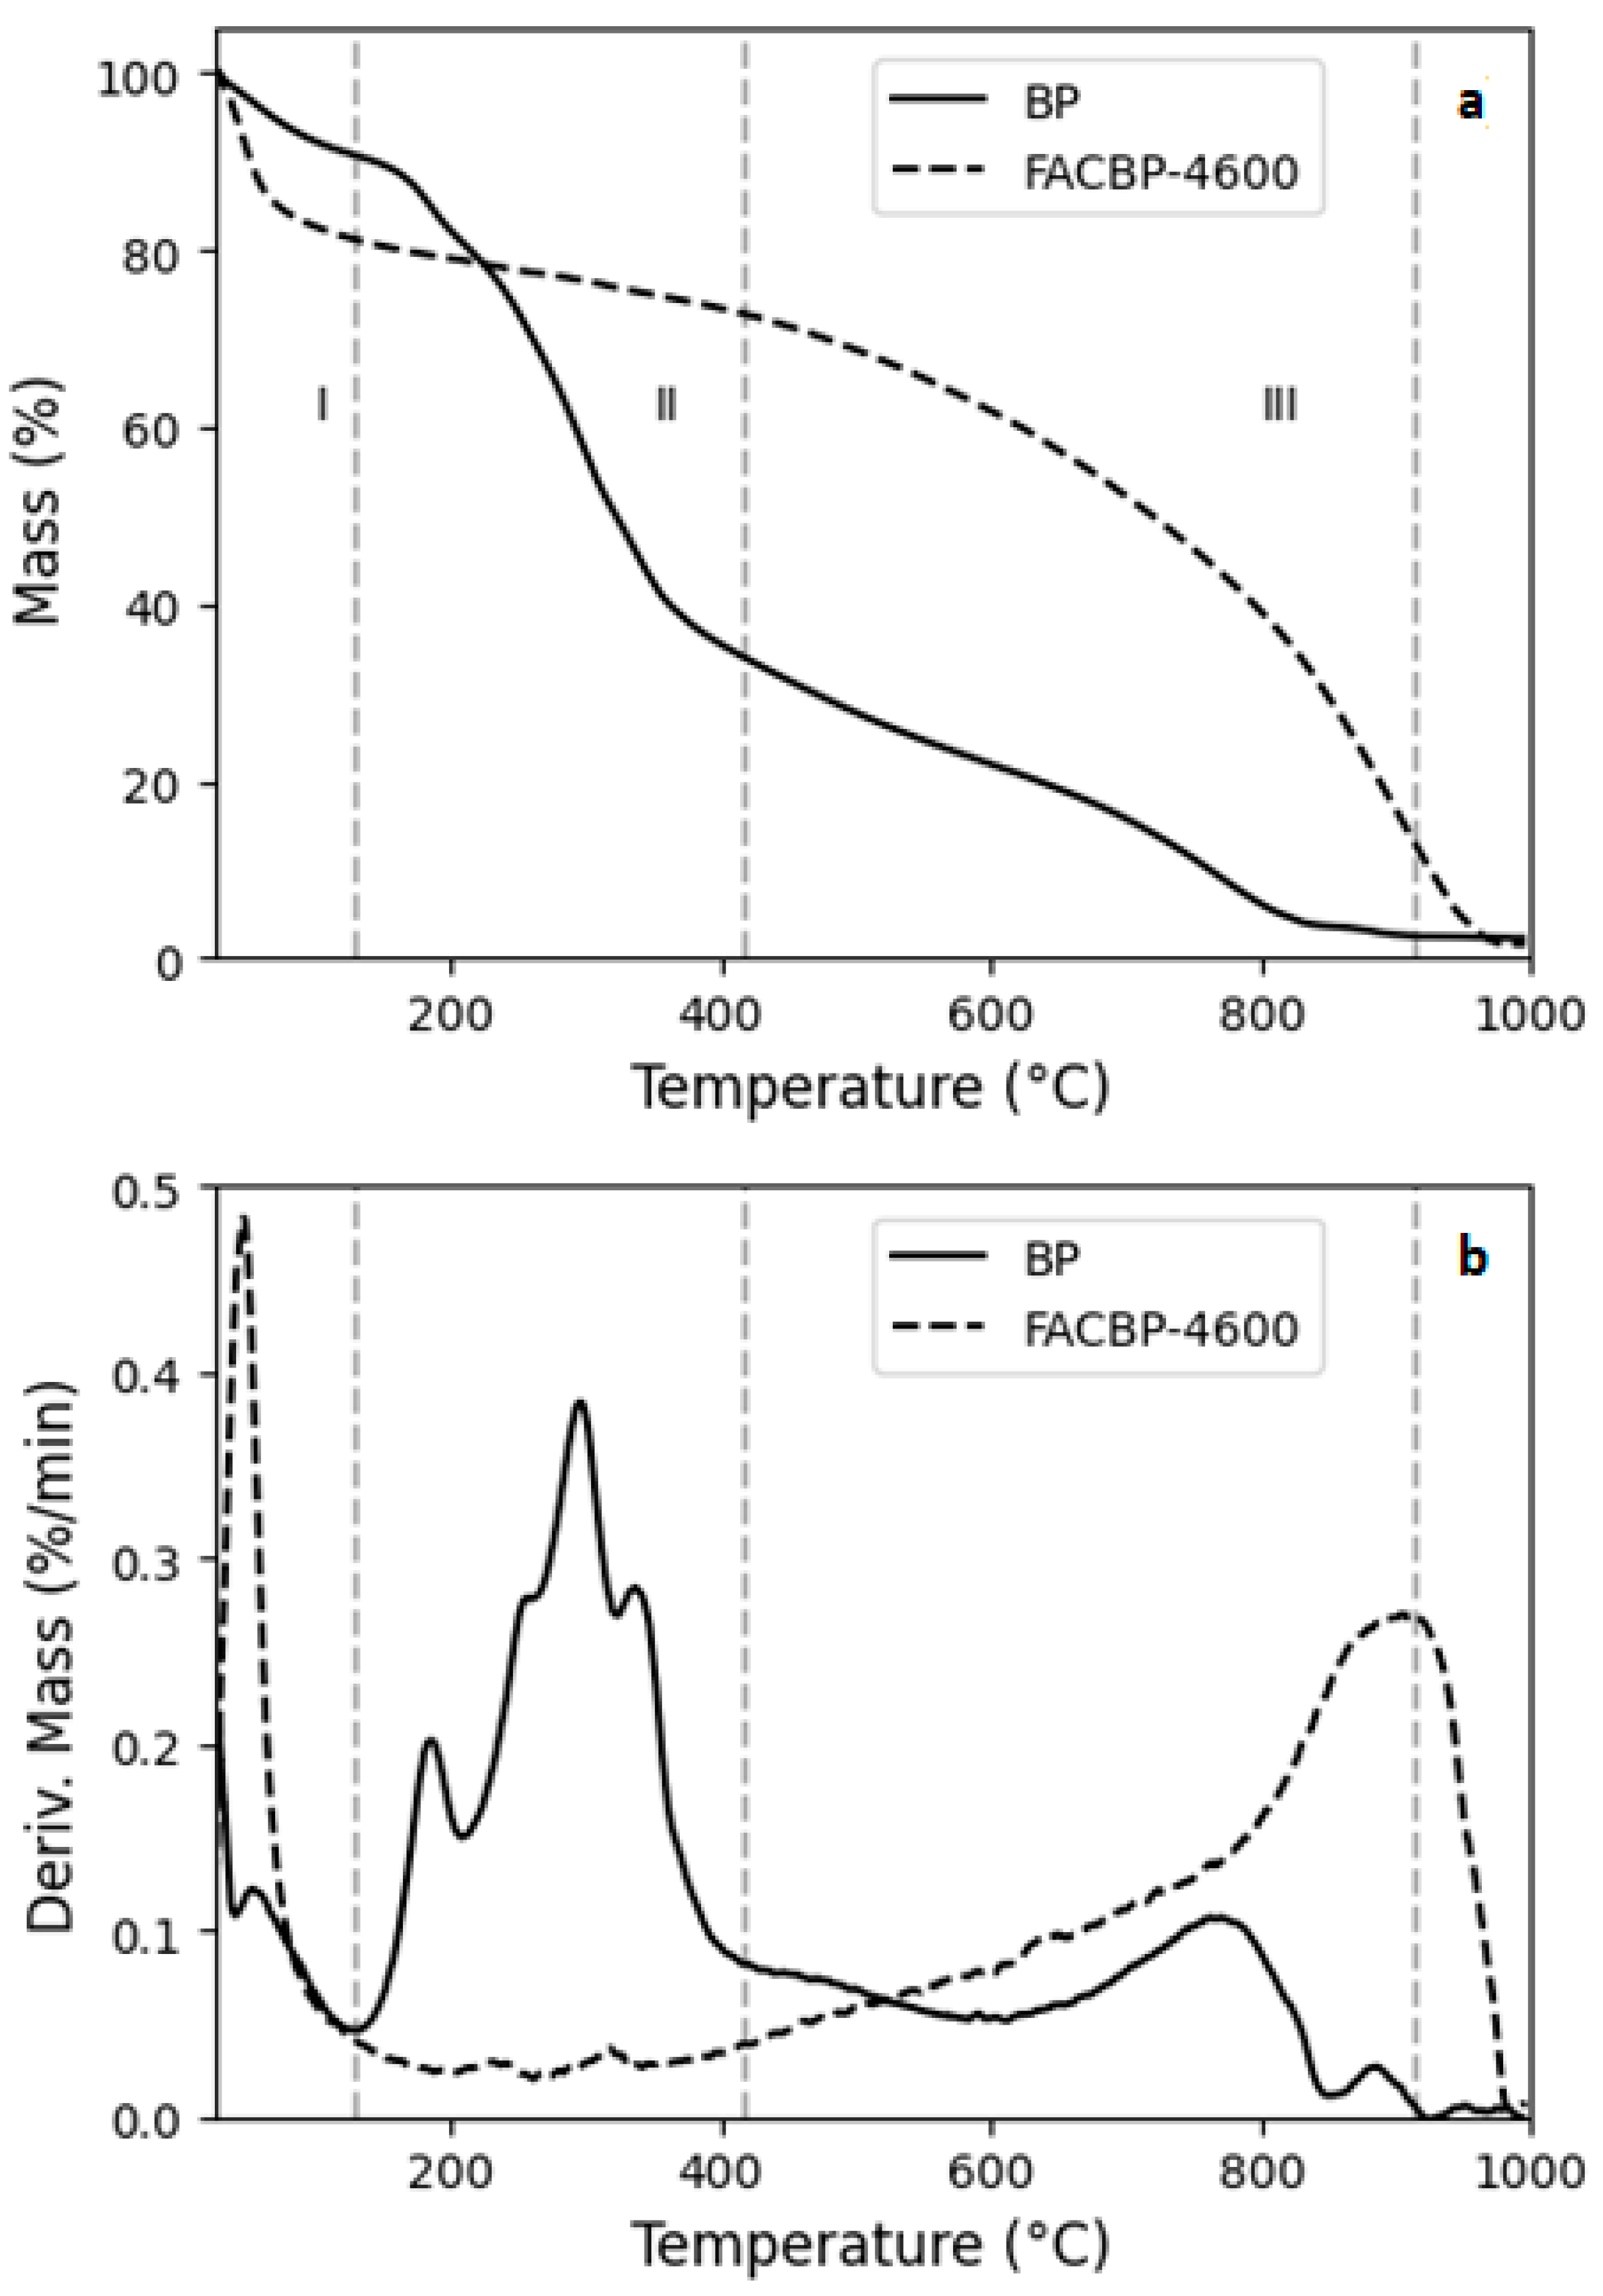
3.2.3. Thermal Gravimetric Analysis (TGA)

The TGA curves obtained in a nitrogen atmosphere are presented in Figure 7. At a heating rate of 10 °C/min in a non-reactive atmosphere, the BP sample presented a remaining mass of 2.30%, a relevant result in the literature. Tahir et al. [30] found a remaining mass of BP of 4.76% at the same heating ratio. It can also be observed that the thermal degradation of BP involved multiple stages of mass loss, exhibiting three main characteristic peaks of lignocellulosic biomasses. The first stage of mass loss (stage “I” in Figure 7) comprises the temperature range up to about 130 °C, with a peak near the temperature of 53 °C. The same behavior was seen in the study by Tahir et al. [30]. Part of this mass loss in this range is associated with water evaporation and the evaporation of some volatiles. The second (stage “II”) and third mass loss stage (stage “III”) for BP correspond to temperature ranges of 130–417 °C and 417–915 °C, with peaks in these ranges of 297 °C and 774 °C, respectively. These peaks take into account the molecular structure of BP and may exhibit different pyrolysis characteristics [30]. Lignocellulosic biomasses are basically made up of hemicellulose, cellulose, and lignin, and each of these compounds has a specific degradation temperature range. Between the range of 200–350 °C, the degradation mainly of simple sugar monomers such as hemicellulose and cellulose begins [30,45,47,48].
On the other hand, lignin is a highly complex polymer, containing various phenols and oxygen-containing functional groups, and is slowly decomposed in the range of 280–600 °C [30,45,47,48]. Higher peaks (600–950 °C) can be associated with the degradation of carbonaceous compounds [49]. The maximum observed during the second stage (297 °C) can be ascribed to the concurrent thermal degradation of hemicellulose, cellulose, and certain lignin components, which occurs alongside the emission of intricate gaseous compounds within this temperature range. Ultimately, the third stage, characterized by elevated temperatures, is linked to the pyrolysis of lignin, the breakdown of carbonaceous materials, and the generation of ash [30,49].
As for the FACBP-4600 sample, as it is a previously functionalized and activated pyrolyzed sample, there was a reduction in the peaks compared to the BP sample, with greater thermal stability [5]. FACBP-4600 presented a residual mass of 1560%. There were two primary stages of thermal decomposition for this sample, the first (“I”) in the temperature range up to 130 °C with a strong peak at around 45 °C and the second phase (“II and “III”) between the temperatures of 417–980 °C, with another significant peak at 910 °C.
The peak observed at 45 °C is probably linked to the decomposition of ethylenediamine (EDA), which is accountable for the functionalization, as indicated by XPS and FTIR analyses. Since EDA is a nitrogenous compound with amine groups and is highly volatile in its liquid state, it degrades at this temperature. The peak at 910 °C is probably due to the decomposition of potassium oxalate and carbonaceous materials that are resistant to chemical modification. This phase is associated with the formation of the porosity [50]. Potassium oxalate decomposes in the temperature range of 500–580 °C [20], and at temperatures above 800 °C, peaks associated with oxidation reduction reactions may be seen, suggesting the gasification of graphite and the reduction of potassium oxalate (K2CO3) by carbon [51].
Figure S1 in the Supplementary Materials shows the thermogravimetric analysis curves for K2CO3 and EDA, confirming these peaks.

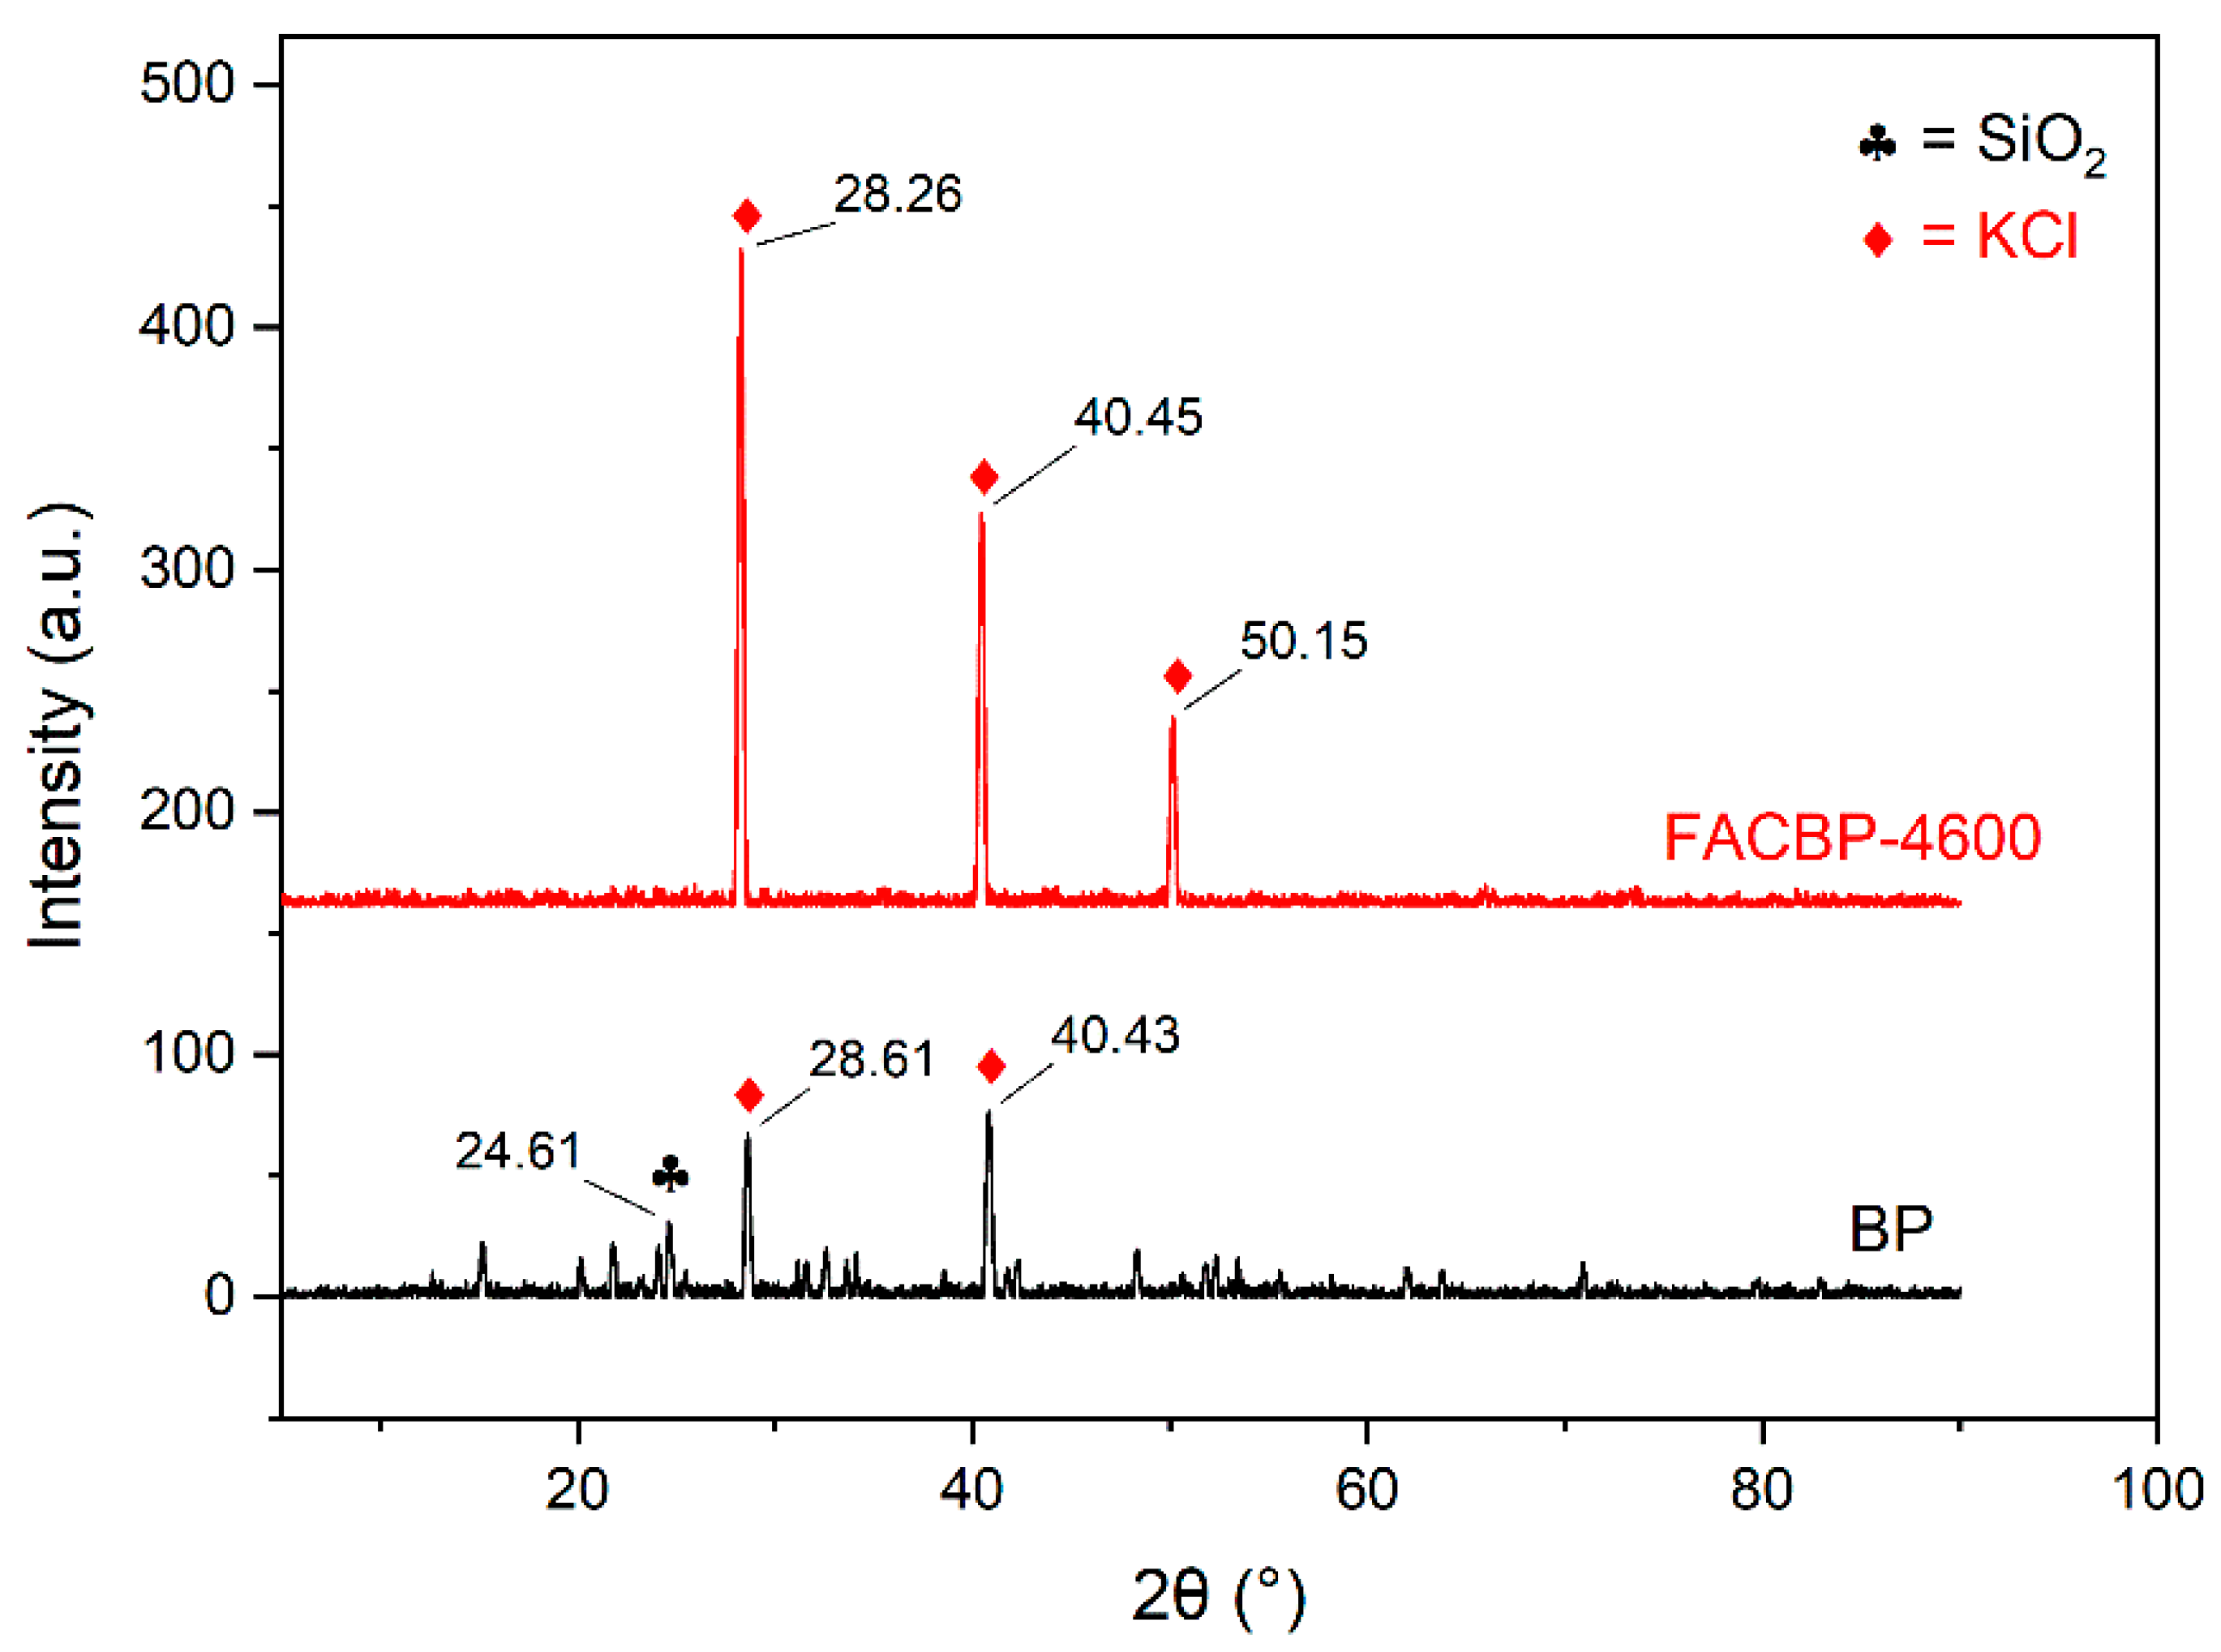
3.2.4. X-Ray Diffraction Analysis (XRD)

The XRD diffractograms can be found in Figure 8. Some inorganic elements present in the BP and FACBP-4600 samples can be seen. The BP X-ray diffraction pattern found potassium (K) (2θ = 28.61 and 40.43° and PDF-2 database 00-001-0786) in the form of chloride as the main element, followed by silicon oxide (SiO2) (2θ = 24.61° and PDF-2 database 00-038-0448). Tagiran et al. [40] found potassium in oxide form as the main component of a calcined banana peel, followed also by SiO2.
Potassium chloride (KCl) most likely exists naturally in bananas. Sigiro et al. [39] also found KCl in the biomass of banana peel residues and concluded that the element is natural from biomass. Meriatna et al. [52] also found KCl in banana peel ash. It can also be seen that, for this sample, the crystalline peaks are less intense than those of the activated and functionalized sample, presenting a more amorphous character [53]. The presence of the chemical elements K, Cl, and Si were also seen in the EDX analyses.
As for the FACBP-4600 sample, due to having undergone pyrolysis processes, it has more intense peaks than BP. This can be explained due to the increased crystallinity of KCl and the removal of most organic carbon during the pyrolysis process [39], in addition to the fact that this sample contains potassium oxalate. The peaks found at 2θ = 28.26°, 40.45°, and 50.15° can be related to the presence of KCl.

3.2.5. XPS Analysis

The XPS analyses served to confirm success in the doping of nitrogen (N) functional groups in the FACBP-4600 sample, since the incorporation of functional groups containing nitrogen, with a predominance of pyridinic-N and pyrrolic-N, promotes greater alkalinity on the surface of the coals, increasing CO2 capture [6]. The XPS spectra of samples BP (a) and FACBP-4600 (b) are represented in Figure 9, and Table 5 shows the primary elements present on the surface of each sample.
According to Table 5, for the BP sample, the presence of essentially carbon (C) and oxygen (O) can be seen. On the other hand, for the FACBP-4600 sample, there was an enhanced in the concentration of nitrogen (N) on the surfaces of the sample (3.34%), an expected value according to the studies by Xiao et al. and X. Zhang et al. [12,31], and a strong indication of success in the functionalization step. Other elements also appear in this same sample, such as potassium (K), which is most likely from the activation process using potassium oxalate, in addition to silicon (Si), which should probably be present in the soils where the samples were collected. It should be noted that these elements were found for the FACBP-4600 sample, in which there was a pyrolysis and activation process, so its % of C tends to be reduced compared to the BP sample. These same chemical elements found in Table 5 were confirmed in the EDX analyses.
As seen in Figure 9, the carbon spectrum (C1s) can be divided into four peaks, located at 284.8, 286.0–286.1, 287.8, and 289.6 eV, corresponding to the bonds C-C, C-O, C-N, N-C=O, and O-C=O, respectively [6,31,54]. For the BP sample (Figure 9a), only two of these peaks (C-C and C-O) can be seen; on the other hand, for the FACBP-4600 sample (Figure 9b), the rest of the peaks can be seen, especially those with N-links (C-N and N-C=O). Additionally, the deconvolution of the nitrogen spectrum (N1s) for the FACBPB-4600 sample (Figure 9b) reveals three peaks at 398.4, 400.3, and 401.8 eV, corresponding to the nitrogen structures pyridinic-N, pyrrolic-N, and graphitic-N, respectively [6,54,55]. The presence of amine functional groups indicates that nitrogen was properly incorporated into the FACBP-4600 sample, confirming its functionalization with EDA [6].

4. Conclusions

In general, this study investigated the best conditions for CO2 adsorption on activated carbon (K2C2O4) and functionalized carbon (ethylenediamine—EDA) of banana peel residues based on the carbonization temperature, impregnation rate (reagents/biomass), and preparation method (dry/wet). The sample that presented the optimal CO2 capture conditions was FACP-4600 (1.69 mmol/g) produced at a carbonization temperature of 600 °C for 1 h, an impregnation ratio of 1:1, and dry preparation mode (one-step preparation). The specific surface area, total pore volume, and micropore volume were 71.12 m2/g, 0.02 cm3/g, and 0.04 cm3/g, respectively. It was noted that, with increasing the carbonization temperature, CO2 adsorption increases to a temperature limit. When exceeding this limit, CO2 capture decreases. Functionalization by EDA was confirmed by the XPS analyses; the XRD analyses served to expose that KCl is the main inorganic component of banana peels; the thermal analyses served to see the lignocellulosic nature of biomass; through the FTIR analyses, the main surface functional groups were found, such as carboxylic and, especially, N-H stretches, characteristic of amines, which have a greater affinity with the acidic character of CO2; and finally, the SEM surface analyses showed a structure with pores in the circular format for the FACBP-4600 sample. All characterization analyses were decisive in characterizing the basic nature of the adsorbent, which had greater affinity with the CO2 molecule (greater acidic character). Therefore, this work contributed to finding the optimal conditions for CO2 capture in banana peel biomass through the production of activated and functionalized carbon (PC) for the use of waste banana peel residues in the context of global warming.

Supplementary Materials

The following supporting information can be downloaded at: https://www.mdpi.com/article/10.3390/cleantechnol7010025/s1, Figure S1: TG curves for EDA and K2CO3 at 10°C/min in inert atmosphere (Ni).

Author Contributions

Conceptualization: L.C.M.; Methodology: C.B.P.; Formal analysis and investigation: C.B.P.; Writing—original draft preparation: C.B.P.; Writing—review and editing: L.C.M. and P.R.R.; Funding acquisition: L.C.M.; Resources: L.C.M.; Supervision: L.C.M. and P.R.R. All authors have read and agreed to the published version of the manuscript.

Funding

This research was funded by FAPESP—São Paulo Research Foundation, grant number No. 2021/11104-8.

Institutional Review Board Statement

Not applicable.

Informed Consent Statement

Not applicable.

Data Availability Statement

The original contributions presented in this study are included in the article. Further inquiries can be directed to the corresponding author.

Acknowledgments

The author Peres, C. B. would also like to thank the Coordination for the Improvement of Higher Education Personnel (CAPES) and the Universidade Estadual Paulista Júlio de Mesquita Filho (Unesp) Campus of Sorocaba (ICTS), Brazil, for the opportunity to attend its postgraduate program in Environmental Sciences and the Bioenergy, Biofuels, Climate and Effluents research group at Unesp Sorocaba.

Conflicts of Interest

The authors declare no conflicts of interest that are relevant to the contents of this article.

References

  1. Hasan, M.M.F.; Zantye, M.S.; Kazi, M.-K. Challenges and opportunities in carbon capture, utilization and storage: A process systems engineering perspective. Comput. Chem. Eng. 2022, 166, 107925. [Google Scholar] [CrossRef]
  2. Wang, S.; Lee, Y.-R.; Won, Y.; Kim, H.; Jeong, S.-E.; Hwang, B.W.; Cho, A.R.; Kim, J.-Y.; Park, Y.C.; Nam, H.; et al. Development of high-performance adsorbent using KOH-impregnated rice husk-based activated carbon for indoor CO2 adsorption. Chem. Eng. J. 2022, 437, 135378. [Google Scholar] [CrossRef]
  3. Kamran, U.; Park, S.-J. Chemically modified carbonaceous adsorbents for enhanced CO2 capture: A review. J. Clean. Prod. 2021, 290, 125776. [Google Scholar] [CrossRef]
  4. Wang, X.; Cheng, H.; Ye, G.; Fan, J.; Yao, F.; Wang, Y.; Jiao, Y.; Zhu, W.; Huang, H.; Ye, D. Key factors and primary modification methods of activated carbon and their application in adsorption of carbon-based gases: A review. Chemosphere 2022, 287, 131995. [Google Scholar] [CrossRef] [PubMed]
  5. Hatta, N.S.M.; Hussin, F.; Gew, L.T.; Aroua, M.K. Enhancing surface functionalization of activated carbon using amino acids from natural source for CO2 capture. Sep. Purif. Technol. 2023, 313, 123468. [Google Scholar] [CrossRef]
  6. He, S.; Chen, G.; Xiao, H.; Shi, G.; Ruan, C.; Ma, Y.; Dai, H.; Yuan, B.; Chen, X.; Yang, X. Facile preparation of N-doped activated carbon produced from rice husk for CO2 capture. J. Colloid Interface Sci. 2021, 582, 90–101. [Google Scholar] [CrossRef]
  7. Mukherjee, A.; Okolie, J.A.; Abdelrasoul, A.; Niu, C.; Dalai, A.K. Review of post-combustion carbon dioxide capture technologies using activated carbon. J. Environ. Sci. 2019, 83, 46–63. [Google Scholar] [CrossRef]
  8. Zhang, S.; Liu, L.; Zhang, L.; Zhuang, Y.; Du, J. An optimization model for carbon capture utilization and storage supply chain: A case study in Northeastern China. Appl. Energy 2018, 231, 194–206. [Google Scholar] [CrossRef]
  9. Peres, C.B.; Resende, P.M.R.; Nunes, L.J.R.; de Morais, L.C. Advances in Carbon Capture and Use (CCU) Technologies: A Comprehensive Review and CO2 Mitigation Potential Analysis. Clean Technol. 2022, 4, 1193–1207. [Google Scholar] [CrossRef]
  10. Shen, Y. Preparation of renewable porous carbons for CO2 capture—A review. Fuel Process. Technol. 2022, 236, 107437. [Google Scholar] [CrossRef]
  11. Guo, Y.; Tan, C.; Sun, J.; Li, W.; Zhang, J.; Zhao, C. Porous activated carbons derived from waste sugarcane bagasse for CO2 adsorption. Chem. Eng. J. 2020, 381, 122736. [Google Scholar] [CrossRef]
  12. Zhang, X.; Xu, Y.; Zhang, G.; Wu, C.; Liu, J.; Lv, Y. Nitrogen-doped porous carbons derived from sustainable biomass via a facile post-treatment nitrogen doping strategy: Efficient CO2 capture and DRM. Int. J. Hydrogen Energy 2022, 47, 24388–24397. [Google Scholar] [CrossRef]
  13. Shao, J.; Ma, C.; Zhao, J.; Wang, L.; Hu, X. Effective nitrogen and sulfur co-doped porous carbonaceous CO2 adsorbents derived from amino acid. Colloids Surf. A Physicochem. Eng. Asp. 2022, 632, 127750. [Google Scholar] [CrossRef]
  14. Karimi, M.; Shirzad, M.; Silva, J.A.; Rodrigues, A.E. Biomass/Biochar carbon materials for CO2 capture and sequestration by cyclic adsorption processes: A review and prospects for future directions. J. CO2 Util. 2022, 57, 101890. [Google Scholar] [CrossRef]
  15. Maniarasu, R.; Rathore, S.K.; Murugan, S. Biomass-based activated carbon for CO2 adsorption–A review. Energy Environ. 2022, 34, 1674–1721. [Google Scholar] [CrossRef]
  16. Serafin, J.; Sreńscek-Nazzal, J.; Kamińska, A.; Paszkiewicz, O.; Michalkiewicz, B. Management of surgical mask waste to activated carbons for CO2 capture. J. CO2 Util. 2022, 59, 101970. [Google Scholar] [CrossRef] [PubMed]
  17. Abuelnoor, N.; AlHajaj, A.; Khaleel, M.; Vega, L.F.; Abu-Zahra, M.R. Activated carbons from biomass-based sources for CO2 capture applications. Chemosphere 2021, 282, 131111. [Google Scholar] [CrossRef]
  18. Heidarinejad, Z.; Dehghani, M.H.; Heidari, M.; Javedan, G.; Ali, I.; Sillanpää, M. Methods for preparation and activation of activated carbon: A review. Environ. Chem. Lett. 2020, 18, 393–415. [Google Scholar] [CrossRef]
  19. Rehman, A.; Park, S.-J. From chitosan to urea-modified carbons: Tailoring the ultra-microporosity for enhanced CO2 adsorption. 2020, 159, 625–637. 159 2020, 159, 625–637. [Google Scholar] [CrossRef]
  20. Sevilla, M.; Al-Jumialy, A.S.M.; Fuertes, A.B.; Mokaya, R. Optimization of the Pore Structure of Biomass-Based Carbons in Relation to Their Use for CO2 Capture under Low- and High-Pressure Regimes. ACS Appl. Mater. Interfaces 2018, 10, 1623–1633. [Google Scholar] [CrossRef]
  21. Quan, C.; Wang, H.; Jia, X.; Gao, N. Effect of carbonization temperature on CO2 adsorption behavior of activated coal char. J. Energy Inst. 2021, 97, 92–99. [Google Scholar] [CrossRef]
  22. Serafin, J.; Baca, M.; Biegun, M.; Mijowska, E.; Kaleńczuk, R.J.; Sreńscek-Nazzal, J.; Michalkiewicz, B. Direct conversion of biomass to nanoporous activated biocarbons for high CO2 adsorption and supercapacitor applications. Appl. Surf. Sci. 2019, 497, 143722. [Google Scholar] [CrossRef]
  23. Pietrzak, R.; Nowicki, P.; Kaźmierczak, J.; Kuszyńska, I.; Goscianska, J.; Przepiórski, J. Comparison of the effects of different chemical activation methods on properties of carbonaceous adsorbents obtained from cherry stones. Chem. Eng. Res. Des. 2014, 92, 1187–1191. [Google Scholar] [CrossRef]
  24. Ahmed, M.B.; Johir, A.H.; Zhou, J.L.; Ngo, H.H.; Nghiem, L.D.; Richardson, C.; Moni, M.A.; Bryant, M.R. Activated carbon preparation from biomass feedstock: Clean production and carbon dioxide adsorption. J. Clean. Prod. 2019, 225, 405–413. [Google Scholar] [CrossRef]
  25. Pramanik, P.; Patel, H.; Charola, S.; Neogi, S.; Maiti, S. High surface area porous carbon from cotton stalk agro-residue for CO2 adsorption and study of techno-economic viability of commercial production. J. CO2 Util. 2021, 45, 101450. [Google Scholar] [CrossRef]
  26. Kaya, N.; Uzun, Z.Y. Investigation of effectiveness of pine cone biochar activated with KOH for methyl orange adsorption and CO2 capture. Biomass Convers. Biorefinery 2020, 11, 1067–1083. [Google Scholar] [CrossRef]
  27. Peres, C.B.; de Morais, L.C.; Resende, P.M.R. Carbon adsorption on waste biomass of passion fruit peel: A promising machine learning model for CO2 capture. J. CO2 Util. 2024, 80, 102680. [Google Scholar] [CrossRef]
  28. Faisal, M.; Pamungkas, A.Z.; Krisnandi, Y.K. Study of Amine Functionalized Mesoporous Carbon as CO2 Storage Materials. Processes 2021, 9, 456. [Google Scholar] [CrossRef]
  29. de Sousa, P.A.R.; Furtado, L.T.; Neto, J.L.L.; de Oliveira, F.M.; Siqueira, J.G.M.; Silva, L.F.; Coelho, L.M. Evaluation of the Adsorption Capacity of Banana Peel in the Removal of Emerging Contaminants present in Aqueous Media—Study based on Factorial Design. Braz. J. Anal. Chem. 2019, 6, 14–28. [Google Scholar] [CrossRef]
  30. Tahir, M.H.; Zhao, Z.; Ren, J.; Rasool, T.; Naqvi, S.R. Thermo-kinetics and gaseous product analysis of banana peel pyrolysis for its bioenergy potential. Biomass Bioenergy 2019, 122, 193–201. [Google Scholar] [CrossRef]
  31. Xiao, J.; Yuan, X.; Zhang, T.C.; Ouyang, L.; Yuan, S. Nitrogen-doped porous carbon for excellent CO2 capture: A novel method for preparation and performance evaluation. Sep. Purif. Technol. 2022, 298, 121602. [Google Scholar] [CrossRef]
  32. Xie, L.; Li, Q.; Demir, M.; Yu, Q.; Hu, X.; Jiang, Z.; Wang, L. Lotus seed pot-derived nitrogen enriched porous carbon for CO2 capture application. Colloids Surf. A Physicochem. Eng. Asp. 2022, 655, 130226. [Google Scholar] [CrossRef]
  33. Liu, S.-H.; Huang, Y.-Y. Valorization of coffee grounds to biochar-derived adsorbents for CO2 adsorption. J. Clean. Prod. 2018, 175, 354–360. [Google Scholar] [CrossRef]
  34. Wang, X.; Zeng, W.; Xin, C.; Kong, X.; Hu, X.; Guo, Q. The development of activated carbon from corncob for CO2 capture. RSC Adv. 2022, 12, 33069–33078. [Google Scholar] [CrossRef] [PubMed]
  35. Huang, G.-G.; Liu, Y.-F.; Wu, X.-X.; Cai, J.-J. Activated carbons prepared by the KOH activation of a hydrochar from garlic peel and their CO2 adsorption performance. New Carbon Mater. 2019, 34, 247–257. [Google Scholar] [CrossRef]
  36. Bai, J.; Huang, J.; Yu, Q.; Demir, M.; Kilic, M.; Altay, B.N.; Hu, X.; Wang, L. N-doped porous carbon derived from macadamia nut shell for CO2 adsorption. Fuel Process. Technol. 2023, 249, 107854. [Google Scholar] [CrossRef]
  37. Parshetti, G.K.; Chowdhury, S.; Balasubramanian, R. Biomass derived low-cost microporous adsorbents for efficient CO2 capture. Fuel 2015, 148, 246–254. [Google Scholar] [CrossRef]
  38. Du, J.; Chu, X.; Ren, F.; Zheng, S.; Shao, Z. Study on CO2 adsorption performance of biocarbon synthesized in situ from nitrogen-rich biomass pomelo peel. Fuel 2023, 352, 129163. [Google Scholar] [CrossRef]
  39. Sigiro, M. Natural biowaste of banana peel-derived porous carbon for in-vitro antibacterial activity toward Escherichia coli. Ain Shams Eng. J. 2021, 12, 4157–4165. [Google Scholar] [CrossRef]
  40. Tarigan, J.B.; Perangin-Angin, S.; Simanungkalit, S.R.; Zega, N.P.; Sitepu, E.K. Utilization of waste banana peels as heterogeneous catalysts in room-temperature biodiesel production using a homogenizer. RSC Adv. 2023, 13, 6217–6224. [Google Scholar] [CrossRef]
  41. Li, W.; Tu, W.; Cheng, J.; Yang, F.; Wang, X.; Li, L.; Shang, D.; Zhou, X.; Yu, C.; Yuan, A.; et al. Tuning N-doping thermal-process enables biomass-carbon surface modification for potential separation effect of CO2/CH4/N2. Sep. Purif. Technol. 2022, 282, 120001. [Google Scholar] [CrossRef]
  42. Serafin, J.; Ouzzine, M.; Cruz, O.F.; Sreńscek-Nazzal, J.; Gómez, I.C.; Azar, F.-Z.; Mafull, C.A.R.; Hotza, D.; Rambo, C.R. Conversion of fruit waste-derived biomass to highly microporous activated carbon for enhanced CO2 capture. Waste Manag. 2021, 136, 273–282. [Google Scholar] [CrossRef]
  43. Guo, X.; Zhang, G.; Wu, C.; Liu, J.; Li, G.; Zhao, Y.; Wang, Y.; Xu, Y. A cost-effective synthesis of heteroatom-doped porous carbon by sulfur-containing waste liquid treatment: As a promising adsorbent for CO2 capture. J. Environ. Chem. Eng. 2021, 9, 105165. [Google Scholar] [CrossRef]
  44. Mohamed, G.R.; Mahmoud, R.K.; Shaban, M.; Fahim, I.S.; El-Salam, H.M.A.; Mahmoud, H.M. Towards a circular economy: Valorization of banana peels by developing bio-composites thermal insulators. Sci. Rep. 2023, 13, 12756. [Google Scholar] [CrossRef]
  45. Peres, C.B.; Rosa, A.H.; de Morais, L.C. CO2 adsorption of bagasse waste feedstock using thermogravimetric analyses. J. Therm. Anal. Calorim. 2021, 147, 5973–5984. [Google Scholar] [CrossRef]
  46. Hussien, N.A.; Al Malki, J.S.; Al Harthy, F.A.R.; Mazi, A.W.; Al Shadadi, J.A.A. Sustainable Eco-Friendly Synthesis of Zinc Oxide Nanoparticles Using Banana Peel and Date Seed Extracts, Characterization, and Cytotoxicity Evaluation. Sustainability 2023, 15, 9864. [Google Scholar] [CrossRef]
  47. Maia, A.A.D.; de Morais, L.C. Kinetic parameters of red pepper waste as biomass to solid biofuel. Bioresour. Technol. 2016, 204, 157–163. [Google Scholar] [CrossRef] [PubMed]
  48. Morais, L.C.; Maia, A.A.D.; Guandique, M.E.G.; Rosa, A.H. Pyrolysis and combustion of sugarcane bagasse. J. Therm. Anal. Calorim. 2017, 129, 1813–1822. [Google Scholar] [CrossRef]
  49. Balogun, A.I.; Padmanabhan, E.; Abdulkareem, F.A.; Gebretsadik, H.T.; Wilfred, C.D.; Soleimani, H.; Viswanathan, P.M.; Wee, B.S.; Yusuf, J.Y. Optimization of CO2 Sorption onto Spent Shale with Diethylenetriamine (DETA) and Ethylenediamine (EDA). Materials 2022, 15, 8293. [Google Scholar] [CrossRef]
  50. Correia, L.B.; Fiuza, R.A.; de Andrade, R.C.; Andrade, H.M.C. CO2 capture on activated carbons derived from mango fruit (Mangifera indica L.) seed shells. J. Therm. Anal. Calorim. 2018, 131, 579–586. [Google Scholar] [CrossRef]
  51. Rehman, A.; Nazir, G.; Rhee, K.Y.; Park, S.-J. Valorization of orange peel waste to tunable heteroatom-doped hydrochar-derived microporous carbons for selective CO2 adsorption and separation. Sci. Total. Environ. 2022, 849, 157805. [Google Scholar] [CrossRef] [PubMed]
  52. Meriatna; Husin, H.; Riza, M.; Faisal, M.; Ahmadi; Sulastri. Biodiesel production using waste banana peel as renewable base catalyst. Mater. Today Proc. 2023, 87, 214–217. [Google Scholar] [CrossRef]
  53. Kobo, G.K.; Kaseke, T.; Fawole, O.A. Micro-Encapsulation of Phytochemicals in Passion Fruit Peel Waste Generated on an Organic Farm: Effect of Carriers on the Quality of Encapsulated Powders and Potential for Value-Addition. Antioxidants 2022, 11, 1579. [Google Scholar] [CrossRef]
  54. Tabarkhoon, F.; Abolghasemi, H.; Rashidi, A.; Bazmi, M.; Alivand, M.S.; Tabarkhoon, F.; Farahani, M.V.; Esrafili, M.D. Synthesis of novel and tunable Micro-Mesoporous carbon nitrides for Ultra-High CO2 and H2S capture. Chem. Eng. J. 2023, 456, 140973. [Google Scholar] [CrossRef]
  55. Ma, X.; Su, C.; Liu, B.; Wu, Q.; Zhou, K.; Zeng, Z.; Li, L. Heteroatom-doped porous carbons exhibit superior CO2 capture and CO2/N2 selectivity: Understanding the contribution of functional groups and pore structure. Sep. Purif. Technol. 2021, 259, 118065. [Google Scholar] [CrossRef]
Figure 1. CO2 capture of the samples referring to the preparation method.
Cleantechnol 07 00025 g001
Figure 2. CO2 capture of the samples referring to the impregnation rate.
Cleantechnol 07 00025 g002
Figure 3. CO2 capture of the samples referring to carbonization temperature.
Cleantechnol 07 00025 g003
Figure 4. CO2 adsorption–desorption isotherms of FACBP-4600 at 0 °C and 1 bar.
Cleantechnol 07 00025 g004
Figure 5. SEM micrographs of BP ×2000 (a), BP ×10,000 (b), FACBP-4600 ×2000 (c), and FACBP-4600 ×10,000 (d).
Cleantechnol 07 00025 g005
Figure 6. FTIR spectra of BP and FACBP-4600.
Cleantechnol 07 00025 g006
Figure 7. TG (a) and DTG (b) curves at a heating ratio of 10 °C/min in a nitrogen atmosphere.
Cleantechnol 07 00025 g007
Figure 8. XRD diffractograms of the BP and FACBP-4600 samples.
Cleantechnol 07 00025 g008
Figure 9. XPS analysis of the BP (a) and FACBP-4600 (b) samples, focusing on high-resolution C1s and N1s spectra.
Cleantechnol 07 00025 g009
Table 1. Textural properties of BP and FACBPs.
Sample Textural Properties
CO2 PurgeN2 Purge
SBET a (m2/g)Pore Size b (Å)Vpc (cm3/g)Vmicro d (cm3/g)SBET a (m2/g)Vp c (cm3/g)Vmicro d (cm3/g)
BP0.024.100<0.011.68<0.01<0.01
FACBP-157.853.130.020.03<0.01<0.01<0.01
FACBP-2W15.493.130.020<0.01<0.01<0.01
FACBP-3311.492.99<0.010<0.01<0.01<0.01
FACBP-3547.832.860.020.03<0.01<0.01<0.01
FACBP-460071.122.990.020.04<0.01<0.01<0.01
FACBP-470041.612.990.010.0256–63.< 0.010.03
a Surface area was obtained adopting the BET method at P/P0 = 0.005–0.05. b Pore size was obtained by the DFT method. c Total pore volume at P/P0 = 0.99. d Micropore volume calculated using the DR method.
Table 2. Chemical composition of BP and FACBP-4600.
Samples Chemical Composition (%)
OCHN
BP49.942~616.191.30
FACBP-460051.3841.266.091.27
Table 3. Comparison of CO2 uptake on activated carbons from carbonaceous materials at 1 bar.
Carbonaceous PrecursorCO2 Uptake (mmol/g) at 0 °CRef.
Activated coal char3.7Quan et al. [21]
LOTUS5.72Xie et al. [32]
Macadamia nut shell6.61Bai et al. [36]
Palm fruit bunch1.3Parshetti et al. [37]
Pomelo?4.83Du et al. [38]
banana1.69This work
Table 4. EDX analyses of the BP and FACBP-4600 samples.
SamplesC (at. %)O (at. %)K (at. %)Cl (at. %)Si (at. %)
BP63.9075.2.310.780.14
FACBP-460055:2434 (69%)4.681.851.48
Table 5. Main chemical compounds found on the surfaces of BP and FACBP-4600.
SamplesC (at. %)O (at. %)N (at. %)K (at. %)Si (at. %)
BP88.8100.65-0.34
FACBP-460056–7626.543.343.045.96
Disclaimer/Publisher’s Note: The statements, opinions and data contained in all publications are solely those of the individual author(s) and contributor(s) and not of MDPI and/or the editor(s). MDPI and/or the editor(s) disclaim responsibility for any injury to people or property resulting from any ideas, methods, instructions or products referred to in the content.

