Article

Recycling-Oriented Characterization of Space Waste Through Clean Hyperspectral Imaging Technology in a Circular Economy Context

1
Department of Chemical Engineering, Materials and Environment, Sapienza University of Rome, 00184 Rome, Italy
2
Department of Computer, Control and Management Engineering, Sapienza University of Rome, 00185 Rome, Italy
*
Author to whom correspondence should be addressed.
Clean Technol. 2025, 7(1), 26; https://doi.org/10.3390/cleantechnol7010026
Submission received: 26 November 2024 / Revised: 20 February 2025 / Accepted: 6 March 2025 / Published: 14 March 2025

Abstract

:
Waste management is one of the key areas where circular models should be promoted, as it plays a crucial role in minimizing environmental impact and conserving resources. Effective material identification and classification are essential for optimizing recycling processes and selecting the appropriate production equipment. Proper sorting of materials enhances both the efficiency and sustainability of recycling systems. The proposed study explores the potential of using a cost-effective strategy based on hyperspectral imaging (HSI) to classify space waste products, an emerging challenge in waste management. Specifically, it investigates the use of HSI sensors operating in the near-infrared range to detect and identify materials for sorting and classification. Analyses are focused on textile and plastic materials. The results show promising potential for further research, suggesting that the HSI approach is capable of effectively identifying and classifying various categories of materials. The predicted images achieve exceptional sensitivity and specificity, ranging from 0.989 to 1.000 and 0.995 to 1.000, respectively. Using cost-effective, non-invasive HSI technology could offer a significant improvement over traditional methods of waste classification, particularly in the challenging context of space operations. The implications of this work identify how technology enables the development of circular models geared toward sustainable development hence proper classification and distinction of materials as they allow for better material recovery and end-of-life management, ultimately contributing to more efficient recycling, waste valorization, and sustainable development practices.

1. Introduction

The circular economy theme is growing rapidly [1] and needs to be evaluated to identify solutions that do not foster rebound phenomena [2]. Circular models are becoming increasingly important, evaluating different types of materials. The European situation appears to be very fragmented [3]; several studies analyze the performance of European countries [4,5,6] and it is crucial to identify pragmatic solutions based on advanced technologies to minimize the use of landfill by promoting sustainable community models [7]. In this way, the topic of the sustainable development goals (SDGs) is crucial in the literature, and it is useful to reduce disparities in the distribution of funds at the territorial level to pursue these goals. The topic of waste management projected toward the circular economy concerns a multiplicity of resources such as municipal solid waste [8], construction and demolition waste [9], end-of-life vehicles [10], fashion [11], food [12] and e-waste [13]. The issue of waste management is one of the most relevant areas to foster circular models [14], where research and technology can play a key role [15,16]. In this framework, increasing attention is given to circular models applied to the space sector [17] considering the growing number of orbital debris [18]. In addition, space technology supports a range of SDGs [19,20].
Worldwide space agencies are increasingly prioritizing the recycling of plastics and other materials in space as a central strategy to reduce waste, repurposing materials that would otherwise be discarded [21,22,23]. Within the realm of space sustainability, the lack of comprehensive legislation and guidelines has afforded the space sector the liberty to conduct operations without being held accountable for negligent behaviors, thereby fostering a climate where irresponsible actions can occur unchecked, potentially jeopardizing both the space environment and our planet [17]. As a result, orbits crowded with space waste could become urgent issues posing serious risks to future space accessibility [24]. The increasing amount of waste in orbit makes the need for circular economy models mandatory [18]. For recycling process design and implementation, to be appropriately customized to the mission requirements, material categorization is essential [25]. Material classification goes beyond mere preliminary work; it serves as the foundation for tailoring recycling processes to meet the specific requirements of space missions precisely [26,27]. Within this framework, material classification assumes paramount importance, acting as a prerequisite for selecting specialized equipment such as shredders, classifiers, separators, and extruders [28,29]. During space missions, a wide variety of waste products, ranging from metals and plastics to foams, packing materials, liquids, and chemicals, is inevitably generated [30,31]. One of the biggest challenges to space waste mitigation and recycling initiatives is achieving quick, accurate, economical, non-invasive, and non-destructive analysis of various solid waste types and end-of-life materials. Furthermore, these techniques must be adaptable to handle the wide array of space debris, including composite materials and metal fragments, without requiring any sample preparation. This is a key advantage in space applications, where material processing is highly constrained. Additionally, automating the identification and sorting of waste items enhances efficiency in the sorting process, resulting in recycled materials of superior purity [32]. One possible response to these requirements could be the implementation of a hyperspectral imaging (HSI) system. HSI has become a more and more popular technique in the waste sector in the last few decades, thanks to its capability to distinguish between various materials using their distinct spectral fingerprints [33,34,35,36]. The ability of vibrational spectroscopy (such as hyperspectral imaging) to assess circular solutions has been demonstrated in a number of studies [37]. With the aid of digital tools [38], predictive modeling [39] is made possible by the use of data-driven insights, with the goal of improving robustness in industrial material identification [40]. As a non-invasive and non-destructive analytical technique, HSI captures spectral information across a wide range of the electromagnetic spectrum, generating a hyperspectral image cube without the need for any prior sample treatment [41,42,43]. This makes it particularly suitable for space waste management, where rapid and reliable material identification is crucial. Its application allows for advantages in terms of circular models [44,45]. This technique distinguishes between materials by their distinct reflectance spectra, which reveal their chemical makeup through certain bonds (such as O-H, N-H, C-H, and S-H) [46,47,48]. Each pixel in this hypercube corresponds to a whole spectrum, resulting in a three-dimensional dataset that blends one spectral dimension with two spatial dimensions. Consequently, hyperspectral pictures are datasets that include the full spectrum at every point in a spatial array. The application of HSI in the waste management sector has a significant impact on the efficacy of different circularity process stages, including material selection, component identification, and quality control of treatment procedures. Additionally, automating waste material identification and selection improves the efficiency of the sorting process and yields recycled materials with higher purity. This optimization not only centers on recovering and reusing high-quality materials and products but also entails utilizing sensing architectures with minimal environmental impact [49]. Employing such systems for both “off-line” and “at-line” analyses eliminates the necessity for chemicals. Additionally, these analyses can be carried out “in-line” (at the laboratory scale) and “on-line” (at the processing line scale), highlighting a holistic and sustainable approach and making recycling practices profitable to adopt. Prioritizing reuse and recycling not only strikes a practical balance between financial considerations and technological advancements but also opens intriguing possibilities for integrating recycling processes directly into the space environment. The substitution of traditional manual sorting processes with HSI allows us to reduce labor costs and increase throughput rates. This transition not only holds promise for cost savings and efficiency improvements but also opens avenues for enhanced accuracy and consistency in material sorting. By adopting the concept of direct recycling and reuse within the context of space missions, we not only address the pressing issue of waste management but also establish the foundation for sustainable practices that are compatible with the difficulties presented by extraterrestrial habitats. Another study investigated a cost-effective and environmentally friendly method of using hyperspectral imaging (HSI), concentrating on two spectral ranges, near-infrared (NIR) and shortwave infrared (SWIR), to create a classification model for precisely identifying and classifying space waste materials for recycling [50]. Since the NIR spectral range yielded the most promising results, the previous study highlighted opportunities for improvement, particularly in addressing more complex waste categories within that spectral range. The current research addresses this gap by employing a cascade detection approach based on Partial Least Squares Discriminant Analysis (PLS-DA). This enhanced model is designed to classify a broader range of sample categories, particularly those within the textile and plastic classes, offering a more comprehensive solution for space waste recycling. This refined approach strengthens the classification model accuracy and applicability to more diverse waste materials to enhance waste valorization.

2. Materials and Methods

We initially proceed to describe the samples and experimental set-up (Section 2.1) and then describe the hyperspectral imaging system (Section 2.2).

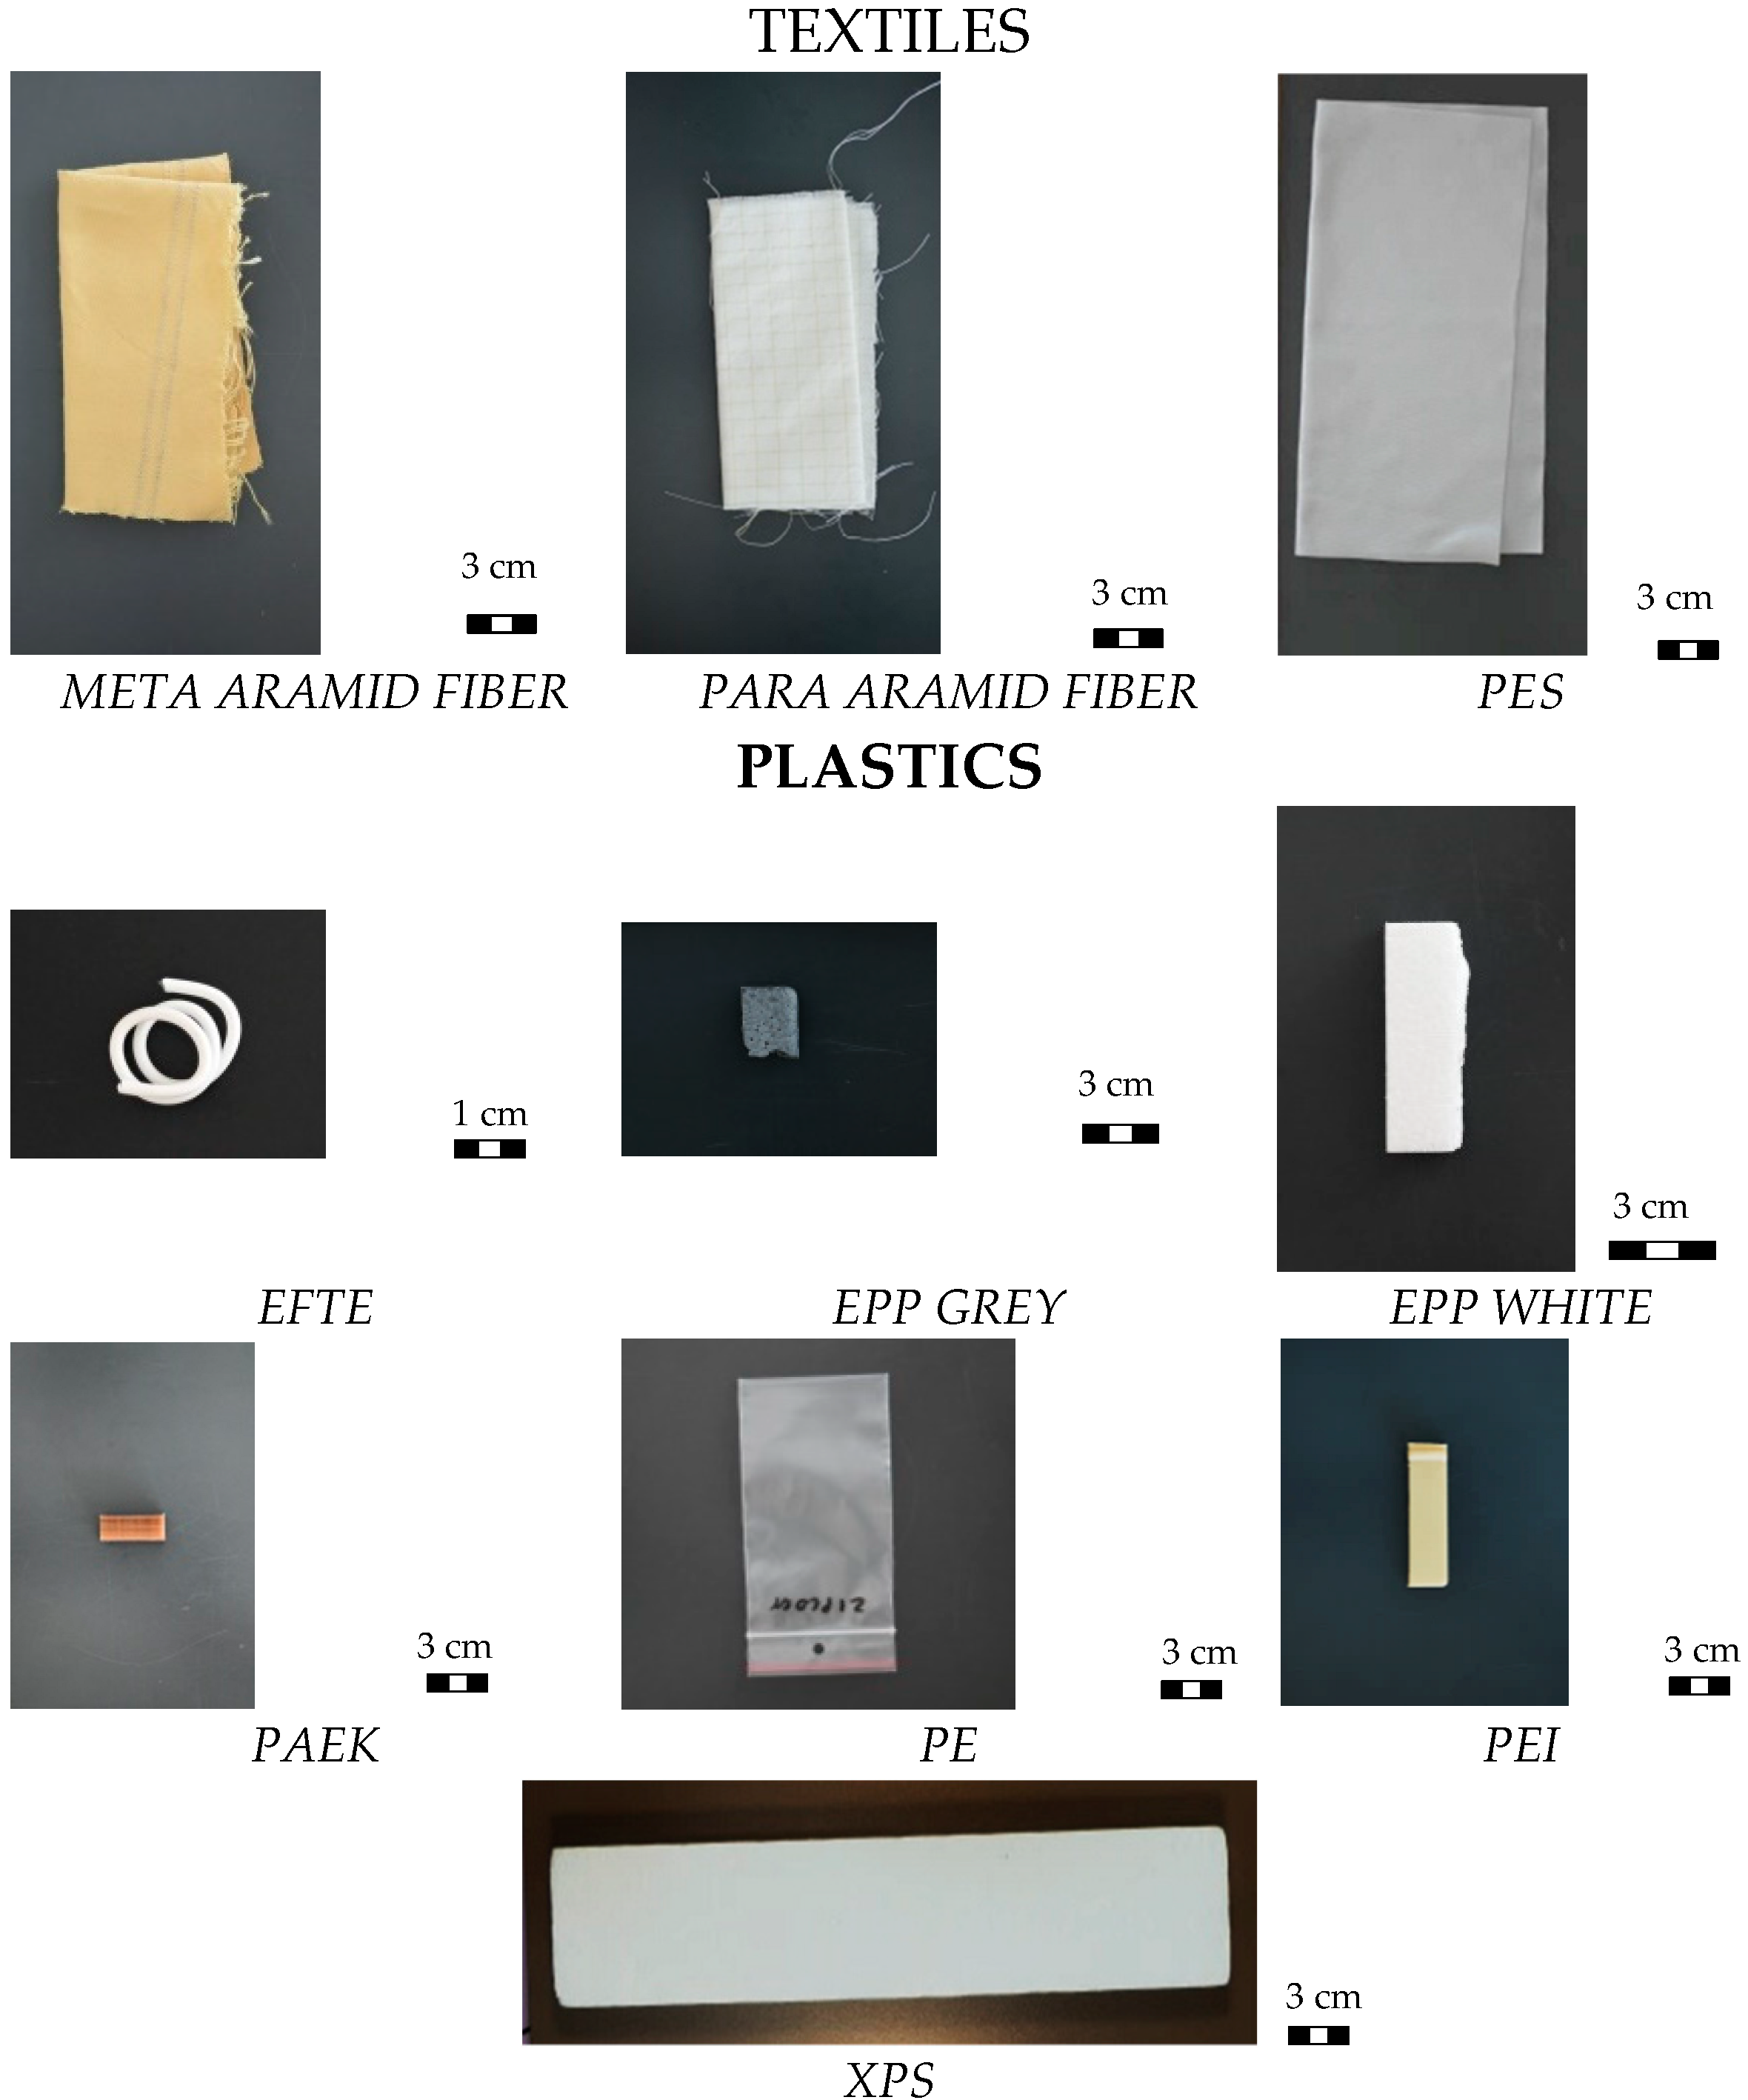
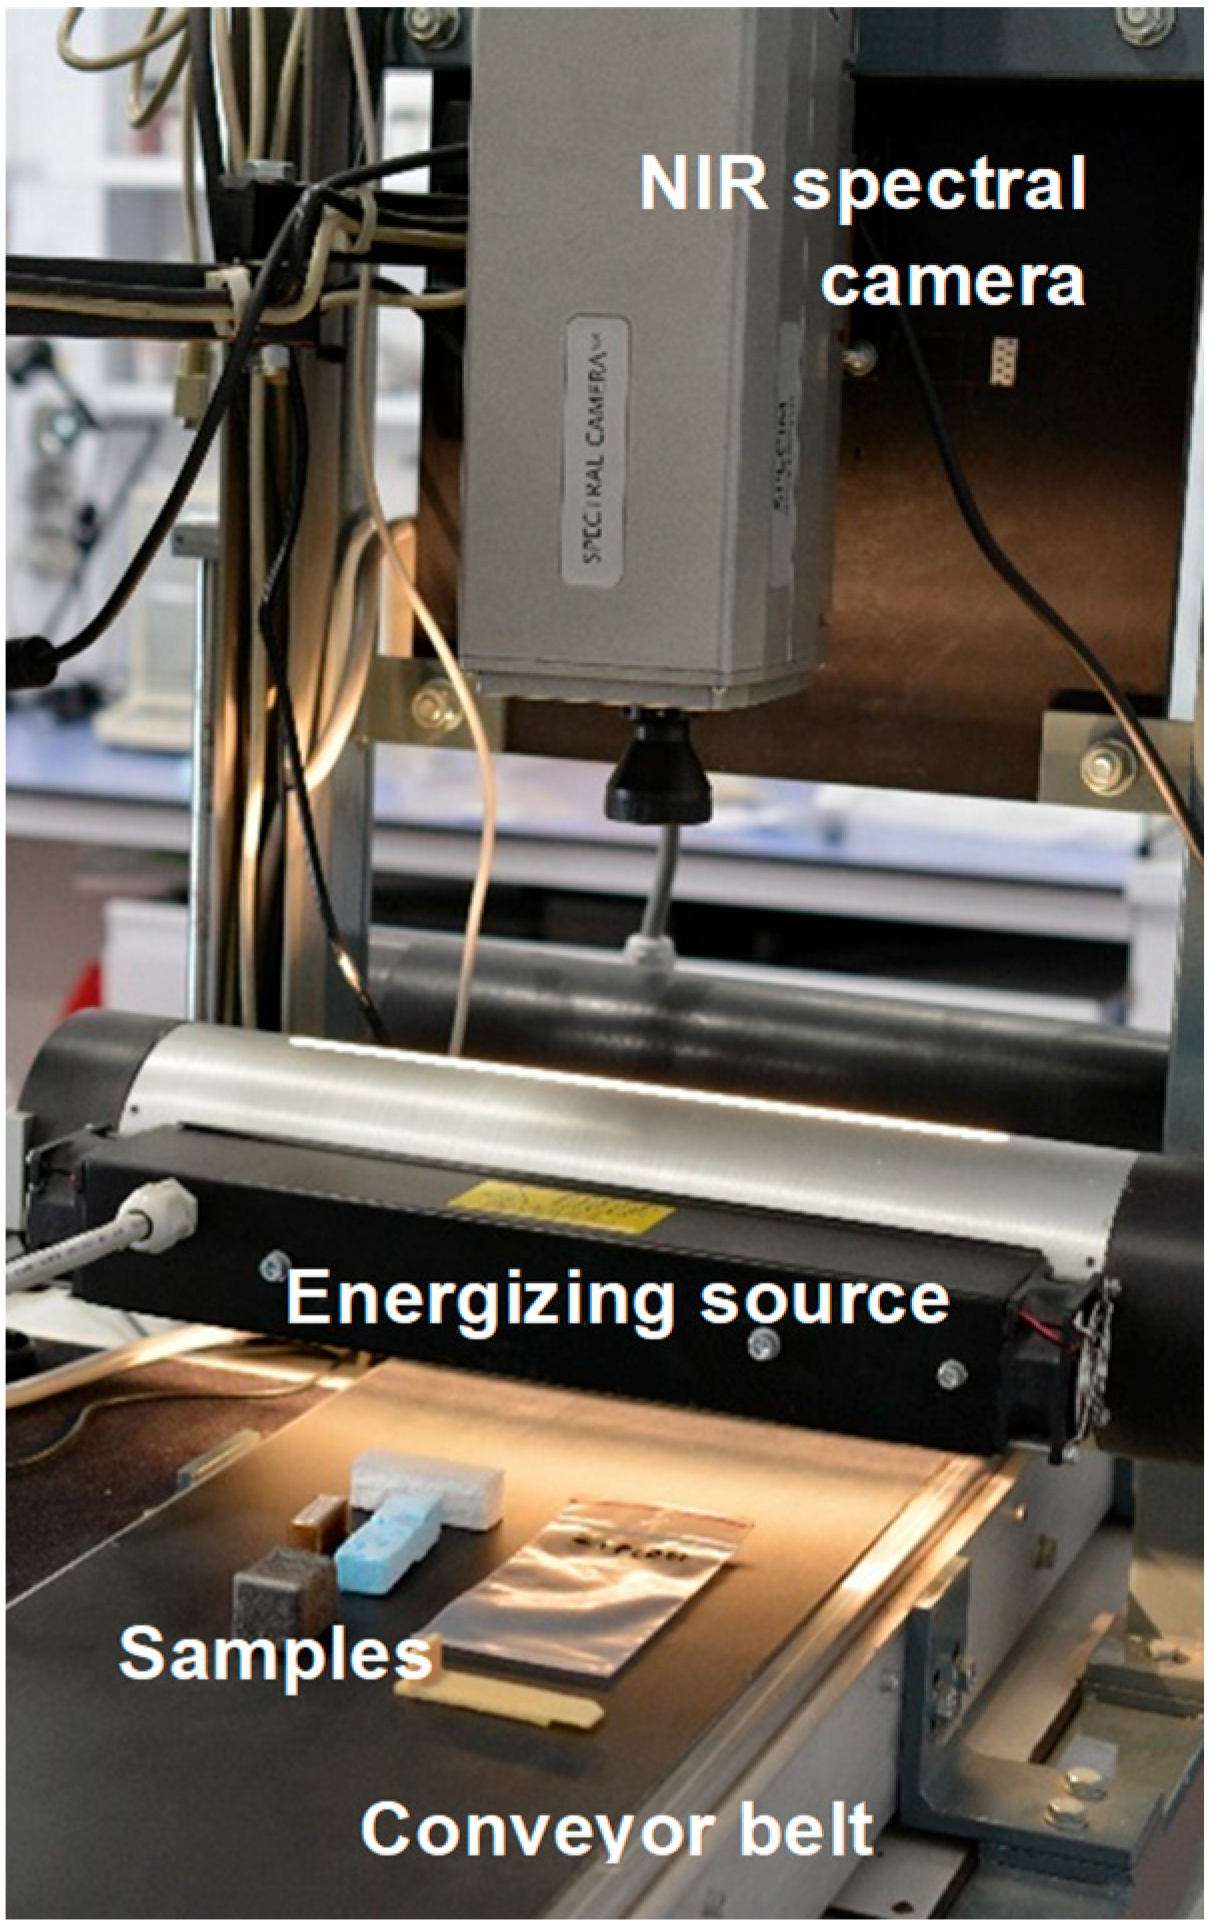
2.1. Samples and Experimental Set-Up

Analyses were performed on a set of samples which included some components related to the most popular material categories in space applications such as foam, polymers, and technical textiles that could end up as space waste when their useful lives are over. The samples analyzed were supplied by a leading aerospace company and consist of components currently used in spacecraft. Figure 1 illustrates a representative example of the items utilized for the analysis. Ten hyperspectral images were acquired, each representing a distinct sample. Regions Of Interest (ROIs) were identified within each image, and the respective polymer class was assigned to them. The resulting spectra from these ROIs were combined into a single dataset (i.e., training dataset), which was then utilized to train the recognition/classification model. A new hyperspectral image containing the ten categories of samples under investigation was then acquired to validate the built classification models (Figure 2).
The HSI-based model classifications were carried out using various experimental set-ups:
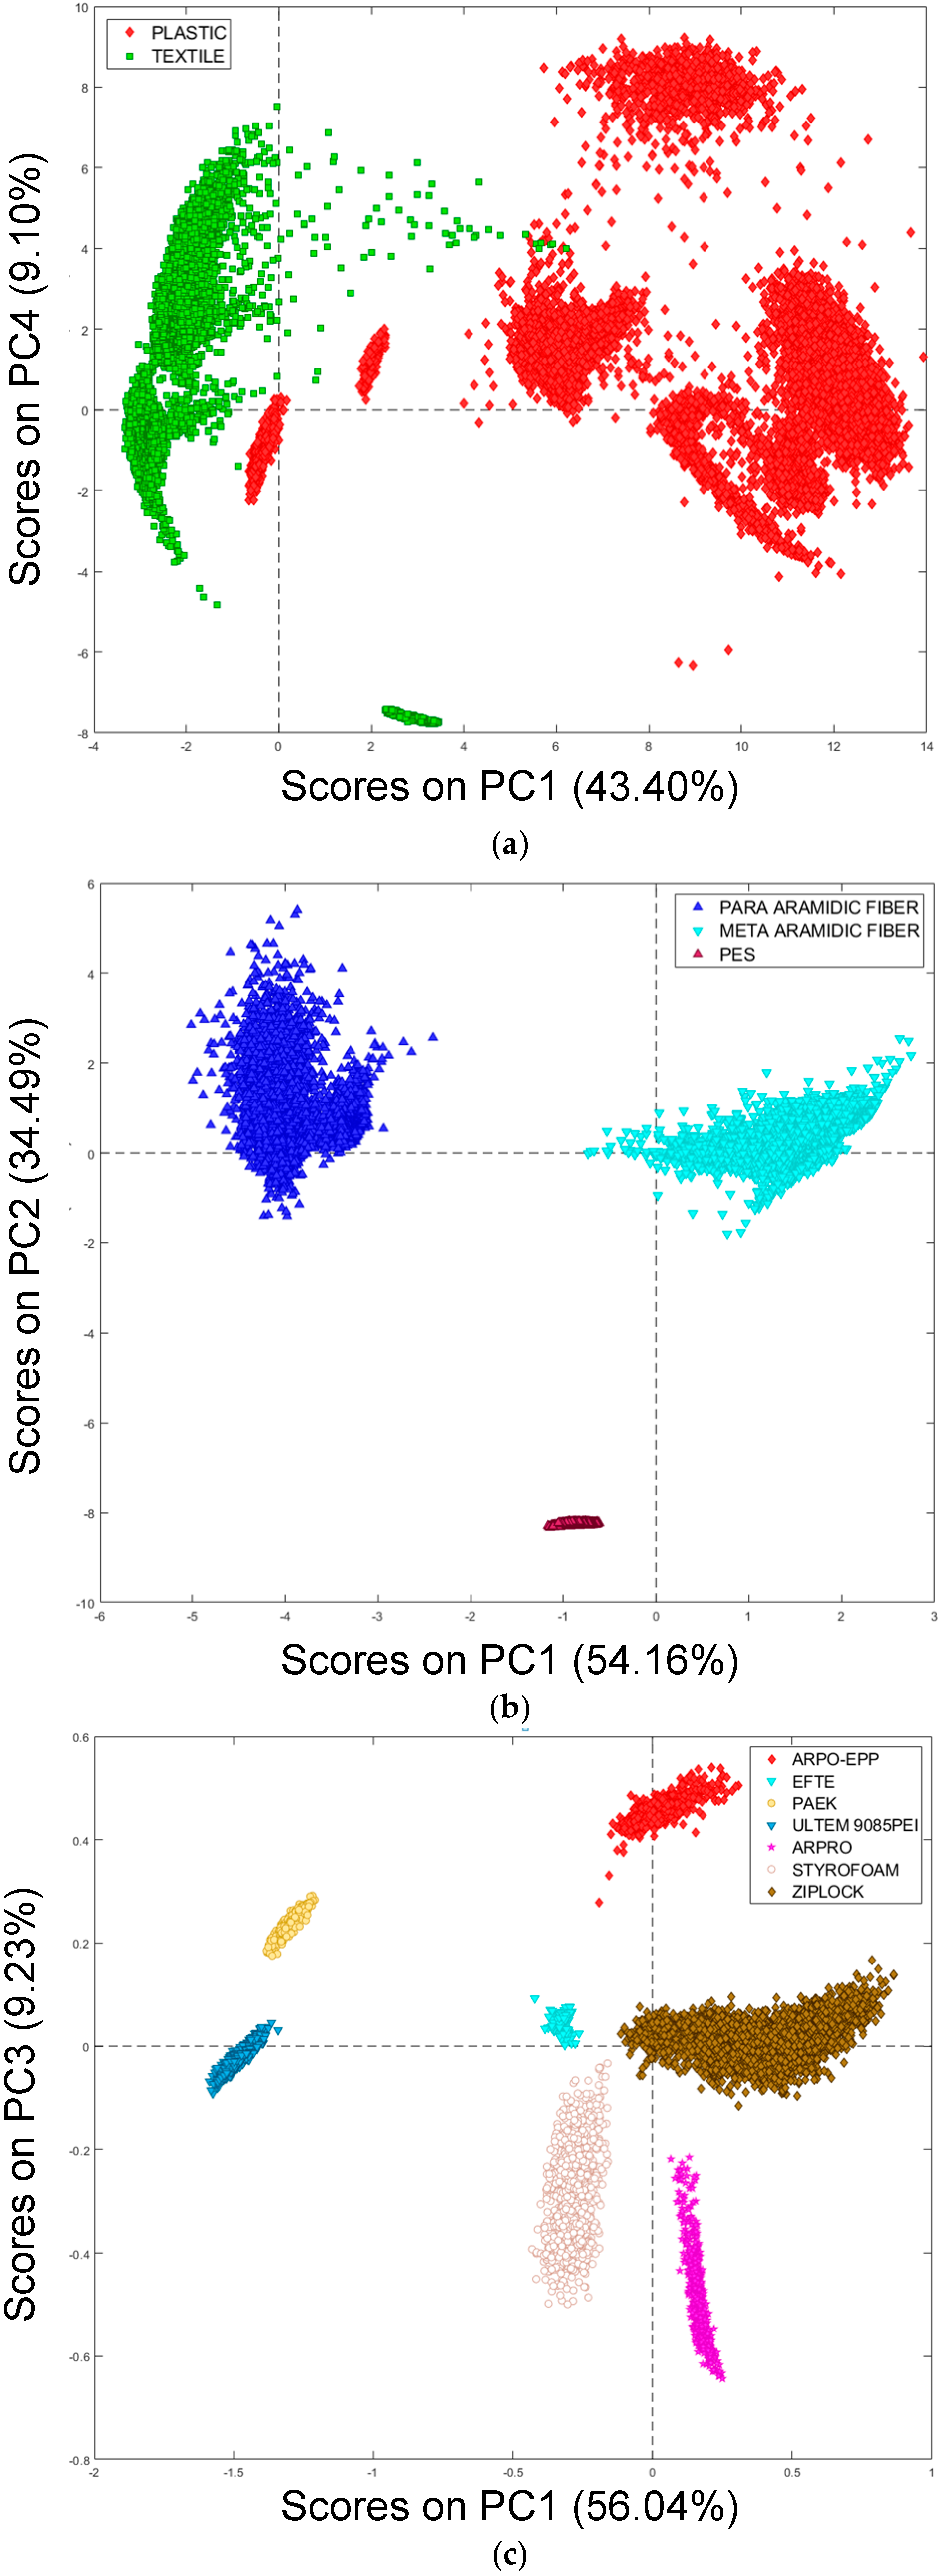
  • Set-up No. 1—all the samples were used to perform the analysis to recognize “plastic particles” from “textile particles”;
  • Set-up No. 2—a classification model was built to recognize textile categories (i.e., meta-aramid fiber, para-aramid fiber, knitted textured polyester—PES) in the classified textile particles in set-up No. 1;
  • Set-up No. 3—a classification model was built to recognize polymer type (i.e., ethylenetetrafluoroethylene—EFTE; expanded polypropylene—EPP; polyaryletherketone—PAEK; polyethylene—PE; polyetherimide—PEI; extruded polystyrene—XPS) in the classified plastic particles in set-up No. 1.

2.2. Hyperspectral Imaging System

The hyperspectral images were obtained using the NIR Spectral CameraTM (Specim, Finland) with an ImSpector N17ETM (SPECIM Ltd., Finland) imaging spectrograph operating in the NIR spectral range (1000–1700 nm). A specially designed HSI platform (DV srl, Padova, Italy) was used for spectrum management and re-recording. It was intended for acquisition, collection, and initial spectral processing (Figure 3). Each pixel along the scanned line has its spectral information recorded by the system using a push-broom-style line scan camera. The Raw Materials Engineering Laboratory of Sapienza, University of Rome in Latina, is where the HSI platform is located.
A temperature-stabilized InGaAs photodiode array (320 × 240 pixels) with a 195 mm field of view, 3.3 nm spectral sampling per pixel, and 5 nm spectral resolution is part of the system’s image spectrograph. To create a comprehensive spectral dataset, this HSI system works by sequentially scanning lines. The samples are placed on a conveyor belt that is 26 cm wide and 160 cm long. The belt can move at rates that can be adjusted from 0 mm/s to 50 mm/s. The energy needed for hyperspectral imaging is provided by a diffused light cylinder with five halogen lamps, which ensures a steady spectrum signal in the near-infrared wavelength range. By using a standardized ceramic material to measure a white reference image and capturing a dark image with the camera lens entirely closed, the system was calibrated before the hyperspectral data were obtained. By utilizing Spectral ScannerTM, a specialized acquisition program capable of managing several units, performing acquisitions, and collecting spectra, HSI images were obtained.

3. Data Analysis

PLS_Toolbox (Version 9.3, Eigenvector Research, Inc., Wenatchee, WA, USA) in the MatlabTM environment (version 9.14) was used to analyze the data. To highlight variations in the spectra, preliminary pre-processing methods were used. Additionally, chemometric techniques such as Principal Component Analysis (PCA) (Section 3.1) and Partial Least Square Discriminant Analysis (PLS-DA) (Section 3.2) were applied. PCA was used to establish classes, investigate data, and identify the best techniques for the ensuing classification modeling. Finally, classification models were constructed and validated using PLS-DA. A method of cascade detection was used. More specifically, in the first step, a PLS-DA model was developed to distinguish textiles from plastics, and in the second step, the various textile and polymer categories were identified (Figure 4).

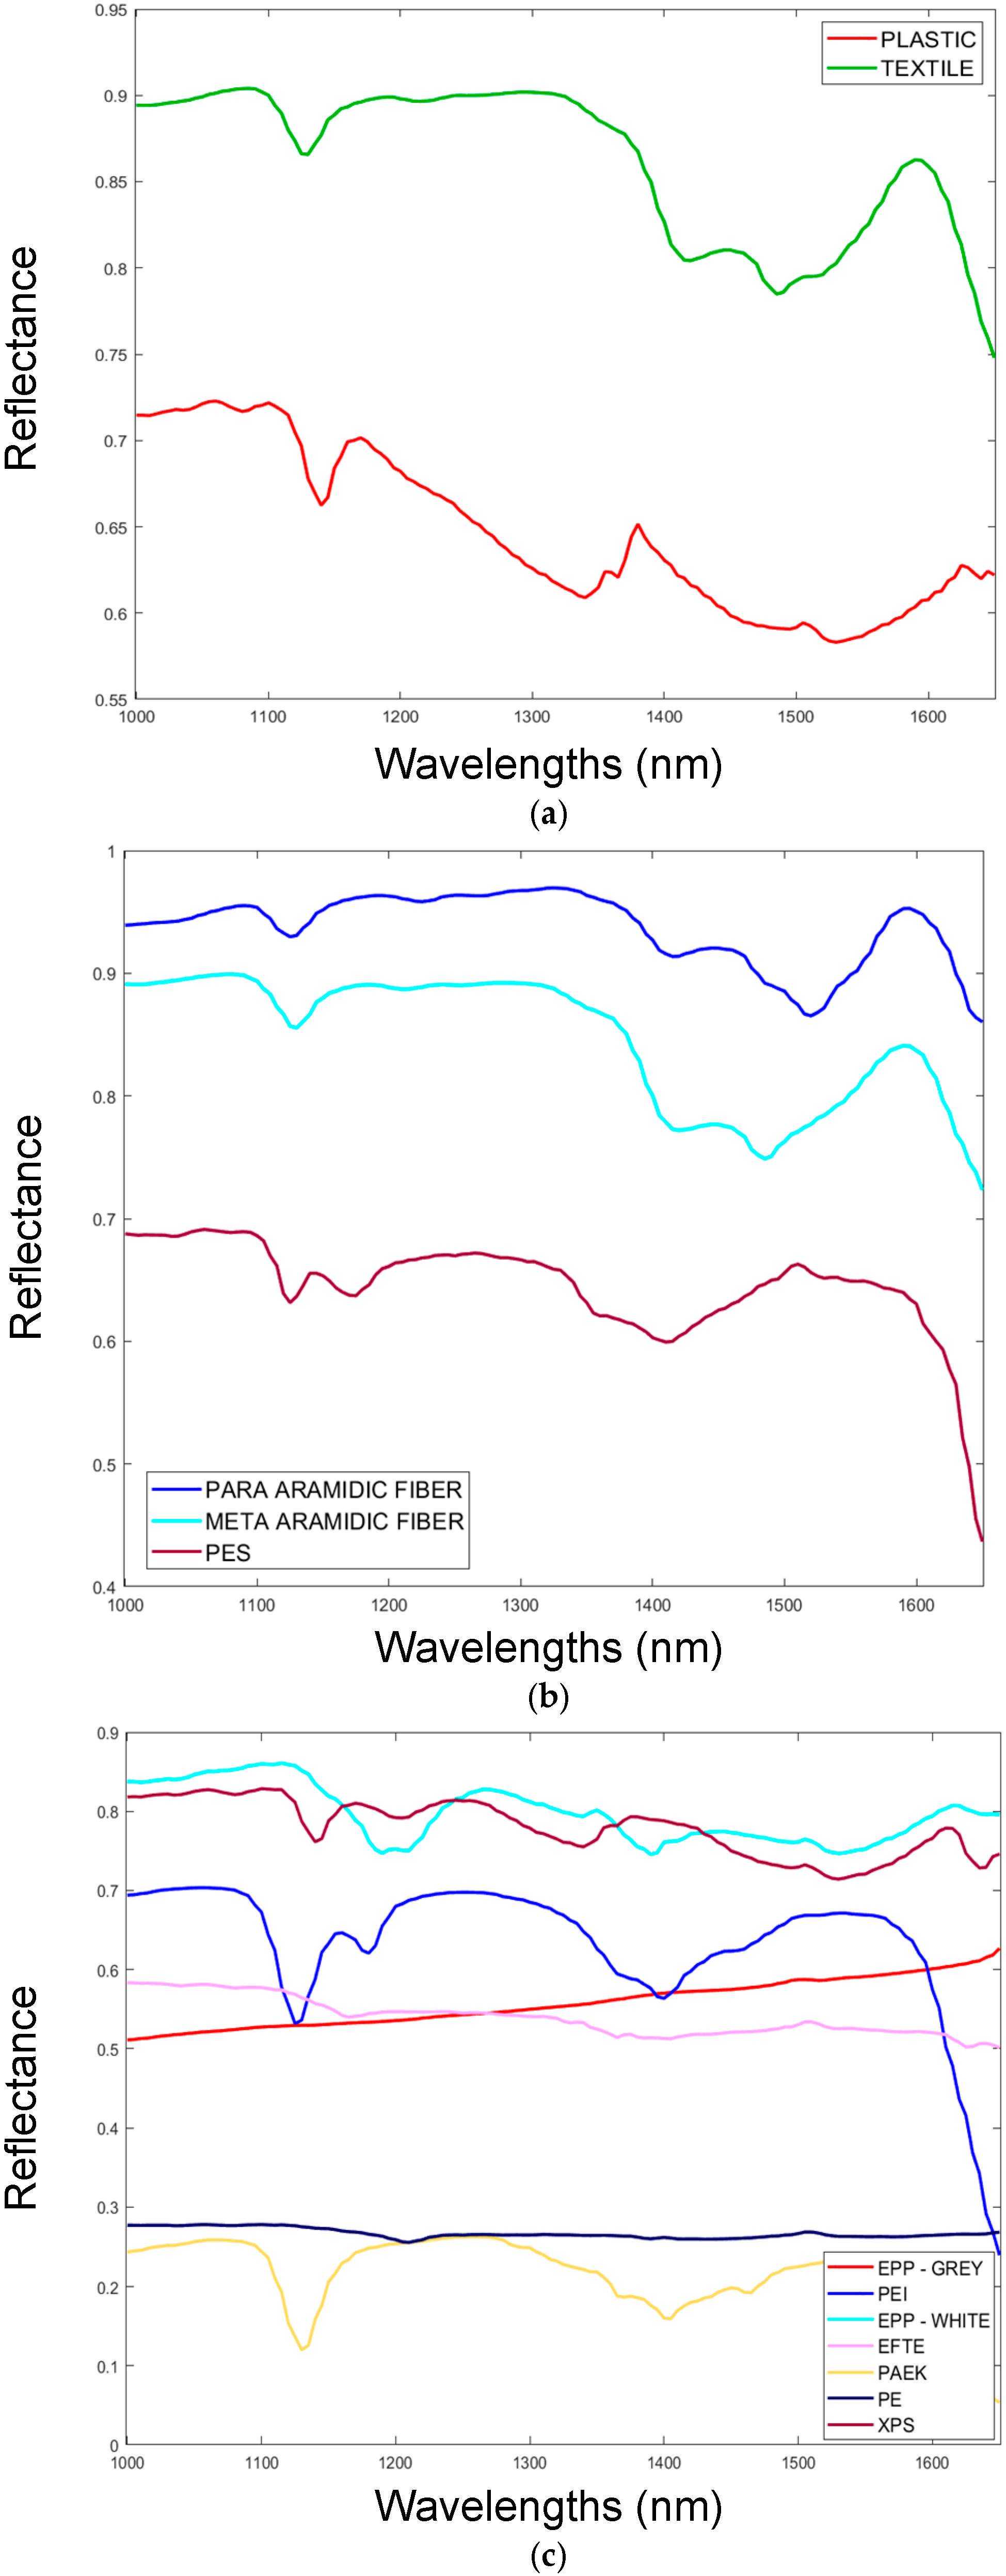
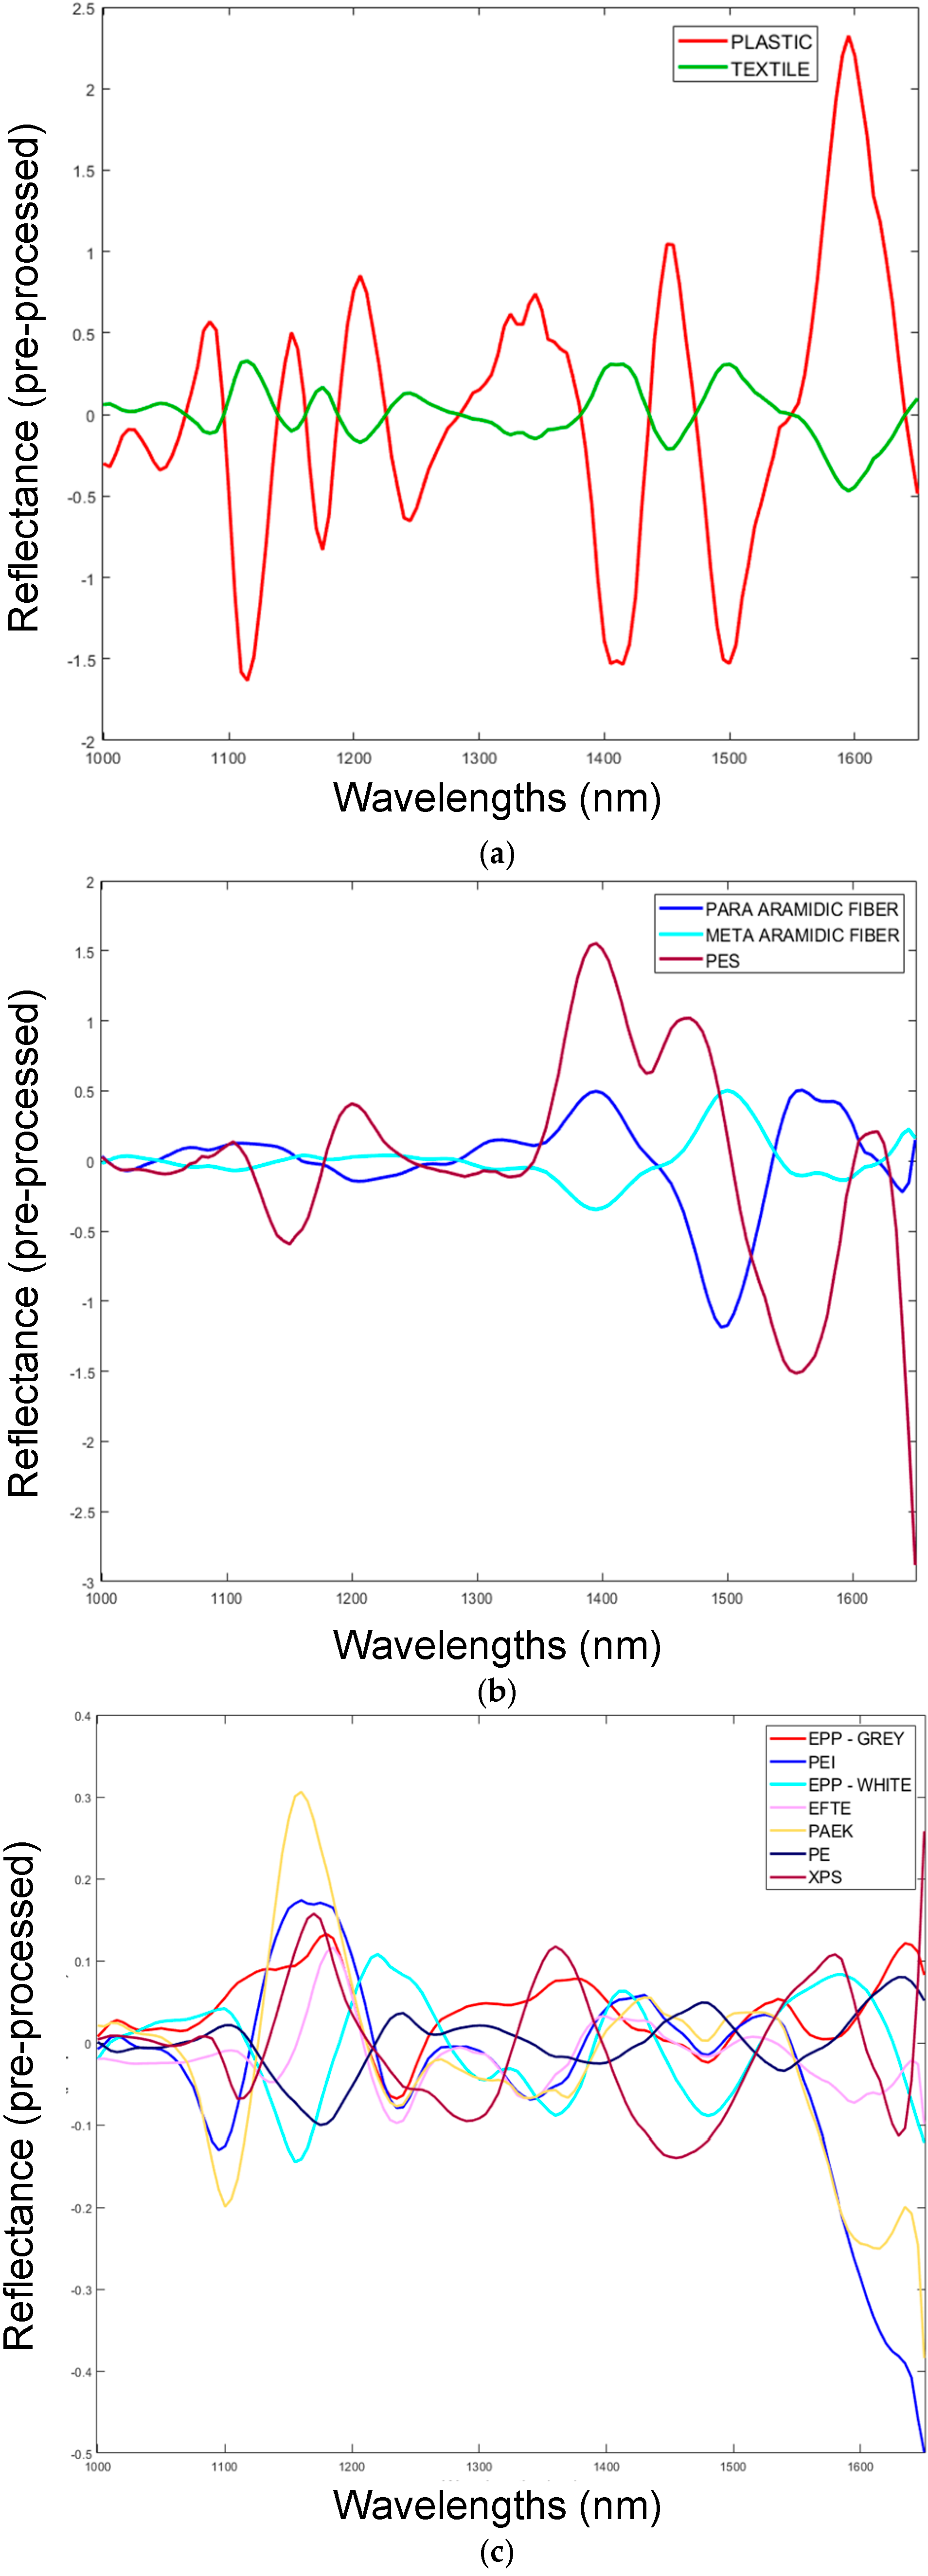
3.1. Spectrum Pre-Processing and Principal Component Analysis (PCA)

A combination of pre-processing techniques was applied to highlight the differences between the spectra. In more detail, Standard Normal Variate (SNV), Derivative, and Mean Center (MC) were used in different combinations for each set-up [51]. The SNV algorithm represents a weighted normalization method, whereas Derivative proves to be a valuable technique to remove baseline signals from samples. One of the most widely used pre-processing methods is MC, which determines the mean of each column and subtracts it from the value of the associated column. Each row in mean-centered data shows the difference between the original data matrix’s average sample and itself. PCA is a mathematical technique that aims to reduce the dimensionality of a dataset while preserving the essential structure and relationships within the data [52]. It achieves this by representing the original data matrix as the product of two smaller matrices, typically referred to as the score and loading matrices. These matrices capture the underlying patterns and variations present in the data, allowing for a simplified representation that retains the most significant information. By extracting these essential features, PCA enables a more concise and interpretable analysis of complex datasets, facilitating tasks such as data visualization, noise reduction, and pattern recognition. PCA facilitates data compression by reducing the dimensionality of the dataset through the projection of samples into a lower-dimensional subspace. This subspace is characterized by new axes known as principal components (PCs), which are aligned with the directions of maximum data variance. The distribution of samples within this PC space serves as an indication of their similarities and differences: a greater concentration of samples implies similar characteristics/features.

3.2. PLS-DA-Based Cascade Detection

PLS-DA is a supervised recognition technique used for building prediction models that can classify data into predefined groups [53]. It combines the regression features of partial least squares with the discriminant capabilities of classification methods. Being a supervised method, PLS-DA requires prior knowledge of the data: it builds a predictive model by utilizing samples from known classes to classify unknown samples containing the same substances as those in the reference dataset. When applied to hyperspectral images, PLS-DA generates predictive maps where a distinct color represents each group, and each pixel is assigned to a specific class. Three different classification models were built in this study. The same algorithms used for data pre-processing were also applied during the construction of the PLS-DA model.

4. Results

Starting from the ROIs selected in each hyperspectral image, corresponding to different sample particles, the training dataset was constructed to establish three distinct classification set-ups:
  • Set-up No. 1: textile and polymer recognition;
  • Set-up No. 2: textile recognition;
  • Set-up No. 3: polymer recognition.
The raw spectral data (Figure 5) were pre-processed (Figure 6) to enhance differences between samples and reduce interference from instrument noise, light scattering, and other physical phenomena affecting the signals. The analysis of PCA score plots for each experimental set-up enabled the identification of pixel clusters based on their spectral signatures, which are closely tied to the chemical composition of the materials. To better visualize the pixel clustering, various combinations of principal components (PCs) for each set-up are presented in Figure 7. Specifically, Figure 7 shows score plots of PC1 vs. PC4 for the first set-up, PC1 vs. PC2 for the second set-up, and PC1 vs. PC3 for the third set-up. Concerning set-up No. 1, PC1 and PC4 accounted for 43.40% and 9.10% of the total variance, respectively. In set-up No. 2, PC1 and PC2 were responsible for 54.16% and 34.49% of the variance, respectively, whereas in set-up No. 3, they were responsible for 56.04% and 9.23%, respectively. Based on their spectral characteristics, the spectral sample data were split into discrete groups, with little score overlap amongst set-ups. The predicted images derived from the PLS-DA results are displayed in Figure 8. The results demonstrated the effectiveness of the proposed PLS-DA model in accurately distinguishing between distinct categories. In more detail, the outcomes demonstrate the effectiveness of this cascade detection approach in classifying the samples. Textiles are distinguished from plastics, and within each group, different textile types (e.g., meta-aramid fiber, para-aramid fiber, knitted textured polyester—PES) and polymer types (e.g., ethylene tetrafluoroethylene—EFTE; expanded polypropylene—EPP; polyaryletherketone—PAEK; polyethylene—PE; polyetherimide—PEI; extruded polystyrene—XPS) are successfully classified.
The sensitivity and specificity values displayed in Table 1 were examined in order to further assess the results. In every category, both measures were high, highlighting the model’s resilience. When evaluating the performance of a classification model, sensitivity and specificity are crucial: high specificity indicates the model’s efficacy in correctly identifying negative cases, lowering false positives, and guaranteeing accurate categorization, whilst sensitivity gauges the model’s capacity to correctly identify positive situations. Sensitivity and specificity are calculated using the following equations:
S e n s i t i v i t y = T P T P + F N
S p e c i f i c i t y = T N F P + T N
The terms TP, FN, TN, and FP represent true positive, false negative, and true negative, respectively, in this context. Sensitivity and Specificity work together to offer important insights about the performance characteristics of the model. Both the calibration (Cal) and cross-validation (CV) stages of the PLS-DA models, which were developed from HSI data, had their sensitivity and specificity determined for this investigation.

5. Conclusions

In recent years, there has been a lot of research performed on the possibility of directly gathering and recycling materials in space. As the issue of space debris becomes increasingly critical, the need to manage and repurpose these materials is not merely an option but a necessity for sustaining future explorations and ensuring the safety of spacecraft and astronauts. This strategic endeavor not only pursues economic benefits but also drives significant technological advancements. In acknowledging the importance of mitigating space debris for future explorations, the collection and recycling of materials in space have become vital components of space exploration and utilization. A fundamental step in this process is the accurate characterization of materials to ensure effective identification and classification, which is essential for designing recycling strategies and selecting specialized manufacturing equipment such as shredders and extruders. Developing analytical techniques that can reliably differentiate between various categories of space materials—especially under the constraints of microgravity and extreme environmental conditions—poses significant scientific and engineering challenges. This study’s findings promote the value-adding and possible recycling of various aerospace materials by showing that the HSI technique may be used to efficiently detect, recognize, and classify them. These findings lay the groundwork for further studies aimed at implementing a comprehensive material recognition system, which will include the addition of new sample categories, for recycling purposes in unique environments such as space. This work, identifying a technological and methodological approach useful for identifying waste to be recycled, supports the achievement of circular models and the achievement of the SDGs, in particular SDG 12 on sustainable production.

Author Contributions

Conceptualization, G.B., I.D., R.P. and S.S.; methodology, G.B., I.D., R.P. and S.S.; validation, G.B., I.D., R.P. and S.S.; formal analysis, R.P.; data curation, R.P.; writing—original draft preparation, G.B., I.D., R.P. and S.S.; writing—review and editing, G.B., I.D., R.P. and S.S.; supervision, G.B. and I.D. All authors have read and agreed to the published version of the manuscript.

Funding

The study was conducted within the MICS (“Made in Italy—Circular and Sustainable”) Extended Partnership, with funding from the European Union Next-GenerationEU (PIANO NAZIONALE DI RIPRESA E RESILIENZA (PNRR)—MISSIONE 4 COMPONENTE 2, INVESTIMENTO 1.3—D.D. 1551.11-10-2022, PE00000004) PE 11 (CUP B53C22004130001).

Institutional Review Board Statement

Not applicable.

Informed Consent Statement

Not applicable.

Data Availability Statement

The original contributions presented in the study are included in the article; further inquiries can be directed to the corresponding author.

Acknowledgments

The manuscript reflects only the authors’ views and opinions, and neither the European Union nor the European Commission can be considered responsible for them. We are grateful to Thales Alenia Space Italia for their support in the project and in sharing the materials analyzed.

Conflicts of Interest

The authors declare no conflicts of interest.

References

  1. Kirchherr, J.; Yang, N.-H.N.; Schulze-Spüntrup, F.; Heerink, M.J.; Hartley, K. Conceptualizing the circular economy (revisited): An analysis of 221 definitions. Resour. Conserv. Recycl. 2023, 194, 107001. [Google Scholar] [CrossRef]
  2. Ferrante, M.; Vitti, M.; Facchini, F.; Sassanelli, C. Mapping the relations between the circular economy rebound effects dimensions: A systematic literature review. J. Clean. Prod. 2024, 456, 142399. [Google Scholar] [CrossRef]
  3. Chioatto, E.; Sospiro, P. Transition from waste management to circular economy: The European Union roadmap. Environ. Dev. Sustain. 2023, 25, 249–276. [Google Scholar] [CrossRef]
  4. Hondroyiannis, G.; Sardianou, E.; Nikou, V.; Evangelinos, K.; Nikolaou, I. Circular economy and macroeconomic performance: Evidence across 28 European countries. Ecol. Econ. 2024, 215, 108002. [Google Scholar] [CrossRef]
  5. Chen, C.-C.; Pao, H.-T. Circular economy and ecological footprint: A disaggregated analysis for the EU. Ecol. Indic. 2024, 160, 111809. [Google Scholar] [CrossRef]
  6. Claudio-Quiroga, G.; Poza, C. Measuring the circular economy in Europe: Big differences among countries, great opportunities to converge. Sustain. Dev. 2024, 32, 4707–4725. [Google Scholar] [CrossRef]
  7. D’Adamo, I.; Daraio, C.; Di Leo, S.; Gastaldi, M.; Rossi, E.N. Driving EU sustainability: Promoting the circular economy through municipal waste efficiency. Sustain. Prod. Consum. 2024, 50, 462–474. [Google Scholar] [CrossRef]
  8. Sondh, S.; Upadhyay, D.S.; Patel, S.; Patel, R.N. Strategic approach towards sustainability by promoting circular economy-based municipal solid waste management system-A review. Sustain. Chem. Pharm. 2024, 37, 101337. [Google Scholar] [CrossRef]
  9. Ma, W.; Liu, T.; Hao, J.L.; Wu, W.; Gu, X. Towards a circular economy for construction and demolition waste management in China: Critical success factors. Sustain. Chem. Pharm. 2023, 35, 101226. [Google Scholar] [CrossRef]
  10. Molla, A.H.; Shams, H.; Harun, Z.; Kasim, A.N.C.; Nallapaneni, M.K.; Rahman, M.N.A. Evaluation of end-of-life vehicle recycling system in India in responding to the sustainability paradigm: An explorative study. Sci. Rep. 2023, 13, 4169. [Google Scholar] [CrossRef]
  11. Voukkali, I.; Papamichael, I.; Loizia, P.; Economou, F.; Stylianou, M.; Naddeo, V.; Zorpas, A.A. Fashioning the Future: Green chemistry and engineering innovations in biofashion. Chem. Eng. J. 2024, 497, 155039. [Google Scholar] [CrossRef]
  12. Angelo, A.C.M.; Saraiva, A.B.; Clímaco, J.C.N.; Infante, C.E.; Valle, R. Life Cycle Assessment and Multi-criteria Decision Analysis: Selection of a strategy for domestic food waste management in Rio de Janeiro. J. Clean. Prod. 2017, 143, 744–756. [Google Scholar] [CrossRef]
  13. Mishra, K.; Siwal, S.S.; Thakur, V.K. E-waste recycling and utilization: A review of current technologies and future perspectives. Curr. Opin. Green Sustain. Chem. 2024, 47, 100900. [Google Scholar] [CrossRef]
  14. Moustakas, K.; Loizidou, M. Effective waste management with emphasis on circular economy. Environ. Sci. Pollut. Res. 2023, 30, 8540–8547. [Google Scholar] [CrossRef]
  15. Moustakas, K.; Loizidou, M. Waste management & circular economy. Sustain. Chem. Pharm. 2023, 32, 100969. [Google Scholar]
  16. Fernández-Miguel, A.; García-Muiña, F.E.; Settembre-Blundo, D.; Tarantino, S.C.; Riccardi, M.P. Exploring Systemic Sustainability in Manufacturing: Geoanthropology’s Strategic Lens Shaping Industry 6.0. Glob. J. Flex. Syst. Manag. 2024, 25, 579–600. [Google Scholar] [CrossRef]
  17. Wilson, A.R.; Vasile, M. The space sustainability paradox. J. Clean. Prod. 2023, 423, 138869. [Google Scholar] [CrossRef]
  18. Leonard, R.; Williams, I.D. Viability of a circular economy for space debris. Waste Manag. 2023, 155, 19–28. [Google Scholar] [CrossRef]
  19. Paladini, S.; Saha, K.; Pierron, X. Sustainable space for a sustainable Earth? Circular economy insights from the space sector. J. Environ. Manag. 2021, 289, 112511. [Google Scholar] [CrossRef]
  20. Wood, D.; Rathnasabapathy, M.; Stober, K.J.; Menon, P. Challenges and progress in applying space technology in support of the sustainable development goals. Acta Astronaut. 2024, 219, 678–692. [Google Scholar] [CrossRef]
  21. Hall, P.B. Recycling In-Space Plastic Waste for Deep-Space Additive Manufacturing: Capability Assessment and Technology Development, Part-II1. In Marshall Space Flight Center Faculty Fellowship Program; Marshall Space Flight Center: Huntsville, AL, USA, 2021; p. 94. [Google Scholar]
  22. Ailor, W. Protecting the LEO environment. J. Space Saf. Eng. 2022, 9, 449–454. [Google Scholar] [CrossRef]
  23. Makaya, A.; Pambaguian, L.; Ghidini, T.; Rohr, T.; Lafont, U.; Meurisse, A. Towards out of earth manufacturing: Overview of the ESA materials and processes activities on manufacturing in space. CEAS Space J. 2023, 15, 69–75. [Google Scholar] [CrossRef]
  24. Wilson, A.R.; Vasile, M.; Maddock, C.A.; Baker, K.J. Ecospheric life cycle impacts of annual global space activities. Sci. Total Environ. 2022, 834, 155305. [Google Scholar] [CrossRef] [PubMed]
  25. Allwood, J.M. Material efficiency—Squaring the circular economy: Recycling within a hierarchy of material management strategies. In Handbook of Recycling; Elsevier: Amsterdam, The Netherlands, 2024; pp. 45–78. [Google Scholar]
  26. Malik, M.; Sharma, S.; Uddin, M.; Chen, C.-L.; Wu, C.-M.; Soni, P.; Chaudhary, S. Waste classification for sustainable development using image recognition with deep learning neural network models. Sustainability 2022, 14, 7222. [Google Scholar] [CrossRef]
  27. Shi, C.; Tan, C.; Wang, T.; Wang, L. A waste classification method based on a multilayer hybrid convolution neural network. Appl. Sci. 2021, 11, 8572. [Google Scholar] [CrossRef]
  28. Shreya, M.; Katyal, J.; Ramesh, R. Technical solutions for waste classification and management: A mini-review. Waste Manag. Res. 2023, 41, 801. [Google Scholar]
  29. Ionescu, G.; Rada, E.C.; Ragazzi, M.; Mărculescu, C.; Badea, A.; Apóstol, T. Integrated municipal solid waste scenario model using advanced pretreatment and waste to energy processes. Energy Convers. Manag. 2013, 76, 1083–1092. [Google Scholar] [CrossRef]
  30. Linne, D.L.; Palaszewski, B.A.; Gokoglu, S.A.; Balasubramaniam, B.; Hegde, U.G.; Gallo, C. Waste management options for long-duration space missions: When to reject, reuse, or recycle. In Proceedings of the 7th Symposium on Space Resource Utilization, National Harbor, MD, USA, 13–17 January 2014; p. 0497. [Google Scholar]
  31. Zhou, C.; Xu, Z.; Wang, L.; Qiao, R.; Li, Y.; Chang, R.; Ai, W. The Production of Solid Wastes in CELSS and the Difficulties in Recycling by Composting: A Review. Space Sci. Technol. 2024, 4, 0154. [Google Scholar] [CrossRef]
  32. Olawade, D.B.; Fapohunda, O.; Wada, O.Z.; Usman, S.O.; Ige, A.O.; Ajisafe, O.; Oladapo, B.I. Smart waste management: A paradigm shift enabled by artificial intelligence. Waste Manag. Bull. 2024, 2, 244–263. [Google Scholar] [CrossRef]
  33. Palmieri, R.; Gasbarrone, R.; Fiore, L. Hyperspectral Imaging for Sustainable Waste Recycling. Sustainability 2023, 15, 7752. [Google Scholar] [CrossRef]
  34. Bonifazi, G.; Gasbarrone, R.; Palmieri, R.; Serranti, S. End-of-Life Textile Recognition in a Circular Economy Perspective: A Methodological Approach Based on Near Infrared Spectroscopy. Sustainability 2022, 14, 10249. [Google Scholar] [CrossRef]
  35. Calvini, R.; Ulrici, A.; Amigo, J.M. Growing applications of hyperspectral and multispectral imaging. Data Handl. Sci. Technol. 2020, 32, 605–629. [Google Scholar]
  36. Caballero, D.; Bevilacqua, M.; Amigo, J.M. Application of hyperspectral imaging and chemometrics for classifying plastics with brominated flame retardants. J. Spectr. Imaging 2019, 8, a1. [Google Scholar] [CrossRef]
  37. Alagappan, S.; Kolobaric, A.; Hoffman, L.C.; Cozzolino, D. Current and Potential Applications of Vibrational Spectroscopy as a Tool in Black Soldier Fly Production and the Circular Economy. Appl. Sci. 2024, 14, 7318. [Google Scholar] [CrossRef]
  38. Kurniawan, T.A.; Meidiana, C.; Goh, H.H.; Zhang, D.; Othman, M.H.D.; Aziz, F.; Anouzla, A.; Sarangi, P.K.; Pasaribu, B.; Ali, I. Unlocking synergies between waste management and climate change mitigation to accelerate decarbonization through circular-economy digitalization in Indonesia. Sustain. Prod. Consum. 2024, 46, 522–542. [Google Scholar] [CrossRef]
  39. Menezes, J.; Hemachandra, N.; Isidro, K. Role of big data analytics and hyperspectral imaging in waste management for circular economy. Discov. Sustain. 2024, 5, 298. [Google Scholar] [CrossRef]
  40. de Lima Ribeiro, A.; Fuchs, M.C.; Lorenz, S.; Röder, C.; Heitmann, J.; Gloaguen, R. Multi-sensor characterization for an improved identification of polymers in WEEE recycling. Waste Manag. 2024, 178, 239–256. [Google Scholar] [CrossRef]
  41. Patel, D.; Bhise, S.; Kapdi, S.S.; Bhatt, T. Non-destructive hyperspectral imaging technology to assess the quality and safety of food: A review. Food Prod. Process. Nutr. 2024, 6, 69. [Google Scholar] [CrossRef]
  42. Wu, X.; Liang, X.; Wang, Y.; Wu, B.; Sun, J. Non-Destructive Techniques for the Analysis and Evaluation of Meat Quality and Safety: A Review. Foods 2022, 11, 3713. [Google Scholar] [CrossRef]
  43. Nikzadfar, M.; Rashvand, M.; Zhang, H.; Shenfield, A.; Genovese, F.; Altieri, G.; Matera, A.; Tornese, I.; Laveglia, S.; Paterna, G.; et al. Hyperspectral Imaging Aiding Artificial Intelligence: A Reliable Approach for Food Qualification and Safety. Appl. Sci. 2024, 14, 9821. [Google Scholar] [CrossRef]
  44. Feng, C.-H. Colour Analysis of Sausages Stuffed with Modified Casings Added with Citrus Peel Extracts Using Hyperspectral Imaging Combined with Multivariate Analysis. Sustainability 2024, 16, 8683. [Google Scholar] [CrossRef]
  45. Cabral, S.; Klimenka, M.; Bademosi, F.; Lau, D.; Pender, S.; Villaggi, L.; Stoddart, J.; Donnelly, J.; Storey, P.; Benjamin, D. A Contactless Multi-Modal Sensing Approach for Material Assessment and Recovery in Building Deconstruction. Sustainability 2025, 17, 585. [Google Scholar] [CrossRef]
  46. Geladi, P.; Grahn, H.; Burger, J. Multivariate images, hyperspectral imaging: Background and equipment. In Techniques and Applications of Hyperspectral Image Analysis; John Wiley & Sons: West Sussex, UK, 2007; pp. 1–15. [Google Scholar]
  47. Amigo, J.M.; Martí, I.; Gowen, A. Hyperspectral imaging and chemometrics: A perfect combination for the analysis of food structure, composition and quality. In Data Handling in Science and Technology; Elsevier: Amsterdam, The Netherlands, 2013; Volume 28, pp. 343–370. [Google Scholar]
  48. Hyvarinen, T.S.; Herrala, E.; Dall’Ava, A. Direct sight imaging spectrograph: A unique add-in component brings spectral imaging to industrial applications. In Proceedings of the Digital Solid State Cameras: Designs and Applications, San Jose, CA, USA, 28–29 January 1998; pp. 165–175. [Google Scholar]
  49. Bonifazi, G.; Gasbarrone, R.; Palmieri, R.; Serranti, S. A Characterization Approach for End-of-Life Textile Recovery Based on Short-Wave Infrared Spectroscopy. Waste Biomass Valorization 2024, 15, 1725–1738. [Google Scholar] [CrossRef]
  50. Aversano, N.; Bonifazi, G.; D’Adamo, I.; Palmieri, R.; Serranti, S.; Simone, A. Circular and sustainable space: Findings from hyperspectral imaging. J. Clean. Prod. 2024, 471, 143386. [Google Scholar] [CrossRef]
  51. Wise, B.M.; Gallagher, N.B.; Bro, R.; Shaver, J.M.; Windig, W.; Koch, R.S. Chemometrics Tutorial for PLS_toolbox and Solo; Eigenvector Research Inc.: Wenatchee, WA, USA, 2006. [Google Scholar]
  52. Wold, S.; Esbensen, K.; Geladi, P. Principal component analysis. Chemom. Intell. Lab. Syst. 1987, 2, 37–52. [Google Scholar] [CrossRef]
  53. Ballabio, D.; Consonni, V. Classification tools in chemistry. Part 1: Linear models. PLS-DA. Anal. Methods 2013, 5, 3790–3798. [Google Scholar] [CrossRef]
Figure 1. Digital images showing the ten analyzed samples involved in the study to recognize plastic and textile categories.
Cleantechnol 07 00026 g001
Figure 2. Digital images related to the sample validation dataset.
Cleantechnol 07 00026 g002
Figure 3. The image highlights key components of the HSI platform, including the NIR spectral camera (Specim, Oulu, Finland), the associated energizing source, the optic, and the conveyor belt that transports samples.
Cleantechnol 07 00026 g003
Figure 4. Flow chart of implemented cascade detection classification logic.
Cleantechnol 07 00026 g004
Figure 5. Raw spectra related to textile and plastic classes (a), textile categories (b), and polymer categories (c).
Cleantechnol 07 00026 g005
Figure 6. Pre-processed spectra related to textile and plastic classes (a), textile categories (b), and polymer categories (c).
Cleantechnol 07 00026 g006
Figure 7. PCA score plots related to set-up No. 1 (a), set-up No. 2 (b), and set-up No. 3 (c).
Cleantechnol 07 00026 g007
Figure 8. Digital image (a) and the corresponding false color prediction maps obtained by PLS-DA for textile and plastic classification (b), textile category classification (c), and polymer category classification (d).
Cleantechnol 07 00026 g008
Table 1. Statistical parameters obtained for the built classification models.
Set-Up No 1
PLASTICTEXTILE
Sensitivity (Cal)1.0000.999
Specificity (Cal)0.9991.000
Sensitivity (CV)1.0000.999
Specificity (CV)0.9991.000
Set-Up No 2: TEXTILES
Para-Aramid FiberMeta-Aramid FiberPEI
Sensitivity (Cal)1.0001.0001.000
Specificity (Cal)1.0001.0001.000
Sensitivity (CV)1.0001.0001.000
Specificity (CV)1.0001.0001.000
Set-Up No 3: PLASTICS
EPP-GREYPEIEPP-WHITEEFTEPAEKPEXPS
Sensitivity (Cal)0.9991.0000.9911.0001.0001.0001.000
Specificity (Cal)1.0001.0000.9951.0000.9990.9991.000
Sensitivity (CV)0.9991.0000.9891.0001.0001.0001.000
Specificity (CV)1.0001.0000.9951.0000.9990.9991.000
Disclaimer/Publisher’s Note: The statements, opinions and data contained in all publications are solely those of the individual author(s) and contributor(s) and not of MDPI and/or the editor(s). MDPI and/or the editor(s) disclaim responsibility for any injury to people or property resulting from any ideas, methods, instructions or products referred to in the content.

