Abstract
Despite being stored at 113 K and at atmospheric pressure, LNG cold potential is not exploited to reduce green ships’ energy needs. An innovative system based on three organic Rankine cycles integrated into the regasification equipment is proposed to produce additional power and recover cooling energy from condensers. A first-law analysis identified ethylene and ethane as suitable working fluids for the first and the second ORC, making freshwater and ice available. Propane, ammonia and propylene could be arbitrarily employed in the third ORC for air conditioning. An environmental analysis that combines exergy efficiency, ecological indices and hazard aspects for the marine environment and ship passengers indicated propylene as safer and more environmentally friendly. Exergy analysis confirmed that more than 20% of the LNG potential can be recovered from every cycle to produce a net clean power of 76 kW, whereas 270 kW can be saved by recovering condensers’ cooling power to satisfy some ship needs. Assuming the sailing mode, a limitation of 162 kg in LNG consumptions was determined, avoiding the emission of 1584 kg of CO2 per day. Marine thermal pollution is reduced by 3.5 times by recovering the working fluids’ condensation heat for the LNG pre-heating.
1. Introduction
The shipping industry is experiencing increasing pressure from international authorities to improve environmental performance, particularly in terms of pollutants emissions, since dirty fuels such as heavy oil and diesel are still largely employed due to economic reasons and easy refueling [1]. Cleaner alternative fuels must be considered to reduce dangerous emissions such as carbon dioxide (CO2), sulfur oxides (SOx), nitrogen oxides (NOx) and particulate matter (PM). Recently, the International Maritime Organization (IMO), representing the regulatory authority for the shipping sector [2], set a new standard for sulfur emissions named the “Global Sulphur Cap” that imposes a threshold emission value of 0.5% [3]. This target can be achieved by involving cleaner fuels suitable for the current onboard technologies. In this field, LNG (liquified natural gas), despite being classified as a fossil fuel, complies with IMO regulations, is economically viable [4] and can be employed in current engines [5]. In the short term, the use of LNG as a ship’s propellant will produce better environmental performance for the following reasons [6]:
- -
- Emits up to 23% less CO2 than traditional marine fuel oil;
- -
- Reduces the emissions of NOx, SOx and PM by 95%;
- -
- Appropriate for existing marine engines with slight modifications;
- -
- Large availability worldwide.
Another aspect in favor of LNG concerns the safety of supply: it can take advantage of wide geopolitical distribution, it has been produced and transported efficiently and safely for over 50 years, and its storage systems are stable and reliable [7,8]. Therefore, LNG can be considered as a sort of transition fuel to use as a solid starting point for a cleaner shipping sector, until other cost-effective and zero-carbon fuels, such as liquefied biogas (LBG) and liquefied synthetic methane (LSM), become viable. To confirm this, a comparison between LNG and conventional diesel fuels carried out by a multi-criteria analysis in [6], taking into account environmental, economic and safety aspects, indicated LNG processed at high pressure as the best choice. Consequently, LNG supplies so-called green ships (GSs), even more considered in a highly energy-intensive field such as the cruise sector, in which it is stored onboard at a pressure of 1 atm and temperature of 113 K to reduce the occupied volume by 600 times compared to its gaseous form, and successively transformed into natural gas (NG) by the regasification process to be burnt in marine engines. In GSs, the phase change is usually triggered through the abundant and free heat source represented by seawater. Nevertheless, the LNG exergy potential is discharged into the external environment without undertaking any attempt at energy recovery.
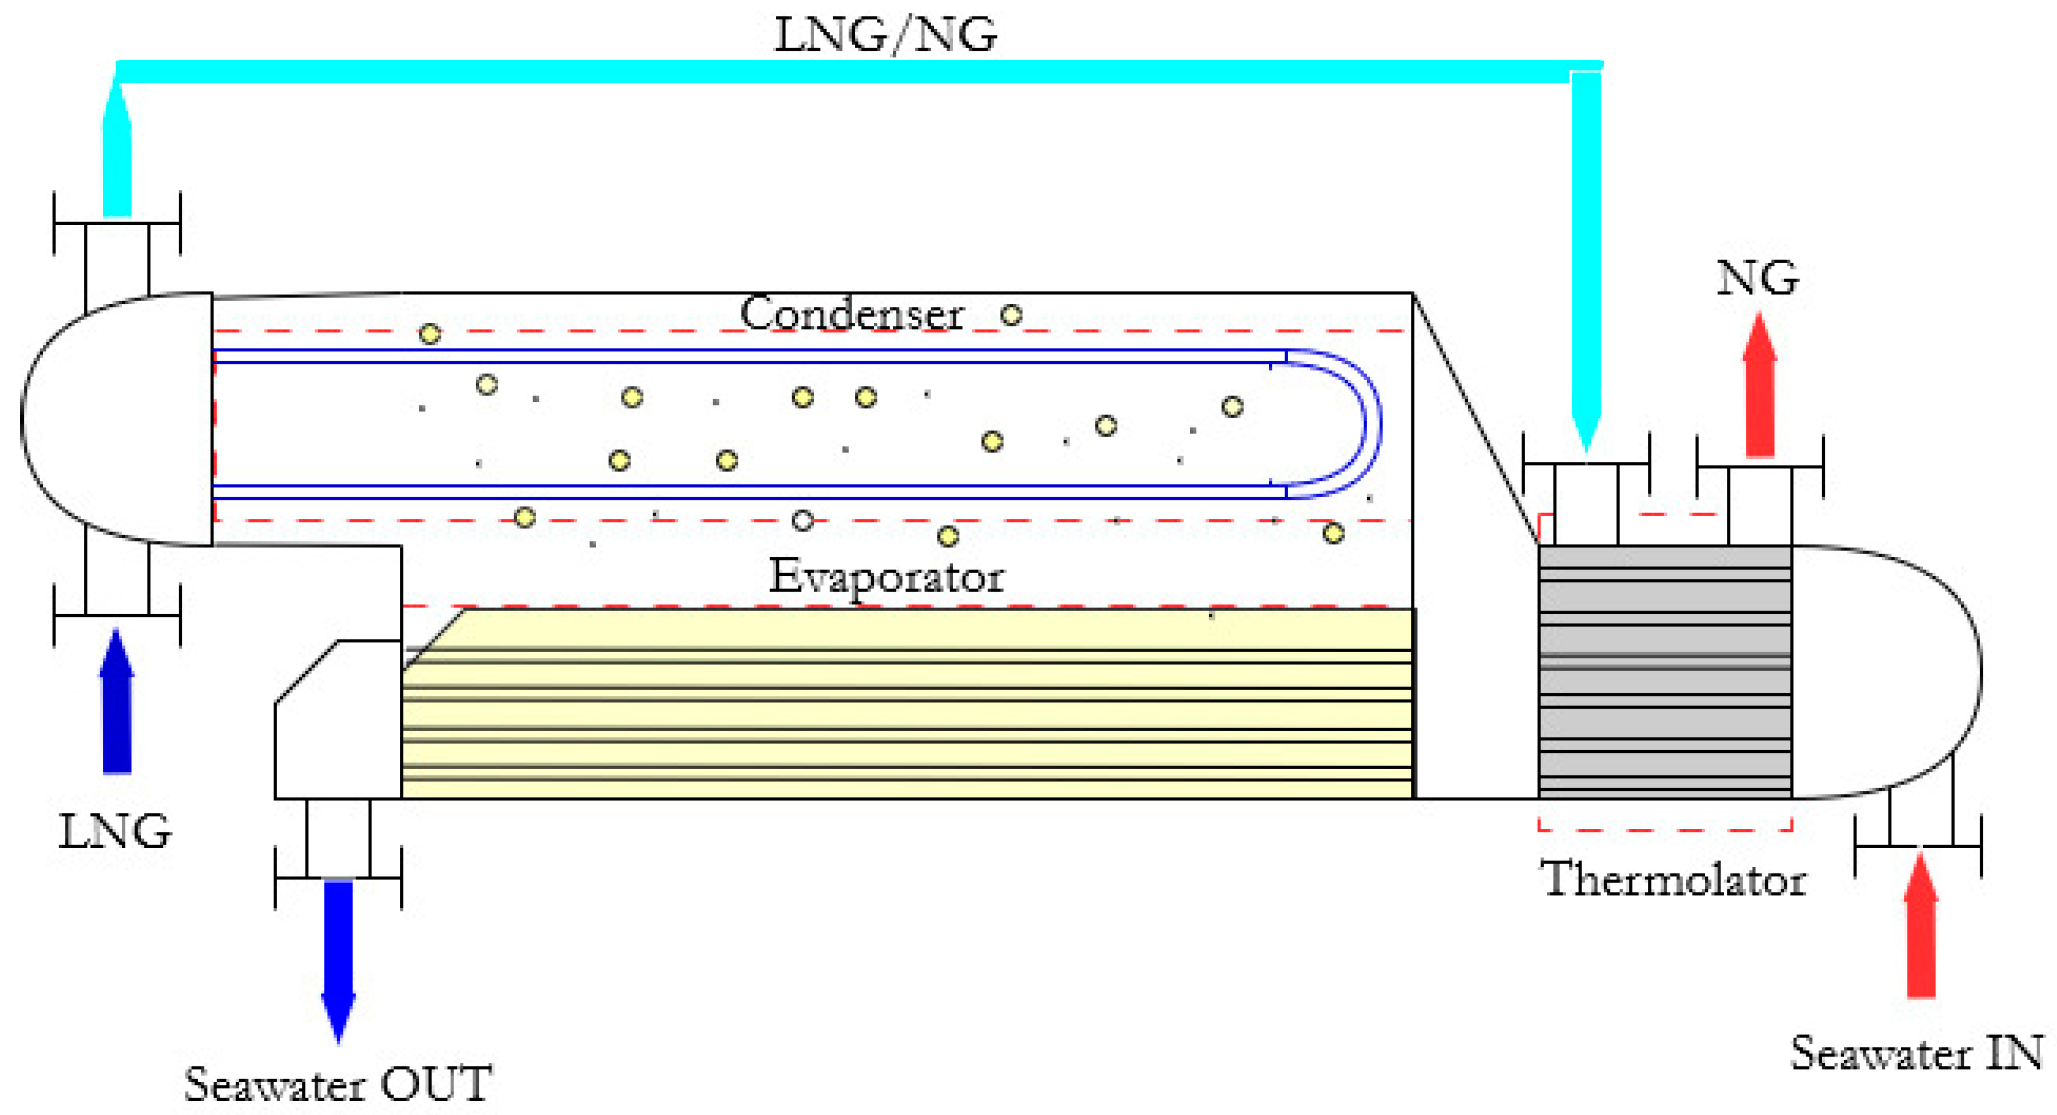
To confirm this, traditional devices such as intermediate fluid vaporizers (IFVs, see Figure 1) drive the regasification process, operating with a transitional working fluid between the LNG and seawater thermal levels, without energy recovery systems. They consist of a vaporizer, a condenser and a further heat exchanger (the thermolator) to adjust the temperature of NG at the end of the process. LNG supplies the condenser to promote the working fluid liquefaction, whereas the released heat is employed for LNG regasification; on the other side, seawater produces the vaporization of the working fluid releasing heat; therefore, it is discharged into the sea at lower temperatures, producing marine thermal pollution [9]. This technique is largely employed because it is simple, effective and cheap; nevertheless, the LNG cold potential is lost.
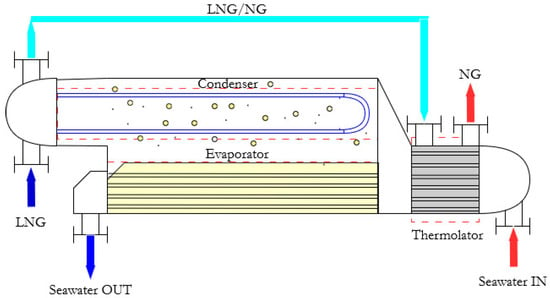
Figure 1.
Operative scheme of a traditional IFV for the LNG regasification by seawater as a hot thermal source.
The literature shows that LNG flow rates in the range of 3600–5325 kg/h could be available in GSs, and, theoretically, a cooling power of 1 MW can be regained [10]. Therefore, the recovery of part of this cooling power for the supply of some ship’s needs is highly attractive. For instance, a highly energy-intensive sector such as the cruise segment could be involved, considering the required onboard services such as sub-zero refrigeration (for food conservation), freshwater production and air conditioning. The recovery of part of LNG exergy potential can be endorsed by using organic Rankine cycles (ORCs) in which the condensation of the working fluids allows for the release of heat to the LNG that, in this way, vaporizes avoiding discharge seawater at low temperatures. On the vaporizer side, instead, heat is absorbed from other fluids, reducing temperatures and making them suitable as cold energy carriers for other applications. Finally, a turbo-expander located between the vaporizer and the condenser allows for the production of mechanical work to convert into electric power, avoiding fuel combustion.
1.1. State of the Art
A lot of investigations concerning the exploitation of LNG cold exergy in the shipping sector are available, but specifically to respond to a precise vessel need, some related to the sole production of freshwater by freezing, other ones targeted at the sole air conditioning of specific spaces onboard. Therefore, investigations concerning a combined system able to respond to different ships’ energy needs, the target of this study, are still missing. Moreover, safety aspects related to the employment of chemical substances onboard to use as ORC working fluids have not been investigated in depth. In [9], a proper modification in the usual IFV configuration is proposed to exploit LNG cold energy. Specifically, two-stage cascaded Rankine cycles were integrated into an IFV for the production of additional power from the expansion of the working fluids in proper turbo-expanders, by simultaneously increasing the temperature of the discharged seawater. This technique allows for limiting the environmental impact, making additional power available for propulsion.
Regarding freeze desalinization, several tests conducted in experimental setups have confirmed the feasibility of the solution, which is also energetically profitable in light of the water solidification latent heat (335 J/g) that is more than six times lower than the water vaporization heat (2260 J/g) [11]. Furthermore, the required solidification latent heat is largely available in the LNG regasification process, considering that during the phase change, a potential of 830 J/g of LNG is available. Usually, the LNG at 113 K can be preliminarily used to pre-cool seawater and successively employed to promote ice crystal formation in suitable freezing towers. In [12], a novel process employing LNG was conceived to reduce energy consumption in freeze desalinization by using an intermediate fluid to produce freshwater using a flake ice maker. In particular, LNG liquefies the intermediate fluid, whose vaporization is exploited to form ice crystals, measuring a specific energy consumption of 2.1 × 10⁻⁴ kWh per kg of freshwater. In another study carried out in [13], a hybrid procedure based on freeze desalinization promoted by LNG and membrane distillation was explored, quantifying an energy consumption of 2.34 kWh per m3 of produced freshwater. In [14], LNG was employed to produce freshwater avoiding freeze desalinization: LNG, in fact, is the cold source in a solar power trans-critical CO2 power cycle that supplies a traditional RO (reverse osmosis) process. The authors measured a daily exergy efficiency of almost 5% with over 2500 m3 of produced freshwater. Ascertaining the thermodynamic efficiency of the freezing desalinization process, the main challenge is represented by an effective mechanical separation of the ice from the brine [15]: usually, centrifugation can be efficiently adopted, but with high energy costs. Furthermore, controlling the ice crystals’ size is also quite challenging, whereas in heat exchangers, the ice growth on the active surface leads to an unavoidable increment in thermal resistance between the crystals and the working fluid. Nevertheless, many authors have investigated in this direction to find effective low-energy solutions: in [16], the employment of atomized, water-immiscible refrigerants to inject in seawater, so that the formation of ice crystals is promoted on the surface of the refrigerants’ bubbles, was proposed. Successively, with the latter being heavier than seawater, refrigerant is recovered at the bottom of a frozen tower whereas ice slurries are collected at the top to be easily harvested. A prototype was effectively made, and the correct functioning was demonstrated; however, a worsening in the heat transfer processes with the ice fraction growth was observed. This solution was also studied in terms of technical and economic feasibility in [12], proving that a flow rate of 1 kg/s of LNG in an optimized configuration is able to produce 1.64 kg/s of freshwater starting from 7.83 kg/s of seawater; nevertheless, an external power input of 1.66 kW is required. Alternatively to atomized refrigerants, ice crystals can be separated from the brine by patented solutions such as HybridICETM [17] or CryoDesalinization [18].
Many applications to promote freshwater production have been targeted specifically at the marine sector: In [19], a novel generator for vessels assisted by cryogenic energy that, in the optimal configuration, was able to produce over 1000 kg/h of freshwater from feed-in seawater, exploiting the vaporization of 3150 kg/h of LNG, was designed. In particular, the authors proposed the employment of an evaporator at low pressure, through the use of a vacuum pump, in which a heat source represented by the exhaust gas of the ship engine promotes the vaporization of seawater. The produced vapor is then conveyed in a condenser that uses the LNG as the cold source required for endorsing the vapor liquefaction; circularly, the heat released from the vapor is exploited for LNG regasification for the engine supply. In [20], the possibility of using LNG in a power generation cycle in which freeze desalinization allows for separating impurities during ice crystal formation was explored. LNG preliminary evolves in a top power cycle for the single production of power; its thermal level increases from −60 °C to −10 °C to be exploited in a bottom cycle targeted for seawater crystallization. A suitable ice/brine separator is then employed to separate the ice crystals from the remaining liquid phase, whereas an ice washer is used to improve the freshwater quality. Globally, the increase in tube length leads to an augment in ice production and quality. In [21], freeze desalinization was achieved by using R410A as a secondary refrigerant fluid: basically, its liquefaction is used to promote LNG regasification, whereas the vaporization of R410A in a crystallizer, represented by a flake ice maker similar to ice machine devices commercially available, is exploited for the production of freshwater. A prototype of the system was tested in an experimental setup providing a capacity of 2 kg of freshwater per kg of LNG; nevertheless, the salt removal rate was quite low, at 50%, indicating that a single freeze desalinization cycle was not enough for producing drinking water.
Regarding investigations exploring how LNG can be used in air conditioning systems, fewer studies have been found for the shipping sector, whereas many others concerning the supply of district cooling in LNG terminals are available. A specific application was conducted in [22]: the authors studied the potentiality of LNG cold energy to cool the cargo holds in an ultra-large container ship by producing a cooled air ventilation stream starting from the regasification process. The results highlighted that the recovery of the cold energy allowed for improving the marine power system due to the more efficient propulsion determined by the power saving required from the air conditioning system, which allows for gaining power output at the vessel shaft. Nevertheless, when the outside air temperature exceeds 40 °C, the cooled air ventilation stream is not sufficient for all the cargo holds. In [23], instead, a novel plant configuration supplied by low-grade waste heat (70–100 °C) that uses LNG for the simultaneous production of power and of two different chilled flow rates was investigated: the first with a glycol–water mixture at −10 °C for sub-zero refrigeration; the second one with a chilled water flow rate at 4.4 °C for air-conditioning. Specifically, the low-grade heat source is used to drive an absorption power-cooling cycle employing a mixture of ammonia–water as a working fluid, and the LNG is vaporized by exploiting the absorption heat from the ammonia to produce a weak ammonia–water solution. The proposed plant uses a proper section in which the evaporation of pure ammonia produces the glycol–water mixture at −10 °C, whereas the generated NG, after an expansion in a turbine to reach the desired pressure level [11], is used in a heat exchanger to produce a chilled water flow rate at 4.4 °C. Following this operative scheme, the system is able to deliver 9.4 MW of space cooling, 6.5 MW of sub-zero refrigeration and 2.2 MW of net power for a regasification capacity of one million tons of LNG per year. In [24], the LNG exergy recovery was explored by proposing a cascade system in which the separation of light hydrocarbon, the power generation by organic Rankine cycles and the direct cooling of a data center was achieved. In [25], a novel plant configuration able to provide direct and indirect district cooling was investigated. In particular, LNG was studied as a cold source to improve the performances of an organic Rankine cycle and of a Brayton cycle, whose power outputs are successively used to drive a traditional compression chiller connected to the district. Regarding a regasification capacity of 1 million tons per year, the energy analysis showed that it is possible to deliver 12.4 MW and 22.1 MW of cold energy when 2.4 MW and 9.4 MW are the powers produced, respectively, in the Rankine and the Brayton cycles.
1.2. Research Gap and Contributions
The results introduced in recent studies confirm that LNG can be efficiently used for water desalinization, sub-zero refrigeration and air conditioning. Despite the pertinent literature introducing different modalities to indirectly recover cryogenic energy from LNG by using intermediate working fluids, no solutions were found concerning systems conceived specifically for the shipping sector and able to respond to different vessels’ needs. Moreover, the impact of these working fluids on the external environment and onboard safety has not been deeply investigated. In order to cover this gap, and regarding technical data of an existing cruise GS, this paper introduces a novel system based on three ORCs in series to rationally exploit the available temperature difference between hot (seawater) and cold (LNG) sources by recovering part of the available cold exergy. The novelty in this idea is the combination of more ORCs arranged in series to rationally exploit the available temperature difference in order to limit the intrinsic irreversibilities connected with the heat exchange processes as much as possible, enhancing the exergy recovery. For this purpose, an energy analysis, aimed at the evaluation of the attainable thermal performance, is combined with an exergy analysis aimed at quantifying the exergy defects for quick identification of the critical components and system optimization.
The challenges for the implementation of a such system concern the regasification process’ completion and the availability of proper space in the ship hold for the components installation. However, the production of additional clean electric power and chilled fluids for some ship’s energy needs allow for reducing the vessel’s environmental footprint. Consequently, cold energy recovery from LNG storage improves the GS environmental impact due to the limitation of fuel consumption, pollutants emission and marine thermal pollution.
Specifically, this paper explores the suitable working fluid for every ORC, to choose as a function of the available temperature interval, and the magnitude of the recovered cooling powers to reduce the GS energy demands. First and second thermodynamic laws were used for assessing the performances of the main ORC components, both in terms of technical and environmental viewpoints. In particular, the first law allowed for identifying the working fluids determining the attainable energy performances. The second-law analysis, instead, was exploited to measure the environmental impact by considering the produced irreversibilities through the exergy defect concept. Successively, the aspects related to the environment and passenger safety were quantified by combining the exergy defect with the GWP (global warming potential) index and some risk factors from chemical substances (the ORC working fluids) employed onboard. For this purpose, the interaction between two different software tools represented by REFPROP [26]—which is required to determine the working fluid’s thermodynamic properties as a function of the operating conditions—and EES (Engineering Equation Solver) [27] to determine ORC performance was exploited.
2. Materials and Methods
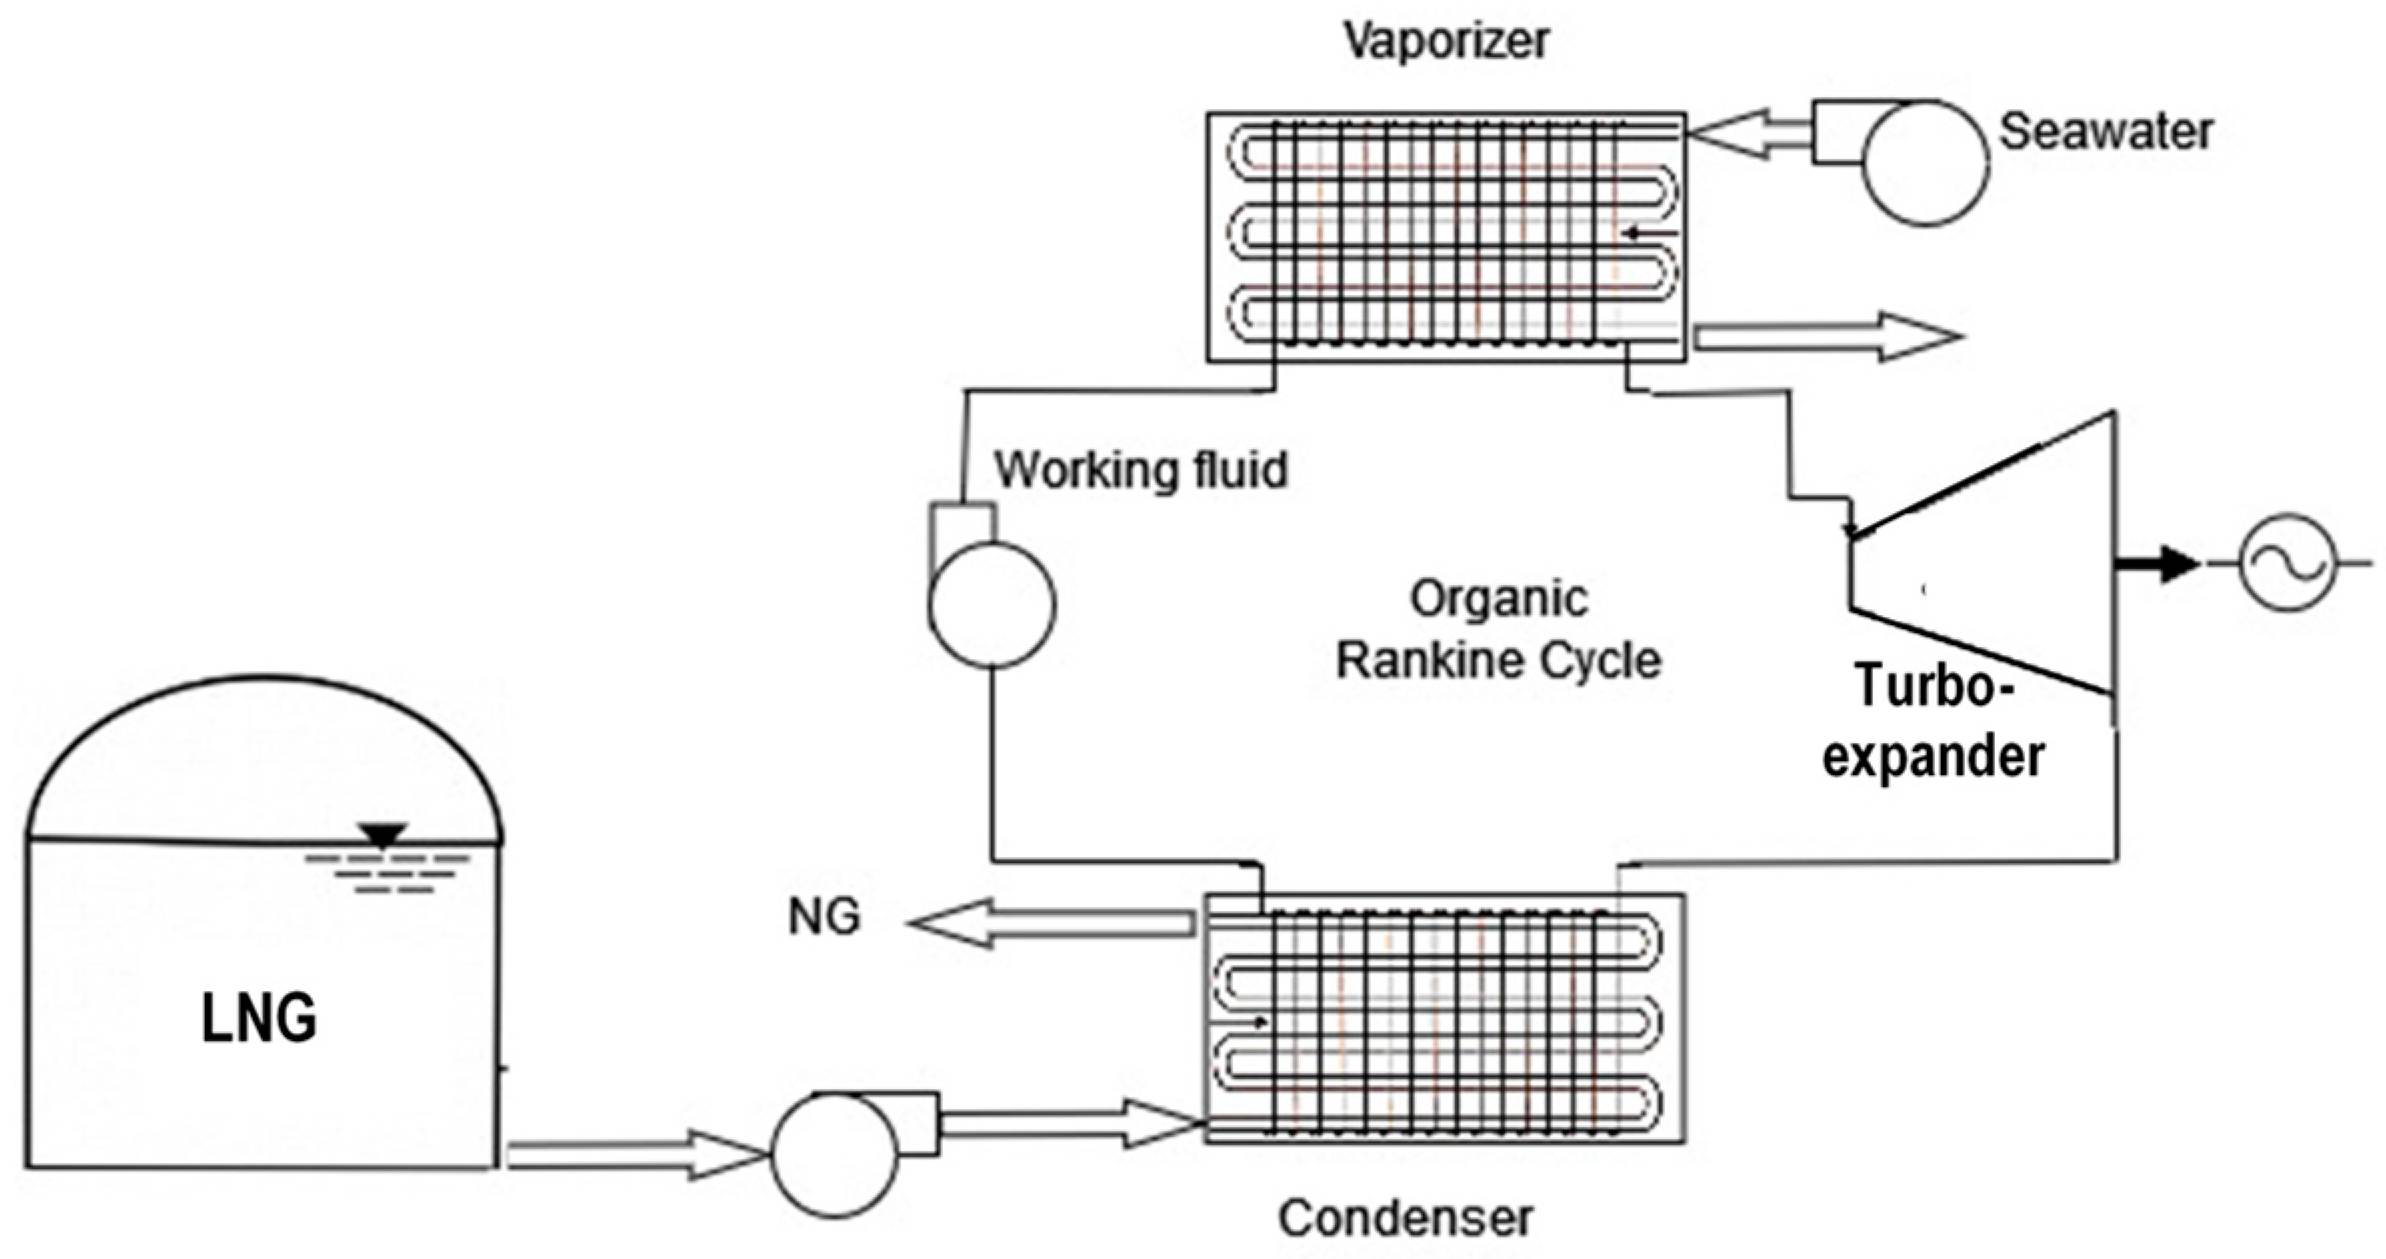
Cryogenic cycles for power generation represent the most frequent method of utilizing the cooling capacity of LNG, and their operation follows the scheme depicted in Figure 2. The vaporized working fluid obtained by an available heat source (i.e., seawater) evolves in a turbo-expander for producing mechanical power, and it is brought to the liquid phase in the condenser by using the LNG cryogenic power. The first real example of ORC using cooling energy from LNG was installed in Japan in 1979: the Osaka Gas company implemented a propane-fired ORC cycle at one of its LNG terminals, recording a useful power output of 1.45 MW [28]. In this paper, a similar idea is exploited to drive a series of ORCs: this series is conceived to rationally exploit the available temperature difference (about 180 K) between the thermal sources because its distribution into three cycles allows for limiting the process irreversibilities.
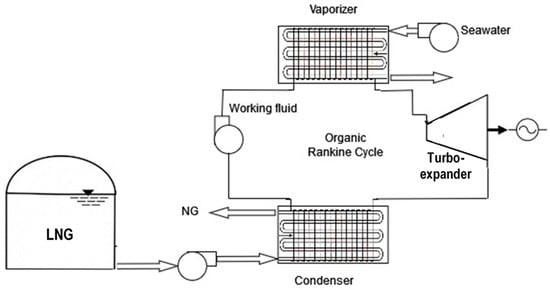
Figure 2.
Example of ORC exploiting LNG cold energy for the production of electric power.
The first ORC makes cooling power available to the condenser for freshwater production by freezing, the second ORC for additional ice production to use in sub-zero refrigeration, and the third ORC provides chilled water to use for air conditioning purposes. To ensure the maximal recovery of LNG cryogenic power, the performance of the whole system mainly depends on the efficiency of the heat recovery systems and the configuration choice for the cycles themselves. The selection of the most appropriate working fluid is quite complex because aspects related to the ORC performances and how the LNG evaporation curve fits the nonlinear characteristic of the system must be properly considered. Other constraints concern working fluid overpressure from the turbo-expander outlet and the task of overcoming the use of vacuum condensers that could promote the mixing of gases. In light of this, the employment of synthetic working fluid is not suggested, because the positive slope of the liquid–gas curve promotes the attainment of wet vapor at the end of the expansion phase with low vapor quality and the formation of excessive liquid shares inside the turbo-expanders. Furthermore, considering that this paper also focuses on achievable environmental performance, it has to be noted that the impact of synthetic fluids is significant in light of the high values concerning GWP and ODP (ozone depletion potential). Therefore, organic working fluids are more appropriate and can benefit from the negative slope of the liquid–gas curve that counteracts the formation of wet vapor after the expansion phase, although a minimum vapor quality of 0.88 can be tolerated [29,30]. Due to the limited thermal level of the heat source, instead, at the beginning of the expansion phase, the working fluid is always assumed to be in dry saturated vapor conditions. The latter must be chosen also considering the LNG condenser temperatures that must trigger the working fluid liquefaction. It has to be noted that the choice to design the ORC considering wet vapor at the end of an expansion is driven by two main reasons:
- (a)
- The low-grade thermal level of the heat source represented by seawater to promote the phase change in the ORCs makes the attainment of super-heated vapor with a proper pressure level difficult;
- (b)
- The necessity to limit the exploitation of seawater as much as possible to limit pumping work.
In addition, turbo-expander maintenance is easier than that of turbines, considering that if blades are subjected to wear and/or corrosion issues promoted by the liquid phase, these can be solved quickly by replacing the damaged parts. Moreover, new materials currently involved in assembling wheels, such as high-strength aluminum or titanium, allow for delaying the replacement procedure and increasing the time for periodic maintenance [31].
Thermal evaluations can be carried out by considering the actual share of available LNG flow rate that could be employed in the proposed system. By setting the LNG lower heating value (LHV) to 44 MJ/kg and mechanical (ηmec) and electric (ηel) efficiencies to 0.96, the available LNG flow rate can be determined by the following equation:
The software REFPROP v.10 was employed to analyze the interaction between LNG and other organic low-boiling fluids. Regarding the calculation of required working fluid flow rates, the energy balance equation in the condenser (C) is used:
in which the specific enthalpy differences (h) between heat exchanger inlet (in) and outlet (out) are provided by referring to real (R) cryogenic cycles, assuming isentropic efficiency of 85% both for the pumps and the turbo-expanders and pressure drops of 1% in the heat exchangers. After the determination of the working fluid flow rates, the other specific enthalpy differences allow for determining the available power in the ORC turbo-expander (TE):
the power absorbed by the ORC pump (P):
and the net power (NET):
allowing for the first-law efficiency calculation starting from the thermal power at the vaporizer (V):
Successively, by setting the maximum temperature difference of the seawater evolving in the vaporizer (V) in 7 K to contrast marine thermal pollution, the energy balance equation is used again to calculate the correspondent flow rate required for the production of freshwater and sub-zero refrigeration, involving the latent (solidification) heat for the ice production:
It is worth noting that, for the ice formation, the sensible heat required to pre-cool the water flow rate from the initial value (TinR) down to the freezing temperature (TfreezR), as well as the sensible share required to bring the ice down to the final temperature (ToutR), is considered. Moreover, specific heats of 4187 J/kgK and 2051 J/kgK were set for the water and the ice, respectively, left constant in light of the limited temperature differences. For the analysis of the real points in the cryogenic cycles, a pinch point (the minimum temperature difference between the hot and the cold streams) of 10 °C between the fluids was imposed.
From an environmental viewpoint, the ORCs’ effects are taken into account by an environmental impact index (EI) calculated by combining the exergy defect, global warming potential (GWP) and the measure of some risk aspects concerning the working fluids on board [32]. The choice to use the exergy defect concept to determine the environmental impact is due to the irreversibilities connected with the ORC components, because the higher the irreversibilities in the system, the higher the modification of the external environment [33]. The exergy defect is calculated starting from the achievable maximum mechanical work derived from the general equation of exergy, which in steady-state conditions can be written as follows:
It can be appreciated that seawater (Sw) is considered an ideal heat source, releasing thermal power () at a constant temperature (. Actually, this is a simplification considering that the seawater flow rate is affected by a maximum temperature difference of 7 °C; however, it is acceptable considering the limited excursion and assuming the heat source at an average temperature between the inlet and the outlet conditions. Consequently, the share of maximum mechanical work related to seawater appearing in Equation (8) takes as null the reference temperature for the external environment (supposed at T0 = 291.15 K and p0 = 1.0325 bar), equal to the average seawater temperature. For the calculation of the exergy defect, the Gouy–Stodola equation must also be involved to determine the irreversibilities:
Equations (8) and (9) can be applied to the whole ORC or for every ORC component: in the latter case, the maximum specific power producible starting from a precise thermodynamic state can be determined by Equations (10), (11), (12) and (13), respectively, for pump (P), vaporizer (V), turbo-expander (TE) and condenser (C):
It is worth noting that, in the condenser, the LNG exergy is employed to promote exergy growth in the condensing working fluid. With as the physical exergy in the inlet conditions, the exergy efficiency Ψ for the i-th component is calculated as follows:
in which the exergy defect δ, indicating the exergy lost due to the irreversibilities, appears. Large exergy defects determine greater modification of the external environment. The greatest exergy defect value δi identifies the most critical ORC component. Equation (14) can be extended to the whole cycle by considering the total irreversibilities among each component. Indeed, Equation (8), applied to the whole ORC and after the proper simplification, provides the following:
and consequently:
with:
In order to consider the risk level of dispersing working fluids in the external environment, a combination of GWP and indicators provided by the GHS (globally harmonized system [34]) regulations, was employed. GHS rules were promulged by the European Community to standardize the hazard factors and to determine the risk factors related to the employment of chemical substances for the external environment and human health. For the considered study, the following hazard aspects, relevant to cruise ships, have been taken into account:
- -
- Flammability;
- -
- Toxicity for inhalation;
- -
- Skin irritation;
- -
- Risks for the aquatic ecosystem.
The labelling determining the indication of the risk level for each of the mentioned aspects is indicated in Table 1. It can be appreciated that risk levels are indicated by a series of three numbers, in which the first digit indicates the risk typology (2 = physical risk; 3 = health risk; 4 = environmental risk), while the others indicate the magnitude of the risk: the higher the value, the lower the risk level. Therefore, flammability is a physical risk and a substance labelled as H220 is more dangerous than another substance classified as H226.

Table 1.
Risk levels for danger aspects related to the working fluids.
Finally, to quantify the modification of the external environment due to the operation of a GS equipped with the proposed system to recover part of the LNG exergy, the external impact index (EI) is calculated for the i-th working fluid in the correspondent ORCs:
in which a proper correction factor fc accounts for the risk levels listed in Table 1. It is worth noting that fc and GWPi are weighted by the ratio between the required working fluid flow rate and the produced chilled water flow rate involved in the i-th vaporizer, assuming it always lower than the unity. The correction factor fc was determined among the k hazard aspects listed in Table 1 with the following formula:
No danger level for a particular working fluid is indicated by a unitary value in the product notation. It can be appreciated that the higher the EI value, the lower the environmental impact. All the formulas required to perform technical and environmental analysis were implemented in the EES environment.
2.1. Calculation Hypothesis
In the proposed plant, ORC vaporizers are supplied by independent seawater flow rates (heat sources), each dedicated to the production of ice and chilled water to employ for freshwater, sub-zero refrigeration and air conditioning. In particular, seawater is the hot fluid for the first and second ORC, whereas, for air conditioning purposes, demineralized water is considered. As design parameters, an outlet seawater temperature for freshwater production of 246.15 K was set, whereas sub-zero refrigeration requires a seawater outlet temperature of 268.15 K (−5 °C) and demineralized water at 278.15 K (+5 °C) to promote air dehumidification in the AHU cooling coils.
Conversely, condensers are crossed by the same LNG flow rate (cold source) by setting the LNG outlet temperature from the first heat exchanger equal to the LNG inlet temperature of the second one, and so on, according to the scheme depicted in Figure 3. In this manner, the working fluid condensation heat can be recovered to achieve LNG pre-heating. Anyway, the LNG outlet temperature from the last condenser is still not suitable for engines, so a traditional IFV is required to complete the regasification process. It can be appreciated that the exploitation of the condensation heat of the working fluids for LNG pre-heating surely allows for the limitation of seawater flow rates and thermal pollution of the marine environment. Indeed, seawater flow rates reduce due to the increase in LNG inlet temperature in the IFV, also allowing for a reduction in absorbed pumping works.

Figure 3.
Scheme of the cascade ORCs with an indication of the pressure levels: in the third stage, pressure values depend on the employed working fluid.
Assuming the sailing mode, the electrical power required from an existing cruise GS [35] is about 50 MW, produced by dual-fuel hybrid engines. Consequently, an LNG flow rate of 1.25 kg/s (108 tons of LNG per day) determined by Equation (1) can be used as the cold flow rate crossing the condensers. The LNG inlet pressure in the first condenser was set to 65 bar, a value greater than the critical point (about 45 bar), to involve only sensible heat during the regasification process and to limit the pumping work due to the compression in the liquid phase. LNG is treated as pure methane, with a percentage fraction often closer to 98% at an initial temperature of 113.25 K (−160 °C).
The first ORC cycle is designed to produce freshwater at the condenser by freezing desalinization; therefore, it is placed at the top to better exploit the cold potential of LNG, since the lowest temperatures are required. Indeed, as already mentioned, the outlet temperature of seawater from the vaporizer was set to 246.15 K (−27 °C) to facilitate the separation between ice and brine. For higher values of such temperature, the ice is in equilibrium with the brine (only in the solid phase) with the risk of obtaining hydrate salts inside the solid phase; conversely, for lower values, the ice is constituted by pure water and the liquid phase solely by brine [36]. It is supposed that the outlet flow rate from the vaporizer hot side is composed of a flowing mixture of ice and brine (ice in suspension inside the brine), and suitable systems allow for ice separation and harvesting. In order to choose a suitable working fluid, it is worth noting that the evaporation temperature, respecting the 10 °C pinch point, should be closer to 236.15 K (−37 °C). REFPROP showed that ethylene (R1150) is compatible with this temperature if its boiling pressure is over 15 bar and, to also make it appropriate during the condensation phase, the LNG must be subjected to a temperature variation of 50 K by reaching 163.15 K at the outlet. Indeed, in these conditions, R1150 condenses at 173.15 K (assuming the same pinch point) by setting the pressure level over 1.2 bar, avoiding the employment of a vacuum condenser. Temperature and pressure levels of R1150 to set in the first ORC are summarized in Table 2.

Table 2.
Inlet and outlet temperatures of the working fluids in the condensers and vaporizers.
For the second ORC, the LNG inlet temperature in the condenser is set equal to the outlet temperature from the condenser of the previous cycle. Again, to avoid the employment of a vacuum condenser, imposing an LNG flow rate exiting at 198.15 K (−75 °C, with a temperature difference of 35 K regarding the inlet value), the software REFPROP indicated in ethane (R170), a suitable working fluid. Indeed, R170 can condensate at 208.15 K (−65 °C, applying the pinch point temperature difference of 10 K) when the pressure level is set to 3 bar. On the vaporizer side, the same pinch point imposes for the working fluid a phase change at 258.15 K (−15 °C), considering that a seawater outlet temperature of 268 K (−5 °C) is sufficient for producing ice suitable for sub-zero refrigeration, and R170 can respect this constrain when the boiling pressure is set at 16 bar. Temperature and pressure levels of R170 to set in the second ORC are summarized in Table 2.
In the third ORC condenser, LNG enters at 198.15 K (−75 °C) and this time, REFPROP showed different working fluids able to operate in the bottom cycle, in which the lower LNG temperatures are sufficient to promote the ship air conditioning. In particular, by imposing a temperature difference of 35 K to achieve an LNG outlet temperature of 233.15 K (−40 °C), the working fluid condensation temperature of 243.15 K (−30 °C) is achievable with pressure levels over 1 bar by choosing arbitrarily among propane (R290), ammonia (R717) and propylene (R1270): the first liquefies at 1.667 bar, the second at 1.194 bar and the last one at 2.123 bar. On the vaporizer side, with the evaporation temperature being equal to 268.15 K (−5 °C, assuming the outlet seawater temperature of 278.15 K for air conditioning applications), the pressure levels can be set to 4.061 bar, 3.548 bar and 5.032 bar, respectively, for R290, R717 and R1270. The temperature and pressure levels of three employable working fluids to set in the third ORC are summarized in Table 2.
The environmental analysis based on the calculation of EI will identify the best solution among the different alternatives considering the aspects concerning the safety for external environment and passengers. In Table 3, the main physical and ecological features of the identified working fluids are listed.

Table 3.
Main properties of the considered working fluids for the proposed solution at the atmospheric pressure.
Finally, regarding the temperature differences required for the condensation of the selected working fluids, Table 4 lists the inlet and outlet temperature imposed for the LNG during the regasification process through the condensers and the IFV.

Table 4.
Inlet and outlet LNG temperatures in condensers and IFV during the regasification process.
2.2. Thermodynamic and Environmental Properties of the Considered Working Fluids
The considered working fluids have been chosen in order to operate between the temperature intervals employed in each ORC. Moreover, the considered fluids are environmentally friendly in light of an ODP null for every substance, whereas the GWO ranges between 0 and 6.
2.2.1. Ethylene (R1150)
With the chemical formula C2H4, R1150 is the simplest of the alkenes and is a colorless gas that is flammable at room temperature and pressure, characterized by a mildly sweet odor. It is generally used in ultralow-temperature industrial refrigeration applications, and it was considered because it is only used in the LNG liquefaction processes. It does not produce damage to the ozone layer and its impact on the greenhouse effect is limited. It is used almost all over the world and is not restricted by any restrictions for initial installation on a new refrigeration system and use during aftermarket maintenance. Its use arises mainly to take over from R13 and R503 refrigerants in low-temperature or ultralow-temperature systems. A disadvantage is its highly flammable nature; in any case, employment at low temperatures drastically reduces this risk. Furthermore, it is compatible with conventional lubricants, and, in the case of fluid leaks, it is hardly soluble in water.
2.2.2. Ethane (R170)
With the chemical formula C2H6, R170 offers a purity of 99.5 percent, a higher GWP, and is also used in ultralow-temperature refrigeration. As ethylene, it is highly flammable at ambient temperature and pressure, and is even explosive when mixed with air. It also turns out to be colorless and odorless; however, it does not impact the ozone layer.
2.2.3. Propane (R290)
With the chemical formula C3H8, R290 is a natural refrigerant gas, colorless and odorless at ambient temperature and pressure, quite flammable but with low toxicity. It is widely used in stationary commercial refrigeration devices, especially in refrigerated counters with integrated units and small chillers. Its main characteristics are high refrigerating power, zero impact on the ozone layer and minimal impact on the greenhouse effect. In addition, it is easily available on the market without evident price fluctuations. Given its high flammability, current regulations impose limitations regarding the size of refrigeration equipment using R290. However, its excellent thermodynamic properties allow for its employment in plug-in applications at low and medium temperatures.
2.2.4. Ammonia (R717)
With the chemical formula NH3, R717 is a natural, colorless, extremely toxic refrigerant gas with a pungent odor. It is worth noting that R717 represents one of the historical refrigerants used in the refrigeration industry, especially employed in CO2 cascade systems (R744) or refrigerant plants with the provision of chilled glycol–water flow rates. R717 is characterized by excellent heat transport properties, as its latent heat from evaporation is significant. Its main characteristics are high cooling capacity and zero impact on both the ozone layer and the greenhouse effect. As mentioned for propane, R717 is characterized by wide availability at an almost constant price. The significant disadvantage is the high toxicity; therefore, great care must be undertaken in the handling and storage phases. Because it is soluble in water, it can prevent ice formation in the refrigerant plant. However, in extremely wet conditions, it can cause corrosion or technical problems due to sludge formation.
2.2.5. Propylene (R1270)
With the chemical formula C3H6, R1270 is a natural refrigerant gas that is colorless and nearly odorless at ambient temperature and pressure but is highly flammable. It is mainly used in place of refrigerants such as R22 and R502 in low-temperature refrigeration applications and it is compatible with conventional lubricants. Its impact on the ozone layer is null, while it affects the greenhouse effect slightly.
3. Results
According to the scheme depicted in Figure 3, the proposed system can differ only for the third ORC, for which R290, R717 and R1270 can be employed. It has to be noted that the water temperature in the evaporators represents an upper limit that, considering the imposed pinch point temperatures difference, does not allow for the value to exceed 0 °C, due to the third stage operating with a working fluid that cannot go over a temperature of −5 °C. Practically, this limits the temperature difference between the evaporation and condensation phases, which impacts the ORC’s thermal performance.
3.1. Ethylene-Fueled ORC First Stage
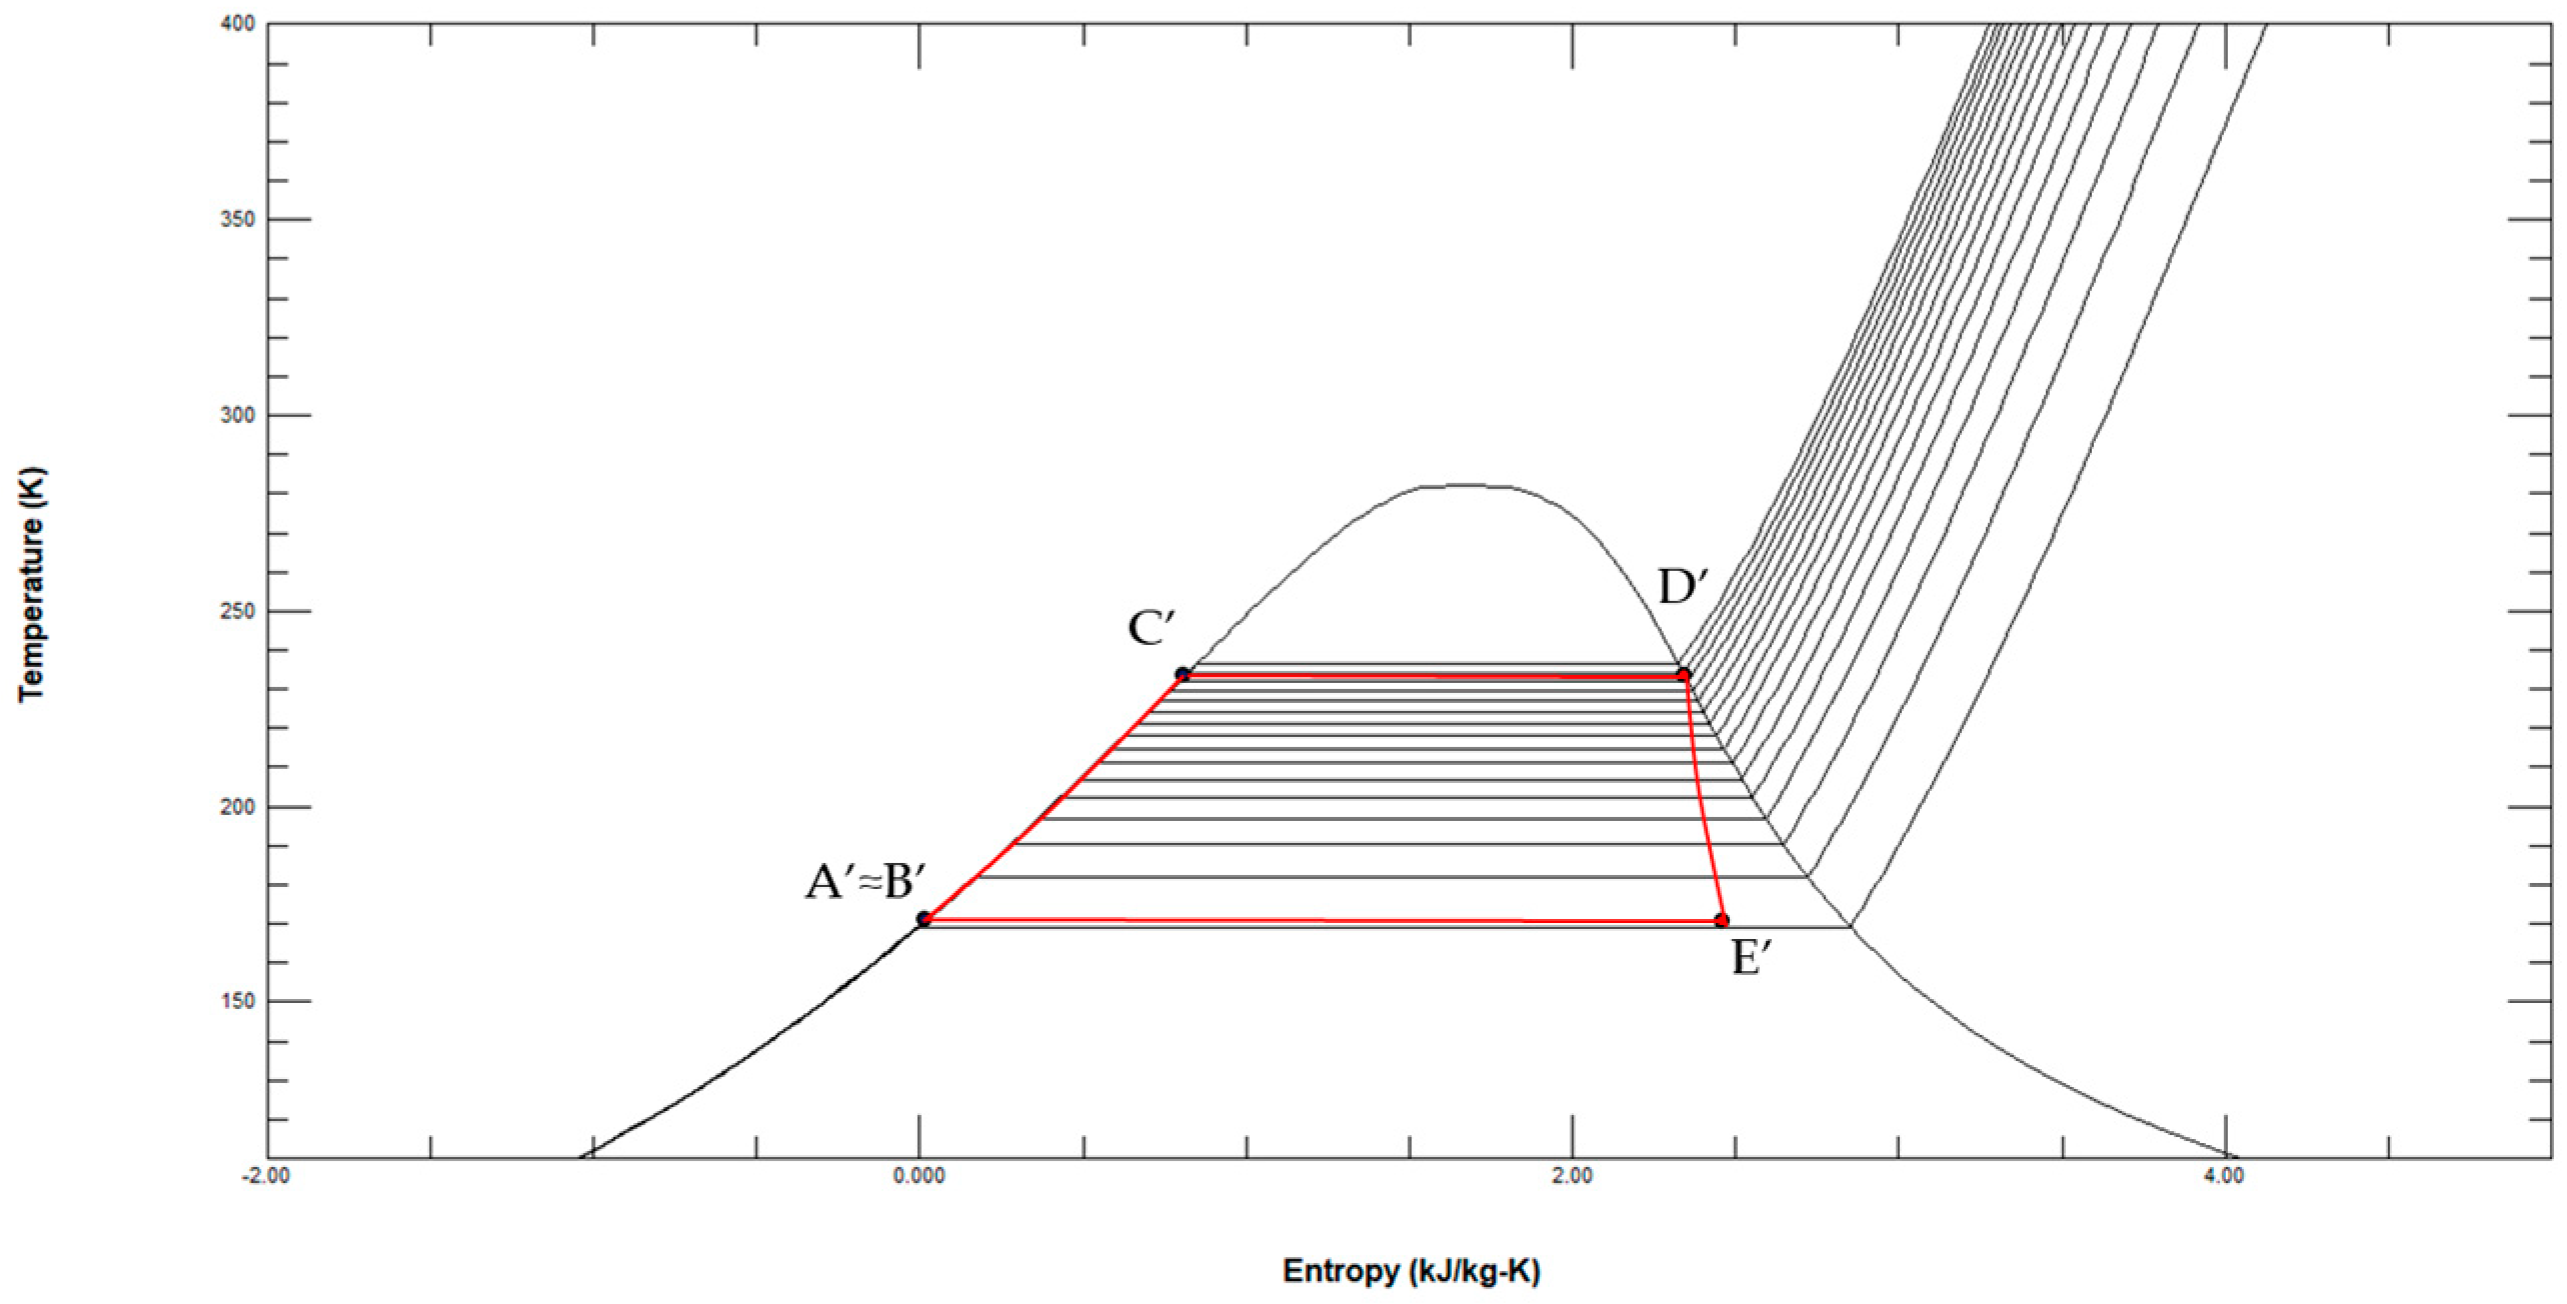
For the first stage, which is common to all the possible solutions, the thermodynamic points of the ethylene-fired ORC system of Figure 3 are listed in Table 5, whereas Figure 4 depicts the cycle of thermodynamic transformations in the T-s diagram.

Table 5.
Thermodynamic points of the ethylene-fueled ORC.
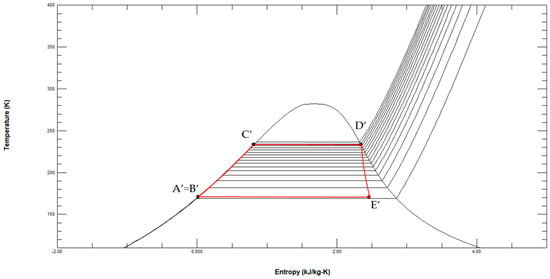
Figure 4.
ORC fueled by R1150 in the T-s diagram with LNG and seawater as thermal sources (reference conditions s0 = 3.5646 kJ/kg·K at p0 = 0.01 bar and T0 = 298.15 K).
The R1150 flow rate was determined following Equation (2):
The turbo-expander and pumping works can be calculated by Equations (3) and (4), so that the net power provided by the first ORC is as follows:
The water flow rate available for freeze desalinization is obtainable from the ethylene vaporization heat and determined by Equation (7), supposing an initial water temperature () of 291.15 K (18 °C) and a final ice temperature of 246.15 K (−27 °C):
corresponding to a quantity of demineralized water over 57 m3 per day. Considering that a flow rate of 160 L per day is required for each person, supposing a number of passengers in the cruise GS of 4500, the first ORC stage will be able to cover 7% of the freshwater demand without energy consumption. With the heat absorbed by R1150 being equal to the heat released from the seawater (about 280 kW), the thermal efficiency of the first ORC provides the following:
which turns out to be a very appreciable value compared with classical ORC systems working at higher temperatures [37].
3.2. Ethane-Fueled ORC Second Stage
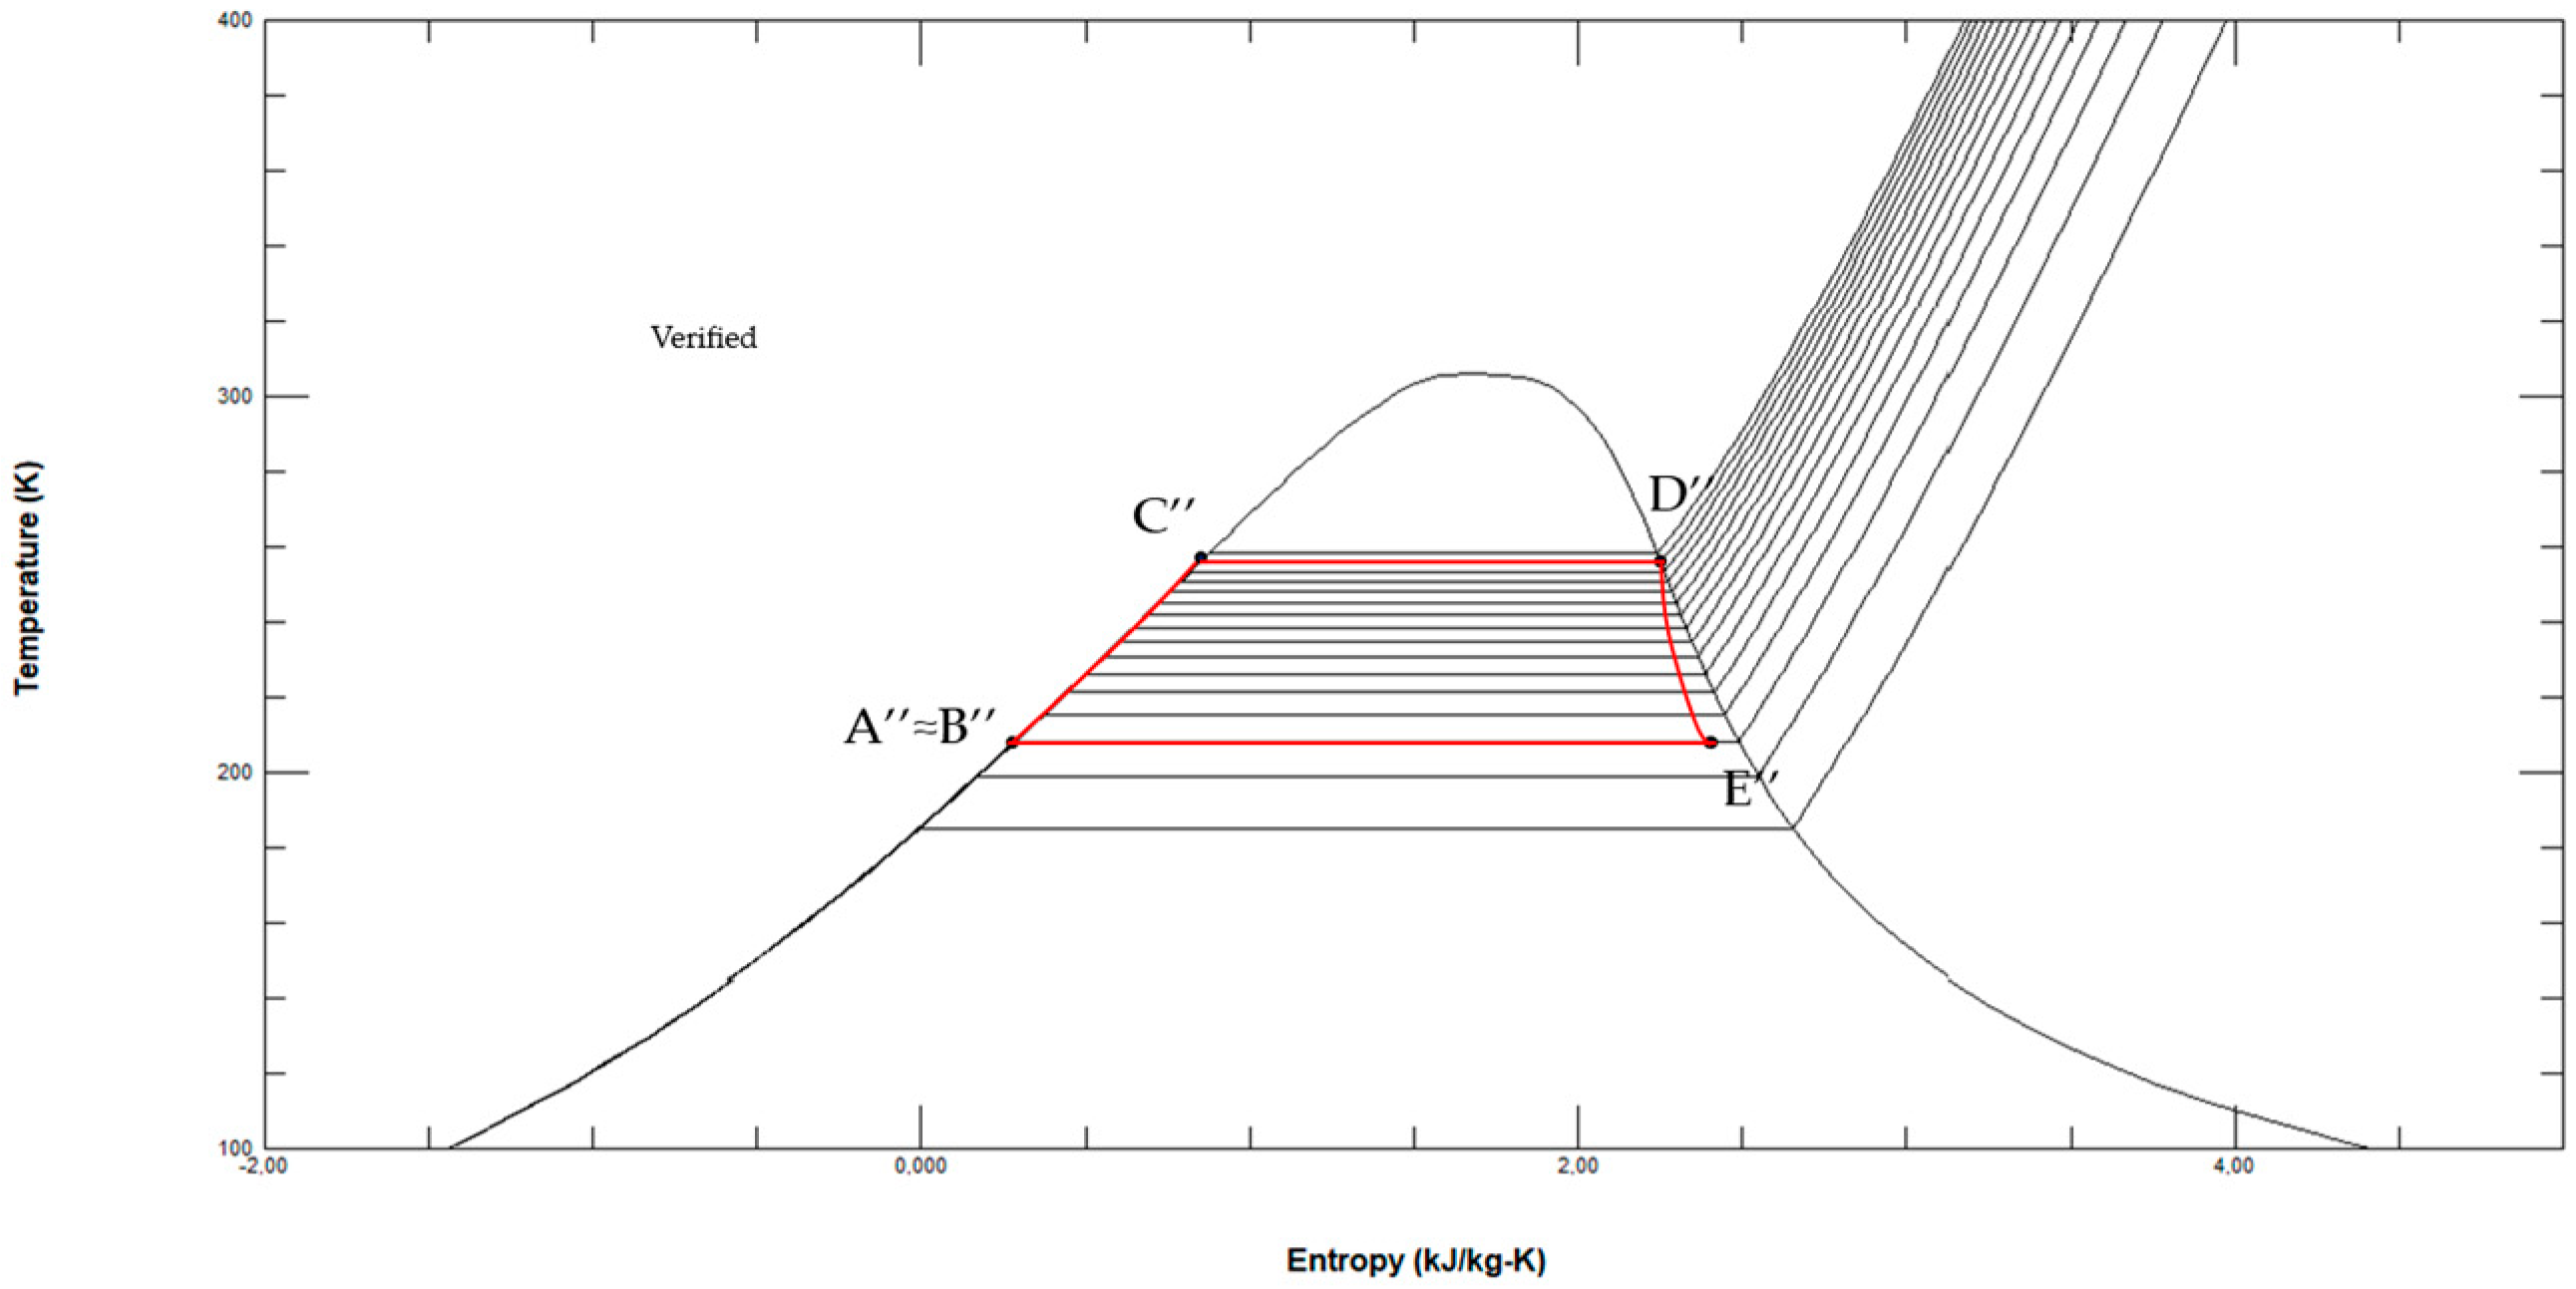
For the second ORC stage, common to all the possible solutions, the thermodynamic points are listed in Table 6, whereas the correspondent cycle is depicted in Figure 5.

Table 6.
Thermodynamic points of the ethane-fueled ORC.
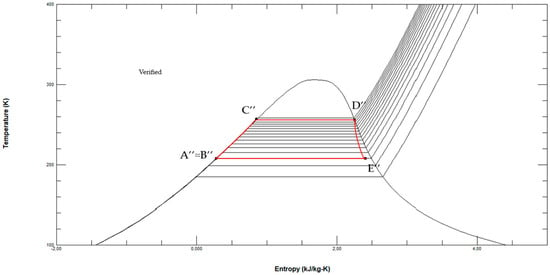
Figure 5.
ORC fueled by R170 in the T-s diagram with LNG and seawater as thermal sources (reference conditions s0 = 3.3256 kJ/kg·K at p0 = 0.01 bar and T0 = 298.15 K).
Again, preliminarily, the ethane flow rate can be derived from Equation (2):
By Equations (3)–(5), the powers related to the turbo-expander, the ethane pump and the net power provided by the ORC can be calculated, obtaining, respectively, 42 kW, 2 kW and 40 kW. Passing to the vaporizer, the producible water flow rate to involve in sub-zero refrigeration at −5 °C is determined by Equation (7), setting to 268.15 K:
Regarding the first-principle efficiency of the ethane thermodynamic cycle, again, an appreciable value is determined:
obviously lower than the prior case due to the limitation between hot and cold source temperatures. The vaporizer provides greater power for cooling seawater of about 325 kW more than the prior case, in light of the larger R170 vaporization heat. Potentially, based on the previous data, the second stage of cascade ORCs is able to make almost 57,000 kg of ice per day available to use, for instance, for food conservation in proper storage warehouses or for freshwater production by melting.
3.3. ORC Third Stage Considering Different Working Fluids
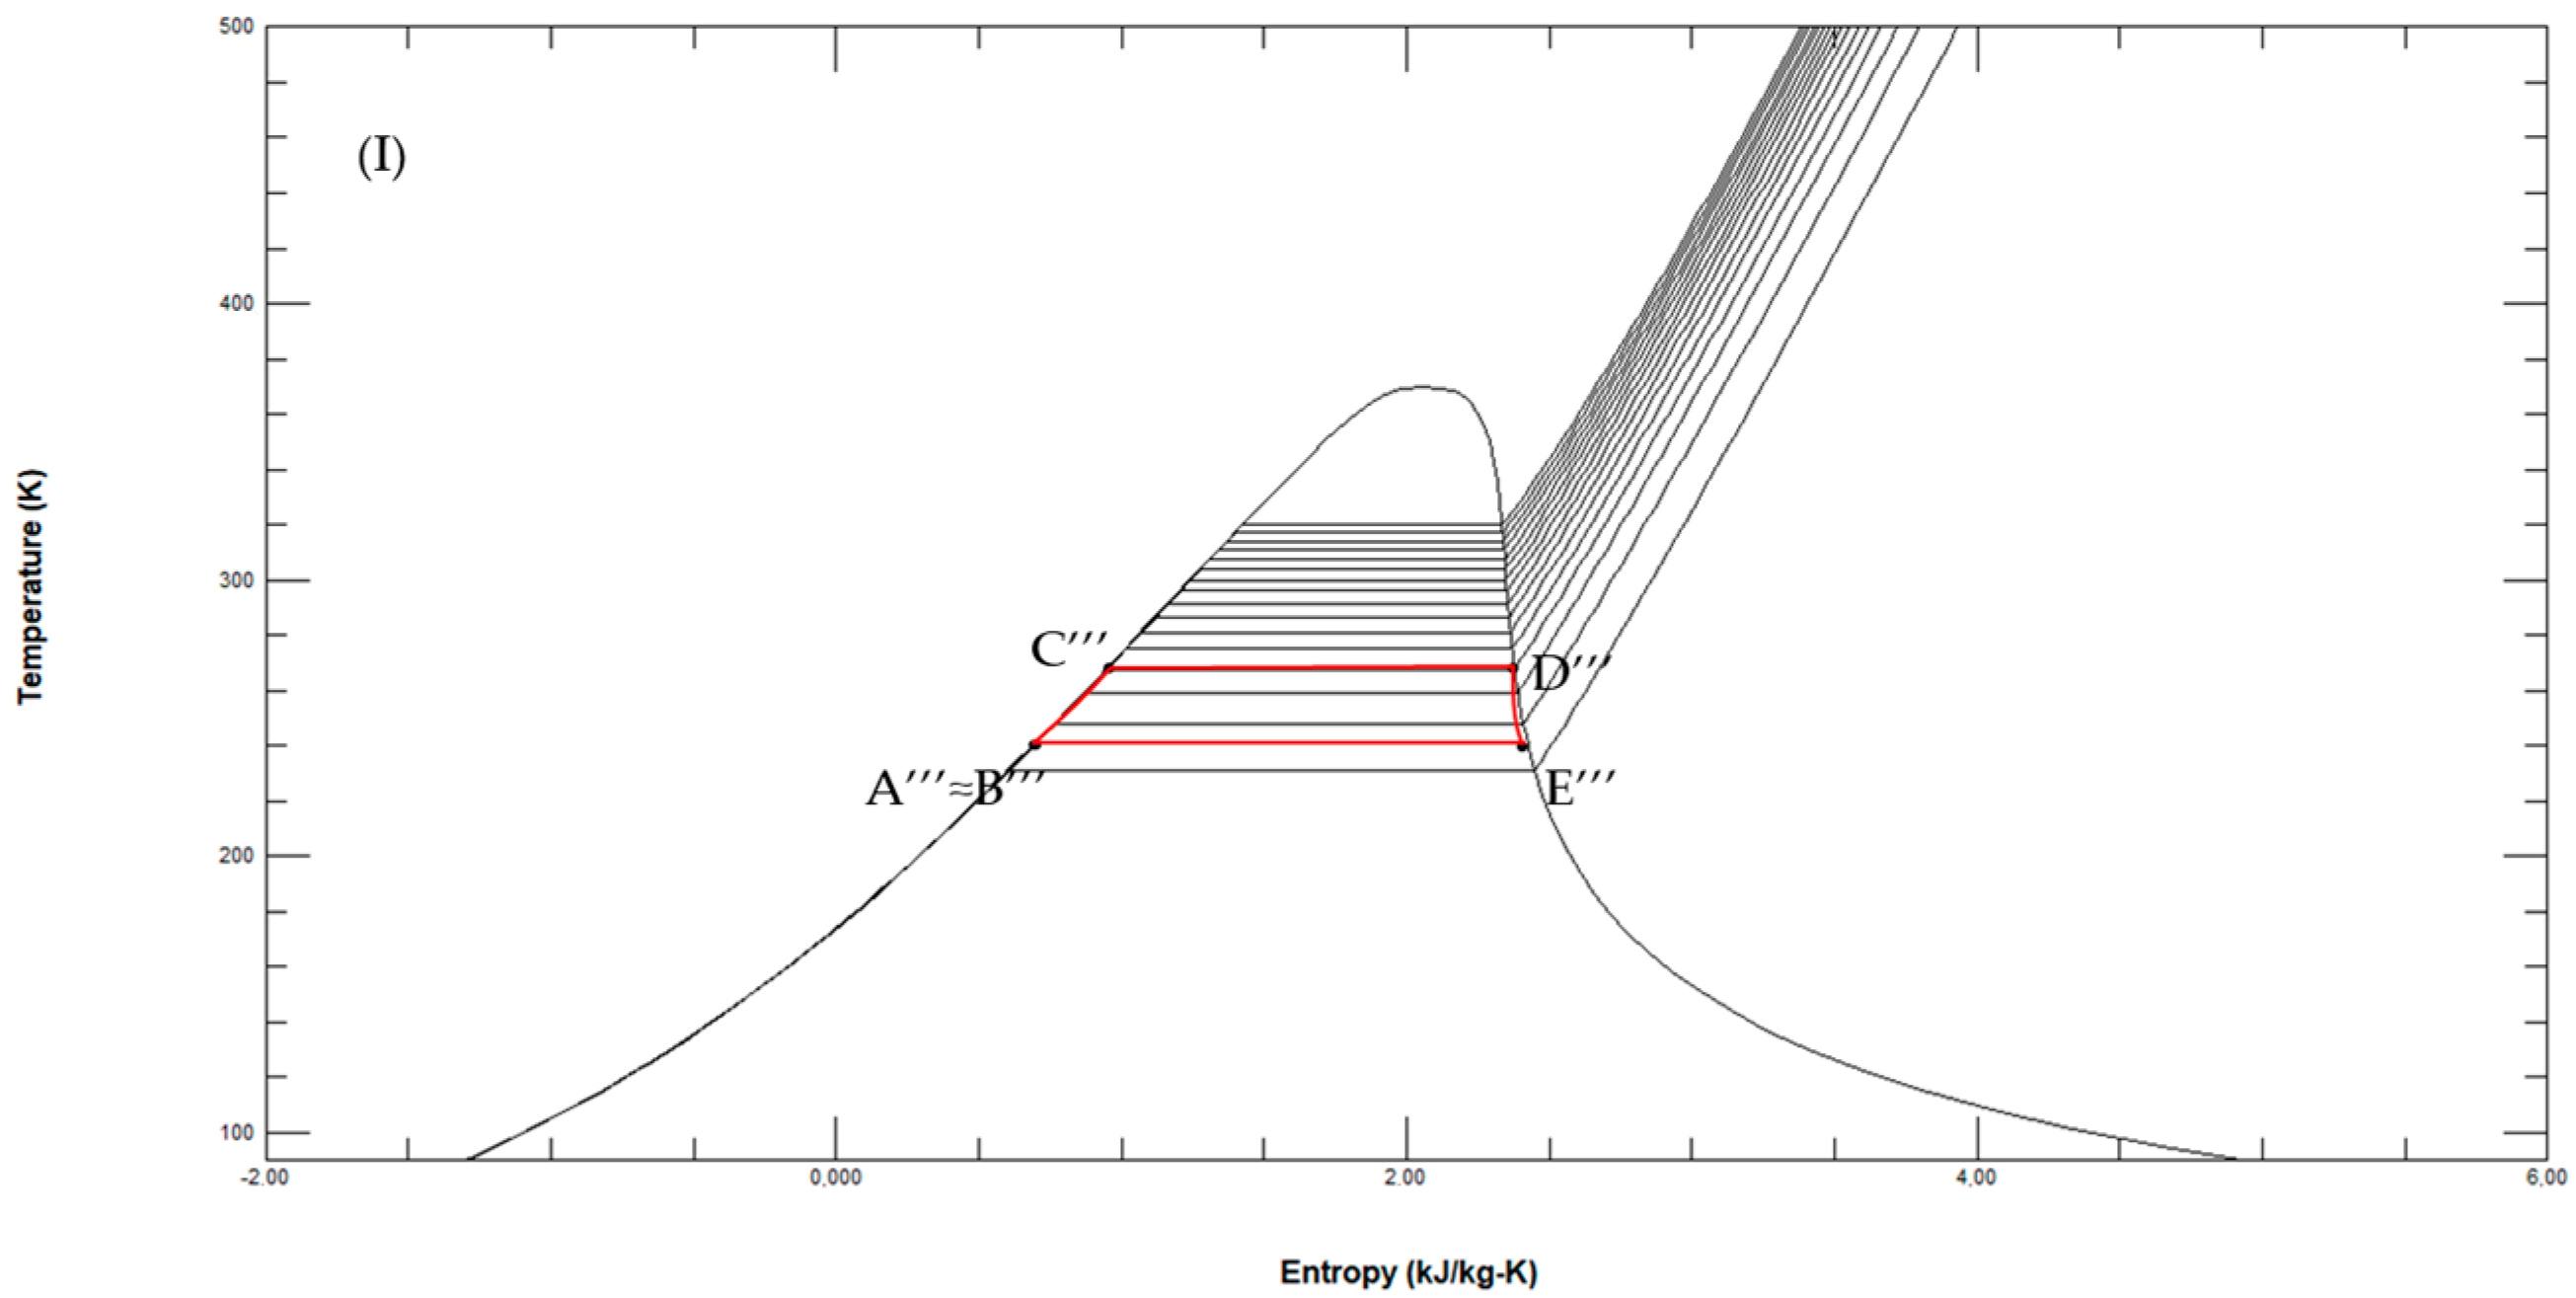
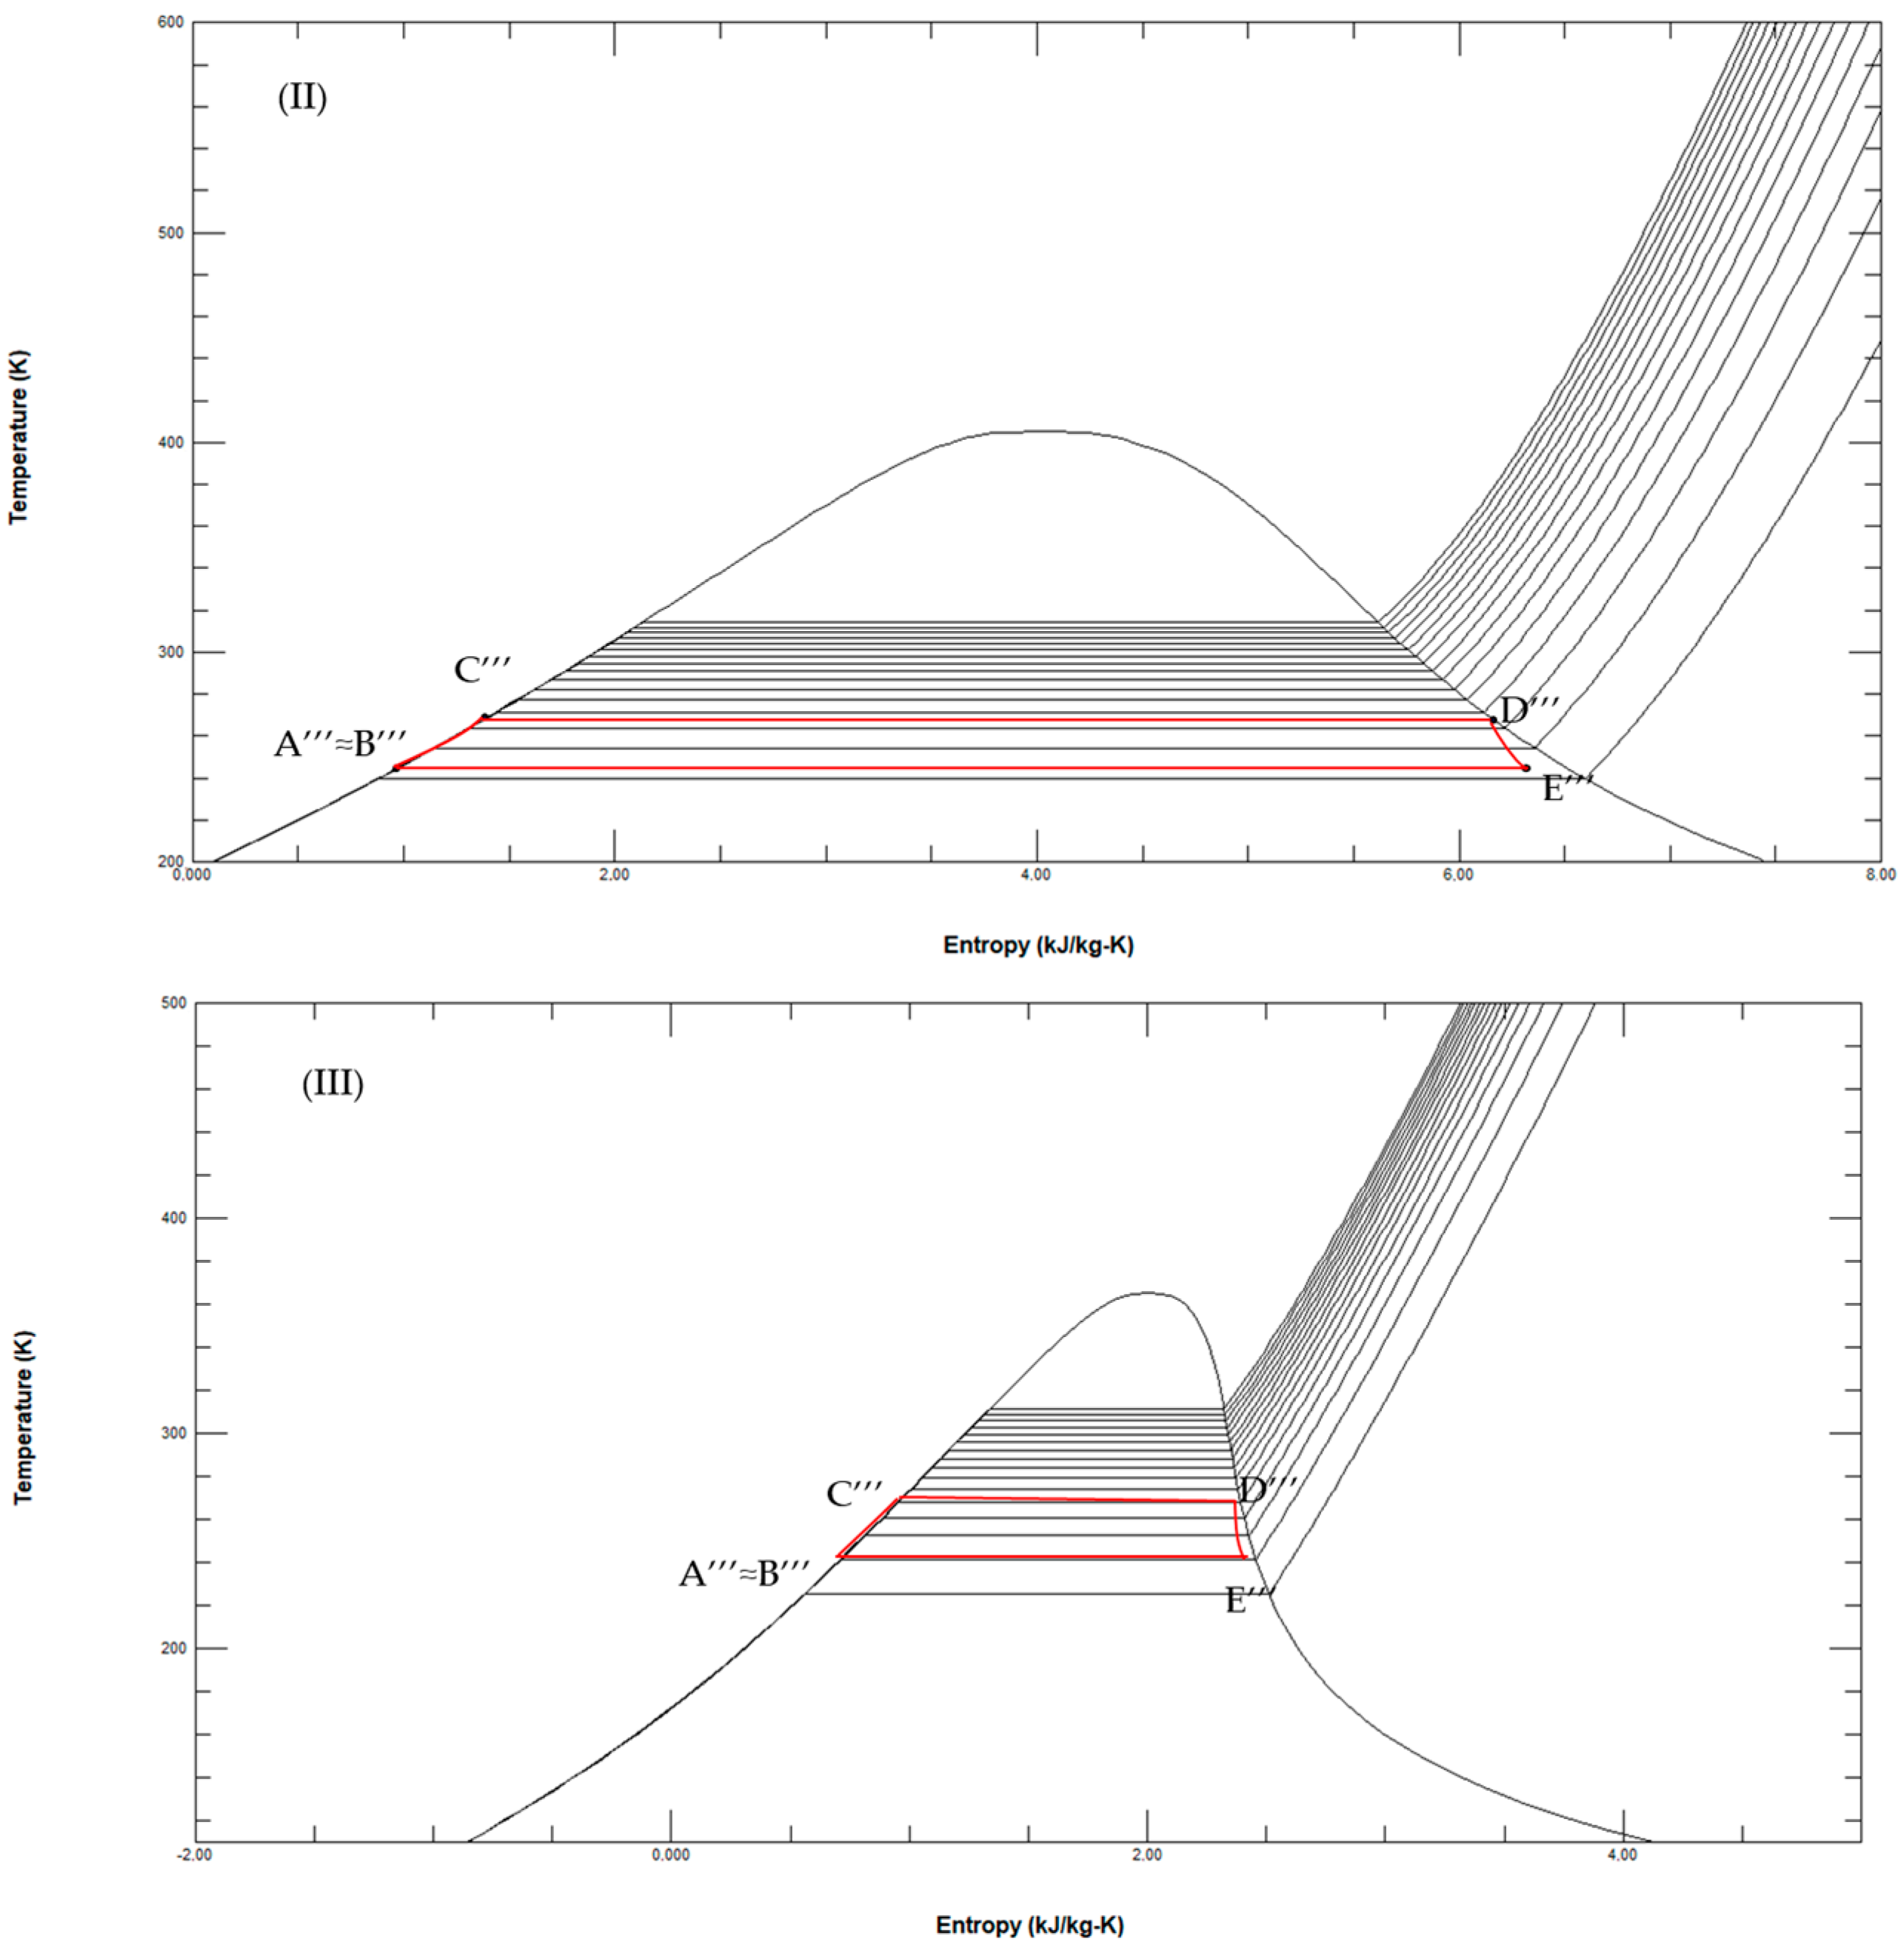
The procedure for calculating the thermodynamic points of the third ORC evolving with the identified suitable working fluid is identical to that seen previously, and the results are listed in Table 7. In Figure 6 the correspondent transformations of the third ORC in the correspondent T-s diagrams are depicted for each fluid.

Table 7.
Thermodynamic points of the third stage ORC with different working fluids.
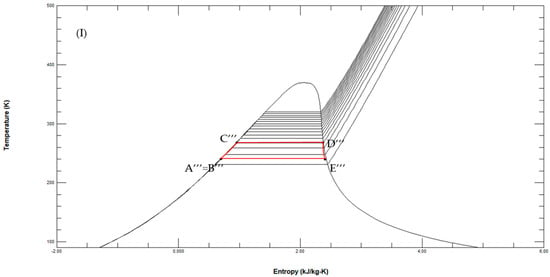
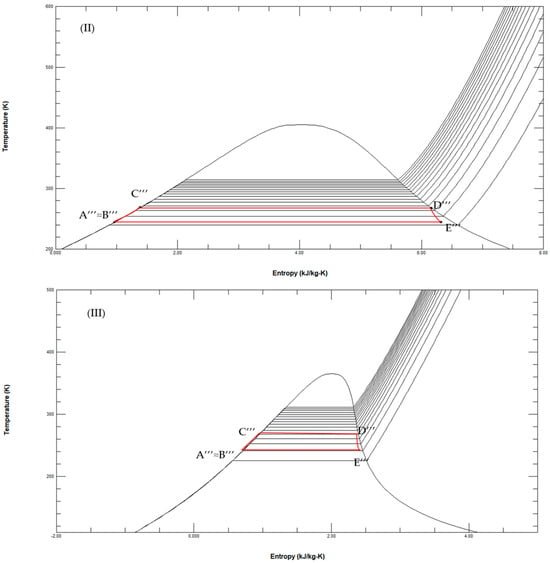
Figure 6.
ORCs in the T-s diagram operating between demineralized water and LNG fueled, respectively, by R290 ((I), reference conditions s0 = 2.2678 kJ/kgK at p0 = 0.01 bar and T0 = 298.15 K), R717 ((II), reference conditions s0 = 5.8719 kJ/kg·K at p0 = 0.11 bar and T0 = 298.15 K) and R1270 ((III), reference conditions s0 = 2.3764 kJ/kg·K at p0 = 0.11 bar and T0 = 298.15 K).
Through the data of Table 7, following Equation (2), the required working fluid flow rates were determined. Successively, the mechanical powers of the turbo-expanders, pumps and net power are attained with Equations (3)–(5), whereas the thermodynamic efficiency and the producible chilled water flow rate were calculated referring to Equations (6) and (7) (with no latent exchange), supposing that the demineralized water is cooled from 291.15 K (18 °C) down to 278.15 K (5 °C).
The results are listed in Table 8 for each working fluid evolving in the bottom cycle: it can be appreciated that, due to the same temperature difference between the thermal sources, the first-law efficiencies are quite similar; it is worth noting that the R717 flow rate is lower in light of the exploitable highest condensation heat. This feature could favor R717 in the third ORC because it also allows for the attainment of a net power slightly greater than that of the other fluids, favored by the lowest pump power, and for greater production of chilled water flow rate (+2%). These results suggest that R717 is thermodynamically more effective than R290 and R1270.

Table 8.
Required flow rates; turbo-expander, pump and net powers producible by the ORC; obtainable chilled water flow rates; and ORC efficiencies with the three considered working fluids.
So, the available chilled water flow rates allow for saving a cooling power of about 350 kW for the AHU cooling coil, enough to passively cool an air flow rate over 10.5 kg/s from 34 °C to 26 °C and simultaneously reducing the humidity ratio from 20 gV/kgDA (g of water vapor per kg of dry air) to 10.5 gV/kgDA.
3.4. Completion of the LNG Regasification Process by IFV
The last transformation is required to bring the regasified LNG from a temperature of 233.15 K (−40 °C) at the ambient temperature by using the free heat source represented by the seawater assumed at 291.15 K (18 °C). Only sensible heat is involved inside the IFV, and by setting the usual pinch point of 10 K, NG at 281.15 K (8 °C) can be obtained. The thermal balance equation allows for calculating the required seawater flow rate imposing the maximum allowed temperature difference of 7 K on the hot side [10]. So, with the average specific heat of natural gas in the considered temperature interval of about 2173.5 J/kg·K [11] being the left constant in light of the achieved limitation of the LNG temperature difference in the IFV, the required seawater flow rate is as follows:
Considering the regasification process made by using exclusively seawater starting from an initial LNG temperature of 113.15 K, a seawater flow rate greater than 3.5 times is required. So, the exploitation of the condensation heat of the working fluids allows for saving a significant share of pumping power. For the proposed system, if a precautional head value of 100 m is set in the IFV, with a mechanical efficiency of 0.95, the required absorbed power is about 45 kW, demonstrating the process is self-sustainable considering that this power can be covered only by the first ORC power output.
3.5. Thermal Performance of the Whole System
From a thermodynamic point of view, the overall system efficiency is determined for the three possible system configurations:
in which only the working fluid of the third ORC can be varied. The thermal input involves not only the condensation powers, but also the thermal power provided by the seawater in the IFV, whereas the required seawater pumping power in the IFV reduces the total output provided by the ORCs. The results highlight that the global efficiency is scarcely influenced by the working fluid evolving in the last ORC, determining a slightly variable value of around 7.30% for each system configuration. Nevertheless, R717 should be preferred over R290 and R1270 for the following reasons:
- -
- The global efficiency is a little bit greater, reaching a maximum of 7.33%;
- -
- The R717 flow rates are 70% lower than the R290 and R1270 flow rates, so the third-stage encumbrance can be limited;
- -
- R717 allows for producing a greater chilled flow rate for the air conditioning plant;
- -
- GWP is favorable;
- -
- It is not flammable.
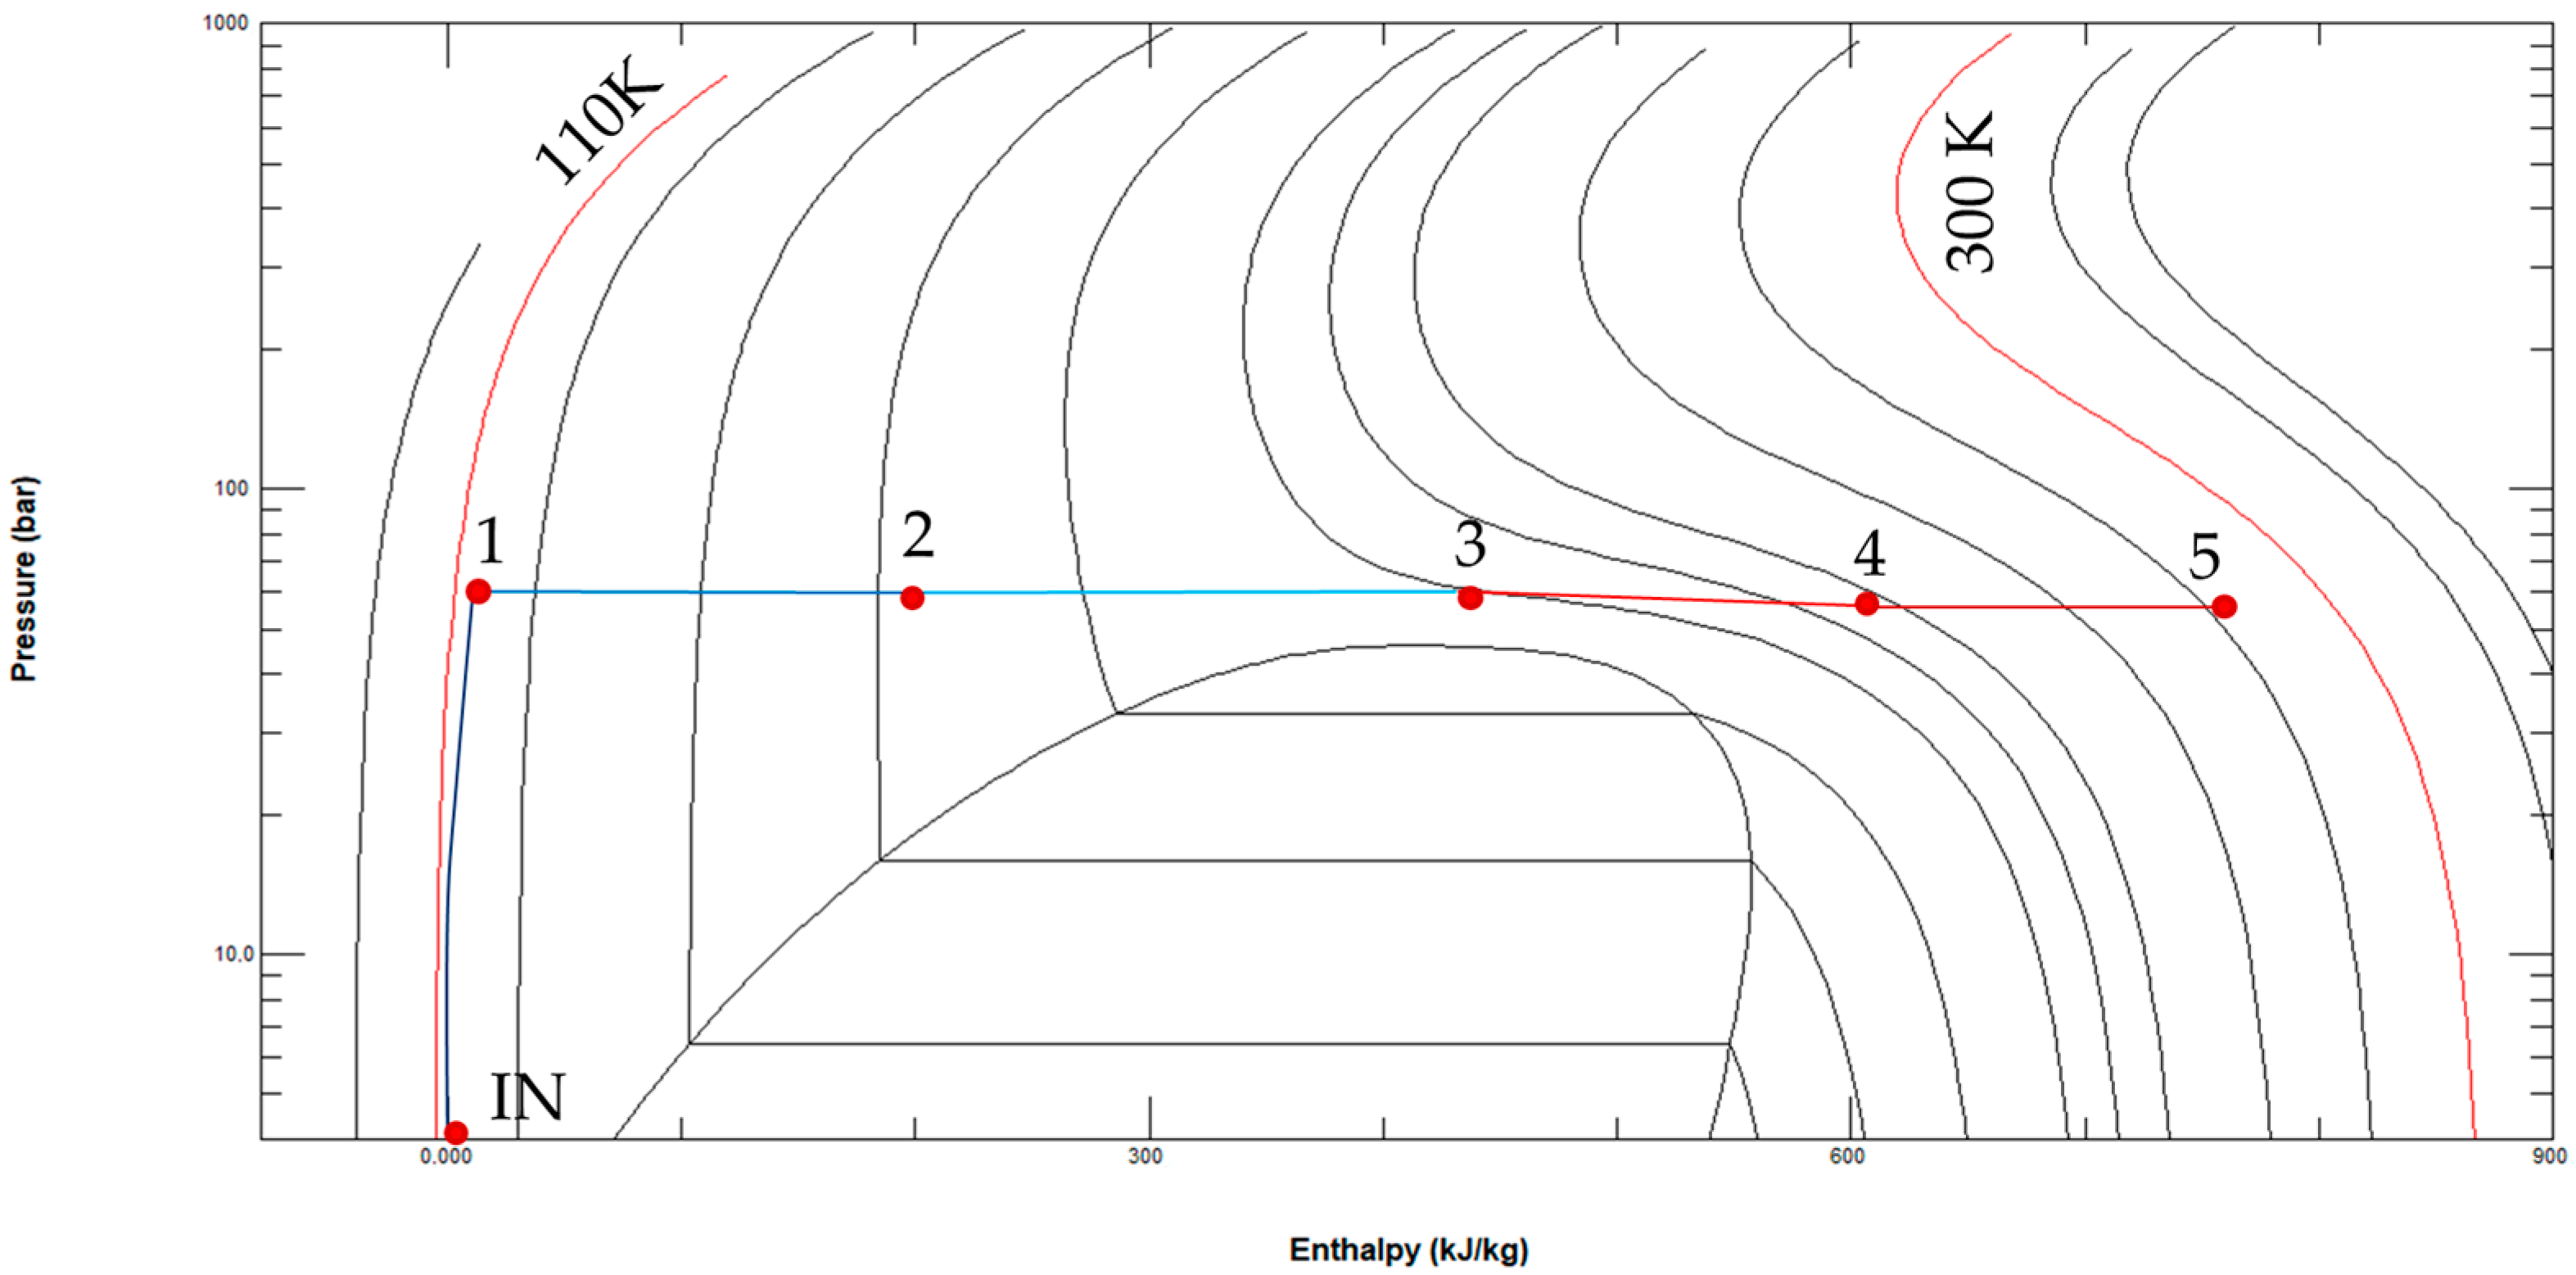
Conversely, it has to be considered that R717 is highly toxic, can potentially be dangerous when inhaled or brought in contact with skin and produces significant damage if dispersed into the sea. Alternatively, R1270 should be preferred over R290 in light of the slight increase in the producible net power and the chilled flow rate. In Figure 7, the transformations subjected from LNG when interacting with the working fluids, assuming R717 in the third stage and seawater in the IFV, are shown in the p-h diagram.
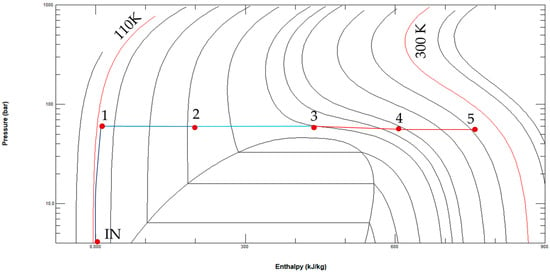
Figure 7.
LNG regasification process achieved by ethylene (1–2), ethane (2–3), ammonia (3–4) and seawater (4–5).
For the assumptions made, the properties of LNG that interact with the working fluids inside the condensers and with the seawater in the IFV are summarized in Table 9:

Table 9.
LNG thermodynamic conditions in the condensers and in the IFV.
4. Discussion: System Optimization and Environmental Impact
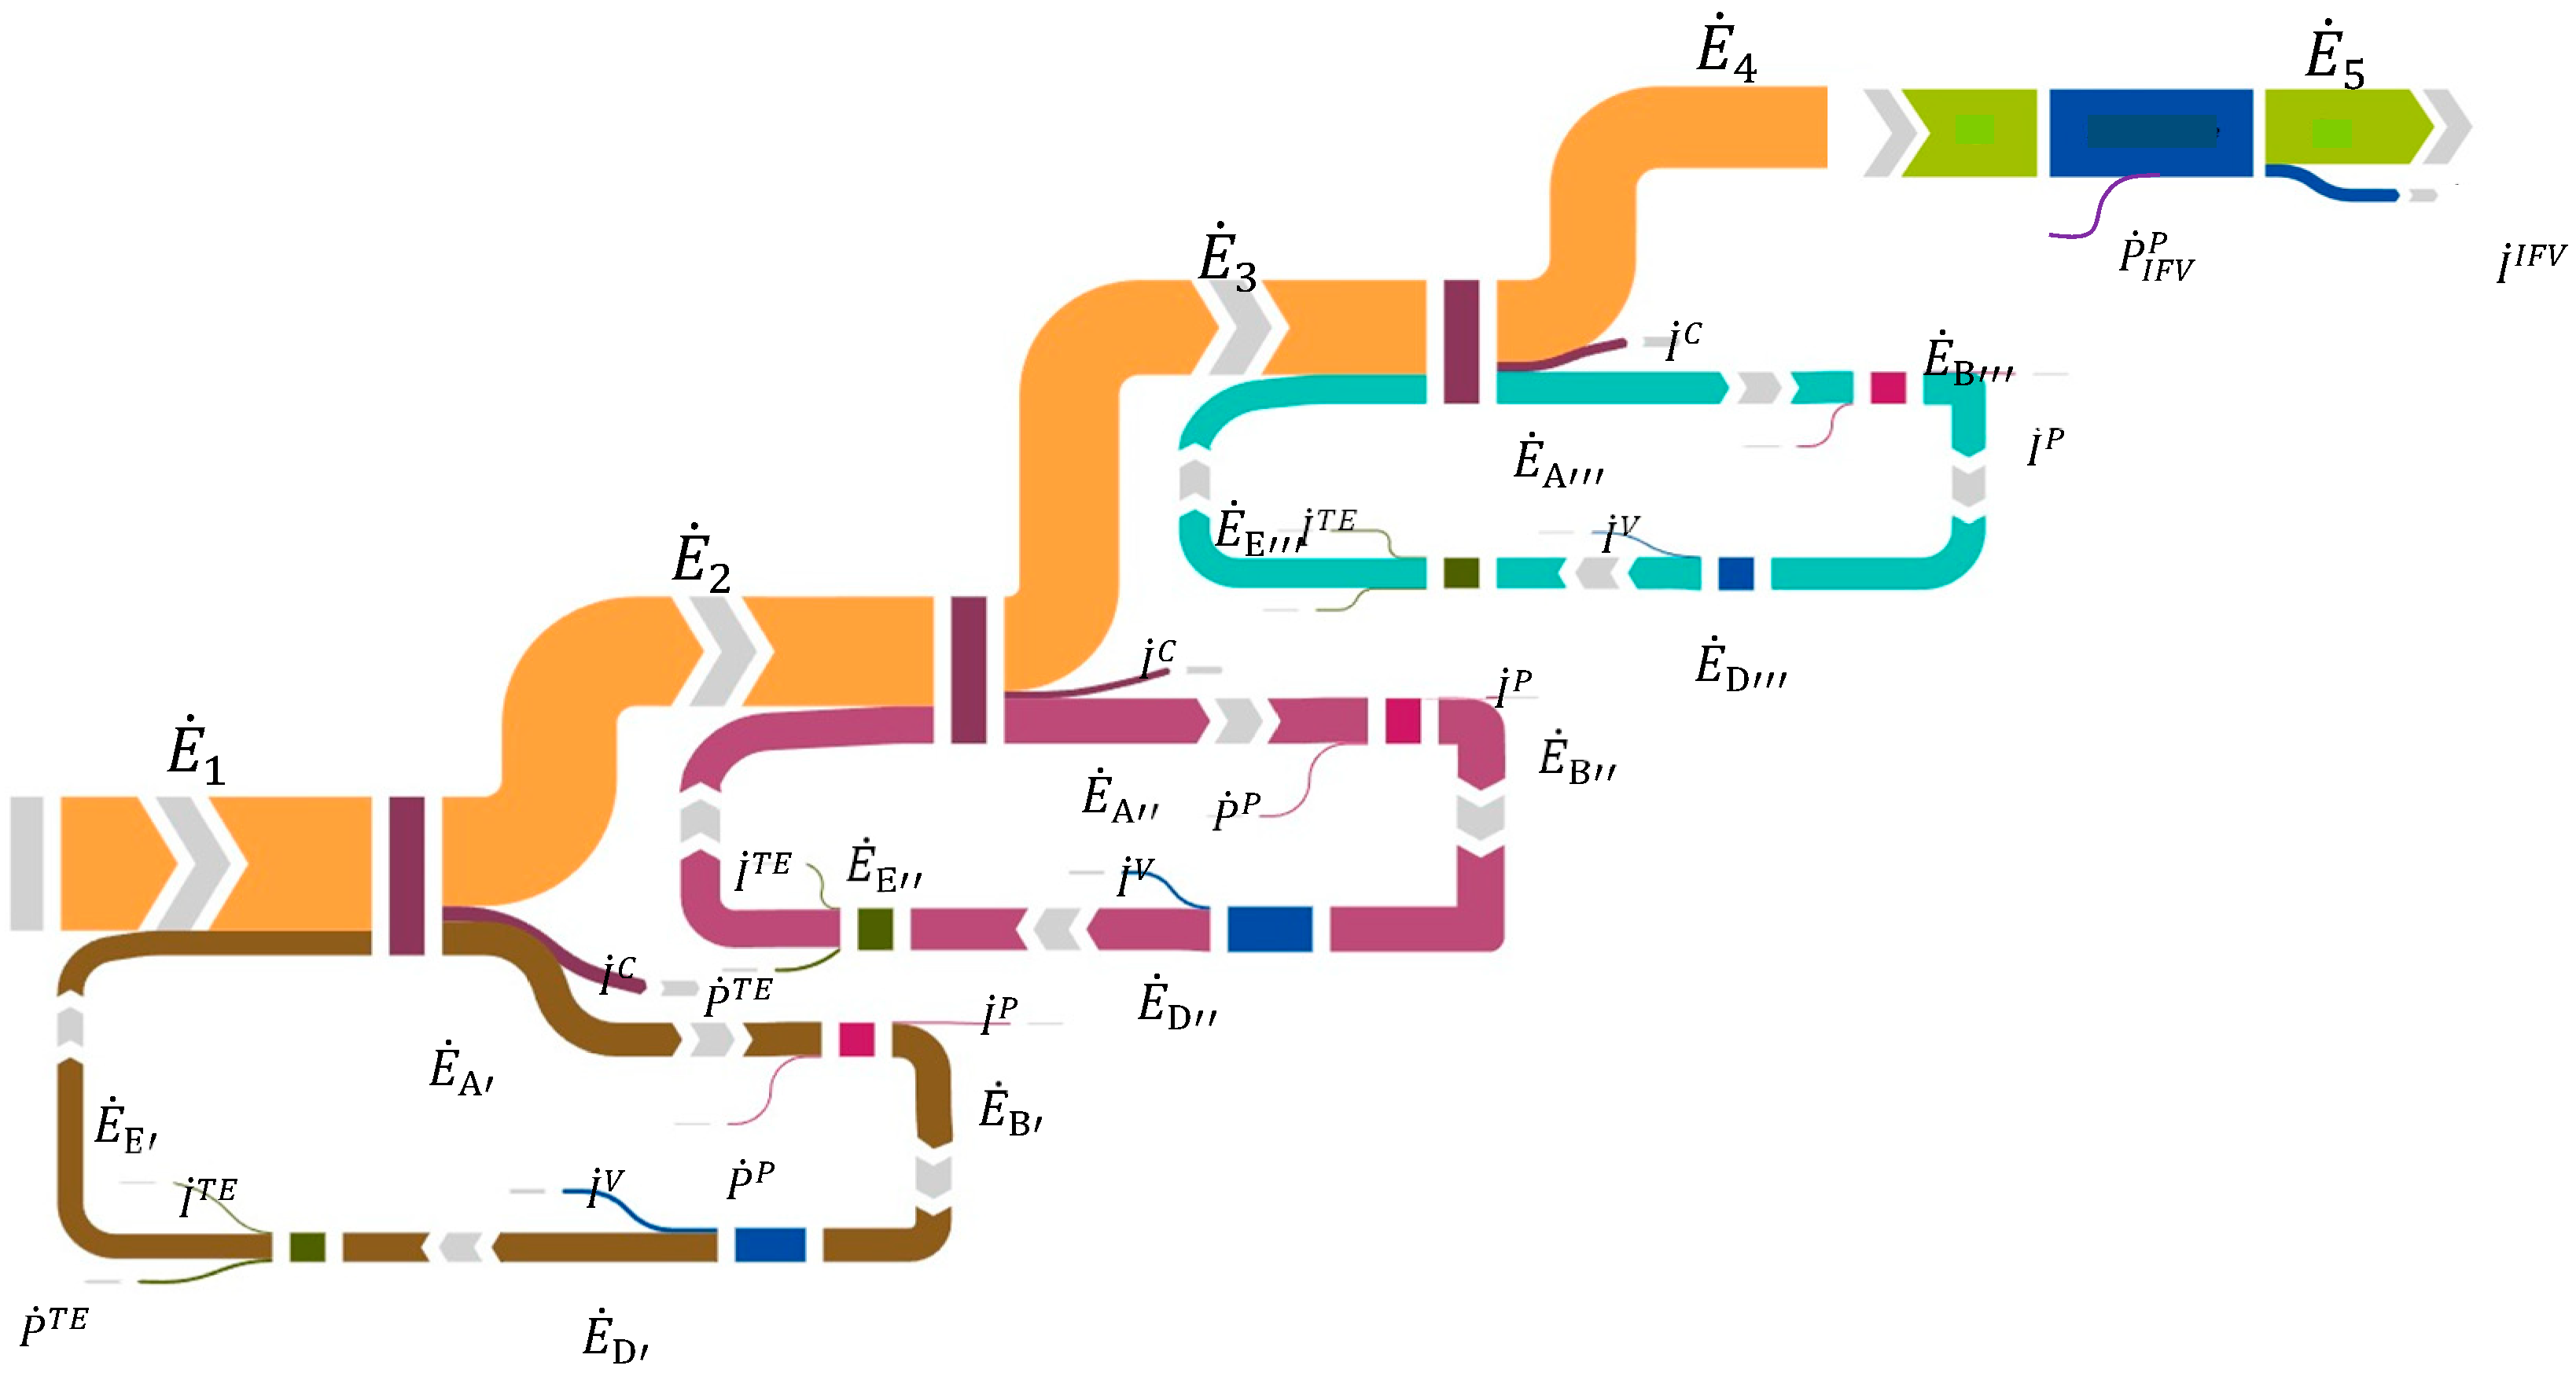
The second-law analysis, carried out by determining the exergy efficiencies and involving the irreversibilities connected with the transformations of the working fluids inside every ORC component, is useful for the system optimization: the lower exergy defect, in fact, corresponds to a limited modification of the external environment due to the irreversibilities reduction [33]. By referring to the Grassman diagram of Figure 8, in which the inlet and outlet exergies of every system crossed by the working fluid are indicated with the same symbology employed for the ORC transformations, associating irreversibility for every component, the global system exergy efficiency can be determined as follows:
in which z indicates that the ORC number is the physical exergy of LNG in the inlet conditions (T = 113.15 K, p = 1.0325 bar), assuming the reference environment at T0 = 291.15 K and p0 = 1.0325 bar. In Table 10, the results obtained from the exergy analysis are determined for the first two cycles, common at all the possible system configurations, highlighting irreversibilities, exergy efficiencies and exergy defects:
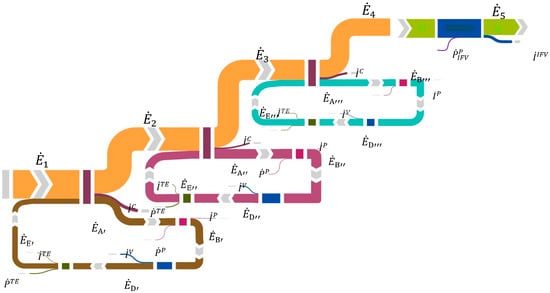
Figure 8.
Grassman diagram related to the proposed system.

Table 10.
Results of the exergy analysis for the components in the first and the second ORC.
It can be appreciated that the second ORC supplied by R170 impacts the environment less than the R1150 cycle in light of the lower share of irreversibilities produced. In particular, R170 benefits from the lower temperature difference in the condenser between the fluids, which reduces the correspondent irreversibilities. Indeed, it is expected that condenser and vaporizer have the greatest value of exergy defect, in light of the unavoidable irreversibilities of the thermal exchange processes. Nevertheless, these values have been determined assuming a pinch point temperature of 10 °C; therefore, better exergy efficiency could be achieved by assuming lower temperature differences among cold and hot streams. But assuming a pinch point temperature tending to a null value, the intrinsic irreversibilities of the process remain, producing instead a drastic increase in exchange surface, which could make the device unfeasible. In any case, repeating the same analysis with a lower pinch point of 5 °C, the efficiency defect reduces only by 2%; therefore, it can be concluded that the margins for the system optimization are quite reduced when modifications on the design of the heat exchangers are undertaken. Also, margins for the system optimization acting on pumps and turbo-expanders are limited: both benefits of the limited entropy differences offered by the working fluids that already produce appreciable exergy efficiencies. Finally, the exergy efficiencies of the vaporizer are null, since seawater has the same temperature as the reference environment (T0); therefore, the thermal power released from the heat source is not considered as a useful effect, with the thermal source already being in equilibrium with the external environment. Conversely, the exergy efficiency of condensers is appreciable in light of the condensation heat recovered to promote the LNG pre-heating. Globally, the first and the second ORC allow for recovering a significant share of the LNG cold exergy: regarding the whole cycle, Table 10 highlights that R1150 indirectly recuperates about 21.5% of the cold potential; R170 does even better, reaching an exergy efficiency of about 28%, benefitting from the greater condensation heat at the condenser. The results reported in Table 11 refer to the second-law analysis for the third ORC as a function of the employed working fluid: again, it can be appreciated that, at a cycle level, R717 allows for limiting the external impact in light of the lowest exergy defect. It is interesting to note that, among the three working fluids, the condenser offers almost the same performance; conversely, the interaction between R717 and seawater in the vaporizer is more performant due to the lowest flow rate evolving in the heat exchanger. Again, more of the 20% of LNG exergy content can be recovered in the bottom cycle, independently from the employed working fluid.

Table 11.
Results of the exergy analysis for the components in the third ORC.
The global exergy efficiencies of the system depicted in Figure 3, as a function of the working fluid evolving in the third ORC and determined by Equation (21), are reported in Table 12. It is worth noting that the exergy efficiency is affected by an abrupt drop, due to the thermal exergy destroyed in the IFV to complete the regasification process. Moreover, the mechanical work absorbed by the IFV pump reduces the useful effect of the system. Anyway, the obtained positive values confirm that the system is feasible because energetically self-sustainable.

Table 12.
Global exergy efficiency and efficiency defect for the three different configurations of the system.
In order to choose the more indicated working fluid in the bottom cycle, an environmental analysis based on the impact factors determined following Equation (18) was carried out by using the risk factors reported in Table 13. The obtained results are listed in Table 14.

Table 13.
Risk factors (Hxyy) indicated by GHS for the considered aspects for every working fluid.

Table 14.
Values of the parameters employed for the calculation of the Environmental Impact factor.
This time, R1270 is safer and more environmentally friendly, benefitting from the highest correction factor fc due to the inexistent danger level concerning skin irritation and aquatic impact. When compared with R717, this aspect prevails on the worst GWP, flow rate ratio and exergy defect. The comparison between R717 and R290 is slight in favor of the first, despite the two working fluids offering a similar score concerning the considered hazard aspects. R717, in fact, benefits from a lower exergy defect and GWP, with the latter effect further amplified by the best ratio between the working fluid and the produced water-chilled flow rates.
Regarding the weaknesses of the proposed system, it has to be noticed that the required equipment must be foreseen opportunely during the design phase, considering the required space in the ship hold that makes the cascade of the three ORCs integrated with the IFV more invasive. This also produces an unavoidable installation cost growth; in any case, the savings related to the limitation of fuel consumption will allow for attaining favorable economic frames.
Indeed, assuming to employ R1270 in the third ORC for environmental reasons and safety aboard, the system with three ORCs in cascade can produce an additional clean net power of about 76 kW: by applying Equation (1), this share allows for saving an LNG flow rate of 162 kg of LNG per day, assuming the sailing mode. Indeed, cruise ships have different operating modalities, such as engines in part-load functioning when docked within the port, maneuvering procedures, and so on, which lead to a different use of the propulsion system. Furthermore, supposing that the freshwater provided by the first ORC is alternatively produced by reverse osmosis, which requires a specific electric consumption of 0.99 kWh/m3 [38], an additional electric consumption of 56.5 kWh per day can be avoided. Regarding the second and third ORC, cooling power, respectively, of 325 kW and 350 kW can be made available, supposing that to alternatively produce this power using a traditional industrial refrigerator with an average seasonal performance index of 3.5 [39], additional electric power of 192 kW can be saved. Globally, with these hypotheses, every hour, electric consumption of about 270 kWh can be saved and, considering gas cogenerators (widespread in cruise ships for energy supply) with an emission factor of 0.244 kgCO2/kWh [40], almost 66 kg of CO2 per hour is avoided.
It has to be noted that the proposed solution has a large potential in applicability and diffusion due to the employment of technologies (the ORCs) that take advantage of over 40 years of experience in installation and safety aspects. Furthermore, the system could be also suitable for retrofitting conventional propulsion plants driven by LNG, allowing for reducing consumption and thermal pollution, further aspects that favor the applicability for responding to the challenges offered by climatic changes in the marine sector.
Regarding the economic aspects, considering that the ORC cost of 4000 EUR/kWe [41] for the considered size is negligible when compared with the global cost of a cruise ship’s assembly, the LNG saving allows for achieving a favorable economic frame considering that, on average, the refueling requires 250 tons of LNG per day, as a function of the vessel size, with a propellant expense of over EUR 100,000 per day [42].
5. Conclusions
It has been stated that LNG is perfectly suited as a clean fuel in shipping because it is compliant with the recent regulations promulged by the International Maritime Organization (IMO) to reduce pollutant emissions. LNG is stored at atmospheric pressure aboard green ships at the cryogenic temperature of 113 K and then regasified through vaporizers supplied by the free seawater. However, this procedure discharges the LNG cold exergy into the sea, promoting thermal pollution and increasing the ship’s environmental impact. In order to improve the ecological footprint, the recovery of part of the LNG cold potential to cover other ship’s energy needs is highly recommended. The most obvious application is the use of LNG and seawater, respectively, as cold and hot sources supplying cryogenic power cycles (organic Rankine cycles) to produce clean power. Moreover, the condensation heat of the ORC working fluids allows for pre-heating LNG, whereas the vaporization heat can produce chilled water flow rates for other ship demands. Considering that LNG offers a large temperature variation interval, different ORCs in cascade can be rationally planned; therefore, in this study, three ORC configurations, virtually identical in implementation but not in the employed working fluids and purposes, were investigated. This study highlighted that for the considered temperature intervals and setting adequate pressure levels, ethylene (R1150) can be used in the first ORC to produce freshwater by a freezing process, and ethane (R170) in the second one for ice production in sub-zero refrigeration, whereas propane (R290), ammonia (R717) and propylene (R1270) can be used in the third ORC for air conditioning applications. Despite a great amount of thermal exergy being discharged into the sea to complete the regasification process, a second-law analysis confirmed the solution is feasible in light of global exergy efficiency values of slightly over 5%. From a thermodynamic point of view, R717 is more recommended in the third ORC than R290 and R1270; conversely, a novel environmental analysis, which combines exergy defect, GWP and some risk factors of the working fluids for passengers and marine environment, showed that propylene (R1270) is more environmentally friendly and safer aboard. Through the use of R1270 in the last ORC, the system is able to produce the following results:
- -
- An additional net electric power of almost 76 kW;
- -
- The completion of the LNG regasification process;
- -
- 57 m3 of freshwater and 57,000 kg of ice at −5 °C per day by recovering cooling powers from the condensers of the first and the second ORC;
- -
- Another 350 kW of cooling power for the air-conditioning of indoor spaces aboard from the last ORC;
- -
- An LNG flow rate saving of 162 kg per day, representing almost 65% of the required propellant, by generating an economy of over EUR 100,000 per day;
- -
- Avoided CO2 emissions of 66 kg for every hour of ship operation in the sailing mode;
- -
- Marine thermal pollution is reduced by 3.5 times through the recovery of the condensation heat of the working fluids to promote LNG pre-heating.
The proposed system combines three ORC cycles to rationally exploit the available temperature difference between hot and cold sources by reducing the intrinsic irreversibilities connected with the heat exchange processes. Similar plant configurations have not been explored in the pertinent literature; thereby, this document covers an evident research gap in the sector of marine transportation. It has large potential in applicability and diffusion due to the employment of consolidated technologies (the ORCs) ensuring safety and reliability. Last but not least, despite the process being driven by a fossil source, the proposed system is highly sustainable and environmentally friendly, reducing marine thermal pollution, generating electrical power and products with elevated added value without combustion, avoiding the emission of pollutants in the external environment, and respecting passengers’ safety, further aspects that favor the applicability for responding to the challenges offered by climatic changes.
Author Contributions
Conceptualization, R.B. and P.B. (Piero Bevilacqua); methodology, V.F.; software, P.B. (Piofrancesco Barone); validation, P.B. (Piofrancesco Barone) and V.F.; formal analysis, R.B.; investigation, P.B. (Piofrancesco Barone); resources, V.F.; writing—original draft preparation, R.B. and V.F.; writing—review and editing, V.F.; visualization, P.B. (Piero Bevilacqua); supervision, V.F. and R.B. All authors have read and agreed to the published version of the manuscript.
Funding
This research received no external funding.
Institutional Review Board Statement
Not applicable.
Informed Consent Statement
Not applicable.
Data Availability Statement
Data will be provided on request.
Conflicts of Interest
The authors declare no conflicts of interest.
Nomenclature
| Symbols/Acronyms | |
| c | Specific heat [kJ/kgK] |
| Physical exergy [kW] | |
| EI | Environmental index [-] |
| fc | Correction factor |
| GS | Green ship |
| GWP | Global warming potential |
| h | Specific enthalpy [kJ/kg] |
| Irreversibility [kW] | |
| IFV | Intermediate fluid vaporizer |
| Power [kW] | |
| LHV | Lower heating value [kJ/kg] |
| Mass flow rate [kg/s] | |
| ODP | Ozone depletion potential |
| Electric power [kW] | |
| p | Pressure [bar] |
| Thermal power [kW] | |
| s | Specific entropy [kJ/kgK] |
| Entropy [W/K] | |
| T | Temperature [K] |
| yy | Risk level |
| Subscripts/Superscripts | |
| 0 | Reference conditions |
| C | Condenser |
| Cyc | Cycle |
| el | Electric |
| ex | Exergy |
| freez | Water solidification point |
| H2O | Liquid water |
| i | Working fluid evolving in the third cycle |
| ice | Water in a solid phase |
| in | Inlet |
| k | Risk aspect |
| LNG | Liquefied natural gas |
| mec | Mechanic |
| NET | Net |
| ORC | Organic Rankine cycle |
| out | Outlet |
| P | Pump |
| R | Real |
| Sys | System |
| TE | Turbo-expander |
| TOT | Total |
| V | Vaporizer |
| wf | Working fluid |
| z | ORC number |
| Greek Symbols | |
| δ | Exergy defect |
| ε | Specific exergy [kJ/kg] |
| η | Thermodynamic efficiency |
| Λ | Solidification latent heat [kJ/kg] |
| Ψ | Exergy efficiency |
References
- The Society for Gas as a Marine Fuel Gas as a Marine Fuel: An Introductory Guide. Available online: https://www.sgmf.info/assets/docs/sgmf-guide.pdf/ (accessed on 1 July 2024).
- International Maritime Organization. Available online: https://www.imo.org/ (accessed on 1 July 2024).
- DNV GL, Global Sulphur Cap. Available online: https://www.dnv.com/maritime/global-sulphur-cap/ (accessed on 1 July 2024).
- Yugo, M.; Soler, A. A look into the role of e-fuels in the transport system in Europe (2030–2050). Concawe Rev. 2019, 28, 4–22. [Google Scholar]
- Balcombe, P.; Staffell, I.; Kerdan, I.G.; Speirs, J.F.; Brandon, N.P.; Hawkes, A.D. How can LNG-fuelled ships meet decarbonisation targets? An environmental and economic analysis. Energy 2021, 227, 120462. [Google Scholar] [CrossRef]
- Iannaccone, T.; Landucci, G.; Tugnoli, A.; Salzano, E.; Cozzani, V. Sustainability of cruise ship fuel systems: Comparison among LNG and diesel technologies. J. Clean. Prod. 2020, 260, 121069. [Google Scholar] [CrossRef]
- Union International Gas World LNG Report; European University Institute: Fiesole, Italy, 2012; pp. 2–5.
- Thomas, S.; Dawe, R.A. Review of ways to transport natural gas energy from countries which do not need the gas for domestic use. Energy 2003, 28, 1461–1477. [Google Scholar] [CrossRef]
- Yao, S.; Shen, X.; Yang, Z.; Feng, G.; Xiao, M. Design and optimization of LNG vaporization cold energy comprehensive utilization system based on a novel intermediate fluid vaporizer. Appl. Therm. Eng. 2021, 190, 116785. [Google Scholar] [CrossRef]
- Oliveti, G.; Arcuri, N.; Bruno, R.; De Simone, M. A rational thermodynamic use of liquefied natural gas in a waste incinerator plant. Appl. Therm. Eng. 2012, 35, 134–144. [Google Scholar] [CrossRef]
- Arcuri, N.; Bruno, R.; Bevilacqua, P. LNG as cold heat source in OTEC systems. Ocean Eng. 2015, 104, 349–358. [Google Scholar] [CrossRef]
- Ong, C.W.; Chen, C.L. Technical and economic evaluation of seawater freezing desalination using liquefied natural gas. Energy 2019, 181, 429–439. [Google Scholar] [CrossRef]
- Wang, P.; Chung, T.S. A conceptual demonstration of freeze desalination-membrane distillation (FD-MD) hybrid desalination process utilizing liquefied natural gas (LNG) cold energy. Water Res. 2012, 46, 4037–4052. [Google Scholar] [CrossRef]
- Xia, G.; Sun, Q.; Cao, X.; Wang, J.; Yu, Y.; Wang, L. Thermodynamic analysis and optimization of a solar-powered transcritical CO2 (carbon dioxide) power cycle for reverse osmosis desalination based on the recovery of cryogenic energy of LNG (liquefied natural gas). Energy 2014, 66, 643–653. [Google Scholar] [CrossRef]
- Williams, P.M.; Ahmad, M.; Connolly, B.S.; Oatley-Radcliffe, D.L. Technology for freeze concentration in the desalination industry. Desalination 2015, 356, 314–327. [Google Scholar] [CrossRef]
- Xie, C.; Zhang, L.; Liu, Y.; Lv, Q.; Ruan, G.; Hosseini, S.S. A direct contact type ice generator for seawater freezing desalination using LNG cold energy. Desalination 2018, 435, 293–300. [Google Scholar] [CrossRef]
- Mtombeni, T.; Maree, J.P.; Zvinowanda, C.M.; Asante, J.K.O.; Oosthuizen, F.S.; Louw, W.J. Evaluation of the performance of a new freeze desalination technology. Int. J. Environ. Sci. Technol. 2013, 10, 545–550. [Google Scholar] [CrossRef]
- Buchsbaum, N.N. Process and Apparatus for Water Purification. US Patent 8696916, 15 April 2014. [Google Scholar]
- Liu, M.; Wu, D.; Tsolakis, A.; Gao, W. A waste cryogenic energy assisted freshwater generator for marine applications. Desalination 2021, 500, 114898. [Google Scholar] [CrossRef]
- Salakhi, M.; Eghtesad, A.; Afshin, H. Heat and mass transfer analysis and optimization of freeze desalination utilizing cold energy of LNG leaving a power generation cycle. Desalination 2022, 527, 115595. [Google Scholar] [CrossRef]
- Lin, W.; Huang, M.; Gu, A. A seawater freeze desalination prototype system utilizing LNG cold energy. Int. J. Hydrogen Energy 2017, 42, 18691–18698. [Google Scholar] [CrossRef]
- Ahn, J.; Park, S.H.; Jeong, J.; Lee, S.; Ryu, J.; Park, J. Eco-efficient marine power system with cooled air ventilation by waste LNG cold energy for reefer holds in an ultra-large container ship. J. Clean. Prod. 2021, 322, 129037. [Google Scholar] [CrossRef]
- Ayou, D.S.; Eveloy, V. Energy, exergy and exergoeconomic analysis of an ultra low-grade heat-driven ammonia-water combined absorption power-cooling cycle for district space cooling, sub-zero refrigeration, power and LNG regasification. Energy Convers. Manag. 2020, 213, 112790. [Google Scholar] [CrossRef]
- Pan, J.; Li, M.; Li, R.; Tang, L.; Bai, J. Design and analysis of LNG cold energy cascade utilization system integrating light hydrocarbon separation, organic Rankine cycle and direct cooling. Appl. Therm. Eng. 2022, 213, 118672. [Google Scholar] [CrossRef]
- Ayou, D.S.; Eveloy, V. Sustainable multi-generation of district cooling, electricity, and regasified LNG for cooling-dominated regions. Sustain. Cities Soc. 2020, 60, 102219. [Google Scholar] [CrossRef]
- VV.AA. REFPROP Documentation. Available online: https://www.nist.gov/system/files/documents/2018/05/23/refprop10a.pdf (accessed on 1 July 2024).
- F-Chart-Software EES: Engineering Equation Solver|F-Chart Software: Engineering Software. F-Chart Softw. 2018, 2012, 6–8.
- Otsuka, T. Evolution of an LNG terminal: Senboku Terminal of Osaka gas. Int. Gas Union World Gas Conf. Pap. 2006, 5, 2617–2630. [Google Scholar]
- Settino, J.; Morrone, P.; Algieri, A.; Sant, T.; Micallef, C.; Farrugia, M.; Spitieri-Staines, C.; Licari, J.; Micallef, A. Integration of an Organic Rankine Cycle and a Photovoltaic Unit for Micro-Scale CHP Applications in the Residential Sector. Energy Procedia 2017, 126, 597–604. [Google Scholar] [CrossRef]
- Darwish, M.A.; Al Awadhi, F.M.; Bin Amer, A.O. Combining the nuclear power plant steam cycle with gas turbines. Energy 2010, 35, 4562–4571. [Google Scholar] [CrossRef]
- Rodríguez, L.E.; Hoch, R. Turboexpander Repair and Maintenance for Sustained Performance and Profitability. Available online: https://files.chartindustries.com/LATfeature1.pdf/ (accessed on 1 July 2024).
- Saengsikhiao, P.; Taweekun, J.; Maliwan, K.; Article, R. Investigation and Analysis of Green Refrigerant Zero ODP as an Alternative Refrigerant Lower Cost and GWP. Res. Sq. 2021. [Google Scholar] [CrossRef]
- Nicoletti, G.; Bruno, R.; Bevilacqua, P.; Arcuri, N.; Nicoletti, G. A second law analysis to determine the environmental impact of boilers supplied by different fuels. Processes 2021, 9, 113. [Google Scholar] [CrossRef]
- European Parliament. CE Rules of the European Parliament N° 1272/2008 for the Labelling of Hazardous Substances; European Parliament: Strasbourg, France, 2008; Volume 2008. [Google Scholar]
- VV.AA. COSTA SMERALDA, The Ship for the Responsible Innovation; Costa Cruises; Genoa, Italy, 2023. [Google Scholar]
- Cravalho, E.G.; McGrath, J.J.; Toscano, W.M. Thermodynamic analysis of the regasification of LNG for the desalination of sea water. Cryogenics 1977, 17, 135–139. [Google Scholar] [CrossRef]
- Algieri, A.; Morrone, P. Thermo-economic investigation of solar-biomass hybrid cogeneration systems based on small-scale transcritical organic Rankine cycles. Appl. Therm. Eng. 2022, 210, 118312. [Google Scholar] [CrossRef]
- Kim, J.; Park, K.; Yang, D.R.; Hong, S. A comprehensive review of energy consumption of seawater reverse osmosis desalination plants. Appl. Energy 2019, 254, 113652. [Google Scholar] [CrossRef]
- Erdemir, D.; Altuntop, N.; Çengel, Y.A. Experimental investigation on the effect of ice storage system on electricity consumption cost for a hypermarket. Energy Build. 2021, 251, 111368. [Google Scholar] [CrossRef]
- Agency, I.E. Emission Factors. Available online: https://iea.blob.core.windows.net/assets/26122570-1a31-4c25-b8a9-51be776ee6c6/IEA_Methodology_Emission_Factors.pdf/ (accessed on 1 July 2024).
- Pantaleo, A.M.; Simpson, M.; Rotolo, G.; Distaso, E.; Oyewunmi, O.A.; Sapin, P.; De Palma, P.; Markides, C.N. Thermoeconomic optimisation of small-scale organic Rankine cycle systems based on screw vs. piston expander maps in waste heat recovery applications. Energy Convers. Manag. 2019, 200, 112053. [Google Scholar] [CrossRef]
- VV.AA. Ship&Bunker. Available online: https://shipandbunker.com/about/about-sb-prices (accessed on 1 July 2024).
Disclaimer/Publisher’s Note: The statements, opinions and data contained in all publications are solely those of the individual author(s) and contributor(s) and not of MDPI and/or the editor(s). MDPI and/or the editor(s) disclaim responsibility for any injury to people or property resulting from any ideas, methods, instructions or products referred to in the content. |
© 2024 by the authors. Licensee MDPI, Basel, Switzerland. This article is an open access article distributed under the terms and conditions of the Creative Commons Attribution (CC BY) license (https://creativecommons.org/licenses/by/4.0/).

