1. Introduction
The main goal of an efficiency evaluation is to analyze a process’s efficiency relative to alternative approaches and pathways. Thus, it serves as a decision-making aid for operators, developers, and customers. The primary objective of technical applications is to identify optimization capabilities and derive specific recommended actions [
1,
2,
3,
4,
5].
Various evaluation methods have been developed over time as process efficiency has grown in importance, partly because of climate change. This has resulted in a large number of evaluation indicators, so-called benchmarks or key performance indicators (KPI), some of which are specific to certain industries, sectors, processes, or companies [
1,
5,
6,
7,
8].
Since so many benchmarks exist, identifying the best possible efficiency evaluation strategy is a significant challenge. The lack of standard efficiency evaluations causes difficulties, especially when assessing integrated technologies, such as power-to-X (P2X). P2X is the collective term for all sector coupling technologies. The primary goal is to convert green electrical energy into products from different sectors such as fuels (mobility), chemical feedstocks such as hydrogen, methane, or methanol, as well as alternative energy sources for the flexible conversion of renewable energy into heat and electricity. P2X, thus, offers the potential to decarbonize even those sectors that cannot be electrified.
P2X offers a variety of utilization paths that are not comparable with each other based on existing sector-specific evaluation indicators, and thus, can hardly be evaluated comprehensively. Based on existing indicators, the efficiency of biological hydrogen production, for example, cannot be compared with the efficiency of water electrolysis, even though both processes result in the same product. For this reason, P2X is very versatile, and individual processes vary in complexity in terms of implementation and evaluation.
Various review articles on efficiency assessment already provide an overview of the multitude of existing methods and metrics. For example, M. Colla et al. [
5] compare different efficiency assessment methods for energy projects. P. Wenzel et al. [
9] focus on efficiency assessment in power plant engineering, specifically cooling towers. E. Domínguez et al. [
2] identify different key performance indicators and provide an important approach for classification. In this paper, we summarize the results of previous review articles without setting a direct limit of applicability. In contrast to existing papers, this article does not limit its application to the energy or management sectors, and thus, includes physical, ecological, and economic indicators.
This literature review examines performance indicators and benchmarks’ past and present status. The benchmarks are classified and exploited regarding their applicability and significance for different phases and goals of the efficiency evaluation. The suitability of the identified benchmarks and indicators for a comprehensive assessment of P2X systems is determined.
In the
Section 1, a systematic literature review was conducted. The
Section 2 contains a detailed description of the libraries, search terms, and criteria used. A list of all key figures identified during the research is provided.
Section 3 defines the criteria for evaluating the suitability of the identified methods and benchmarks for evaluating P2X systems. A scoring system is defined for the evaluation of the metrics to verify the suitability of the respective metrics in a transparent and comprehensible manner. Based on these criteria, the evaluation of the metrics is carried out in
Section 4 with the help of an evaluation matrix. For this purpose, three different levels are defined, depending on the objective of the efficiency evaluation, in which the criteria are weighted according to the evaluation objective. In addition, uncertainties and the transferability of the method used for other efficiency assessment objectives are addressed.
Section 5 presents the evaluation results in a heat map showing the most appropriate metrics for each level. The basics of the most appropriate efficiency evaluation methods are summarized in
Section 6. In addition, the results and uncertainties of the evaluation are discussed. The shortcomings and interactions of different assessment approaches are discussed, and a possible approach for a holistic assessment is proposed.
2. Materials and Methods
A systematic literature review was conducted to provide a comprehensive overview of the current status of evaluation methods and indicators.
2.1. Keywords and Bibliography
The keywords were selected based on the research task and validated during the review of the search results. Their relevance to the intended purpose was considered. Keywords that predominantly led to articles that compared different technologies’ efficiency based on a defined metric (e.g., the addition of “power-to-X” or “energy systems integration”) were eliminated based on the exclusion criteria.
German translations and, where necessary, synonyms of English keywords were also used. The following set of keywords was employed for the search:
Effizienz AND Kennzahl
efficiency AND KPI OR key performance indicator
Effizienz AND benchmark
efficiency AND benchmark
efficiency AND evaluation AND method
efficiency AND evaluation AND tool
The keyword combinations were selected to include the respective tags as an “and” function. Since the syntax for this function varies from database to database, it was modified accordingly.
Since there were no restrictions on the considered sectors, thematic classifications (e.g., chemical engineering) were not applied. This yielded over two million search results from the SpringerLink and ScienceDirect databases, far more than could be examined in a single review.
The search was limited, however, to reviewing articles in the ScienceDirect and SpringerLink databases to provide a comprehensive overview of established evaluation methods. The filter “Review Article” was applied to ScienceDirect for this purpose. The term search was limited to title, abstract, and keywords only. The search in the SpringerLink database specified that an article’s heading or keywords had to contain the term “review”. It was, thus, possible to ensure that KPIs, which already have such considerable relevance that they have been listed or investigated in the form of reviews, were included in this overview.
To exclude approaches unsuited for the technical evaluation of the efficiency of P2X processes, only the following categories were searched in the SpringerLink database:
Engineering
Life Sciences
Chemistry
Environment
Earth Sciences
Physics
Economics
Energy
Categories such as medicine and public health and psychology and philosophy were therefore not searched in the database. No other filters were applied to the ScienceDirect database.
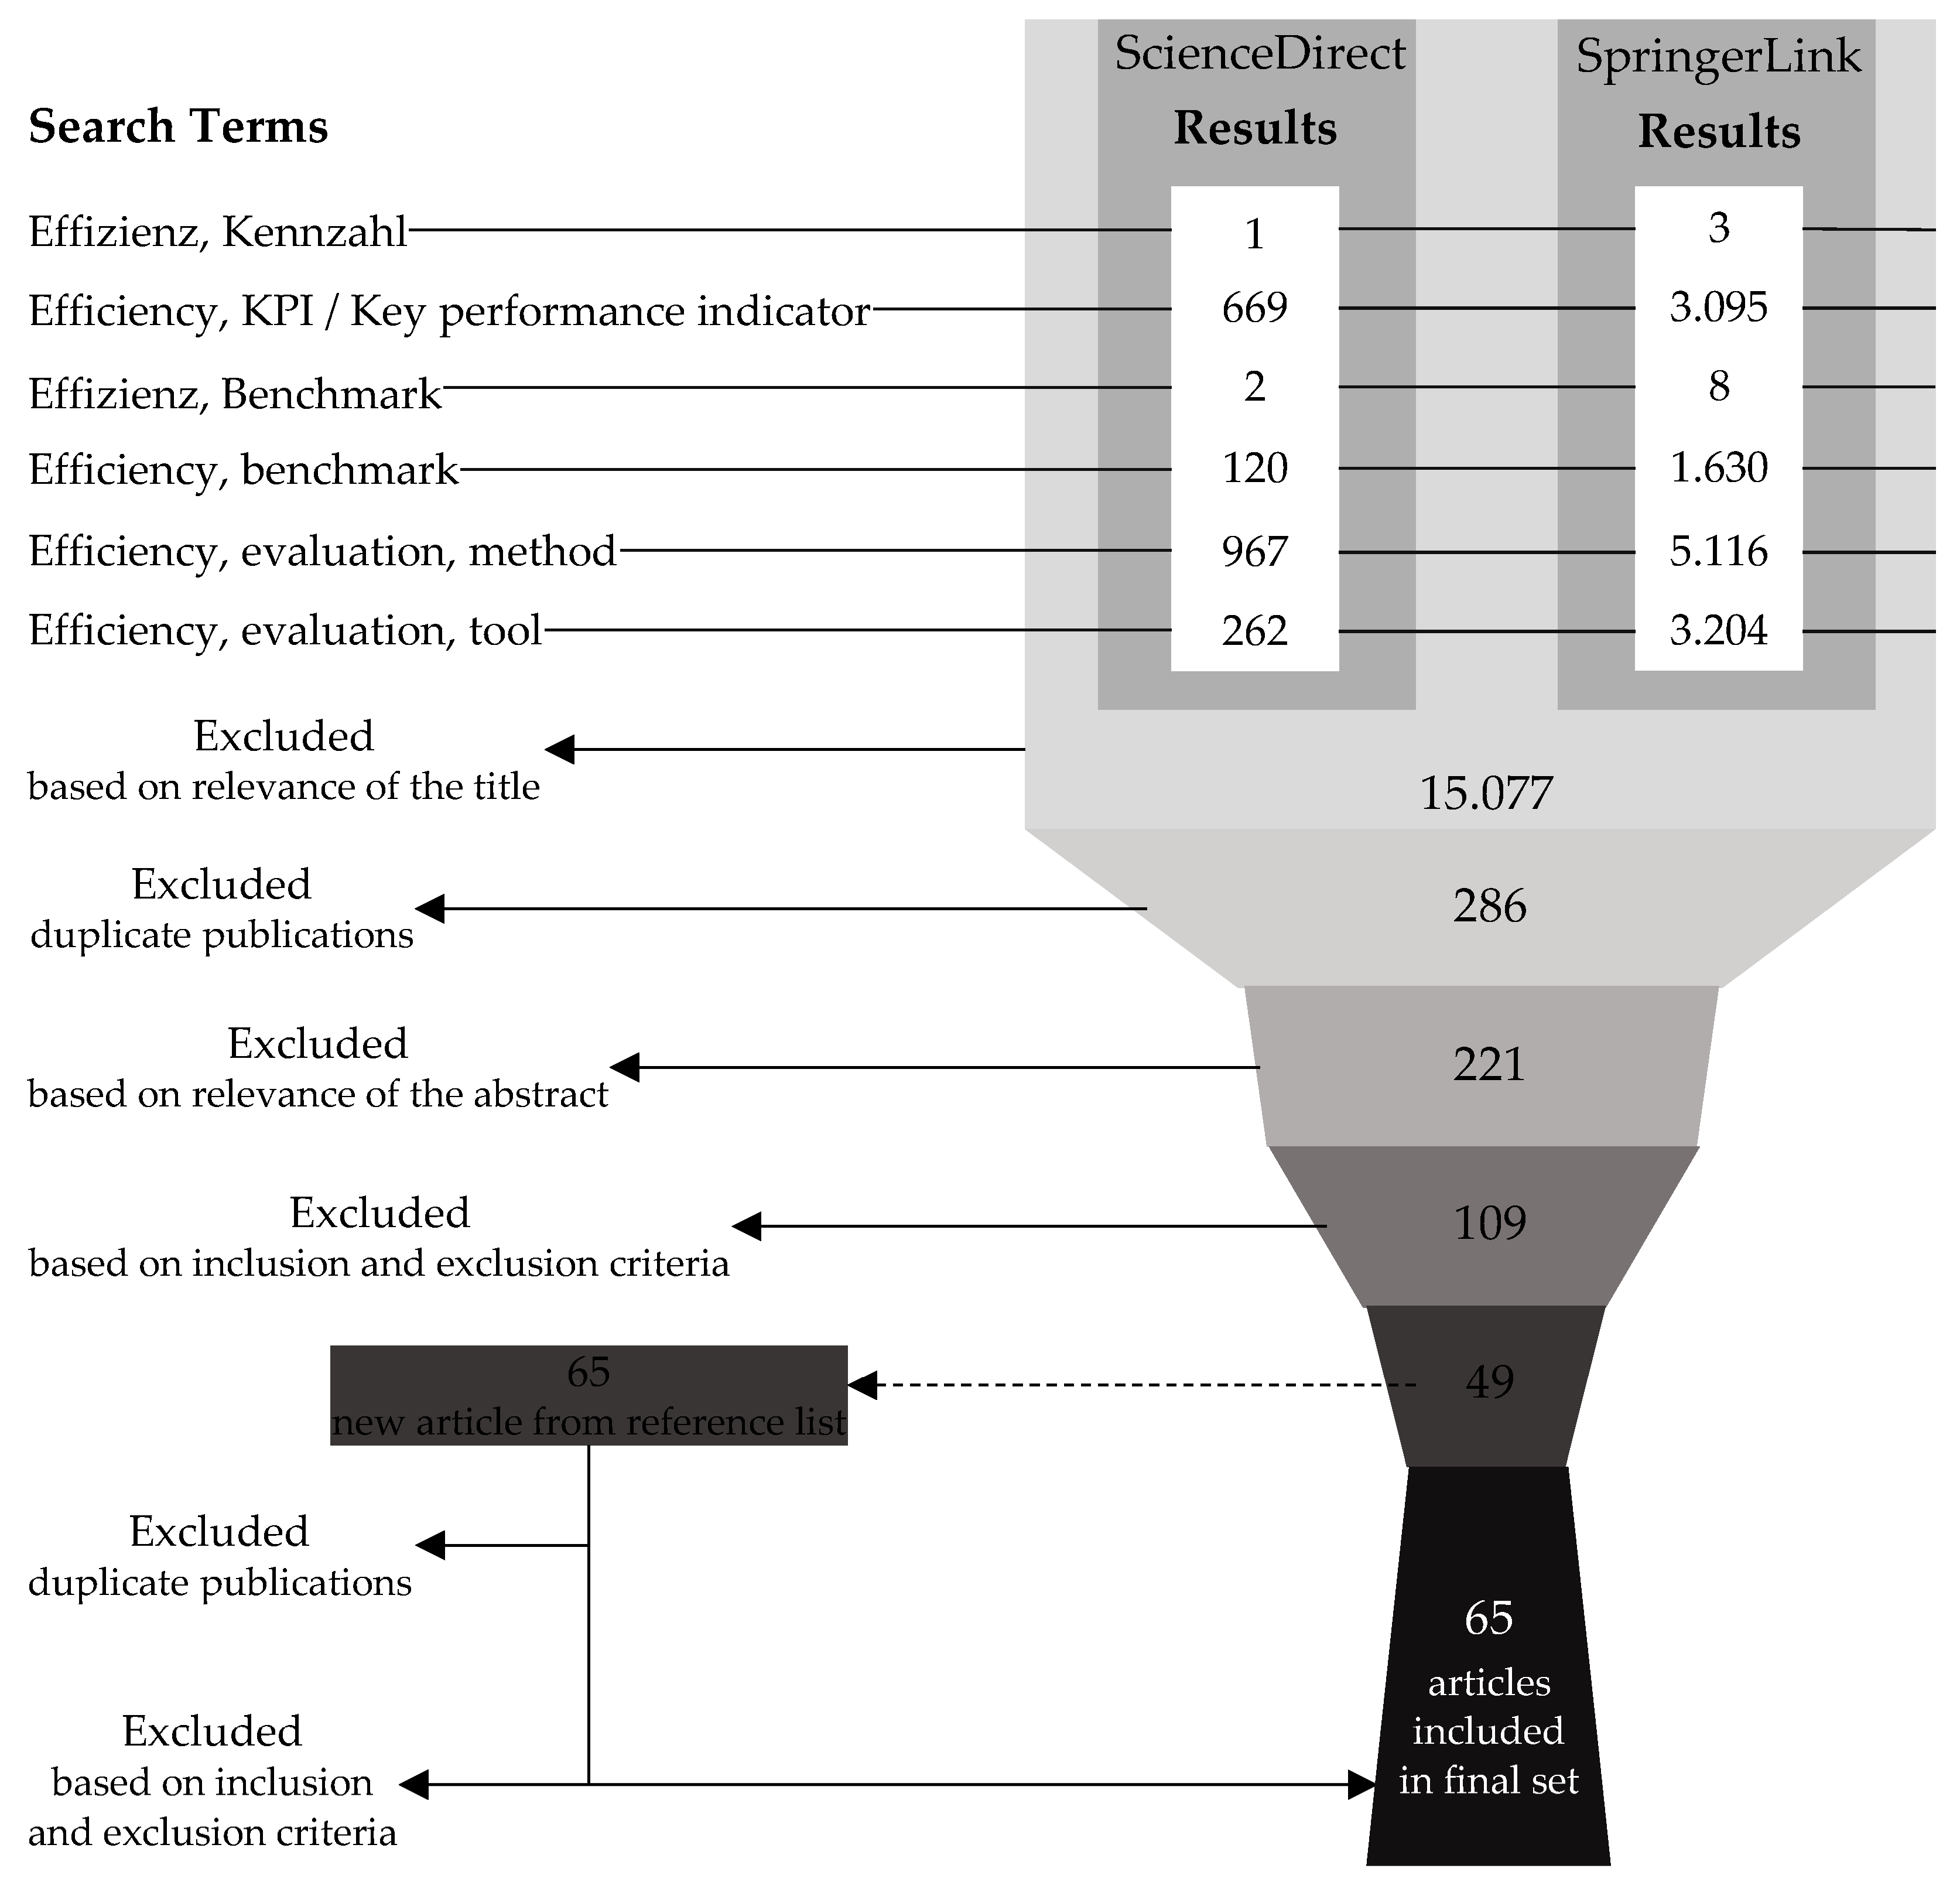
Using the aforementioned search settings, 15,077 results were obtained from 23 April 2022 to 6 August 2022, which were then saved and evaluated locally based on the inclusion and exclusion criteria.
2.2. Inclusion and Exclusion Criteria
Based on the keyword search, those hits were considered to contain reviews on evaluation methods and KPIs in general, or present novel KPIs.
Papers that reviewed different processes’ efficiency using a single method or indicator or presented methods inapplicable to technical P2X processes judging from the abstract (e.g., health application indicators) were excluded.
2.3. Analysis of the Review Articles
The 15,077 results obtained from the keyword search were analyzed based on the inclusion and exclusion criteria as pictured in the flowchart in
Figure 1. Once the direct hits had been reviewed, a forward-backward investigation was conducted to identify potentially relevant literature references in the articles examined. The analysis of the resulting set and the title, abstract, and full-text review procedure was repeated, creating a loop that was iterated a total of four times.
The search delivered a final set of sixty-five articles. Forty-eight of these articles are literature reviews or critical reviews. Seventeen other articles present the application of defined indicators without being based on a review.
2.4. Summary of Findings
The systematic literature search identified a total of 65 particularly relevant review articles on various energy assessment approaches.
Figure 2 shows the percentage of the number of articles in the main journals. Journals from which a single article was considered are summarized under “Others” and include the following journals:
Advances in Biochemical Engineering/Biotechnology
Agricultural Water Management
Chemical Engineering and Processing
International Journal of Life Cycle Assessment
Journal of Global Entrepreneurship Research
Journal of Computer Standards and Interfaces
Journal of Energy Storage
Journal of Productivity Analysis
Meditari Accountancy Research
Water Ressources and Industry
The review articles identified by the systematic literature search are presented in
Table 1, specifying the authors, the specific field of indicator application reviewed, the year of publication, and the type of review conducted.
2.5. Further Research
The review search identified well-established efficiency evaluation methods and indicators examined in several review papers.
Additional efficiency evaluation tools discovered by the authors at conferences and other sources (e.g., social networks such as ResearchGate) were included to complete the overview of existing evaluation methods. Due to the aforementioned high number of search results, these methods are not based on a systematic review. Therefore, the methods identified from this are included in the comprehensive overview and indicated by a gray color.
2.6. Identified Efficiency Evaluation Indicators
Table 2 lists all metrics and evaluation methods identified by the systematic literature review and further work that meets the defined inclusion criteria.
For initial consideration, these were classified into physical (blue), environmental (green), and economic (red) metrics and approaches, referencing Colla et al. (2020) [
5].
Physical indicators provide information on the net energy yield of the evaluated process. They can express absolute values (e.g., the total energy provided by the process), relative values (e.g., the ratio of the energy supplied to the converted energy), or time-related values (e.g., the energy payback period).
Environmental or sustainability indicators deliver information on a process’s impact on the environment (soil, water, atmosphere, climate, and natural resources). They quantify an implemented process’s impact on ecosystems in terms of greenhouse gas emissions or the demand for resources or land used.
Economic indicators include parameters of the process evaluated, such as costs, revenues, service charges, and discount rates. These indicators chiefly differ in their mathematical expression (e.g., rate, ratio, period, or difference).
2.7. Critical Evaluation of the Themethodological Approach of the Systematic Literature Review
The systematic literature search was designed to be as transparent as possible in order for the study to be reproducible according to scientific standards. Of course, the selection of libraries, keywords, and inclusion and exclusion criteria directly influenced the results of this search. A change in the search criteria would probably have resulted in a different set of articles being considered.
Since a machine- or software-assisted evaluation would not have been functional, the search was limited to the two most critical online libraries. Therefore, there is no claim to the completeness of this article.
The review papers identified provide an excellent basis for highlighting the large number of existing evaluation methods and KPIs and for comparing them with one another.
3. Classification Criteria for Efficiency Evaluation Methods and Benchmarks Applied to Power-to-X Processes
To evaluate the efficiency assessment approaches identified during the literature review, the authors defined several criteria. The following criteria based on Angelakoglou et al. (2015) [
32], Colla et al. (2020) [
5], and Menghi et al. (2019) [
8] were considered in the overall review:
3.1. Resources
Since an evaluation of energy efficiency alone is often insufficient for a comprehensive assessment of P2X processes in which energy conversion (often into material resources) plays a significant role, material resources must be included in addition to electricity and heat. Other than the possibility of defining a separate indicator for each of the considered resources (e.g., energy efficiency, water use efficiency), the cross-resource representation through the formation of technically comprehensible and invariable equivalents is particularly important.
3.2. Identification of Measures for Improvement
A comprehensive evaluation of P2X processes should focus on more than the current state. The capability to optimize a process must be determined based on an evaluation indicator, and it should be possible to derive recommended actions to improve process efficiency. Moreover, the defined optimum should be as independent of the state of the art as possible to avoid constantly adjusting the indicator as the state-of-the-art technology evolves. Recommended actions to improve a process can only be derived when the process evaluation is based on a detailed process model that maps process-specific properties beyond the trial balance.
3.3. Time’s Significance in Efficiency Evaluations
Time usually plays a rather subordinate role in the development of KPIs. A comprehensive evaluation of P2X processes, however, requires indicators that can be measured at a certain point in time and over a certain period. This ensures that different process stages (e.g., commissioning) can be considered separately. Since most methods do not provide an explicit distinction, three criteria have been developed for this category. If a KPI can be determined at a defined point in time (3.1) and over a specified period (3.2), criterion 3.3 is essential for ensuring transparent differentiation.
3.4. Applicability to Power-to-X
This study aims to identify indicators that can be used for a comprehensive evaluation of complex P2X processes. Although the exclusion criteria were applied in the initial review to exclude indicators not applicable to P2X, cross-sector applicability and transferability criteria were examined more closely for the remaining indicators.
3.5. Ease of Use
Most users of efficiency evaluation indicators apply the most practical and cost-effective method. Although oversimplified methods do not adequately reflect a process’s efficiency, overly complex methods are rarely used in industry. Evaluation methods and resulting indicators should therefore encompass different levels of application so that they can be used in both smaller and larger companies. Guidelines, supporting tools, and software effectively increase the applicability and usability of methods and metrics.
4. Analysis of the Identified Indicators and Methods
The analysis of all identified physical, economic, and environmental evaluation indicators is based on the yes/no criteria presented in
Table 3.
The respective number of questions per criterion category results in a ranking of the categories. This was adjusted based on a utility analysis. A score was assigned to each yes/no criterion, resulting in a weighting factor. According to the weighting factors defined in
Table 4, each metric examined was rated on a scale of 0–25, with the best method identified by the highest score. Of course, an individual adjustment of the criteria weighting is possible for the reader, e.g., on the basis of a utility value analysis.
The respective user decides which evaluation approach is selected. It depends on the objective pursued by the efficiency evaluation. In general, there are three evaluation levels, depending on the objective of the efficiency evaluation to be performed.
4.1. Levels of Efficiency Evaluation
The objective of the first level of efficiency evaluation is to identify inefficient processes, process steps, and process sequences. For this evaluation step, a purely balance sheet-based consideration is usually sufficient. Fundamental decisions, such as a purchase decision or a decision to improve a specific process step or replace an inefficient component, can be made based on this initial evaluation.
Inefficient process phases can be identified by evaluating a process’s efficiency at different times. Various phases of a process step identified as inefficient at level one are examined at the second level of process evaluation to identify those with the theoretically greatest potential for optimization.
Inefficient processes and process phases can only be improved when the specific cause of inefficiency is identifiable. Especially when planning and designing new processes and process components, the transport processes within the process (e.g., mixing or mass transfer) must be considered. This can only be achieved by comparing the process to be evaluated with a complex system model, which maps the internal transport processes in addition to the overall balance.
4.2. Priority of Criteria Depending on the Evaluation Level
A point cluster was created for each of the three levels of the process evaluation. Criteria 1, 4, and 5 are given particular weight on the first level. On the second level, the evaluation must be possible over time and at a specific point in time (criterion 4). On the third level, recommendations for actions are identified. Within the framework of the study, this criterion was considered by dividing the process into the steps to be evaluated. The more detailed the consideration, the more precise the derivation of recommendations for action. The consideration should go beyond an input-output analysis and consider internal transport processes for explicit recommendations.
The criteria for the three levels of the efficiency evaluation were weighted, as shown in
Table 4.
4.3. General Information on the Answering of the Yes/No Criteria
Not all yes/no criteria questions could be answered unambiguously. The procedure for borderline cases is described below.
Re Criteria 2.1:
Even if the idealized reference process results from the comparison with a reversible limit case (for example, in the case of efficiency), 2.1 was answered with “yes”. The resulting reduced informative value of the indicator regarding the optimization potential of the evaluated process was covered by 2.3.
Re Criteria 2.3:
In applications that preclude direct determination of the indicator, it is often estimated by an indirect method (e.g., indirect efficiency for combustion plants). In this case, the optimization potential of the process is derivable. This can only be achieved by measuring existing losses, since a direct reference to a specific ideal reference process is not possible. However, since the efficiency is, in its original definition, a direct reference to the reversible limit case, which is not feasible in reality, the question was answered with “no” for this particular case.
Re Criteria 2.5:
It was assumed that explicit recommendations for action could only be derived if the process could be examined in sufficient detail. If the methodological procedure for determining the indicator does not include any investigation of internal transport processes, meaning that it does not go beyond a purely balance sheet-based consideration, the answer to 2.5 is “ no”.
Re Criteria 5.1:
The answer to this question is based on the authors’ personal evaluation. It was checked whether the authors could apply the method to a specific process based on the available information after the research.
5. Results of the Classification for the Considered Categories
Each of the metrics analyzed has advantages and disadvantages for the efficiency evaluation of P2X processes. The evaluation criteria defined in
Section 3 were applied to evaluate the metrics and are partially based on the experience and personal opinion of the authors (see
Section 4.3). The respective score for each metric and level of evaluation is presented as a heat map in the last column of
Table 5,
Table 6 and
Table 7. The more intense the gray of the HeatMap, the better the considered method is suited for the respective level of efficiency evaluation.
5.1. Physical Indicators
The following physical indicators were identified in the literature:
Table 5.
Evaluation of physical efficiency evaluation metrics based on the yes/no criteria defined in
Table 3 for the three levels of the efficiency evaluation, with a maximum score of 25 points.
Table 5.
Evaluation of physical efficiency evaluation metrics based on the yes/no criteria defined in
Table 3 for the three levels of the efficiency evaluation, with a maximum score of 25 points.
| Abbrev. | 1.1 | 1.2 | 1.3 | 2.1 | 2.2 | 2.3 | 2.4 | 2.5 | 3.1 | 3.2 | 3.3 | 4.1 | 4.2 | 4.3 | 5.1 | 5.2 | 5.3 | 5.4 | Total | Level 1 | Level 2 | Level 3 |
|---|
| BAT | ✓ | ✓ | ✗ | ✓ | ✗ | ✓ | ✓ | ✗ | ✓ | ✓ | ✗ | ✓ | ✓ | ✗ | ✓ | ✓ | ✗ | ✗ | 17 | 20 | 20 | 3 |
| BN | ✗ | ✓ | ✓ | ✓ | ✓ | ✗ | ✓ | ✗ | ✗ | ✓ | ✓ | ✗ | ✗ | ✓ | ✓ | ✓ | ✓ | ✗ | 15 | 17 | 9 | 4 |
| BPM | ✓ | ✓ | ✗ | ✓ | ✗ | ✓ | ✓ | ✗ | ✓ | ✓ | ✗ | ✓ | ✓ | ✗ | ✗ | ✓ | ✗ | ✗ | 16 | 19 | 20 | 3 |
| BPO | ✓ | ✓ | ✓ | ✓ | ✗ | ✓ | ✓ | ✗ | ✓ | ✓ | ✗ | ✓ | ✓ | ✗ | ✗ | ✓ | ✗ | ✗ | 18 | 21 | 22 | 5 |
| CED | ✗ | ✓ | ✓ | ✗ | ✗ | ✗ | ✗ | ✗ | ✗ | ✓ | ✓ | ✓ | ✓ | ✓ | ✗ | ✓ | ✓ | ✓ | 16 | 16 | 13 | 4 |
| Cfac | ✗ | ✗ | ✗ | ✓ | ✓ | ✓ | ✗ | ✗ | ✗ | ✓ | ✓ | ✓ | ✗ | ✓ | ✓ | ✓ | ✗ | ✗ | 12 | 9 | 7 | 0 |
| DEA | ✓ | ✓ | ✓ | ✓ | ✓ | ✗ | ✓ | ✓ | ✓ | ✓ | ✗ | ✓ | ✗ | ✗ | ✗ | ✓ | ✓ | ✓ | 19 | 21 | 20 | 25 |
| EA | ✗ | ✓ | ✓ | ✓ | ✓ | ✓ | ✓ | ✗ | ✓ | ✓ | ✗ | ✓ | ✓ | ✓ | ✗ | ✓ | ✓ | ✓ | 21 | 21 | 22 | 4 |
| EAG | ✗ | ✗ | ✗ | ✓ | ✓ | ✗ | ✗ | ✗ | ✗ | ✓ | ✓ | ✓ | ✗ | ✓ | ✓ | ✓ | ✗ | ✗ | 11 | 9 | 7 | 0 |
| EEE | ✗ | ✗ | ✗ | ✓ | ✓ | ✗ | ✓ | ✗ | ✓ | ✓ | ✗ | ✓ | ✓ | ✓ | ✓ | ✓ | ✗ | ✗ | 15 | 16 | 18 | 0 |
| EEG | ✗ | ✓ | ✓ | ✓ | ✗ | ✓ | ✓ | ✗ | ✓ | ✓ | ✗ | ✓ | ✓ | ✗ | ✗ | ✓ | ✗ | ✗ | 17 | 18 | 20 | 4 |
| EEM | ✗ | ✓ | ✓ | ✗ | ✗ | ✗ | ✓ | ✗ | ✗ | ✓ | ✓ | ✓ | ✓ | ✓ | ✗ | ✓ | ✗ | ✗ | 15 | 19 | 13 | 4 |
| EnPI | ✓ | ✓ | ✗ | ✓ | ✓ | ✗ | ✓ | ✗ | ✓ | ✓ | ✗ | ✓ | ✗ | ✗ | ✗ | ✗ | ✓ | ✗ | 13 | 16 | 18 | 3 |
| EPBT | ✗ | ✓ | ✓ | ✓ | ✓ | ✗ | ✓ | ✗ | ✗ | ✓ | ✓ | ✓ | ✓ | ✓ | ✗ | ✗ | ✓ | ✗ | 16 | 18 | 13 | 4 |
| EPR | ✗ | ✓ | ✓ | ✓ | ✓ | ✗ | ✓ | ✗ | ✗ | ✓ | ✓ | ✓ | ✓ | ✓ | ✗ | ✗ | ✓ | ✗ | 16 | 18 | 13 | 4 |
| ERO€I | ✗ | ✓ | ✓ | ✓ | ✓ | ✗ | ✓ | ✗ | ✗ | ✓ | ✓ | ✓ | ✓ | ✓ | ✗ | ✗ | ✓ | ✗ | 16 | 18 | 13 | 4 |
| EUI | ✗ | ✗ | ✗ | ✗ | ✗ | ✗ | ✓ | ✗ | ✗ | ✓ | ✓ | ✗ | ✗ | ✓ | ✓ | ✓ | ✓ | ✓ | 10 | 14 | 5 | 0 |
| GER | ✗ | ✓ | ✓ | ✗ | ✗ | ✗ | ✗ | ✗ | ✗ | ✓ | ✓ | ✓ | ✓ | ✓ | ✓ | ✓ | ✓ | ✗ | 16 | 16 | 13 | 4 |
| GG | ✗ | ✗ | ✗ | ✓ | ✓ | ✗ | ✓ | ✗ | ✓ | ✓ | ✗ | ✗ | ✗ | ✓ | ✓ | ✓ | ✓ | ✗ | 12 | 13 | 14 | 0 |
| GPER | ✗ | ✗ | ✓ | ✗ | ✗ | ✗ | ✗ | ✗ | ✗ | ✓ | ✓ | ✓ | ✓ | ✓ | ✓ | ✓ | ✓ | ✗ | 14 | 14 | 11 | 2 |
| IOA | ✓ | ✓ | ✓ | ✓ | ✓ | ✗ | ✓ | ✗ | ✗ | ✓ | ✗ | ✓ | ✓ | ✓ | ✓ | ✓ | ✓ | ✗ | 21 | 24 | 14 | 5 |
| IW | ✗ | ✓ | ✓ | ✓ | ✓ | ✗ | ✗ | ✗ | ✓ | ✓ | ✗ | ✗ | ✗ | ✓ | ✗ | ✗ | ✓ | ✗ | 12 | 9 | 18 | 4 |
| LEED-Score | ✓ | ✓ | ✗ | ✗ | ✗ | ✗ | ✓ | ✗ | ✗ | ✓ | ✓ | ✗ | ✗ | ✗ | ✗ | ✓ | ✓ | ✓ | 11 | 17 | 7 | 3 |
| LF | ✗ | ✗ | ✗ | ✓ | ✓ | ✗ | ✓ | ✗ | ✗ | ✓ | ✓ | ✗ | ✗ | ✓ | ✓ | ✓ | ✓ | ✗ | 11 | 13 | 5 | 0 |
| MFA | ✗ | ✓ | ✓ | ✓ | ✓ | ✗ | ✓ | ✗ | ✓ | ✓ | ✗ | ✓ | ✓ | ✓ | ✓ | ✓ | ✗ | ✗ | 19 | 20 | 22 | 4 |
| NER | ✗ | ✓ | ✓ | ✓ | ✓ | ✗ | ✓ | ✗ | ✗ | ✓ | ✓ | ✓ | ✓ | ✓ | ✓ | ✓ | ✓ | ✗ | 19 | 21 | 13 | 4 |
| NEY | ✗ | ✓ | ✓ | ✓ | ✗ | ✗ | ✓ | ✗ | ✗ | ✓ | ✓ | ✓ | ✓ | ✗ | ✗ | ✓ | ✓ | ✓ | 18 | 21 | 11 | 4 |
| NPI | ✗ | ✗ | ✗ | ✗ | ✗ | ✗ | ✓ | ✗ | ✗ | ✓ | ✓ | ✗ | ✗ | ✓ | ✓ | ✓ | ✓ | ✓ | 10 | 14 | 5 | 0 |
| OEO | ✗ | ✓ | ✓ | ✓ | ✗ | ✓ | ✓ | ✗ | ✓ | ✓ | ✗ | ✓ | ✗ | ✗ | ✗ | ✓ | ✗ | ✗ | 15 | 16 | 18 | 4 |
| OR | ✗ | ✗ | ✗ | ✓ | ✓ | ✗ | ✓ | ✗ | ✓ | ✓ | ✗ | ✗ | ✗ | ✓ | ✓ | ✓ | ✗ | ✗ | 11 | 12 | 14 | 0 |
| OTE | ✗ | ✓ | ✓ | ✓ | ✗ | ✗ | ✓ | ✗ | ✗ | ✓ | ✗ | ✓ | ✗ | ✗ | ✗ | ✓ | ✓ | ✗ | 13 | 17 | 8 | 4 |
| PBN | ✓ | ✓ | ✓ | ✓ | ✗ | ✓ | ✓ | ✗ | ✓ | ✓ | ✗ | ✓ | ✓ | ✗ | ✗ | ✓ | ✗ | ✗ | 18 | 21 | 22 | 5 |
| PC | ✓ | ✗ | ✗ | ✗ | ✗ | ✓ | ✓ | ✓ | ✓ | ✓ | ✓ | ✓ | ✓ | ✗ | ✗ | ✗ | ✓ | ✓ | 15 | 17 | 19 | 21 |
| PCA | ✓ | ✗ | ✗ | ✗ | ✗ | ✗ | ✓ | ✗ | ✓ | ✓ | ✗ | ✓ | ✗ | ✗ | ✗ | ✗ | ✗ | ✗ | 8 | 13 | 16 | 1 |
| PEO | ✓ | ✓ | ✓ | ✓ | ✗ | ✓ | ✓ | ✗ | ✓ | ✓ | ✗ | ✓ | ✗ | ✗ | ✗ | ✓ | ✗ | ✗ | 16 | 19 | 20 | 5 |
| PhO | ✓ | ✓ | ✓ | ✓ | ✓ | ✓ | ✓ | ✓ | ✓ | ✓ | ✓ | ✓ | ✓ | ✓ | ✓ | ✓ | ✓ | ✓ | 24 | 24 | 25 | 25 |
| REC | ✓ | ✗ | ✗ | ✓ | ✓ | ✓ | ✓ | ✗ | ✓ | ✓ | ✗ | ✓ | ✗ | ✗ | ✗ | ✗ | ✗ | ✗ | 11 | 13 | 16 | 1 |
| REF | ✓ | ✗ | ✗ | ✓ | ✓ | ✓ | ✓ | ✗ | ✓ | ✓ | ✗ | ✓ | ✗ | ✗ | ✗ | ✗ | ✗ | ✗ | 11 | 13 | 16 | 1 |
| RT-EE | ✗ | ✗ | ✗ | ✓ | ✓ | ✗ | ✓ | ✗ | ✗ | ✓ | ✓ | ✗ | ✗ | ✗ | ✗ | ✓ | ✓ | ✗ | 9 | 11 | 3 | 0 |
| SEbP | ✗ | ✓ | ✓ | ✓ | ✗ | ✓ | ✓ | ✗ | ✓ | ✓ | ✗ | ✓ | ✓ | ✗ | ✗ | ✓ | ✗ | ✗ | 17 | 18 | 20 | 4 |
| SEE | ✗ | ✗ | ✗ | ✓ | ✓ | ✗ | ✓ | ✗ | ✓ | ✓ | ✗ | ✓ | ✓ | ✓ | ✓ | ✓ | ✗ | ✗ | 15 | 16 | 18 | 0 |
| SEI | ✗ | ✓ | ✓ | ✓ | ✗ | ✓ | ✓ | ✗ | ✓ | ✓ | ✗ | ✗ | ✗ | ✗ | ✓ | ✓ | ✗ | ✗ | 14 | 15 | 16 | 4 |
| SESdT | ✗ | ✓ | ✓ | ✓ | ✗ | ✓ | ✓ | ✗ | ✓ | ✓ | ✗ | ✓ | ✓ | ✗ | ✗ | ✓ | ✗ | ✗ | 17 | 18 | 20 | 4 |
| SFA | ✓ | ✓ | ✓ | ✓ | ✓ | ✓ | ✓ | ✓ | ✗ | ✓ | ✓ | ✓ | ✓ | ✓ | ✗ | ✗ | ✓ | ✓ | 20 | 22 | 15 | 25 |
| SIC | ✓ | ✓ | ✓ | ✓ | ✗ | ✗ | ✓ | ✗ | ✓ | ✓ | ✗ | ✗ | ✗ | ✗ | ✗ | ✗ | ✓ | ✓ | 13 | 17 | 18 | 5 |
| TbEM | ✓ | ✓ | ✓ | ✗ | ✗ | ✗ | ✓ | ✗ | ✗ | ✓ | ✓ | ✓ | ✓ | ✓ | ✗ | ✓ | ✗ | ✗ | 16 | 22 | 15 | 5 |
| TD | ✓ | ✓ | ✓ | ✓ | ✗ | ✓ | ✓ | ✗ | ✓ | ✓ | ✗ | ✗ | ✗ | ✗ | ✗ | ✗ | ✓ | ✗ | 13 | 16 | 18 | 5 |
| TE | ✗ | ✗ | ✗ | ✓ | ✓ | ✗ | ✓ | ✗ | ✓ | ✓ | ✗ | ✓ | ✓ | ✓ | ✓ | ✓ | ✗ | ✗ | 15 | 16 | 18 | 0 |
| Teff | ✓ | ✗ | ✗ | ✓ | ✓ | ✗ | ✗ | ✗ | ✓ | ✓ | ✗ | ✓ | ✓ | ✓ | ✓ | ✓ | ✓ | ✗ | 16 | 15 | 20 | 1 |
| TEO | ✗ | ✗ | ✗ | ✓ | ✓ | ✗ | ✓ | ✗ | ✓ | ✓ | ✗ | ✓ | ✓ | ✓ | ✗ | ✓ | ✗ | ✗ | 14 | 15 | 18 | 0 |
| TSE | ✗ | ✗ | ✗ | ✗ | ✗ | ✗ | ✓ | ✓ | ✗ | ✓ | ✓ | ✓ | ✓ | ✓ | ✗ | ✗ | ✓ | ✗ | 11 | 14 | 9 | 20 |
| TW | ✗ | ✓ | ✓ | ✓ | ✓ | ✗ | ✗ | ✗ | ✓ | ✓ | ✗ | ✗ | ✗ | ✓ | ✓ | ✓ | ✓ | ✗ | 15 | 12 | 18 | 4 |
5.2. Environmental Indicators
This study identified the following environmental indicators:
Table 6.
Evaluation of environmental efficiency evaluation metrics based on the yes/no criteria defined in
Table 3 for the three levels of the efficiency evaluation, with a maximum score of 25 points.
Table 6.
Evaluation of environmental efficiency evaluation metrics based on the yes/no criteria defined in
Table 3 for the three levels of the efficiency evaluation, with a maximum score of 25 points.
| Abbrev. | 1.1 | 1.2 | 1.3 | 2.1 | 2.2 | 2.3 | 2.4 | 2.5 | 3.1 | 3.2 | 3.3 | 4.1 | 4.2 | 4.3 | 5.1 | 5.2 | 5.3 | 5.4 | Total | Level 1 | Level 2 | Level 3 |
|---|
| CF | ✗ | ✓ | ✓ | ✗ | ✗ | ✗ | ✗ | ✗ | ✓ | ✗ | ✓ | ✓ | ✓ | ✓ | ✗ | ✓ | ✓ | ✓ | 16 | 16 | 13 | 4 |
| EF | ✗ | ✓ | ✓ | ✗ | ✗ | ✗ | ✗ | ✗ | ✗ | ✓ | ✓ | ✓ | ✓ | ✓ | ✗ | ✓ | ✓ | ✓ | 16 | 16 | 13 | 4 |
| EE | ✓ | ✓ | ✗ | ✓ | ✗ | ✓ | ✓ | ✗ | ✓ | ✗ | ✓ | ✓ | ✗ | ✗ | ✓ | ✓ | ✓ | ✓ | 16 | 17 | 17 | 3 |
| EE-I | ✗ | ✓ | ✓ | ✓ | ✗ | ✓ | ✓ | ✗ | ✓ | ✓ | ✗ | ✓ | ✗ | ✗ | ✓ | ✓ | ✓ | ✓ | 18 | 19 | 18 | 4 |
| EnV | ✗ | ✓ | ✓ | ✗ | ✗ | ✗ | ✗ | ✗ | ✗ | ✓ | ✓ | ✓ | ✓ | ✓ | ✗ | ✓ | ✓ | ✓ | 16 | 16 | 13 | 4 |
| EIA | ✓ | ✓ | ✓ | ✗ | ✗ | ✗ | ✓ | ✗ | ✗ | ✓ | ✓ | ✓ | ✗ | ✗ | ✗ | ✗ | ✓ | ✓ | 13 | 19 | 11 | 5 |
| EPD | ✓ | ✓ | ✓ | ✗ | ✗ | ✗ | ✓ | ✓ | ✗ | ✓ | ✓ | ✓ | ✗ | ✓ | ✗ | ✓ | ✓ | ✓ | 16 | 22 | 13 | 5 |
| EEIO | ✓ | ✗ | ✗ | ✓ | ✓ | ✗ | ✓ | ✗ | ✓ | ✗ | ✓ | ✓ | ✓ | ✓ | ✓ | ✓ | ✓ | ✗ | 4 | 17 | 9 | 1 |
| GWP | ✗ | ✓ | ✓ | ✗ | ✗ | ✗ | ✓ | ✗ | ✗ | ✓ | ✓ | ✓ | ✓ | ✓ | ✗ | ✓ | ✓ | ✓ | 17 | 21 | 13 | 4 |
| GGA | ✗ | ✓ | ✓ | ✗ | ✗ | ✗ | ✓ | ✗ | ✗ | ✓ | ✓ | ✓ | ✓ | ✓ | ✗ | ✗ | ✓ | ✓ | 15 | 19 | 13 | 4 |
| HPI | ✓ | ✓ | ✗ | ✗ | ✗ | ✗ | ✗ | ✗ | ✗ | ✓ | ✓ | ✗ | ✗ | ✓ | ✓ | ✓ | ✓ | ✓ | 12 | 14 | 9 | 3 |
| HDI | ✓ | ✓ | ✗ | ✗ | ✗ | ✗ | ✗ | ✗ | ✗ | ✓ | ✓ | ✗ | ✗ | ✓ | ✓ | ✓ | ✓ | ✓ | 12 | 14 | 9 | 3 |
| ISEW | ✓ | ✓ | ✗ | ✗ | ✗ | ✗ | ✗ | ✗ | ✗ | ✓ | ✓ | ✗ | ✗ | ✓ | ✓ | ✓ | ✓ | ✓ | 12 | 14 | 9 | 3 |
| LCA | ✓ | ✓ | ✓ | ✗ | ✗ | ✗ | ✓ | ✗ | ✗ | ✓ | ✓ | ✓ | ✓ | ✓ | ✓ | ✓ | ✓ | ✓ | 19 | 25 | 15 | 5 |
| MCDA | ✓ | ✓ | ✗ | ✗ | ✗ | ✗ | ✓ | ✓ | ✗ | ✓ | ✓ | ✓ | ✗ | ✗ | ✓ | ✓ | ✓ | ✗ | 14 | 19 | 9 | 23 |
| OLS | ✗ | ✗ | ✗ | ✓ | ✓ | ✗ | ✓ | ✗ | ✗ | ✓ | ✓ | ✓ | ✗ | ✗ | ✗ | ✗ | ✓ | ✓ | 10 | 12 | 5 | 0 |
| PPI | ✗ | ✗ | ✗ | ✓ | ✗ | ✓ | ✓ | ✗ | ✗ | ✓ | ✓ | ✓ | ✓ | ✗ | ✗ | ✓ | ✓ | ✗ | 13 | 15 | 7 | 0 |
| SEA | ✓ | ✓ | ✗ | ✗ | ✗ | ✗ | ✗ | ✗ | ✗ | ✓ | ✓ | ✓ | ✓ | ✗ | ✗ | ✓ | ✓ | ✗ | 13 | 15 | 11 | 3 |
| SEI | ✗ | ✓ | ✓ | ✓ | ✗ | ✓ | ✓ | ✗ | ✓ | ✓ | ✗ | ✗ | ✗ | ✗ | ✓ | ✓ | ✗ | ✗ | 14 | 15 | 16 | 4 |
| SEEA | ✗ | ✓ | ✓ | ✗ | ✗ | ✗ | ✓ | ✗ | ✗ | ✓ | ✓ | ✗ | ✗ | ✗ | ✓ | ✓ | ✓ | ✓ | 16 | 20 | 11 | 4 |
| WF | ✗ | ✗ | ✗ | ✗ | ✗ | ✗ | ✓ | ✗ | ✗ | ✓ | ✓ | ✓ | ✓ | ✓ | ✓ | ✓ | ✓ | ✗ | 13 | 17 | 9 | 0 |
| WUE | ✗ | ✗ | ✗ | ✗ | ✗ | ✗ | ✓ | ✗ | ✗ | ✓ | ✓ | ✓ | ✓ | ✓ | ✓ | ✓ | ✓ | ✗ | 13 | 17 | 9 | 0 |
5.3. Economic Indicators
This study identified the following economic indicators:
Table 7.
Evaluation of economic efficiency evaluation metrics based on the yes/no criteria defined in
Table 3 for the three levels of the efficiency evaluation, with a maximum score of 25 points.
Table 7.
Evaluation of economic efficiency evaluation metrics based on the yes/no criteria defined in
Table 3 for the three levels of the efficiency evaluation, with a maximum score of 25 points.
| Abbrev. | 1.1 | 1.2 | 1.3 | 2.1 | 2.2 | 2.3 | 2.4 | 2.5 | 3.1 | 3.2 | 3.3 | 4.1 | 4.2 | 4.3 | 5.1 | 5.2 | 5.3 | 5.4 | Total | Phase 1 | Phase 2 | Phase 3 |
|---|
| AE | ✗ | ✓ | ✗ | ✗ | ✗ | ✗ | ✓ | ✗ | ✓ | ✗ | ✗ | ✓ | ✗ | ✗ | ✓ | ✓ | ✓ | ✓ | 12 | 14 | 14 | 2 |
| CBA | ✗ | ✓ | ✗ | ✓ | ✗ | ✗ | ✓ | ✗ | ✗ | ✓ | ✓ | ✓ | ✗ | ✗ | ✓ | ✓ | ✓ | ✗ | 13 | 16 | 7 | 2 |
| CRR | ✗ | ✓ | ✗ | ✓ | ✗ | ✗ | ✓ | ✗ | ✗ | ✓ | ✓ | ✓ | ✗ | ✗ | ✓ | ✓ | ✓ | ✗ | 13 | 16 | 7 | 2 |
| DEA | ✓ | ✓ | ✓ | ✓ | ✓ | ✗ | ✓ | ✓ | ✓ | ✓ | ✗ | ✓ | ✗ | ✗ | ✗ | ✓ | ✓ | ✓ | 17 | 21 | 10 | 25 |
| DA | ✗ | ✗ | ✗ | ✓ | ✗ | ✗ | ✗ | ✗ | ✗ | ✓ | ✓ | ✗ | ✗ | ✗ | ✓ | ✓ | ✓ | ✓ | 9 | 8 | 3 | 0 |
| EpCpC | ✗ | ✗ | ✗ | ✗ | ✗ | ✗ | ✗ | ✗ | ✗ | ✓ | ✓ | ✓ | ✗ | ✓ | ✓ | ✓ | ✓ | ✓ | 11 | 11 | 7 | 0 |
| GPI | ✗ | ✓ | ✗ | ✗ | ✗ | ✗ | ✗ | ✗ | ✗ | ✓ | ✓ | ✓ | ✗ | ✗ | ✗ | ✗ | ✗ | ✗ | 7 | 7 | 7 | 2 |
| ITCE | ✗ | ✗ | ✗ | ✓ | ✗ | ✓ | ✓ | ✗ | ✗ | ✓ | ✓ | ✓ | ✓ | ✗ | ✗ | ✗ | ✗ | ✗ | 11 | 12 | 7 | 20 |
| IWUE | ✗ | ✗ | ✗ | ✓ | ✗ | ✓ | ✓ | ✗ | ✗ | ✓ | ✓ | ✓ | ✓ | ✗ | ✗ | ✗ | ✗ | ✗ | 10 | 12 | 7 | 0 |
| LACE | ✗ | ✗ | ✗ | ✓ | ✗ | ✓ | ✓ | ✗ | ✗ | ✓ | ✓ | ✓ | ✓ | ✗ | ✗ | ✗ | ✗ | ✗ | 10 | 12 | 7 | 0 |
| LCOE | ✗ | ✗ | ✗ | ✓ | ✗ | ✓ | ✓ | ✗ | ✗ | ✓ | ✓ | ✓ | ✓ | ✗ | ✓ | ✓ | ✓ | ✗ | 14 | 16 | 7 | 0 |
| LCOH | ✗ | ✗ | ✗ | ✓ | ✗ | ✓ | ✓ | ✗ | ✗ | ✓ | ✓ | ✓ | ✓ | ✗ | ✓ | ✓ | ✓ | ✗ | 14 | 16 | 7 | 0 |
| SPB | ✗ | ✗ | ✗ | ✗ | ✗ | ✗ | ✓ | ✗ | ✗ | ✓ | ✓ | ✓ | ✗ | ✗ | ✓ | ✓ | ✗ | ✗ | 9 | 13 | 5 | 0 |
| SEEA | ✗ | ✓ | ✓ | ✗ | ✗ | ✗ | ✓ | ✗ | ✗ | ✓ | ✓ | ✗ | ✗ | ✗ | ✗ | ✓ | ✓ | ✓ | 16 | 20 | 11 | 4 |
6. Discussion of the Research Findings
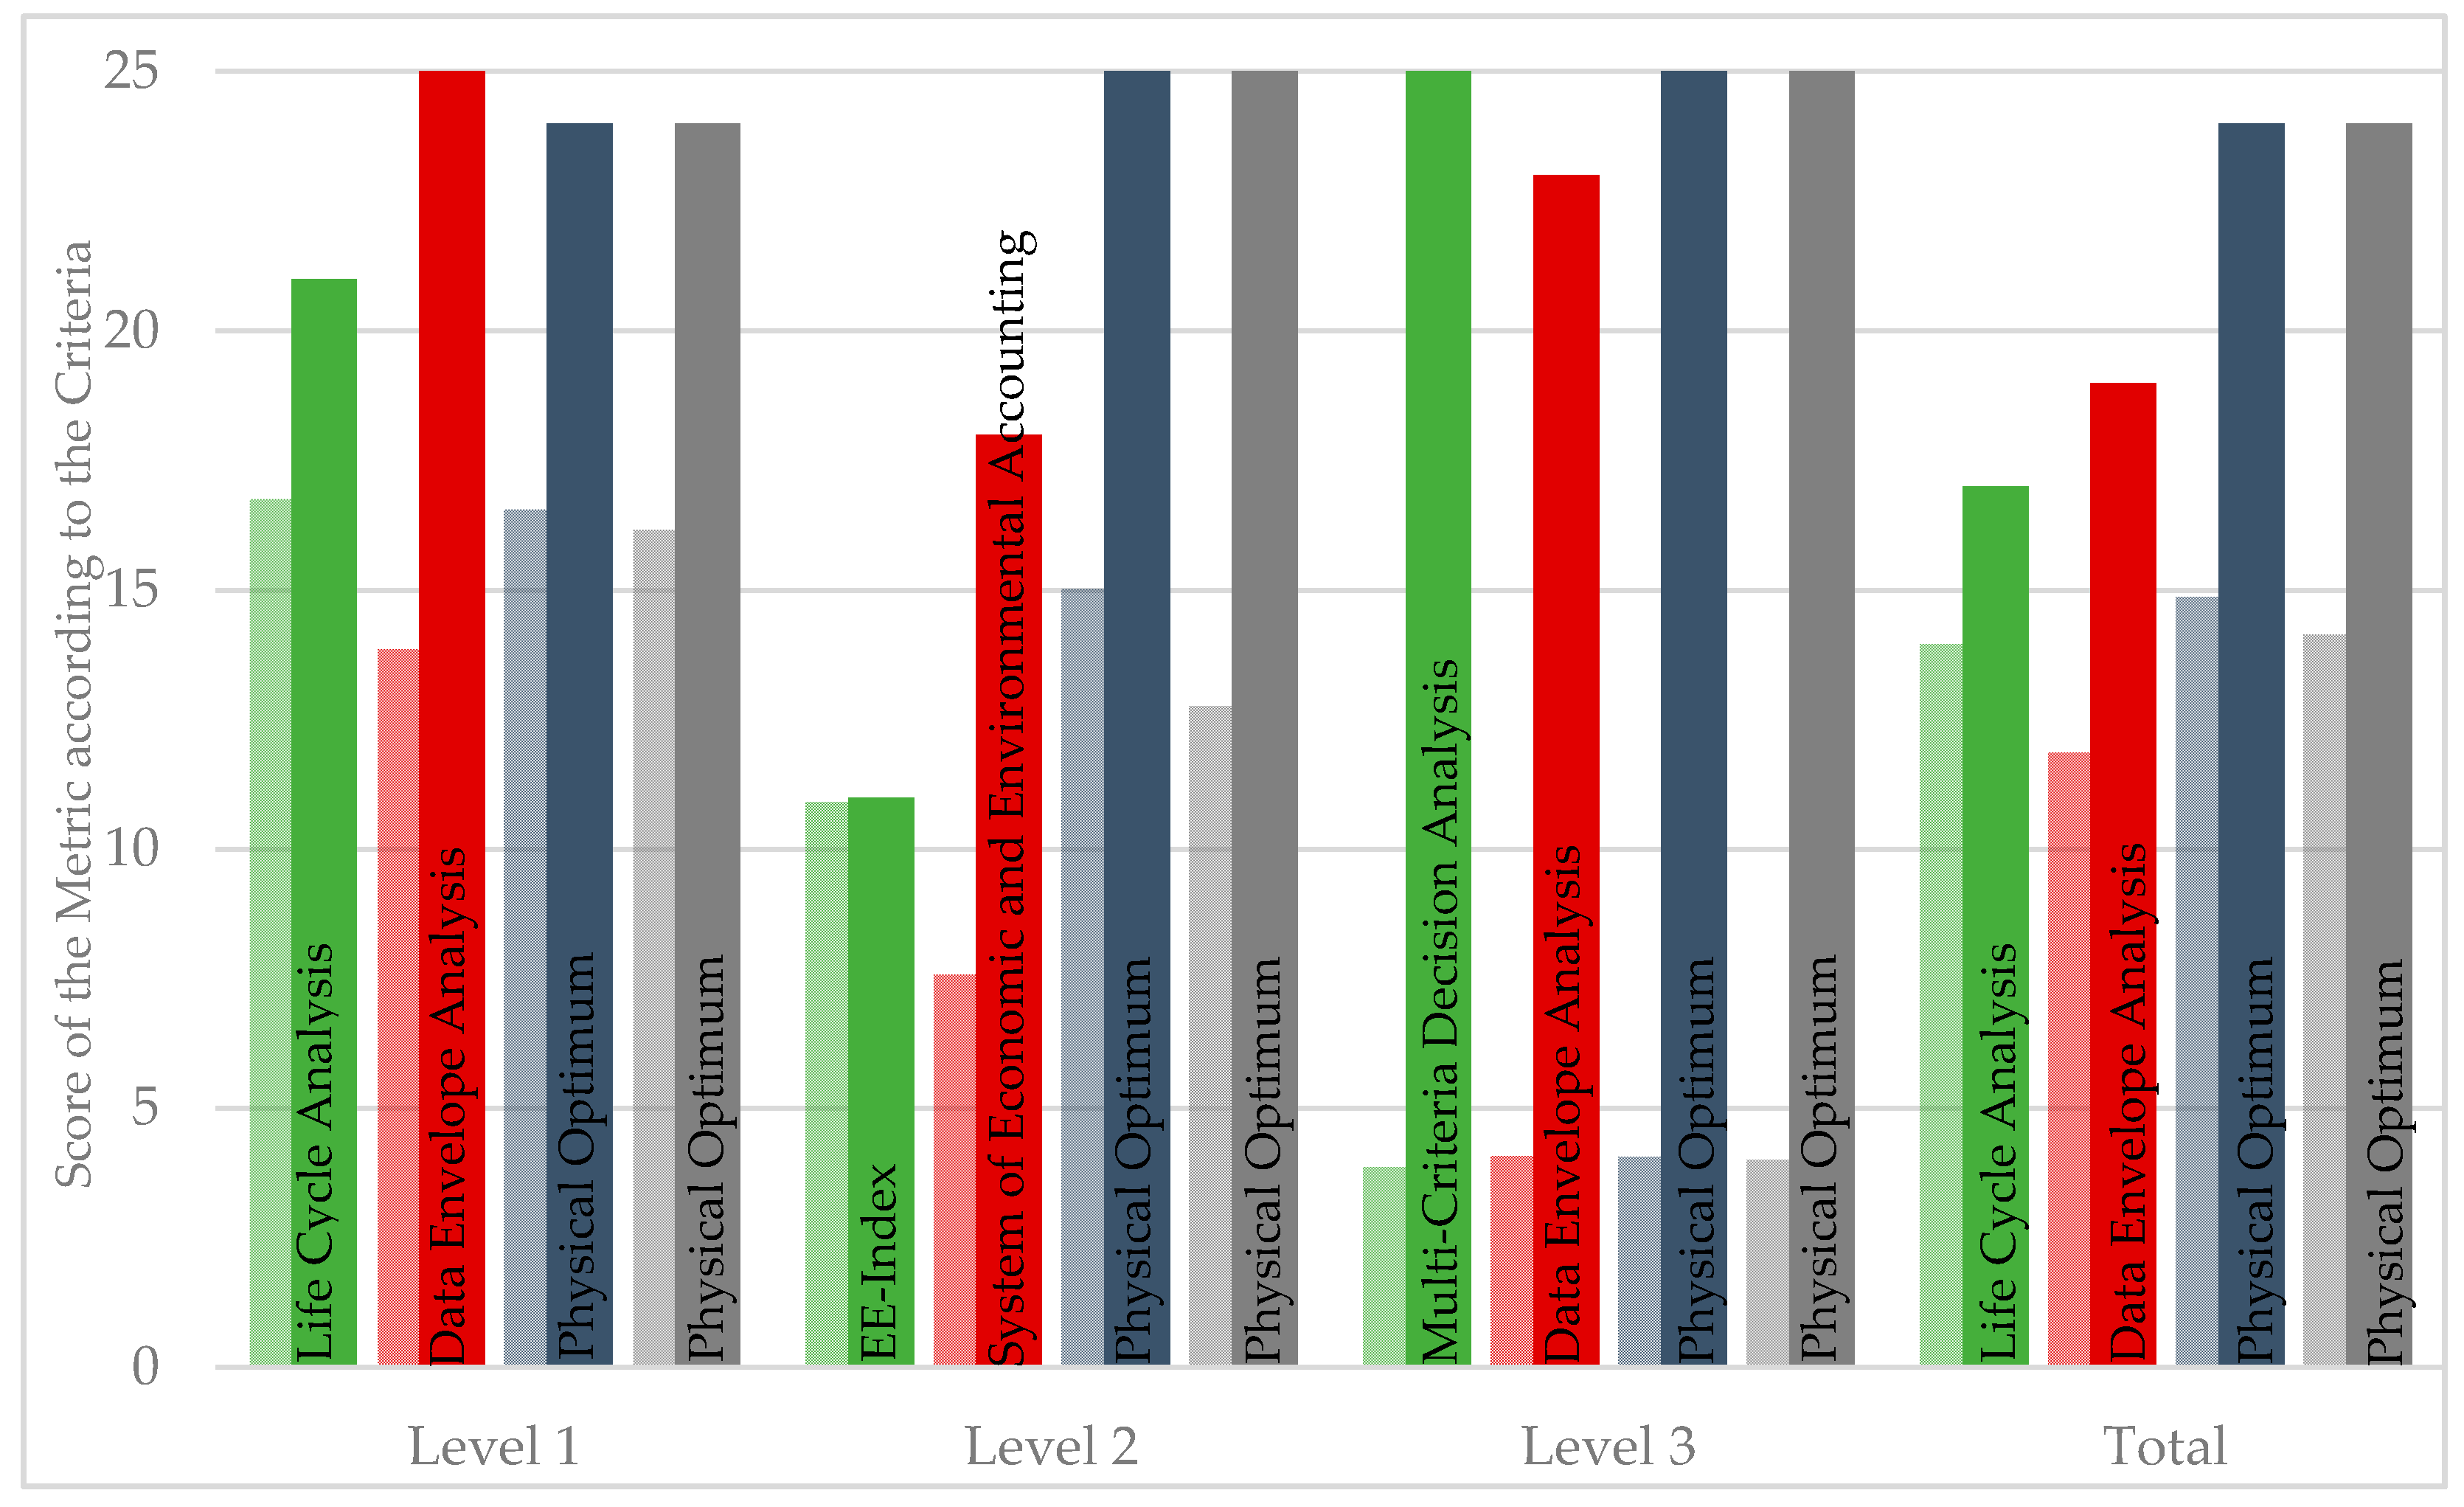
Based on the respective indicators’ total scores in the tables, the authors identified methods best suited for the overall evaluation of P2X processes. They additionally identified the methods best suited for the three defined levels of process evaluation using the weighting factors described in
Table 4. The compliance of the investigated evaluation methods with these specified criteria is indicated in the respective tables for each evaluation phase in points out of 25. The results are illustrated in
Figure 3. It should be noted that the answers to the yes/no criteria are, in some cases, based on the subjective opinion of the authors. Especially the derivability of recommendations for actions, as well as the applicability by nonexperts, can only be scientifically proven in a few cases. In order to adapt the efficiency rating to the subjective needs of the user, the reader, according to his preferences, can adjust the weighting of the respective criteria. Furthermore, depending on the level of knowledge of the methods considered, the answers to criteria 5.1 and 5.2, in particular, should be adapted according to the user’s expertise.
In the following subchapter, the method that achieved the highest score in its classification (economic, environmental, and physical) is described in each case. This description focuses on the applicability and limitations of each method for P2X systems.
Existing challenges arising from this analysis are discussed, and solutions from the literature are analyzed. Furthermore, an independent solution approach for the evaluation of P2X systems is explicitly discussed.
6.1. Life Cycle Analysis
The evaluation presented in
Table 6 identified life cycle analysis (LCA) as the best environmental metric for the first level of efficiency evaluation.
In life cycle assessment (LCA), the environmental impacts of products, processes, or services are systematically analyzed along their entire life cycle, “from the cradle to the grave. This includes all environmental impacts that occur during production, the use phase, and disposal, as well as the associated upstream and downstream processes.
Unlike most physical indicators, LCA refers to the complete product life cycle and can, therefore, not only evaluate the efficiency of a technical process but, above all, also estimate a product’s cumulative environmental impact from manufacture to recycling. Three types of LCA can be distinguished: environmental, focused on a single product; comparative, focused on several products; and holistic, focused on economic, technical, and social factors [
23].
The advantage of LCA over physical and economic indicators is that it allows for the evaluation not only of an operation (e.g., of a production line) but also of a product’s entire life cycle. This is particularly important in manufacturing since it includes the resources used to construct the manufacturing facility in addition to the resources used to manufacture a product. For example, it can be revealed that the purchase of an electric car is more environmentally sensible than the purchase of a conventional vehicle with a combustion engine if the vehicle has a minimum service life [
80].
6.2. Data Envelope Analysis
Economic metrics are often highly dependent on the current political and economic situation since they are responsible for price development.
With 21 out of 25 possible evaluation criteria points for the first level of an efficiency evaluation of P2X systems, the most appropriate economic evaluation method is data envelopment analysis (DEA). DEA is an efficiency analysis technique used in operations research. Although the method is intended to measure the efficiency of organizational and decision-making units, it can be applied to technical processes. The evaluated subprocesses are treated as decision-making units. The weighted sum of the input and output variables is employed to measure the efficiency value. This efficiency value indicates the distance to the efficient edge (data envelope) based on the observed inputs and outputs of a decision unit. This efficient margin is formed from the group of decision units analyzed by the DEA. From the efficiency value of a decision unit, improvement potentials can be derived directly for its management [
43].
The data envelopment analysis is also suitable for the third level of efficiency evaluation if it is considered in sufficient detail. When the efficient edge of the system used in the assessment describes internal transport processes, specific causes of inefficiencies can be identified, and recommended actions can be derived based on the investigations.
Research by A. Hougaard et al. (2013), however, suggests that DEA results are not necessarily comparable across sectors and are only transferable to similar organizational and decision-making units [
81].
6.3. Physical Optimum
The PhO scored best based on the defined criteria for the first level of efficiency evaluation. The physical optimum describes a reference process that is modeled based on natural laws and, thus, is supposed to define the ultimate limit of optimality.
This method of evaluation distinguishes between the so-called PhO factor (over a defined period of time) and the performance PhO factor. The PhO factor is used to complete the first level of process evaluation, while the performance PhO factor is used to identify inefficient phases of a process [
82].
In perspective, the aim of the PhO method is that nonexperts can also apply it. However, especially for complex processes, modeling the physical optimum can be challenging. In many cases, there are different ways of describing and defining the physical optimum based on different physical laws for the same physical event. For this reason, a portfolio of models for the PhO of different processes is currently being developed and will be published as part of an extension of VDI 4663 [
82].
6.4. Remaining Problems
The analysis of the KPIs identified during the literature research showed that a holistic evaluation of complex processes is impossible based on a single KPI or method. While environmental and economic evaluation metrics score a maximum of 19 out of 25 points in the overall evaluation, the physical optimum scores the highest with 24 out of 25 points. However, since this method is still relatively new compared to other methods, there is a need to define the modeling laws for specific processes. Otherwise, the comparability of the metric is compromised both for the same process and across different processes. The problem is being addressed by planning an extension to VDI 4663, but it has not yet been completed.
In addition, the comparability of one and the same indicator, in general, is limited by the choice of balance sheet boundaries or the consideration of time (or the neglect of this). For example, various physical indicators can be used to evaluate both a specific time in and a defined period of a process. For instance, in the case of efficiency, this distinction is achieved by the degree of utilization, which explicitly refers to a defined period of time [
83]. However, depending on the area of application, the definition of efficiency may differ [
84]. This may lead to inaccuracies in the evaluation, especially in the second level of efficiency evaluation.
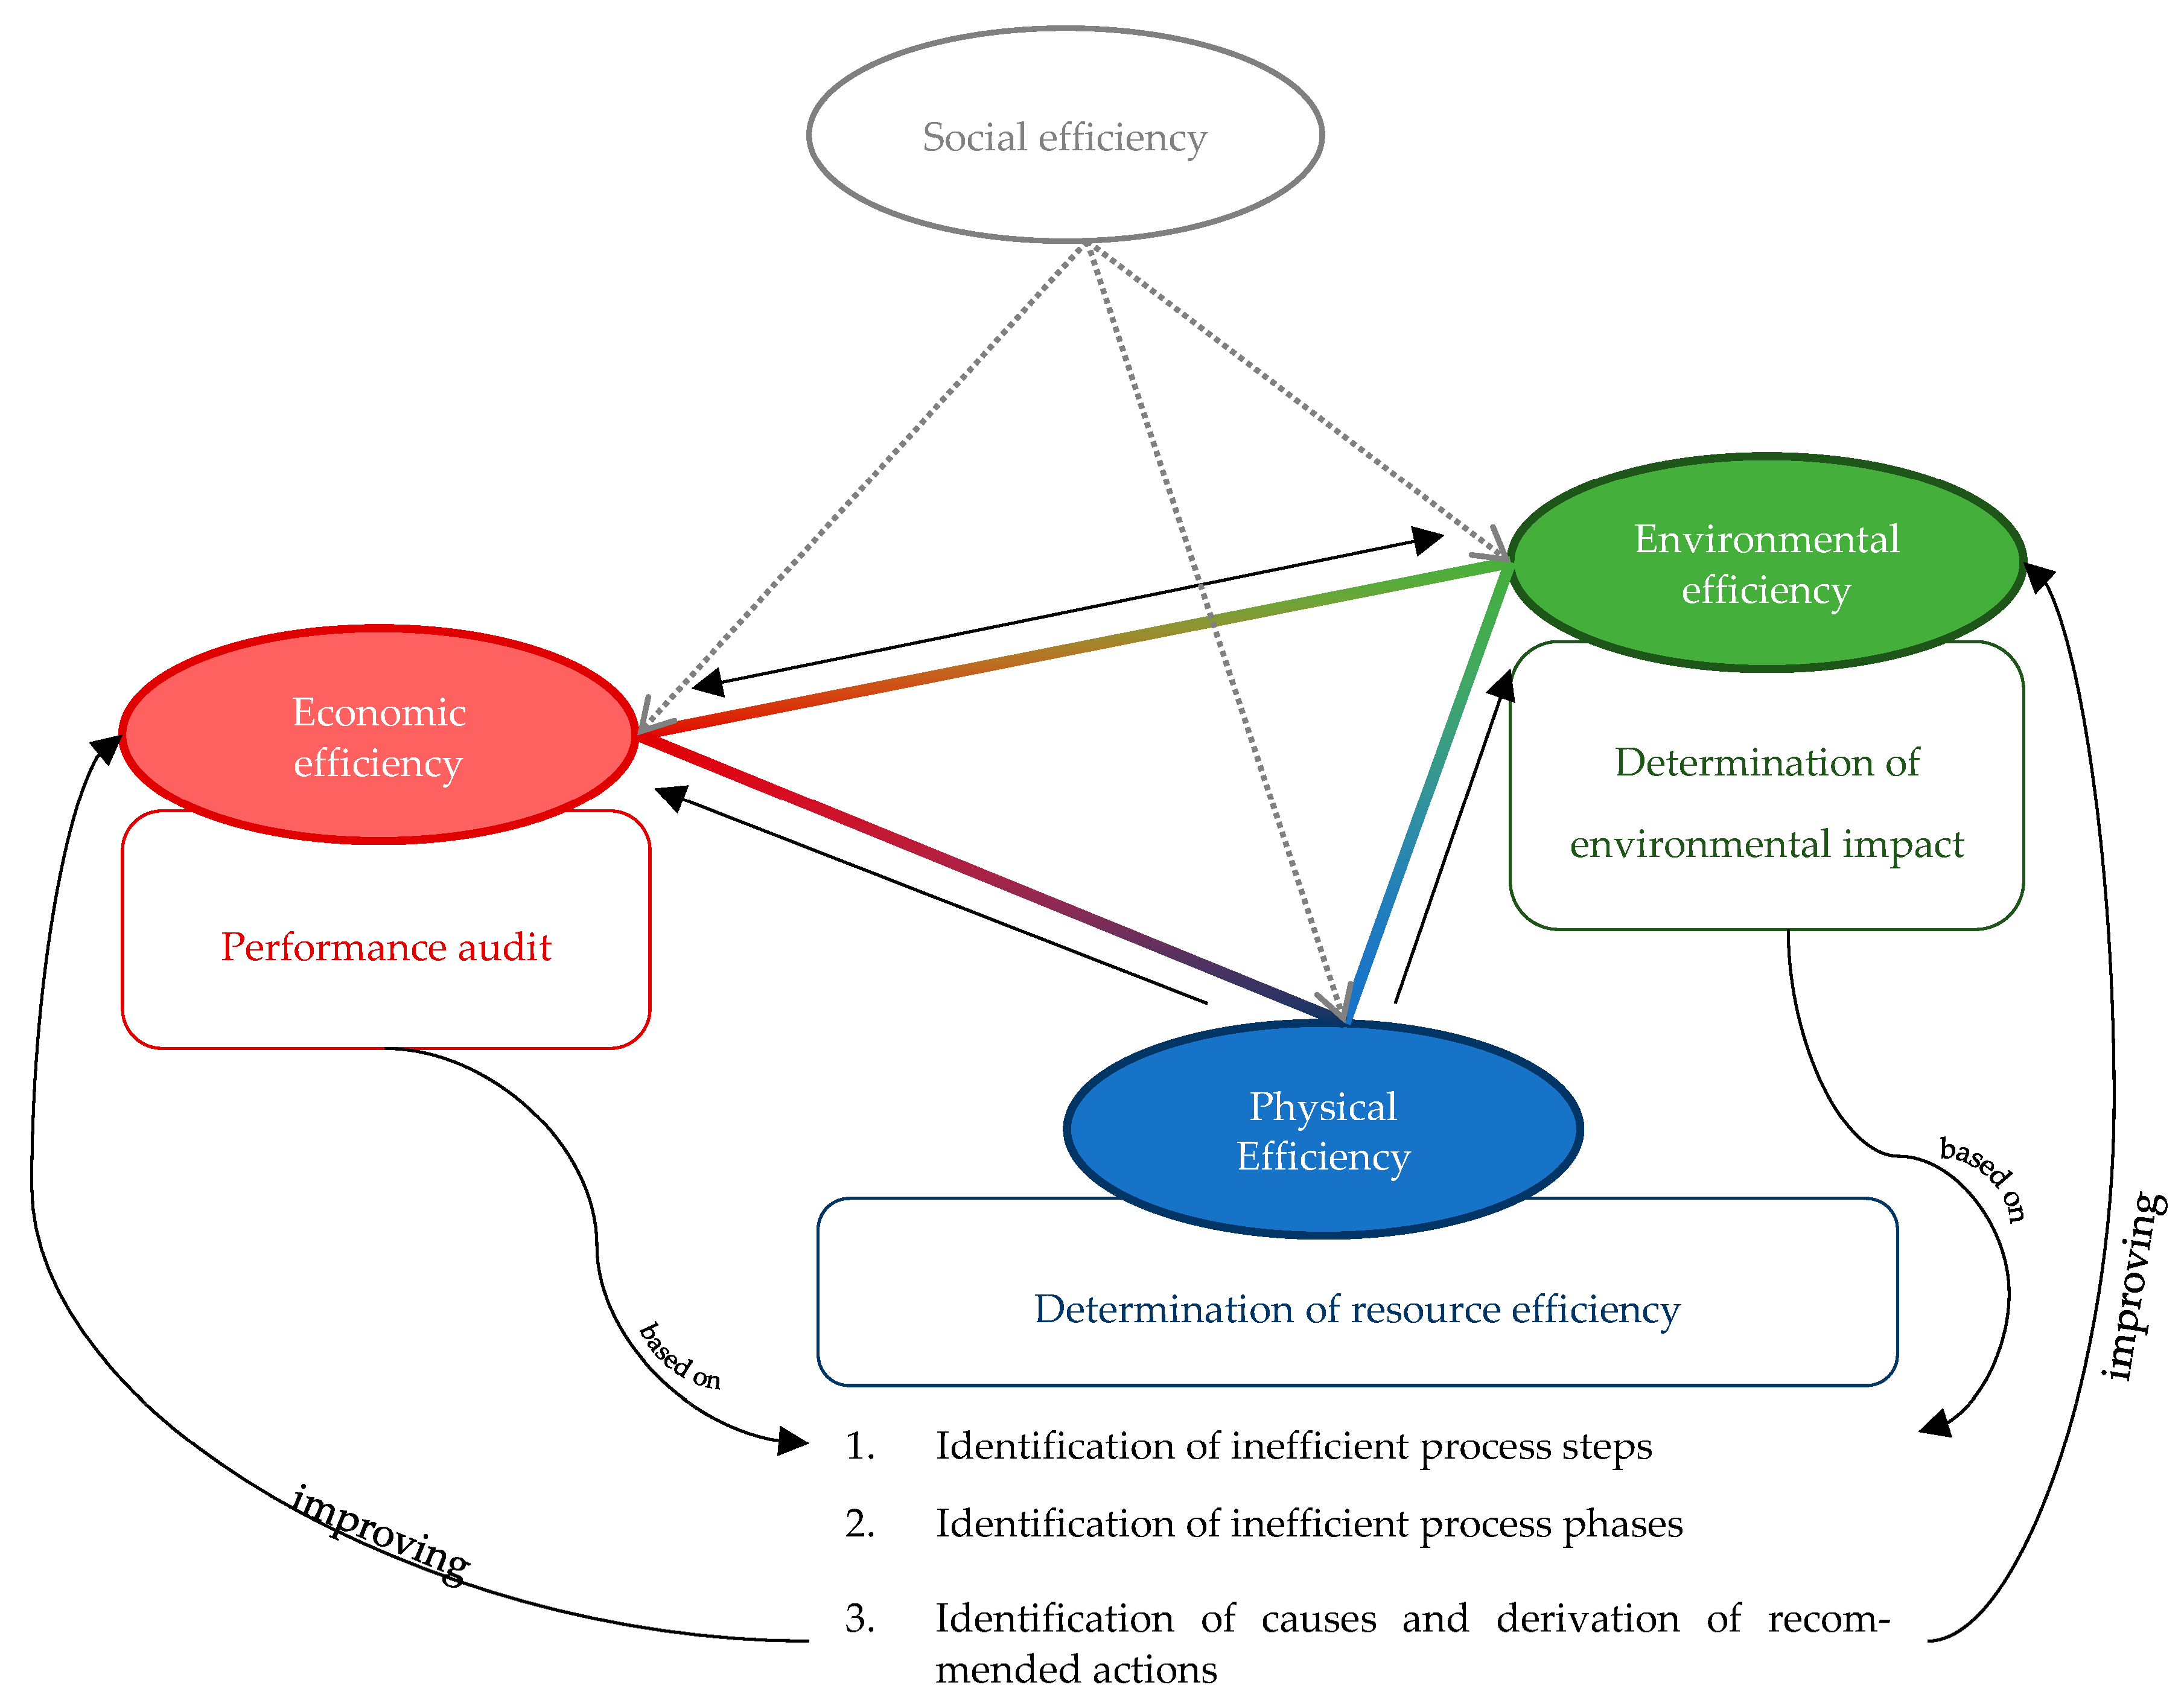
Furthermore, a purely ecological, economic, or physical examination of a process is usually not sufficient. Economically excellent processes are often not environmentally compatible, and vice versa. Even very high efficiency in the operation of the process can result in very high acquisition costs or the handling of toxic chemicals, for example.
The identified interactions between economic, environmental, and physical efficiency are presented in
Figure 4.
Social factors not analyzed here also play a role in the decision-making process based on the efficiency evaluation since they do not directly reflect the efficiency but rather the social compatibility of a process or product. Before introducing a product and within the scope of planning a technical plant, ethical factors must, of course, be analyzed.
6.5. Approaches in Literature
Some methods already address the challenges described in
Section 6.6 in general, but not for P2X systems. Three of these approaches are described in the following subsections.
6.5.1. PIUS-Check
The PIUS-check is a process-oriented material flow analysis for increasing resource efficiency in manufacturing companies. The aim of the PIUS-check is to develop a catalog of economic measures to make specific processes more efficient within a manageable time frame and with a low financial investment. The PIUS-check addresses the following objectives:
The PIUS-check is a consultation on energy efficiency. It is offered by various service providers and is not applicable by laymen or process operators themselves. The application can only be made to existing processes. Process selection based on the PIUS-check is not provided [
88].
6.5.2. EDUAR&D
The EDUAR&D methodology, short for energy data and analysis research and development, is used to evaluate energy efficiency techniques. It is a structured search and analysis process that combines different methodological approaches for the presentation, analysis, and evaluation of the technologies. The aim is to derive recommendations for action, e.g., with regard to setting thematic priorities for future energy research within the framework of research funding and for energy policy [
89].
The focus of this method is already defined in its name and is limited exclusively to research and development. However, the approach could conceivably be applied to process selection and optimization.
6.5.3. Green Chemistry Metrics
Green chemistry metrics (GCM) is a rating system that describes the principles of green chemistry through KPIs. The aim is to be able to quantify technical and ecological progress in the chemical sector.
The evaluation system allows the comparison of different chemical synthesis routes and the selection of the “greenest” process [
90].
Admittedly, this evaluation system is limited to the chemical sector. However, the transfer of this approach and the development of a KPI system for P2X systems would be conceivable. Thus, ecological, economic, and social aspects could be used to select the best process or improve an existing one.
6.6. Integrated Approach for Power-to-X Systems
The examination of the researched KPIs has shown that a purely physical, ecological, or economic evaluation is not sufficient. This applies both to process selection and the improvement of existing processes.
However, based on the approaches presented in
Section 6.5, a combination of different metrics would be conceivable. The choice of metrics used depends on the use case (such as GCM for the chemical sector) and the expertise of the user.
For the evaluation of P2X systems, according to the previous studies, a combination of LCA, PhO, and DEA seems particularly useful. An iterative approach could identify an intersection between the best economics and the best environmental performance. By including social aspects, this approach would allow for a holistic efficiency assessment. With a defined balance sheet boundary and a defined procedure for determining the three KPIs, comparability across different P2X processes is given. Depending on the focus of the assessment (e.g., economic feasibility or high sustainability with a research focus), weighting factors could be developed to determine an overall value.
The effects of possible process improvements can be examined through an iterative approach and the respective recalculation of the three KPIs. Based on this approach, the selection of the most suitable process in the planning of a P2X process chain would be possible. Furthermore, the holistic view enables the identification of the reasons for inefficiencies and, thus, the derivation of specific recommendations for action.
In further work by the authors, validation of this approach will be carried out using water electrolysis as an example.
7. Conclusions
This study identified various methods for evaluating physical, environmental, and economic efficiency that are fundamentally suited for evaluations of P2X processes. Considering an evaluation system based on simple yes/no criteria, these indicators were evaluated in terms of their applicability.
This study examined the literature on the evaluation of the technical efficiency of P2X processes, which is usually intended to improve a process’s resource efficiency. This can only be performed by going through the three levels of efficiency evaluation.
Each method considered in this paper has its advantages and disadvantages. The selection of the evaluation method to be used for the efficiency evaluation is up to the user and largely depends on the objectives of the process evaluation. This study of environmental, economic, and physical indicators for efficiency evaluation demonstrated that the evaluation based on physical indicators is preferable for a comprehensive evaluation of P2X systems. In most cases, these indicators are used to evaluate a process’s technical efficiency and identify technical optimization capabilities.
Environmental indicators, on the other hand, are often used to estimate the environmental impact of a particular production process. They are intended to make the user aware of consequences and to create ecological competition without making specific suggestions for improvement derivable [
5,
91].
Economic indicators are used to evaluate a process’s economic efficiency and to classify processes in the market economy framework. Although a process’s resource efficiency influences its economic efficiency, resource-inefficient processes may be more cost-effective in a given economic and political situation. Especially concerning the effects of the high greenhouse gas emissions of technically inefficient processes, an economic consideration should only be adopted after extensive testing and improvement of resource efficiency.
Before a process can be implemented on a large scale, its environmental and economic efficiency must be evaluated comprehensively. While a process’s environmental efficiency specifies its environmental compatibility throughout its entire life cycle, its technical efficiency can be used to improve its execution. Without an examination of economic efficiency, a market introduction of the process is not economical and, therefore, not reasonable.
This study revealed that no method is fully able to cover all three levels of process evaluation at this time.
However, as part of the investigations, an approach was developed with which it is possible to carry out a holistic efficiency assessment specifically for, but not limited to, P2X processes. This approach combines ecological, economic, and physical aspects of energy efficiency and addresses all three levels of efficiency assessment equally. This can support both process design and selection as well as the improvement of an existing process.
Author Contributions
Conceptualization, N.E.; methodology, N.E.; validation, N.E. and T.B.; formal analysis, N.E.; investigation, N.E. and L.K.; resources, T.B.; data curation, N.E.; writing—original draft preparation, N.E.; writing—review and editing, L.K., T.B. and B.S.; visualization, N.E.; supervision, A.H.; project administration, T.B. and B.S. All authors have read and agreed to the published version of the manuscript.
Funding
This research received no external funding.
Institutional Review Board Statement
Not applicable.
Informed Consent Statement
Not applicable.
Data Availability Statement
No new data were created or analyzed in this study. Data sharing is not applicable to this article.
Acknowledgments
The authors thank Krister Johnson (Fraunhofer Institute for Factory Operation and Automation, IFF) for giving linguistic and structural advice and Maria Marina Zempeltzi (Fraunhofer, IFF) for her ideas for visualizing our findings. We thank Paula Wenzel (University of Stuttgart) and Samanta Weber (University of Applied Sciences Flensburg) for their valuable tips and the discussion on efficiency evaluation.
Conflicts of Interest
The authors declare no conflict of interest.
References
- Fröhling, M.; Hiete, M. Sustainability and Life Cycle Assessment in Industrial Biotechnology: A Review of Current Approaches and Future Needs. Adv. Biochem. Eng. Biotechnol. 2020, 173, 143–203. [Google Scholar] [CrossRef] [PubMed]
- Domínguez, E.; Pérez, B.; Rubio, Á.L.; Zapata, M.A. A Taxonomy for Key Performance Indicators Management. J. Comput. Stand. Interfaces 2018, 64, 24–40. [Google Scholar] [CrossRef]
- Harangozó, G.; Széchy, A.; Zilahy, G. Corporate Sustainability Footprints—A Review of Current Practices. In Corporate Carbon and Climate Accounting; Schaltegger, S., Zvezdov, D., Etxeberria, I.A., Csutora, M., Günther, E., Eds.; Springer International Publishing: Cham, Switzerland, 2015; pp. 45–76. [Google Scholar]
- Pereira, H.; Marques, R.C. An analytical review of irrigation efficiency measured using deterministic and stochastic models. Agric. Water Manag. 2017, 184, 28–35. [Google Scholar] [CrossRef]
- Colla, M.; Ioannou, A.; Falcone, G. Critical Review of Competitiveness Indicators for Energy Projects. Renew. Sustain. Energy Rev. 2020, 125, 109794. [Google Scholar] [CrossRef]
- Lundholm, T.; Lieder, M.; Rumpel, G. Resource Efficiency Assessment System. In Leveraging Technology for a Sustainable World; Dornfeld, D.A., Linke, B.S., Eds.; Springer: Berlin/Heidelberg, Germany, 2012; pp. 423–427. [Google Scholar]
- Denwigwe, I.H.; Babatunde, O.M.; Babatunde, D.E.; Akintunde, T.J.; Akinbulire, T.O. A Technical Review on Methods and Tools for Evaluation of Energy Footprints, Impact on Buildings and Environment. In Energy Footprints of the Bio-Refinery, Hotel, and Building Sectors; Muthu, S.S., Ed.; Springer: Singapore, 2019; pp. 47–81. [Google Scholar]
- Menghi, R.; Papetti, A.; Germani, M.; Marconi, M. Energy efficiency of manufacturing systems: A review of energy assessment methods and tools. J. Clean. Prod. 2019, 240, 118276. [Google Scholar] [CrossRef]
- Wenzel, P.M.; Radgen, P. Multi-Criteria Comparison of Energy and Environmental Assessment Approaches for the Example of Cooling Towers. Appl. Syst. Innov. 2022, 5, 89. [Google Scholar] [CrossRef]
- Chopin, P.; Mubaya, C.P.; Descheemaeker, K.; Öborn, I.; Bergkvist, G. Avenues of improving farming sustainability assessment with upgraded tools, sustainability framing and indicators: A review. Agron. Sustain. Dev. 2021, 41, 19. [Google Scholar] [CrossRef]
- Dantas, T.E.T.; Soares, S.R. Systematic literature review on the application of life cycle sustainability assessment in the energy sector. Environ. Dev. Sustain. 2021, 24, 1583–1615. [Google Scholar] [CrossRef]
- Dyckhoff, H.; Souren, R. Integrating multiple criteria decision analysis and production theory for performance evaluation: Framework and review. Eur. J. Oper. Res. 2021, 297, 795–816. [Google Scholar] [CrossRef]
- Amoako, G.K.; Adam, A.M.; Arthur, C.L.; Tackie, G. Institutional isomorphism, environmental management accounting and environmental accountability: A review. Environ. Dev. Sustain. 2021, 23, 11201–11216. [Google Scholar] [CrossRef]
- Kullmann, F.; Markewitz, P.; Stolten, D.; Robinius, M. Combining the worlds of energy systems and material flow analysis: A review. Energy Sustain. Soc. 2021, 11, 13. [Google Scholar] [CrossRef]
- Su, S.; Zhang, H.; Zuo, J.; Li, X.; Yuan, J. Assessment models and dynamic variables for dynamic life cycle assessment of buildings: A review. Environ. Sci. Pollut. Res. 2021, 28, 26199–26214. [Google Scholar] [CrossRef] [PubMed]
- Suprayoga, G.B.; Bakker, M.; Witte, P.; Spit, T. A systematic review of indicators to assess the sustainability of road infrastructure projects. Eur. Transp. Res. Rev. 2020, 12, 19. [Google Scholar] [CrossRef]
- Gao, J.; Xiao, M.; Zhang, Y.; Gao, L. A Comprehensive Review of Isogeometric Topology Optimization: Methods, Applications and Prospects. Chin. J. Mech. Eng. 2020, 33, 87. [Google Scholar] [CrossRef]
- Willet, J.; Wetser, K.; Vreeburg, J.; Rijnaarts, H.H. Review of methods to assess sustainability of industrial water use. Water Resour. Ind. 2019, 21, 100110. [Google Scholar] [CrossRef]
- Tallapragada, P.; Shkaratan, M.; Izaguirre, A.K.; Hellerante, J.; Rahman, S.; Bergman, S. Monito Ring Performance of Electric Utilities: Indicators and Benchmarking in Sub-Saharan Africa; World Bank: Washington, DC, USA, 2009. [Google Scholar]
- Kourkoumpas, D.-S.; Benekos, G.; Nikolopoulos, N.; Karellas, S.; Grammelis, P.; Kakaras, E. A review of key environmental and energy performance indicators for the case of renewable energy systems when integrated with storage solutions. Appl. Energy 2018, 231, 380–398. [Google Scholar] [CrossRef]
- Banasik, A.; Bloemhof-Ruwaard, J.M.; Kanellopoulos, A.; Claassen, G.D.H.; Van Der Vorst, J.G.A.J. Multi-criteria decision making approaches for green supply chains: A review. Flex. Serv. Manuf. J. 2018, 30, 366–396. [Google Scholar] [CrossRef]
- Sureau, S.; Mazijn, B.; Garrido, S.R.; Achten, W.M.J. Social life-cycle assessment frameworks: A review of criteria and indicators proposed to assess social and socioeconomic impacts. Int. J. Life Cycle Assess. 2018, 23, 904–920. [Google Scholar] [CrossRef]
- Martín-Gamboa, M.; Iribarren, D.; García-Gusano, D.; Dufour, J. A review of life-cycle approaches coupled with data envelopment analysis within multi-criteria decision analysis for sustainability assessment of energy systems. J. Clean. Prod. 2017, 150, 164–174. [Google Scholar] [CrossRef]
- Li, M.-J.; Tao, W.-Q. Review of methodologies and polices for evaluation of energy efficiency in high energy-consuming industry. Appl. Energy 2017, 187, 203–215. [Google Scholar] [CrossRef]
- Pihkola, H.; Pajula, T.; Federley, M.; Myllyoja, J.; Tapia, C.; Ritthoff, M. Sustainability Assessment in the Sustanability Assessment in the Process Industries—Current Practiceand Paths for Future Development: Conclusions and Recommendations from the SAMT Project; Tecnalia Research & Innovation (TRI): Derio, Spain, 2017. [Google Scholar]
- Horschig, T.; Thrän, D. Are decisions well supported for the energy transition? A review on modeling approaches for renewable energy policy evaluation. Energy Sustain. Soc. 2017, 7, 5. [Google Scholar] [CrossRef]
- Andiappan, V. State-Of-The-Art Review of Mathematical Optimisation Approaches for Synthesis of Energy Systems. Process Integr. Optim. Sustain. 2017, 1, 165–188. [Google Scholar] [CrossRef]
- Kylili, A.; Fokaides, P.A.; Jimenez, P.A.L. Key Performance Indicators (KPIs) approach in buildings renovation for the sustainability of the built environment: A review. Renew. Sustain. Energy Rev. 2016, 56, 906–915. [Google Scholar] [CrossRef]
- Letrache, K.; El Beggar, O.; Ramdani, M. Modeling and creating KPIs in MDA approach. In Proceedings of the 2016 4th IEEE International Colloquium on Information Science and Technology (CiSt), Tangier, Morocco, 24–26 October 2016; pp. 222–227. [Google Scholar]
- Strantzali, E.; Aravossis, K. Decision making in renewable energy investments: A review. Renew. Sustain. Energy Rev. 2016, 55, 885–898. [Google Scholar] [CrossRef]
- Kanabar, B.K.; Ramani, B.M. Energy and Exergy Analysis of Vapour Absorption Refrigeration Cycle—A Review. J. Inst. Eng. (India) Ser. C 2016, 97, 479–491. [Google Scholar] [CrossRef]
- Angelakoglou, K.; Gaidajis, G. A review of methods contributing to the assessment of the environmental sustainability of industrial systems. J. Clean. Prod. 2015, 108, 725–747. [Google Scholar] [CrossRef]
- Dakpo, K.H.; Jeanneaux, P.; Latruffe, L. Modelling pollution-generating technologies in performance benchmarking: Recent developments, limits and future prospects in the nonparametric framework. Eur. J. Oper. Res. 2016, 250, 347–359. [Google Scholar] [CrossRef]
- Uhde, B.; Hahn, W.A.; Griess, V.C.; Knoke, T. Hybrid MCDA Methods to Integrate Multiple Ecosystem Services in Forest Management Planning: A Critical Review. Environ. Manag. 2015, 56, 373–388. [Google Scholar] [CrossRef]
- Vilanova, M.R.N.; Filho, P.M.; Balestieri, J.A.P. Performance measurement and indicators for water supply management: Review and international cases. Renew. Sustain. Energy Rev. 2015, 43, 1–12. [Google Scholar] [CrossRef]
- Santoyo-Castelazo, E.; Azapagic, A. Sustainability assessment of energy systems: Integrating environmental, economic and social aspects. J. Clean. Prod. 2014, 80, 119–138. [Google Scholar] [CrossRef]
- Song, C.; Li, M.; Wen, Z.; He, Y.-L.; Tao, W.-Q.; Li, Y.; Wei, X.; Yin, X.; Huang, X. Research on energy efficiency evaluation based on indicators for industry sectors in China. Appl. Energy 2014, 134, 550–562. [Google Scholar] [CrossRef]
- Yingjie, Z. Energy efficiency techniques in machining process: A review. Int. J. Adv. Manuf. Technol. 2014, 71, 1123–1132. [Google Scholar] [CrossRef]
- Johnsen, F.M.; Løkke, S. Review of criteria for evaluating LCA weighting methods. Int. J. Life Cycle Assess. 2013, 18, 840–849. [Google Scholar] [CrossRef]
- Rosen, M.A. Using Exergy to Assess Regional and National Energy Utilization: A Comparative Review. Arab. J. Sci. Eng. 2013, 38, 251–261. [Google Scholar] [CrossRef]
- Gasparatos, A.; Scolobig, A. Choosing the most appropriate sustainability assessment tool. Ecol. Econ. 2012, 80, 1–7. [Google Scholar] [CrossRef]
- Lebacq, T.; Baret, P.; Stilmant, D. Sustainability indicators for livestock farming. A review. Agron. Sustain. Dev. 2013, 33, 311–327. [Google Scholar] [CrossRef]
- Chung, W. Review of building energy-use performance benchmarking methodologies. Appl. Energy 2011, 88, 1470–1479. [Google Scholar] [CrossRef]
- Gasparatos, A. Embedded value systems in sustainability assessment tools and their implications. J. Environ. Manag. 2010, 91, 1613–1622. [Google Scholar] [CrossRef]
- Ness, B.; Urbel-Piirsalu, E.; Anderberg, S.; Olsson, L. Categorising tools for sustainability assessment. Ecol. Econ. 2007, 60, 498–508. [Google Scholar] [CrossRef]
- Hajkowicz, S.; Collins, K. A Review of Multiple Criteria Analysis for Water Resource Planning and Management. Water Resour. Manag. 2007, 21, 1553–1566. [Google Scholar] [CrossRef]
- Finnveden, G.; Moberg, Å. Environmental systems analysis tools—An overview. J. Clean. Prod. 2005, 13, 1165–1173. [Google Scholar] [CrossRef]
- Phylipsen, G.J.M.; Blok, K.; Worrel, E. International comparisons of energy efficiency-Methodologies for the manufacturing industry. Energy Policy 1997, 25, 715–725. [Google Scholar] [CrossRef]
- Tyteca, D. On the Measurement of the Environmental Performance of Firms—A Literature Review and a Productive Efficiency Perspective. J. Environ. Manag. 1996, 46, 281–308. [Google Scholar] [CrossRef]
- Neely, A.; Greogory, M.; Platts, K. Performance measurement system design: A literature review and research agenda. Int. J. Oper. Prod. Manag. 1995, 15, 80–116. [Google Scholar] [CrossRef]
- VDI 4600; Kumulierter Energieaufwand (KEA): Begriffe, Berechnungsmethoden. Verein Deutscher Ingenieure: Düsseldorf, Germany, 2012.
- Chen, W.-Y.; Suzuki, T.; Lackner, M. Handbook of Climate Change Mitigation and Adaptation; Springer International Publishing: Cham, Switzerland, 2017. [Google Scholar]
- Schmidt, M.; Spieth, H.; Bauer, J.; Haubach, C. (Eds.) 100 Betriebe für Ressourceneffizienz: Band 1—Praxisbeispiele aus der Produzierenden Wirtschaft; Springer Spektrum: Berlin/Heidelberg, Germany, 2017. [Google Scholar]
- Radaal, H.L.; Modahl, I.S.; Bakken, T.H. Energy Indicators for Electricity Production: Comparing Technologies and the Nature of the Indicators Energy Payback Ratio (EPR), Net Energy Ratio (NER) and Cumulative Energy Demand (CED); Ostfold Research: Oslo, Norway, 2012. [Google Scholar]
- Das, S.; Kundu, A. Benchmarking a country for efficiency improvement: A DEA-based approach. J. Glob. Entrep. Res. 2019, 9, 89. [Google Scholar] [CrossRef]
- Hernandez-Sancho, F.; Picazo-Tadeo, A.; Reig-Martinez, E. Efficiency and Environmental Regulation: An Application to Spanish Wood Goods and Furnischings Industry. Environ. Resour. Econ. 1999, 15, 365–378. [Google Scholar] [CrossRef]
- Bogetoft, P.; Hougaard, J.L. Efficiency Evaluations Based on Potential (Non-Proportional) Improvements. J. Product. Anal. 1998, 12, 233–247. [Google Scholar] [CrossRef]
- Düsseldorf, P.C. Regulierung in der Deutschen Energiewirtschaft. Band I Netzwirtschaft: Band I Netzwirtschaft—Praxishandbuch zum Energiewirtschaftsgesetz; Haufe: Freiburg im Breisgau, Germany, 2020. [Google Scholar]
- Abu Bakar, N.N.; Hassan, M.Y.; Abdullah, H.; Rahman, H.A.; Abdullah, M.P.; Hussin, F.; Bandi, M. Energy efficiency index as an indicator for measuring building energy performance: A review. Renew. Sustain. Energy Rev. 2015, 44, 1–11. [Google Scholar] [CrossRef]
- McKenna, R.; Herbes, C.; Fichtner, W. Energieautarkie: Definitionen, Für-bzw. Gegenargumente, und Entstehende Forschungsbedarfe; Karlsruhe Institute of Technology (KIT): Karlsruhe, Germany, 2015. [Google Scholar]
- DIN 50006; DIN Deutsches Institut für Normung e.V. Energiemanagementsysteme—Messung der energiebezogenen Leistung unter Nutzung von energetischen Ausgangsbasen (EnB) und Energieleistungskennzahlen (EnPI): Allgemeine Grundsätze und Leitlinien. Beuth Verlag GmbH: Berlin, Germany, 2017.
- Schulze, M.; Nehler, H.; Ottosson, M.; Thollander, P. Energy management in industry—A systematic review of previous findings and an integrative conceptual framework. J. Clean. Prod. 2016, 112, 3692–3708. [Google Scholar] [CrossRef]
- Kleinjans, M.; Kröhnert, K.; Kotschenreuther, J. EEE—Die Formel zur Messung der Energieeffizienz. Available online: https://www.pressebox.de/pressemitteilung/kroehnert-infotecs-gmbh/EEE-Die-Formel-zur-Messung-der-Energieeffizienz/boxid/568356 (accessed on 6 August 2022).
- KGrabowski; Kubin, K.; Ernst, C.; Diehl, S.; Melsheimer, J. Entwicklung einer Methodik zur Aufstellung von Energiekennzahlen zur Steigerung der Energieeffizienz in Unternehmen: Methodik zur Aufstellung von Energiekennzahlen. Berlin, Germany, 2015. Available online: https://www.google.com/url?sa=t&rct=j&q=&esrc=s&source=web&cd=&ved=2ahUKEwigtLH3ge_8AhW6gf0HHZqsC9EQFnoECA0QAQ&url=https%3A%2F%2Fwww.oekotec.de%2Fwp-content%2Fuploads%2F2022%2F02%2FKennzahlmethodik-Methodik-OeKOTEC-Energiemanagement-GmbH.pdf&usg=AOvVaw3I7CdPkO40GoX4uWwoh8zy (accessed on 25 January 2023).
- Baehr, H.D. Thermodynamik: Eine Einführung in die Grundlagen Und Ihre Technischen Anwendungen; Springer: Berlin/Heidelberg, Germany, 1966. [Google Scholar]
- Sala, S.; Farioli, F.; Zamagni, A. Life cycle sustainability assessment in the context of sustainability science progress (part 2). Int. J. Life Cycle Assess. 2013, 18, 1686–1697. [Google Scholar] [CrossRef]
- DIN EN ISO 14040; Deutsches Institut für Normung e.V. Umweltmanagement—Ökobilanz: Grundsätze und Rahmenbedingungen. Beuth Verlag GmbH: Berlin, Germany, 2009.
- Kumar, A.; Sah, B.; Singh, A.R.; Deng, Y.; He, X.; Kumar, P.; Bansal, R.C. A review of multi criteria decision making (MCDM) towards sustainable renewable energy development. Renew. Sustain. Energy Rev. 2017, 69, 596–609. [Google Scholar] [CrossRef]
- Drumm, C.; Busch, J.; Dietrich, W.; Eickmans, J.; Jupke, A. STRUCTese®—Energy efficiency management for the process industry. Chem. Eng. Process. 2013, 67, 99–110. [Google Scholar] [CrossRef]
- Brundage, M.; Chang, Q.; Wang, S.; Feng, S.; Xiao, G.; Arinez, J. Energy Savings Opportunities and Energy Efficiency Performance Indicators for a Serial Production Line. In Advances in Production Management Systems. Sustainable Production and Service Supply Chains; Prabhu, V., Taisch, M., Kiritsis, D., Eds.; Springer: Berlin/Heidelberg, Germany, 2013; pp. 302–309. [Google Scholar]
- VDI 4075; Produktionsintegrierter Umweltschutz (PIUS): Grundlagen und Anwendungsbereich. Verein Deutscher Ingenieure: Düsseldorf, Germany, 2014.
- Eggers, N.; Böttger, J.N.J.; Kerpen, L.; Sankol, B.U.; Birth, T. Refining VDI guideline 4663 to evaluate the efficiency of a power-to-gas process by employing limit-oriented indicators. Energy Effic. 2021, 14, 73. [Google Scholar] [CrossRef]
- Binding, H.J. Grundlagen zur Systematischen Reduzierung des Energie-und Materialeinsatzes. Dissertation; RWTH Aachen University: Aachen, Germany, 1988. Available online: https://www.osti.gov/etdeweb/biblio/5314702 (accessed on 25 January 2023).
- Mainali, B.; Silveira, S. Using a sustainability index to assess energy technologies for rural electrification. Renew. Sustain. Energy Rev. 2015, 41, 1351–1365. [Google Scholar] [CrossRef]
- Erlach, K. Energiewertstrom: Der Weg zur Energieeffizienten Fabrik; Fraunhofer Verlag: Stuttgart, Germany, 2009. [Google Scholar]
- Xu, Q.; Ji, Y.; Qin, L.; Leung, P.; Qiao, F.; Li, Y.; Su, H. Evaluation of redox flow batteries goes beyond round-trip efficiency: A technical review. J. Energy Storage 2018, 16, 108–115. [Google Scholar] [CrossRef]
- Lechner, J.S.C. (Ed.) Stationäre Gasturbinen, 3rd ed.; Springer Vieweg: Berlin/Heidelberg, Germany, 2019. [Google Scholar]
- Braun, J. Thermodynamische Grundlagen. In Stationäre Gasturbinen, 3rd ed.; Lechner, J.S.C., Ed.; Springer Vieweg: Berlin/Heidelberg, Germany, 2019. [Google Scholar]
- Zhou, P.; Wu, F.; Zhou, D.Q. Total-factor energy efficiency with congestion. Ann. Oper. Res. 2017, 255, 241–256. [Google Scholar] [CrossRef]
- Hoekstra, A.; Steinbuch, M. Comparing the Lifetime Green House Gas Emissions of Electric Cars with the Emissions of Cars Using Gasoline or Diesel; Eindhoven University of Technology: Eindhoven, The Netherlands, 2020. [Google Scholar]
- Asmild, M.; Hougaard, J.L.; Kronborg, D. Do efficiency scores depend on input mix? A statistical test and empirical illustration. Ann. Oper. Res. 2013, 211, 37–48. [Google Scholar] [CrossRef]
- VDI 4663; Bewertung von Stoff-und Energieeffizienz: Methodische Anwendung des Physikalischen Optimums. Verein Deutscher Ingenieure: Düsseldorf, Germany, 2019.
- Wesselak, V.; Schabbach, T.; Fischer, J.; Link, T. Handbuch Regenerative Energietechnik, 3rd ed.; Springer Vieweg: Berlin/Heidelberg, Germany, 2017. [Google Scholar]
- Riedl, K. Exergetische und Exergoökonomische Bewertung von Verfaren der Energie-und Stoffumwandlung. Ph.D. Dissertation, Martin-Luther-Universität, Halle-Wittenberg, Germany, 2006. [Google Scholar]
- Grambow, M. Theorie und Methodik der Nachhaltigkeit. In Nachhaltige Wasserbewirtschaftung: Konzept und Umsetzung Eines Vernünftigen Umgangs mit dem Gemeingut Wasser; Grambow, M., Ed.; Vieweg+Teubner Verlag: Wiesbaden, Germany, 2013; pp. 37–90. [Google Scholar]
- Vollmar, B.H. Controlling und Nachhaltigkeit. In Praxishandbuch Controlling; Becker, W., Ulrich, P., Eds.; Springer Fachmedien Wiesbaden: Wiesbaden, Germany, 2015; pp. 1–30. [Google Scholar]
- Effizienz-Agentur, N.R.W. PIUS-Check: Umweltschutz Integrieren, Produktionskosten Senken. [22 August 2022]. Available online: https://www.ressourceneffizienz.de/leistung/ressourceneffizienz-beratung/pius-check (accessed on 29 April 2022).
- STF Gruppe GmbH. PIUS-Check: Umweltschutz und Energieeffizienz Erfolgreich Kombinieren. [22 August 2022]. Available online: https://www.stf-gruppe.de/magazin/tga_pius-check_energieeffizienz_umweltschutz/ (accessed on 30 July 2022).
- Schäfer, B.; Chacón, F.; Brinkmann, T.; Drews, A.; Jochem, E.; Sauer, J. Bewertung von Energieeffizienztechnologien mit der Methodik EDUAR&D an Zwei Beispielen. Chem. Ing. Tech. 2021, 93, 1247–1256. [Google Scholar] [CrossRef]
- Lapkin, A.; Constable, D. (Eds.) Green Chemistry Metrics: Measuring and Monitoring Sustainable Processes; Blackwell: Chichester, UK, 2009. [Google Scholar]
- Schaltegger, S.; Gibassier, D.; Zvezdov, D. Is environmental management accounting a discipline? A bibliometric literature review. Meditari Account. Res. 2013, 21, 4–31. [Google Scholar] [CrossRef]
| Disclaimer/Publisher’s Note: The statements, opinions and data contained in all publications are solely those of the individual author(s) and contributor(s) and not of MDPI and/or the editor(s). MDPI and/or the editor(s) disclaim responsibility for any injury to people or property resulting from any ideas, methods, instructions or products referred to in the content. |
© 2023 by the authors. Licensee MDPI, Basel, Switzerland. This article is an open access article distributed under the terms and conditions of the Creative Commons Attribution (CC BY) license (https://creativecommons.org/licenses/by/4.0/).


