Abstract
Currently, the search for alternative sources of energy is not only due to the scarcity of non-renewable sources, since these still have an availability capable of meeting actual consumption needs, but also due to the negative environmental impacts that its consumption presents. Thus, the use of biomass as a renewable and sustainable energy source is increasingly presented as an alternative that must be taken into account. Torrefaction is a conversion process that aims to improve the properties of biomass through its thermal decomposition at temperatures between 220 and 320 °C. Torrefaction can be defined by several variables, which have an impact on the final quality of the torrefied biomass. Therefore, there is an increase in the number of studies involving this topic, in order to improve the production of biomass and its use as a renewable energy source, in addition to reducing the costs of this process. In this work, a protocol was developed for a laboratory test procedure to produce low-cost torrefied biomass samples using equipment that can present a cost reduction of around 90%. The samples were analyzed to prove the viability of the developed protocol. The results obtained agree with the current literature, also confirming the improvement of the biomass properties. This work can serve as a platform for the development of other technologies, such as gasification for the production of hydrogen from torrefied biomass.
1. Introduction
Fossil energy is, nowadays, the primary source used worldwide. Despite the scarcity of these energy source expected within the next 50 years, some authors, such as Matias and Devezas (2007), argue that this will not be the motive leading to their replacement by alternative sources, but rather a new technological, environmental, and social paradigm, being imperative to reduce CO2 emissions, responsible for the greenhouse effect and climate change, using renewable sources [1].
Biomass is the oldest source of energy used by humans, and is becoming increasingly promising, mainly based on its properties, allowing it to replace fossil energy, and consequently reducing greenhouse gases (GHG). This energy source can be transformed directly into energy, or into another secondary source allowing storage, using thermal, thermochemical, chemical, or biochemical processes [2].
Biomass is basically formed by hemicellulose, cellulose, lignin, and other organic and inorganic compounds. The content of these components depends on the biomass origin and type [3]. Cellulose, hemicellulose, and lignin behave differently during thermal decomposition. The temperature of thermal decomposition (TTD) of hemicellulose ranges between 220 to 320 °C. On the other hand, cellulose decomposes at temperatures in the range from 315 to 400 °C. TTD for lignin varies in the range from 160 to 900 °C, showing a more gradual decomposition [3].
Despite the advantages, when compared to fossil fuels, it is crucial to consider density, moisture content, and hydrophilic nature, which cause the decrease of the heating value (HV), making difficult its wide use [4]. These characteristics affect directly the logistics associated with biomass-to-energy production.
Torrefaction can be used to improve biomass properties, since it modifies its physical and chemical composition, with a slow heating rate in a temperature range of 220–320 °C, with an atmosphere poor in oxygen (O2) [5]. This process improves the efficiency of biomass co-combustion and co-gasification. Many recent studies analyzed torrefaction variables on biomass chemical and physical properties [6]. The potential of biomass to substitute fossil sources entails some drawbacks, namely the increase in its price and consequences on the environmental level due to its overexploitation. As such, research on this topic has increased [7].
However, despite the advantages attributed to biomass torrefaction, as a process capable of presenting alternative products to traditional sources of fossil origin, there is still no widespread use and production on an industrial scale. This is due, essentially, to a set of difficulties associated with the scale-up of processes, from the laboratory scale to an industrial scale, and also the lack of knowledge of many of the variables involved in biomass torrefaction, namely, the impact of temperature, residence time, or biomass composition [8]. Thus, there is an urgent need to multiply studies and research projects on biomass torrefaction. However, there are difficulties regarding the capacity that different research groups encounter when they need to produce or obtain samples of torrefied biomass, since most of the time, when projects do not contemplate construction and development of their own reactors, need to purchase standard equipment available on the market. However, this standard equipment can present several problems, namely the fact that it has not been developed specifically for carrying out biomass torrefaction tests, but also and mainly, the high acquisition cost presented, which can easily reach tens of thousands euros [9].
The objective of this study was to develop a laboratory protocol to produce low-cost torrefied biomass samples, using conventional equipment commonly found in laboratories of academic and research institutions, and thus giving the possibility to multiply the studies on torrefied biomass, namely with regard to the material characterization aspects, when the research projects do not contemplate the development and construction of equipment, or when there is no possibility to acquire standard equipment.
2. State-of-the-Art
2.1. Framework
Biomass torrefaction is a process in which a material suffers heating in an atmosphere with a low content of oxygen. This process increases the heating value (HV) and hydrophobicity [10]. This process is based on the extraction of oxygen and hydrogen compounds, giving origin to a material with lower O/C and H/C ratios. This process reduces the tenacity of biomass, as well as increases its resistance to water absorption, which facilitates storage conditions [11]. During the torrefaction process, biomass loses more mass than energy, which results in an increment in the energy densification [12]. Other properties, such as improved grindability and homogeneity, make torrefied biomass more attractive as a fuel when compared to non-heat-treated biomass [13]. The torrefaction process can be divided into several phases, according to Bergman et al. (2005), as presented in Figure 1 [14].
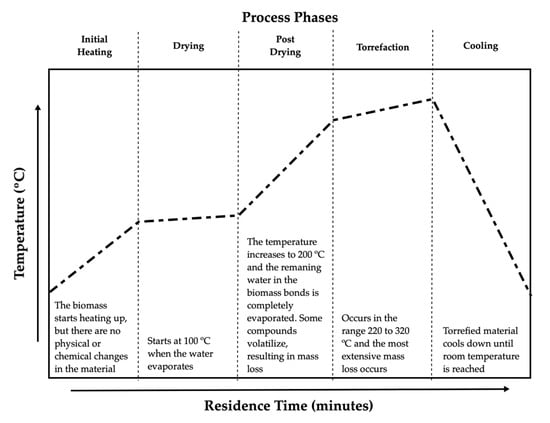
Figure 1.
Process phases (adapted from [14]).
2.2. Torrefaction Parameters
2.2.1. Temperature and Residence Time
Knowing materials’ composition allows the understanding of what reactions occur and how the biomass behaves during the heating phase [15]. Biomass exposure to temperature will lead to the destruction of its structure, and, consequently, to mass loss. This disaggregation depends on the exposure time to temperature [16]. Biomass components have different functions and interact according to residence time and temperature [15]. The different variables of the drying process influence changes in the structure and composition, such as particle size, temperature, processing time, and heating rate [17]. The residence time affects the degradation of hemicellulose, while cellulose is more affected by the temperature [14]. Temperature has a more direct and significant influence on torrefaction characteristics than the residence time, defining the reaction kinetics, while the residence time affects only the characteristics of the process, depending on the temperature used, as described in the works of Prins et al. (2006a; 2006b) [18,19]. That is, the residence time, for the same temperature range, can tend the yield to the solid fraction or to the gas fraction (with the mixture of permanent and condensable gases), causing the depolymerization reactions of the constituent compounds of biomass to occur with greater or lesser speed [19].
2.2.2. Heating Rate
The heating rate (°C/min) influences secondary reactions, which in turn affects the distribution of solid, gaseous, and liquid materials [20]. Strezov et al. (2008) showed that the pyrolysis liquid yield from biomass from Pennisetum purpureum increased with the increment in the heating rate, while the coal yield did not change [21]. Karim et al. (2010) suggested that the increment in the heating rate reduces heat and mass transfers between particles [22].
2.2.3. Process Atmosphere Composition
Gas flow can promote changes during the process, causing potential secondary interactions between newly formed gases [23]. According to some studies, CO is formed during a secondary reaction in which CO2 and water vapor react with solid materials from the process, with increasing temperature [18,19,24]. The amount of oxygen (O2) in the atmosphere does not influence any change in the reactivity of the biomass, nor in the characteristics of the solid products of the reaction [25].
2.2.4. Instability Control
Temperature is the most important parameter to control. However, since inertia makes it faster or slower, it is difficult to control and keep temperature ranges stabilized, in order to guarantee the quality of the final products [8]. During torrefaction volatile compounds are produced, and if those are not extracted, the cooling stage can promote the formation of hydrocarbon-based compounds, such as tar, interfering with the torrefied biomass self-ignition process. The solution would be the implementation of a volatile extraction procedure during torrefaction [9].
2.2.5. Torrefaction Reactors
Biomass combustion without prior drying presents several disadvantages, one of which is its instability during the process, resulting from the high moisture content [26]. Torrefaction reactors can be divided into three major types: laboratory, pilot-industrial, and commercial [26]. Laboratory scale reactors can be considered extremely important for research and development studies on torrefaction processes and products, and for other applications in pilot-industrial and commercial scales [27]. Although several different reactors can be defined, additional research on the ideal reactor design for minimum energy consumption must be conducted [26]. There are four subcategories of laboratory-scale reactors:
- The batch reactor is considered the most simplistic one. A certain amount of material is loaded in the reactor and heated with an electric resistance. It is a reactor that has a higher occurrence of exothermic reactions, raising the temperature of the biomass core. Possible temperature variations occur along the reactor. The heated inert gases pass through a packed or fixed bed, which can create agglomerations of material. They can be vertical or with a horizontal grid. Heat transfer is done indirectly, causing a greater energy expenditure [26];
- The microwave reactor uses high-frequency electromagnetic waves, forcing the vibration of water molecules, increasing temperature. It is a reactor that has less heating time and greater temperature uniformity, with a compact design. It is also a conceptual system, with only qualitative assessments. Heating is achieved through the vibration and friction of the molecules (300 MHz to 300 GHz), which is why it is a volumetric heating reactor [28];
- The rotary drum reactor is the most common, receiving biomass (inflow) and discharging it (outflow). There is the possibility of direct and indirect heating of biomass. There is a difficulty in controlling the process temperature due to occurrence of radiative heat on the drum surface. Direct or indirect heating of biomass and a hybrid model may also occur. There is constant mixing of biomass [8];
- The fluidized bed reactor guarantees a uniform temperature of the biomass on a grid, with the hot gas flowing from the bottom, with the solid particles floating and behaving like a fluid. There is a high heat transfer rate. There is difficulty in separating the bed material, if used, from biomass. A drag of fine particles may occur. A high heat transfer coefficient and temperature uniformity in the bed occurs. There is a high quality of torrefied biomass [29].
2.3. Properties of Torrefied Biomass
Torrefaction makes biomass more energetically appealing, when compared to natural biomass [13]. The most significant properties of the torrefied biomass are moisture content, grindability, and heating value [6,13]. Moisture content of natural biomass varies between 10 and 50%. However, since higher moisture content represents energy loss when burning, this is an important parameter to take into account [13]. Therefore, the torrefaction process includes stages intended to dry the biomass, which reduces the moisture content to about 1 to 3% before the actual torrefaction stage [6]. The reduction of moisture presents positive consequences concerning transportation and storage, becoming lighter and less susceptible to biodegradation due to its low water content. Biomass, in its natural state, is fibrous and tenacious, but with torrefaction, loses this toughness, caused by the volatilization of hemicellulose and cellulose depolymerization, resulting in the shortening of its fibers [8,13]. The length of the particles also decreases, facilitating grinding, handling, and fluency [6,30]. The amount of H and O lost during torrefaction is higher than the C lost, causing an increase in the HV. The HV of torrefied biomass is higher since there is an increment in fixed carbon (FC), in contrast to the output of oxygenated compounds, leaving more carbon available to be oxidized and, thus, releasing energy [6]. Torrefaction causes an increase in HV that can reach 58%, depending on the different types of biomass, to around 18–26 MJ/kg [31].
3. Materials and Methods
3.1. Torrefaction Process
3.1.1. Sample Preparation
The biomass used in this study was wood chips of Pinus pinaster. For comparison, the biomass was analyzed both in green (as received without prior drying) and dry to characterize the raw material before the torrefaction process and afterward to compare the evolution of its properties. As previously mentioned, Pinus pinaster was the source of biomass used to conduct this study. The chips passed through a sieving system that led to samples of approximately 20 mm, to ensure uniformity. The drying process was carried out in a lab hoven, at 90 °C for 6 h. Samples of approximately 500 g were weighed and wrapped with conventional aluminum foil, as presented in Figure 2. For this study, to guarantee reproducibility, tests were carried out in duplicate.
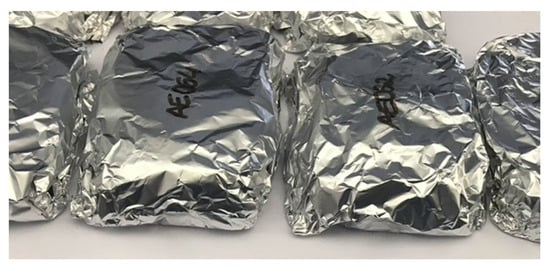
Figure 2.
Samples wrapped in aluminum foil prepared for torrefaction.
3.1.2. Equipment Used for Torrefaction
As previously mentioned, the objective is the creation of a torrefaction protocol using widely available and regular equipment present in common laboratories. The chosen equipment was a common ceramic muffle, formed by a metallic monobloc with refractory bricks and insulated with a kaolin canvas. Electrical resistances, located on the lateral and bottom surfaces, are used to heat the muffle. A controller allows the setup of different temperature thresholds and residence times, as presented in Table 1. An opening on the top allows for torrefaction gas extraction.

Table 1.
Correlation of the levels and the torrefaction phases.
This type of muffle was used because it is a device that is very easily available in laboratories, such as for materials characterization or chemical analysis. It is a type of low-cost equipment and, above all, very easy to use, where its purchase price varies according to its size and programming capacity. The average cost of this equipment, like the one used in the present study, can vary within the range EUR 1500–3000, depending essentially on the origin of the manufacturer, but in any case a related cost that can be just 10% when compared with those previously mentioned standard pieces of equipment available in the market.
3.1.3. Definition of Parameters
As previously mentioned, different tests took place with previously dried pine chips and a variation of two torrefaction parameters. The parameters to be changed were the temperature and residence time, in order to select the best set of parameters to use and to obtain good quality samples, without the need of an expensive reactor. Table 2 defines the parameters applied to each series of torrefaction tests carried out.

Table 2.
Parameters applied to each series of tests.
3.2. Sample Laboratorial Characterization
3.2.1. Moisture Content
To determine this parameter, a Radwag Mac 210 was used, which consists of a precision scale and a halogen lamp, that obtain the humidity value by drying the samples. Initially, a sample of at least two grams was introduced, and then the heating caused by the lamp promotes water evaporation. Finally, the value of the relative humidity content contained in the sample was given in a percentage through the difference between the initial and final mass.
3.2.2. Thermogravimetric Analysis
For thermogravimetry (TGA) of the torrefied samples, an Eltra Thermostep model was used. It consists of an oven with a precision scale, where the crucibles are inserted. The analyses occur with a nitrogen rich gas flow of 150 mL/min and with a heating rate of 50 °C/min, to reach 900 °C. During heating, moisture, volatiles, and fixed carbon contents were determined. Finally, ash content was established from the residue remaining. This procedure requires a previous grinding of the torrefied samples, for which a Retsch SM-300 mill was used. The crucibles were weighted, and one gram of sample was then introduced in each one of the containers. An empty crucible serves as a blank sample.
3.2.3. Elemental Analysis
To determine the elemental composition, a Leco CHN628 analyzer was used. The incineration of the samples up to 900 °C in an atmosphere rich in oxygen, burning all organic compounds, produced CO2, H2O, N2, and SO2. After, using a gas chromatography detector, the levels of carbon, hydrogen, and nitrogen were obtained. In this case, it was also necessary to have samples previously ground. As soon as the combustion and afterburner chambers reached their temperatures of 900 °C and 850 °C, respectively, the analysis of the samples began. After obtaining the results, the oxygen content of the samples was then calculated based on Equation (1).
where w(O) is the oxygen content (%), w(C) is the carbon content (%), w(H) is the hydrogen content (%), w(N) is the nitrogen content (%), and w(S) is the sulfur content (%).
w(O) = 100 − w(C) − w(H) − w(N) − w(S)
3.2.4. Heating Value
Biomass HV can be determined in two distinct manners. The fuel property known as high heating value (HHV) is defined as the amount of energy released as heat and the latent heat of vaporization of the water vapor created during combustion, while low heating value (LHV) represents only the amount of energy released as heat. Considering that after torrefaction, the biomass content of moisture is quite low, LHV is almost equal to HHV. Therefore, only the LHV was determined for this study. To determine the LHV was used Equation (2), as presented by Parikh et al. (2005) [32].
where HHV is the high heating value (MJ/kg), FC is the fixed carbon (%), VM is the volatile matter content (%), and A is the ash content (%).
HHV (db) = 0.3536 × FC + 0.1559 × VM − 0.0078 × A
3.2.5. Energy Density and Mass and Energy Yield
To complement the analysis of the samples, the parameters of energy densification ratio (EDR), mass yield ratio (MYR), as well as the energy yield (EY), were evaluated. According to Grigiante and Antolini (2014), these parameters can be determined analytically from Equations (3)–(5), respectively [33].
where HHVtorrefied biomass is the high heating value of the torrefied biomass (MJ/kg) and HHVdried biomass is the high heating value of the dried raw biomass (MJ/kg).
where wtorrefied biomass is the mass of the dried torrefied biomass (g) and wdried biomass is the mass of the dried raw biomass (g).
EDR (%) = (HHVtorrefied biomass/HHVdried biomass) × 100
MYR (%) = (wtorrefied biomass/wdried biomass) × 100
EY (%) = EDR × MYR
4. Results and Discussion
4.1. Torrefaction Severity
With the completion of the experiments, it was possible to carry out an initial visual assessment of the different degrees of torrefaction, as can be seen from Figure 3, Figure 4 and Figure 5. Through the analysis of Figure 3, it can be seen that the series corresponding to the torrefaction parameters in Table 2 was the most severe one since it presents the darkest color. Figure 4 portrays the results from Series 2. The samples present a dark shade with brownish tones, indicating a lower degree of torrefaction than the previous series. Through the analysis of Figure 5, it can be seen that Series 3, presents a brownish color, which indicates it was the lowest intensity used. These observations were supported by the chemical characterization of the samples.

Figure 3.
(a) Series 1: T1; (b) Series 1: T2; and (c) Series 1: T3 presenting the darkest hue.

Figure 4.
(a) Series 2: T4; (b) Series 2: T5; and (c) Series 2: T6, which presents a dark shade with brownish tones.

Figure 5.
(a) Series 3: T7; (b) Series 3: T8; and (c) Series 3: T9, which presents a brownish color.
4.2. Sample Characterization
4.2.1. Overview
Table 3 presents the averages of the results obtained for the natural, dry, and torrefied biomass, considering that these were always performed in duplicate. These data represented in the table resulted from the moisture content determination, thermogravimetric (fixed carbon content, volatile content, ash content, and moisture content) and elemental analysis (CHN).

Table 3.
Results obtained from moisture content determination, thermogravimetric and elemental analysis, for the analyzed samples: green, dried, and torrefied biomass.
4.2.2. Moisture Content
The determination of the moisture content involved two types of analyses. The analysis mentioned in Section 3.2.1 determined the surface water loss, while the actual moisture content was obtained through TGA since it is a more precise method. As stated by Tumuluru et al. (2011), the moisture content decreases during the drying process [6]. After the analyses of the samples, it is possible to observe a reduction of moisture of approximately 35%. It is important to remember that all samples were dried before torrefaction tests.
Through the analysis of the torrefied samples, it is noticeable that the different series of torrefaction present different moisture levels, between 1 and 3%, as anticipated by Tumuluru et al. (2011). When comparing these values with those of the dry sample, some differences are noteworthy. The post-torrefaction storage, the atmospheric conditions present during the collection of the biomass samples, and the constant pre-drying parameters may explain the fluctuations in the values obtained. For example, the use of a desiccator for the final phase of cooling the samples can be a decisive factor so that they do not acquire any moisture after being removed from the muffle, which was not used in these tests. Additionally, these discrepancies may also be due to the use of different residence times during the drying stage of the torrefaction.
4.2.3. Thermogravimetric Analysis (TGA)
The torrefaction process causes an increase in the amount of fixed carbon in the biomass as the intensity increases. The ash content presents a similar progression. However, the volatile content displays the opposite behavior. This effect was verified in all torrefaction tests performed, as shown in Table 3, although it is easier to observe through the analysis of Figure 6, Figure 7 and Figure 8. All results were compared with the dry biomass.
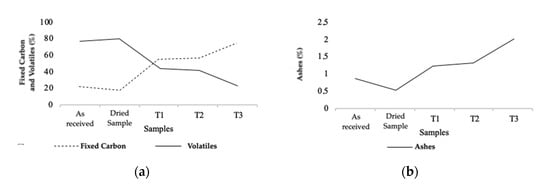
Figure 6.
Fixed carbon and volatile content (a), and ash content (b) from TGA of natural, dry, and torrefied samples of Series 1.
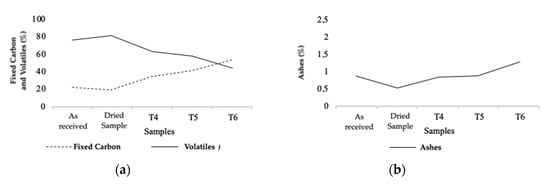
Figure 7.
Fixed carbon and volatile content (a), and ash content (b) from TGA of natural, dry, and torrefied samples of Series 2.
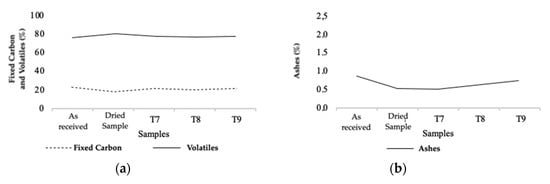
Figure 8.
Fixed carbon and volatile content (a), and ash content (b) from TGA of natural, dry, and torrefied samples of Series 3.
Through the observation of Figure 6, it is possible to establish a relationship between the torrefaction intensity and the parameters mentioned above. The higher the degree of torrefaction, the greater the variation. Figure 6b displays the increase for FC throughout Series 1, by approximately 37% in T1, 39% in T2, and 56% in T3, while revealing the opposite behavior for volatile content, with an approximate loss of 38% in T1, 40% in T2, and 58% in T3. Concerning the ash content, Figure 6a presents its increase in concentration, intensified by the degree of torrefaction. There was an approximate increase of 0.7% in T1, 0.8% in T2, 1.5% in T3.
The analysis of variables in Series 2 followed the same patterns as the ones presented in Series 1. As for the FC, as shown in Figure 7b, it was found that it increased by approximately 17% in T4, 22% in T5, and 35% in T6. The volatile content, also presented in Figure 7b, suffered an approximate loss of 17% in T4, 23% in T5, and 36% in T6. As for the ash content, Figure 7a shows an increase of approximately 0.3% in T4, 0.35% in T5, and 0.8% in T6.
Series 3 displayed a smaller variation between the different samples, probably due to the short residence times tested and the lower temperatures. Fixed carbon values, shown in Figure 8b, suffered an increase of 2.5% in T7, 3.6% in T8, and 3.8% in T9. For the volatile content, also shown in Figure 8b, there was a decrease of 2.4% in T7, 3.6% in T8, and 4% in T9. As for the ash content, as shown in Figure 8a, there was a small increase depending on the degree of torrefaction. Considering smaller torrefaction parameters were used in Series 3, the variation of the values analyzed was smaller than for the first and second series. Finally, it is possible to state that the results obtained were in agreement with the reviewed literature [3,13,31]. In some of the studies analyzed, it appears that torrefaction causes a decrease in volatile content around 1.5 to 45%, an approximate increase in the content of fixed carbon from 1 to 40%, and an increase in the ash content from 0.1 to 12% [3,13].
4.2.4. Elemental Analysis (CHN)
Concerning the elemental analysis, through the examination of Table 3, it can be seen that the values registered do not present a substantial distinction between the natural and dry samples, which was expected. As for the torrefied samples, it was possible to verify an increase in the carbon content afterward, when compared with the control samples. It was also possible to see an increase in the carbon content with the intensity of the torrefaction. Furthermore, there is also a decrease in the amount of hydrogen, depending on the torrefaction intensity. Through the values obtained from the elemental analysis of the samples, H/C and O/C ratios were calculated, thus building the van Krevelen diagram represented in Figure 9.
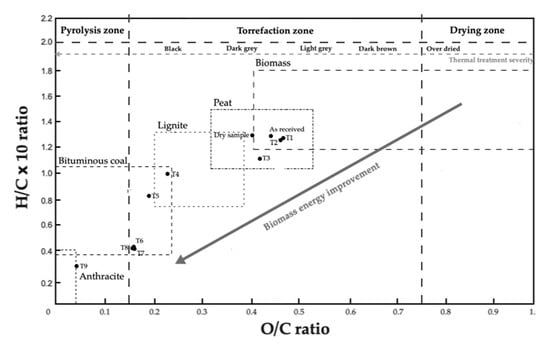
Figure 9.
Graphical representation of van Krevelen diagram for natural, dry, and all torrefied samples of biomass (adapted from [34]).
Through the analysis of the graph, it is possible to distinguish the three different series used in the process and to confirm that Series 1 (T1, T2, and T3) was submitted to the highest torrefaction intensity, as previously mentioned. In the van Krevelen diagram, these samples can be found close to the zone corresponding to coal and anthracite, since they present smaller H/C and O/C. During hydrothermal carbonization, the removal of oxygen and hydrogen (H) occurs, which leads to a final product in the solid-state with a lower relationship between oxygen and carbon and hydrogen and carbon [11]. Sample T6 from Series 2 presents the same location in the diagram since it was subjected to the same conditions as sample T3 from Series 1. Samples T4 and T5 from Series 2, are in the coal area, although with higher H/C and O/C, due to the lower intensity of the torrefaction process when compared to Series 1. Samples T7, T8, and T9 from Series 3 present the highest H/C and O/C values examined, due to the low residence times that were used during the torrefaction stage, which may not be sufficient to trigger the start of the process. The values obtained through the elemental analysis are in line with the studied literature. The O/C and H/C ratios vary between 0.4 and 0.8, and 1.2 and 2, respectively, for natural or dry biomass samples. Following torrefaction, they vary between 0.1 and 0.7, and 0.7 and 1.6, respectively [3].
4.2.5. Heating Value
As previously mentioned, the calorific values were calculated using the results obtained through the thermogravimetric analysis (fixed carbon, volatile, and ash contents). Table 4 displays the results obtained.

Table 4.
Results for calorific value for Series 1, 2, and 3.
It is possible to see an increase between 2.6 and 56.3% in the heating value of the torrefied samples when compared to the dry sample. However, Chew and Doshi (2011) suggest an increase in calorific value of up to 58% [31].
4.2.6. Energy Density and Mass and Energy Yields
From the HHVs obtained for the control sample (dry biomass) and the torrefied samples, it was possible to calculate the energy density for each one. Figure 10 displays the results obtained.
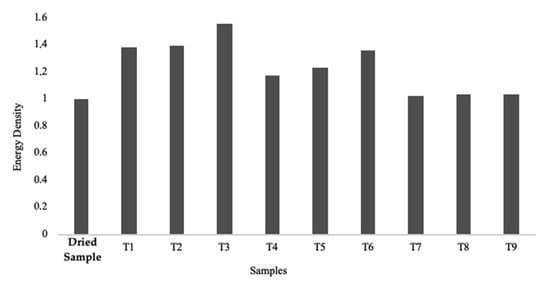
Figure 10.
Graphic representation of the energy density obtained for dry and all torrefied samples. Dry biomass was used as the control sample.
Through Figure 11, it was possible to verify that there is a direct relation between mass loss and the increment in energy density, as mentioned by Bergman and Kiel (2005) [35]. Series 1 is the one with the highest torrefaction intensity, and consequently, was the one with the highest energy density. Series 2 also shows an increase in its energy density, although it is not as sharp as the one presented in Series 1. Lastly, Series 3 does not show significant fluctuations in its energy density. Since the energy density is related to the calorific value of the samples, it is expected that those with the highest energy value are those with the highest energy density. The mass yield of each sample was calculated between the difference of its initial and final mass. Figure 11 presents the results obtained.
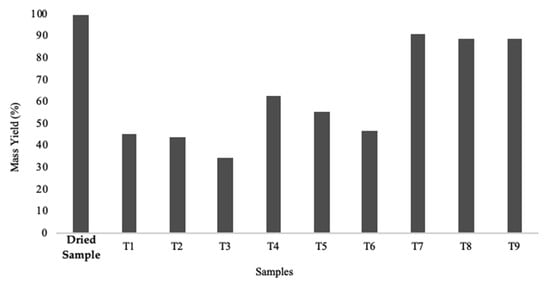
Figure 11.
Graphic representation of the mass yield obtained for dry and all torrefied samples. Dry biomass was used as the control sample.
All samples display loss of mass caused by the torrefaction process, as can be seen in Figure 12. This loss is more accentuated for Series 1 (>50%) since the torrefaction process was more intense for these samples. Concerning Series 2, the loss of mass was about 40 to 50%, however less marked than in Series 1. Series 3 presented the lowest mass losses observed (<11%), which again indicates that it was subjected to very low torrefaction intensity. Figure 11 presents an evaluation of the energy efficiency of all the samples.
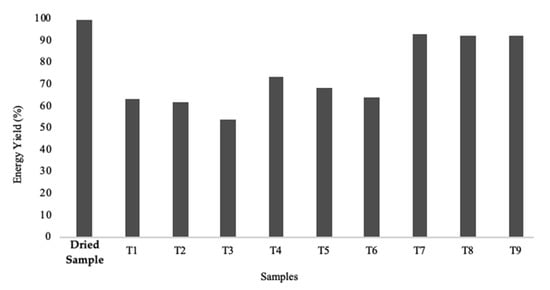
Figure 12.
Graphic representation of the energy yield obtained for dry and all torrefied samples. Dry biomass was used as the control sample.
Although the increase in torrefaction intensity causes an increase in the energy density of the samples, the loss of mass makes it less energy efficient. In other words, although a sample of torrefied biomass has a higher calorific value than that of natural biomass, it is necessary to utilize larger quantities of torrefied biomass to achieve equivalent energy efficiency. Therefore, and as expected, the energy efficiency decreases with the increase of torrefaction intensity.
4.3. Experimental Protocol
For the production of torrefied biomass samples, the recommended parameters are those shown in Table 5, and which result from the data obtained from the T4 test, which was the test that provided material with the closest properties to the materials produced in industrial reactors, as described by Nunes (2020) [8]. Thus, the experimental procedure proposed here, includes the following steps:

Table 5.
Stages used in the test T4 from Series 2.
- Biomass samples must be prepared according to the procedure presented and described in Section 3.1.1. Sample Preparation;
- The muffle must be programmed according to the parameters presented in Table 5, and must therefore allow the programming of at least four temperature levels and timed heating ramps;
- After removing the material from the muffle, when a temperature sufficiently safe to open the oven is reached, it must rest inside a desiccator, until it reaches room temperature, in order to prevent the sample from acquiring moisture.
5. Conclusions and Future Work
Biomass torrefaction is a very promising emerging technology that has the potential to support energy production. In this study, the creation of an experimental procedure is presented to produce torrefied biomass samples. During the development of this research, it was necessary to take into account the torrefaction parameters used, such as temperature and residence time, as these were crucial for obtaining torrefied samples of similar quality when compared to samples obtained by laboratory reactors. Both for samples of natural and dry biomass, as well as for torrefied samples, the properties of moisture content, fixed carbon content, volatile content, ash content, calorific value, mass, and energy yield, and energy density were analyzed. The results show that it is possible to obtain torrefied samples comparable to those of studies developed through the use of reactors. They also show that the properties analyzed are directly related to the torrefaction severity, which, in turn, depends on the parameters used when defining this protocol. Visual monitoring of the torrefaction intensity of the samples was essential to predict and confirm the results obtained by the chemical characterization of the samples. The chemical analysis of the samples indicates more appealing results in the sense of obtaining samples with characteristics similar to those obtained in previous studies, as mentioned.
The quality of the results obtained is also fitting to corroborate the quality of the suggested protocol since it was possible to obtain samples with considerable properties for the three series, even though several torrefaction intensities, caused by varying parameters, were used. Although less severe torrefaction parameters were used for Series 3, the small fluctuation of the values analyzed indicates that the parameters used for this series are the minimum required to start the torrefaction stage for this procedure. Furthermore, it allows us to conclude that the residence time is the parameter that mostly affects the torrefaction severity. In addition, with these results, it is possible to conclude that the use of common and widely available low-cost equipment, such as a laboratorial muffle, can achieve a cost reduction that can reach 90% in equipment acquisition.
In terms of future perspectives, the development of the torrefaction process can lead to the evolution of other technologies, such as the production of hydrogen from torrefied biomass. Considering the wide variety of types of biomass and their differences in both structural and chemical composition, different samples of different species may be used in the future to prove the effectiveness of the developed experimental procedure.
Author Contributions
Conceptualization, L.J.R.N., R.G., and J.C.O.M.; methodology, L.J.R.N., R.G., and J.C.O.M.; validation, L.J.R.N., R.G., and J.C.O.M.; formal analysis, L.J.R.N., J.M.C.R., L.C.R.S., L.M.E.F.L., R.G., and J.C.O.M.; investigation, L.J.R.N., J.M.C.R., L.C.R.S., L.M.E.F.L., R.G., and J.C.O.M.; resources, L.J.R.N.; data curation, L.J.R.N., J.M.C.R., L.C.R.S., L.M.E.F.L., and R.G.; writing—original draft preparation, L.J.R.N., J.M.C.R., L.C.R.S., L.M.E.F.L., and R.G.; writing—review and editing, L.J.R.N., R.G., and J.C.O.M.; supervision, L.J.R.N., R.G., and J.C.O.M.; project administration, L.J.R.N. All authors have read and agreed to the published version of the manuscript.
Funding
This work was also financially supported by the Research Unit on Governance, Competitiveness and Public Policy—GOVCOPP (UID/CPO/04058/2019), funded by national funds through FCT—Fundacão para a Ciência e a Tecnologia. Radu Godina acknowledges Fundação para a Ciência e a Tecnologia (FCT—MCTES) for its financial support via the project UIDB/00667/2020 (UNIDEMI).
Acknowledgments
The authors would like to acknowledge the Portuguese companies YGE—Yser Green Energy SA and AFS—Advanced Fuel Solutions SA, both in Portugal, that allowed the execution of the laboratory tests.
Conflicts of Interest
The authors declare no conflict of interest.
References
- De Matias, J.C.O.; Devezas, T.C. Consumption dynamics of primary-energy sources: The century of alternative energies. Appl. Energy 2007, 84, 763–770. [Google Scholar] [CrossRef]
- Joshi, Y.; de Vries, H.; Woudstra, T.; de Jong, W. Torrefaction: Unit operation modelling and process simulation. Appl. Therm. Eng. 2015, 74, 83–88. [Google Scholar] [CrossRef]
- Lu, K.-M.; Lee, W.-J.; Chen, W.-H.; Liu, S.-H.; Lin, T.-C. Torrefaction and low temperature carbonization of oil palm fiber and eucalyptus in nitrogen and air atmospheres. Bioresour. Technol. 2012, 123, 98–105. [Google Scholar] [CrossRef] [PubMed]
- Vassilev, S.V.; Vassileva, C.G.; Vassilev, V.S. Advantages and disadvantages of composition and properties of biomass in comparison with coal: An overview. Fuel 2015, 158, 330–350. [Google Scholar] [CrossRef]
- Nunes, L.J.; Matias, J.C. Biomass torrefaction as a key driver for the sustainable development and decarbonization of energy production. Sustainability 2020, 12, 922. [Google Scholar] [CrossRef]
- Tumuluru, J.S.; Wright, C.T.; Boardman, R.D.; Hess, R.J.; Sokhansanj, S. Review on biomass torrefaction process and product properties and design of moving bed torrefaction system model development. In 2011 Louisville, Kentucky, August 7–10, 2011; American Society of Agricultural and Biological Engineers: St. Joseph, MI, USA, 2011; p. 1. [Google Scholar]
- Yang, Z.; Wu, Y.; Zhang, Z.; Li, H.; Li, X.; Egorov, R.I.; Strizhak, P.A.; Gao, X. Recent advances in co-thermochemical conversions of biomass with fossil fuels focusing on the synergistic effects. Renew. Sustain. Energy Rev. 2019, 103, 384–398. [Google Scholar] [CrossRef]
- Nunes, L.J. A case study about biomass torrefaction on an industrial scale: Solutions to problems related to self-heating, difficulties in pelletizing, and excessive wear of production equipment. Appl. Sci. 2020, 10, 2546. [Google Scholar] [CrossRef]
- Ribeiro, J.M.C.; Godina, R.; Matias, J.C.d.O.; Nunes, L.J.R. Future perspectives of biomass torrefaction: Review of the current state-of-the-art and research development. Sustainability 2018, 10, 2323. [Google Scholar] [CrossRef]
- Tran, K.-Q.; Luo, X.; Seisenbaeva, G.; Jirjis, R. Stump torrefaction for bioenergy application. Appl. Energy 2013, 112, 539–546. [Google Scholar] [CrossRef]
- Van der Stelt, M.; Gerhauser, H.; Kiel, J.; Ptasinski, K. Biomass upgrading by torrefaction for the production of biofuels: A review. Biomass Bioenergy 2011, 35, 3748–3762. [Google Scholar] [CrossRef]
- Proskurina, S.; Heinimö, J.; Schipfer, F.; Vakkilainen, E. Biomass for industrial applications: The role of torrefaction. Renew. Energy 2017, 111, 265–274. [Google Scholar] [CrossRef]
- Chen, W.-H.; Peng, J.; Bi, X.T. A state-of-the-art review of biomass torrefaction, densification and applications. Renew. Sustain. Energy Rev. 2015, 44, 847–866. [Google Scholar] [CrossRef]
- Bergman, P.C.; Boersma, A.; Zwart, R.; Kiel, J. Torrefaction for Biomass Co-Firing in Existing Coal-Fired Power Stations; ECN-C-05-013; Energy Research Centre of the Netherlands: Sint Maartensvlotbrug, The Netherlands, 2005. [Google Scholar]
- Shankar Tumuluru, J.; Sokhansanj, S.; Hess, J.R.; Wright, C.T.; Boardman, R.D. A review on biomass torrefaction process and product properties for energy applications. Ind. Biotechnol. 2011, 7, 384–401. [Google Scholar] [CrossRef]
- Araújo, S.; Neiva, D.M.; Gominho, J.; Esteves, B.; Pereira, H. Chemical effects of a mild torrefaction on the wood of eight Eucalyptus species. Holzforschung 2017, 71, 291–298. [Google Scholar] [CrossRef]
- Lipinsky, E.S.; Arcate, J.R.; Reed, T.B. Enhanced wood fuels via torrefaction. Fuel Chem. Div. Prepr. 2002, 47, 408–410. [Google Scholar]
- Prins, M.J.; Ptasinski, K.J.; Janssen, F.J. Torrefaction of wood: Part 2. Analysis of products. J. Anal. Appl. Pyrolysis 2006, 77, 35–40. [Google Scholar] [CrossRef]
- Prins, M.J.; Ptasinski, K.J.; Janssen, F.J. Torrefaction of wood: Part 1. Weight loss kinetics. J. Anal. Appl. Pyrolysis 2006, 77, 28–34. [Google Scholar] [CrossRef]
- Viana, H.; Rodrigues, A.; Godina, R.; Matias, J.C.O.; Nunes, L.J. Evaluation of the physical, chemical and thermal properties of Portuguese maritime pine biomass. Sustainability 2018, 10, 2877. [Google Scholar] [CrossRef]
- Strezov, V.; Popovic, E.; Filkoski, R.V.; Shah, P.; Evans, T. Assessment of the thermal processing behavior of tobacco waste. Energy Fuels 2012, 26, 5930–5935. [Google Scholar] [CrossRef]
- Karim, A.A.; Kumar, M.; Singh, S.K.; Panda, C.R.; Mishra, B.K. Potassium enriched biochar production by thermal plasma processing of banana peduncle for soil application. J. Anal. Appl. Pyrolysis 2017, 123, 165–172. [Google Scholar] [CrossRef]
- Medic, D.; Darr, M.; Shah, A.; Rahn, S. The effects of particle size, different corn stover components, and gas residence time on torrefaction of corn stover. Energies 2012, 5, 1199–1214. [Google Scholar] [CrossRef]
- Prins, M.J.; Ptasinski, K.J.; Janssen, F.J. More efficient biomass gasification via torrefaction. Energy 2006, 31, 3458–3470. [Google Scholar] [CrossRef]
- Zhao, L.; Zhang, J.; Sheng, C.; Wang, K.; Ding, Q. Dissolution characteristics of inorganic elements existing in biomass during the supercritical water gasification process. Energy Sources Part A 2012, 34, 1893–1900. [Google Scholar] [CrossRef]
- Junsatien, W.; Soponpongpipat, N.; Phetsong, S. Torrefaction reactors. J. Sci. Technol. Mahasarakham Univ. 2013, 32, 84–91. [Google Scholar]
- Pérez, J.F.; Pelaez-Samaniego, M.R.; Garcia-Perez, M. Torrefaction of fast-growing Colombian wood species. Waste Biomass Valorization 2019, 10, 1655–1667. [Google Scholar] [CrossRef]
- Wang, M.; Huang, Y.; Chiueh, P.; Kuan, W.; Lo, S. Microwave-induced torrefaction of rice husk and sugarcane residues. Energy 2012, 37, 177–184. [Google Scholar] [CrossRef]
- Chang, S.; Zhao, Z.; Zheng, A.; He, F.; Huang, Z.; Li, H. Characterization of products from torrefaction of sprucewood and bagasse in an auger reactor. Energy Fuels 2012, 26, 7009–7017. [Google Scholar] [CrossRef]
- Phanphanich, M.; Mani, S. Impact of torrefaction on the grindability and fuel characteristics of forest biomass. Bioresour. Technol. 2011, 102, 1246–1253. [Google Scholar] [CrossRef]
- Chew, J.J.; Doshi, V. Recent advances in biomass pretreatment—Torrefaction fundamentals and technology. Renew. Sustain. Energy Rev. 2011, 15, 4212–4222. [Google Scholar] [CrossRef]
- Parikh, J.; Channiwala, S.; Ghosal, G. A correlation for calculating HHV from proximate analysis of solid fuels. Fuel 2005, 84, 487–494. [Google Scholar] [CrossRef]
- Grigiante, M.; Antolini, D. Experimental results of mass and energy yield referred to different torrefaction pathways. Waste Biomass Valorization 2014, 5, 11–17. [Google Scholar] [CrossRef]
- Van Krevelen, D. Graphical-statistical method for the study of structure and reaction processes of coal. Fuel 1950, 29, 269–284. [Google Scholar]
- Bergman, P.C.; Kiel, J.H. Torrefaction for biomass upgrading. In Proceedings of the 14th European Biomass Conference, Paris, France, 17–21 October 2005; pp. 17–21. [Google Scholar]
© 2020 by the authors. Licensee MDPI, Basel, Switzerland. This article is an open access article distributed under the terms and conditions of the Creative Commons Attribution (CC BY) license (http://creativecommons.org/licenses/by/4.0/).