Article

Optimization of a Hybrid Solar PV and Gas Turbine Generator System Using the Loss of Load Probability Index

by
Mohamed Atef
1,
Tamer Khatib
2,*,
Muhammad Faris Abdullah
1 and
Mohd Fakhizan Romlie
1
1
Department of Electrical & Electronic Engineering, Universiti Teknologi PETRONAS, Perak 32610, Malaysia
2
Department of Energy Engineering & Environment, An-Najah National University, Nablus 97300, Palestine
*
Author to whom correspondence should be addressed.
Clean Technol. 2020, 2(3), 240-251; https://doi.org/10.3390/cleantechnol2030016
Submission received: 20 April 2020 / Revised: 2 June 2020 / Accepted: 3 June 2020 / Published: 14 July 2020
(This article belongs to the Special Issue Feature Papers 2020)

Abstract

:
In this paper, an optimization approach for designing a hybrid renewable energy system with zero load rejection is presented for a specific location in Malaysia. The proposed renewble energy system includes photovoltaic system, gas turbine generator and battery bank. The aim of the optimization process is to design the system with a loss of load probability that is less than 1%. An improved numerical algorithm is proposed in this paper. Moreover, a comparison between electrification options, including the existing gas-turbine-based generator (existing system), electricity grid and the proposed system, is presented in terms of the annualized total life-cycle cost. The results show that the proposed system can reduce the annual running cost by USD 2.1 million, while the electricity grid connection option can reduce the annual cost by USD 1.16 million as compared to the existing gas-turbine-based generator. In addition to this, the proposed optimization algorithm provides a reliable power system with zero load rejection based on simulation results.

1. Introduction

The fast growth of the energy demand made the prices of conventional power sources, such as oil, gas, and coal, increase across the world. In addition to this, the carbon dioxide emissions, which are the main reason for global warming, also increased [1]. Thus, the whole world is now going toward renewable energy to overcome the problem of fuel costs, gas emissions, and even the close time of conventional power sources’ end. Solar photovoltaic (PV) and wind energy units are highly used in terms of supplying loads in remote and rural areas [2]. However, the typical drawbacks for these units are the intermittent nature of solar PV and wind turbines. Furthermore, the fluctuation of renewable energy may not tally with the load demand in the supply time. These challenges cause significant reliability issues in the operation and design of wind turbines and PV systems. An over-sizing technique has been employed to solve the reliability issues. In contrast, hybrid PV/Wind (H-PVWG) systems integrate the properties of wind turbines and PV to enhance the availability of the power supply in the system and decrease its costs [3].
Diesel generator can do the task as a backup energy source instead of the storage system with a lower cost. The main drawbacks of the system are their emissions and requirement of fuel. Comparatively, hydrogen-based storages do not produce emissions and do not require any supply of fuel [4].
In general, the hybrid PV system proved its performance and reliability in many studies [5]; specifically, such a system proved its ability under the Malay condition, whereas, in [6], the hybrid system performance under Malaysia’s weather conditions was investigated and analyzed over three months. This system was found reliable and feasible. However, optimization and sizing methods should effectively search for the best combination of parameters, such as the cost of the system, reliability, the size of the PV system, the size of the battery, the tilt angle of the PV panels and the size of the wind turbine and its height. Due to the over-sizing issue, the cost of the system increases, while system under-sizing causes an inadequate supply of power. Meanwhile, for a broad use of the hybrid PV system in Malaysia, there is a need for precise sizing of the PV system and the backup battery to reach the desired loss of load probability (LLP). A loss of load happens when the generation cannot supply the load demand. It is recommended that the LLP for such a system to be 0.01 [7]. This LLP value leads to a high reliable system that can supply the load during the year with almost 99 %, which is around 361.35 days over 365 days in the year.
In [8], a new procedure to design an optimum size system for a sustainable building by using sustainable energy, battery banks, and proton exchange membrane fuel cells (PEMFCs) was proposed. Meanwhile, in [9], it is shown that hybrid PV and H-PVGTG (Hybrid photovoltaic/gas turbine generators) is better ecologically, but the combined DG (Diesel generator) and PV is better in the economical position. Similarly, in [10], it is proved that the combination between the PV and the GTG with the operational strategy of matching the power has a higher net profit if compared with standalone GTG or the standalone PV system. According to [11], the H-PVGTG system reduces the gas consumption by 16%, with a 33% reduction in the emission when compared with the standalone GTG system.
To study the behavior of H-PVGTG, a simulation model is developed in [12]. The result showed that the new system produced more power with 140% per unit when compared to the GTG system. Many works in the field of optimizing the hybrid PV/gas turbine system were done on the sizing and optimization techniques of hybrid systems [13,14]. In [15], numerical equations are employed to compute the best size of the PV system and the battery bank capacity based on Peak Sun Hours (PSHs) and load demand. In [15], the author proposed a novel to optimize a model by using the integer programming for a standalone PV system (SAPVS) in domestic buildings. In [16], the author presented a new hybrid system to reduce wind suppression and improve the suppleness of the schedule. In [10], the author introduced an optimization for the H-PVWG system depending on the LLP and system expenses by using a Genetic Algorithm (GA). The authors of [17] presented an SAPV system to supply the power demand for one domestic house in a village in Jordan. Similarly, the authors of [18] presented an appraisal of the present PV energy transformation techniques, discussing the system parameters of the different PV power station. In [19], the authors performed a survey to analyze different energy operating techniques for hybrid sustainable systems based on (H2) as a back-up source. Meanwhile, GA was used to apply a tri-objective model of a SAPVS/Split-diesel/Wind/ Battery (PV-WG-DG-B) hybrid energy system for a common domestic house to reduce the LCC (Life cycle cost) CO2 emissions and dump energy as much as possible [20]. Moreover, in [21], the focus was given to the designing of an optimum sizing system based on a frequentative approach to optimise the size of a different islanded (PV-WG-DG-B) hybrid system for zero load rejection. Finally, in [22], a new hybrid optimization algorithm is proposed to optimally size a standalone hybrid solar and wind energy system based on three algorithms, namely chaotic search, harmony search and simulated annealing. To improve the accuracy of the size optimization algorithm results, weather forecasting is used along with artificial neural networks for solar radiation, ambient temperature, and wind speed. An objective function that aims to minimize the total life cycle cost is adapted to assess the feasibility of the hybrid renewable energy system accounting for system reliability. The reliability of the system was assessed by the loss of power supply probability parameter. Meanwhile, in [23], similar systems were optimized using the Tabu search.
In this paper, the developed algorithm offers a new framework of all the accepted sizes of the hybrid system. The size of the PV array, GTG and battery system that satisfies the technical requirements of the system in Malaysia is chosen. The optimum size of the hybrid system is selected then in terms of the economic factor. Finally, cost comparison with other systems is presented.

2. Proposed Optimization Methodology

The first stage in the optimization process of a hybrid renewable energy system is identifying the system’s components, such as the efficiency of the PV system, the efficiency of the wires, the battery volt, the charging efficiency of the battery, load demand per hour, availability level, and climatic parameters, such as sun irradiation and module temperature.
The design space contains many systems that have different performances regardless of the technical and economical aspects. Here, the proposed algorithm is used to limit the design space to shortlist systems that archive the desired system availability. The first value of the design framework for the PV module’s size and the size of the battery bank is computed by (1) and (2). In the next step, a model of energy flow in an hourly base is applied to figure out the LLP for all settings using the suggested designs. This stage is done by two “for loops” to manage all the PV and battery settings depending on the scale of the searching area. Finally, all of the results that have been chosen are approved in terms of the LLP acceptance range. After determining the arbitrary scheme range that matches the accepted LLP range, the annual total load cycle cost (ATLCC) of each configuration in the design space is computed. Eventually, the best settings that minimize ATLCC are chosen as the best size of the system. The optimization approach followed in this research is illustrated in Figure 1.
The initial size of the PV array and battery system are determined based on Equations (1) and (2).
P P V = E L S f η i n v η R P S H
E B = 1.5 × E L η B   D O D
where E L is the total load energy demand per day; η R is the voltage regulator efficiency; S f is the safety factor that represents the losses of the dust, cable joints, and cloudy times; DOD (Depth of discharge) is the allowable value to be discharged from the battery; η B is the battery efficiency.

Modelling of the System

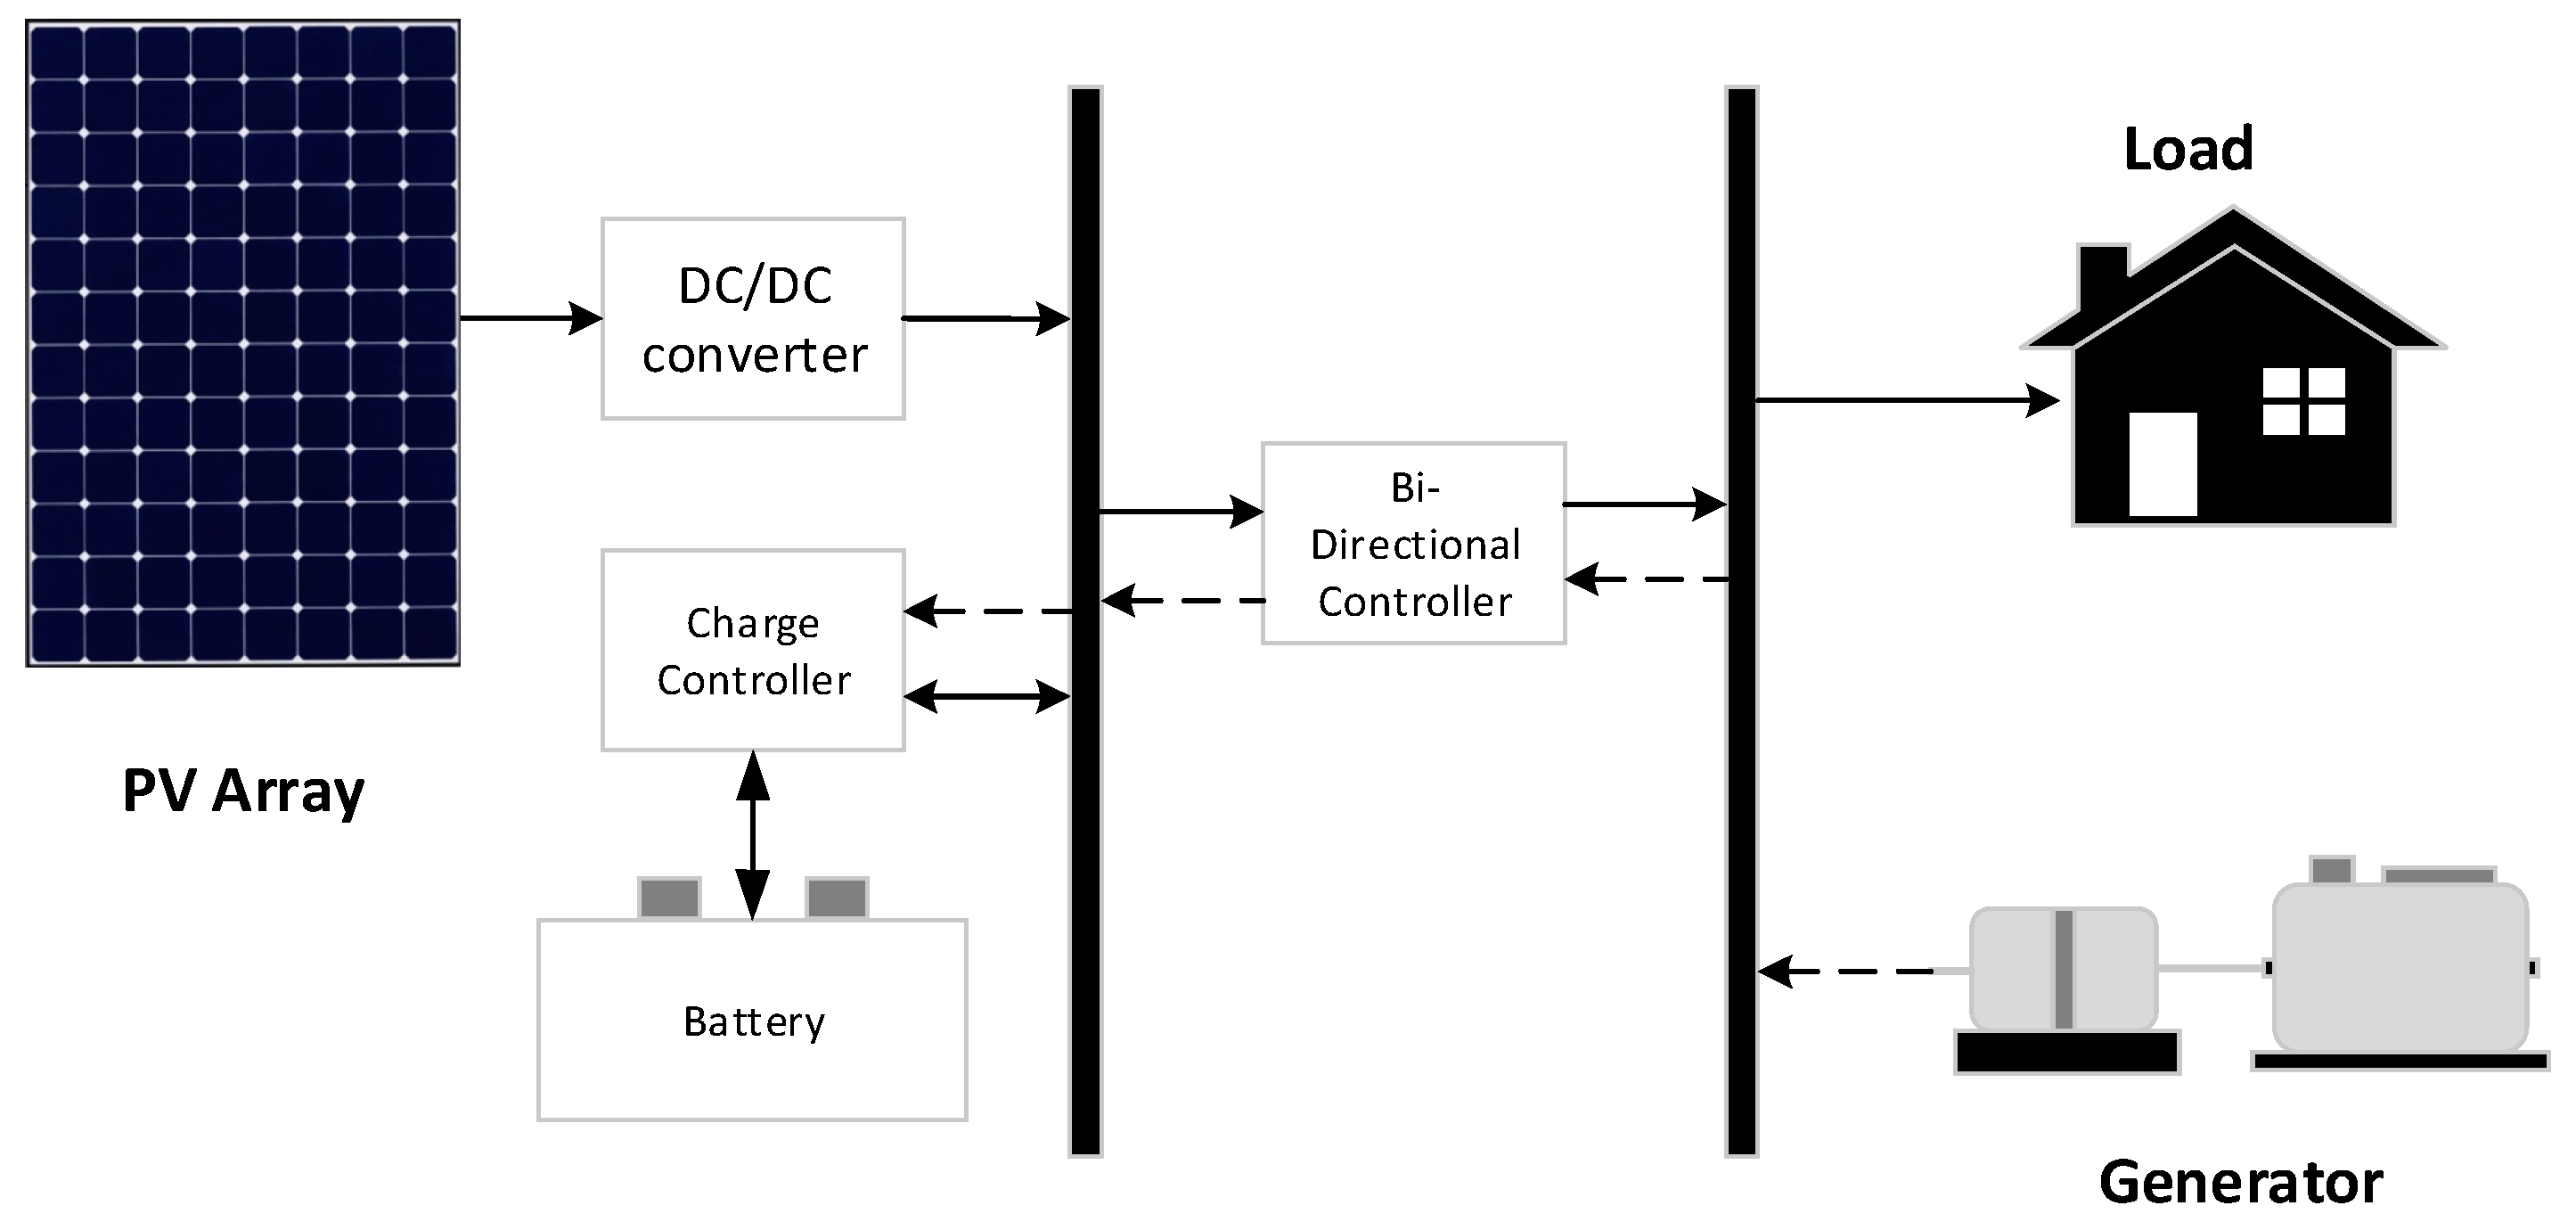
Figure 2 shows the suggested H-PVGTG system. The suggested system includes the PV array, GTG, the battery bank, and converters. The regular load of the suggested model is 107 MWh/day with a peak load demand of 6.062 MW. The energy that is produced daily by the PV is calculated by Equation (3)
P P V ( t ) = ( P P V ( G ( t ) G r e f ) ( α P ( T ( t ) T r e f ) ) ) η i n v η w  
where P P V is the maximum output power of the system at the STC; G is the correlated solar irradiation in W / m 2 ; G r e f is the solar radiation at the STC; α P is the temperature coefficient of the PV power module that is provided by the fabricator; T is the module temperature; T r e f is the room temperature at the STC; η i n v is the inverter efficiency; and η w is the efficiency of wires.
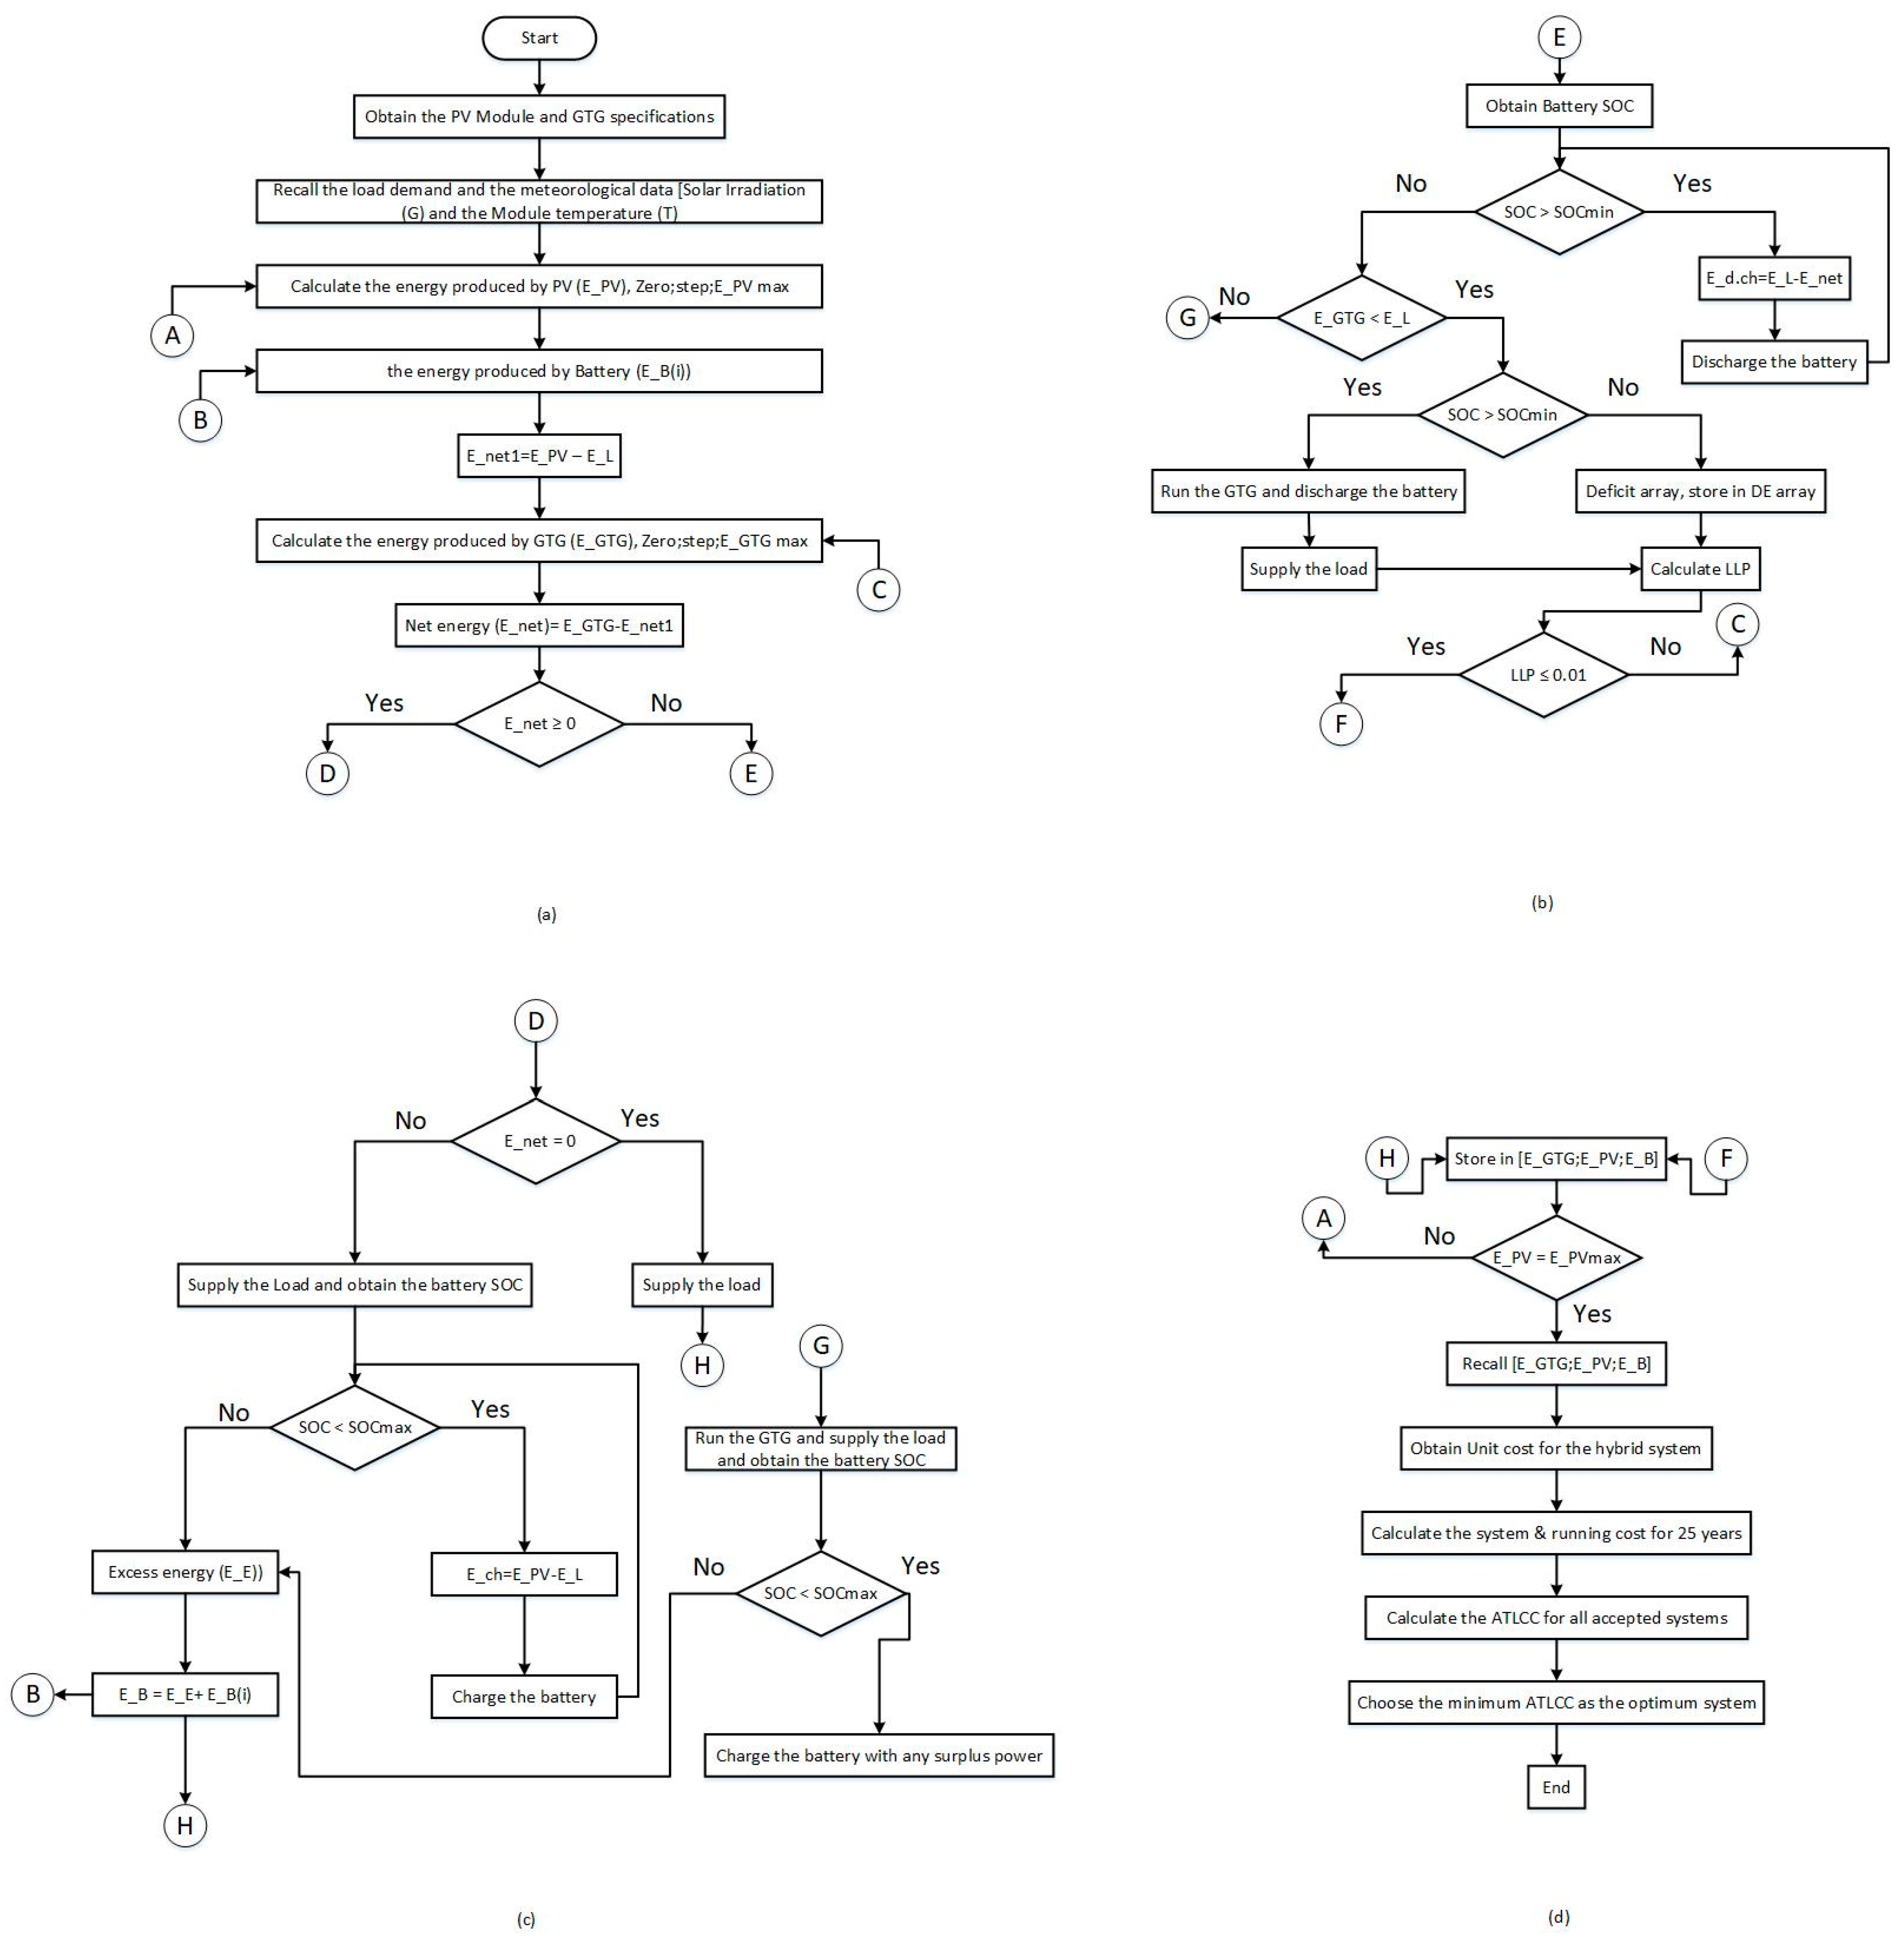
Figure 3 shows a verification of the utilized PV output power model. From this figure, the utilized mathematical model successfully predicts the pout power of the PV array. This is very important for the optimization process as it directly affects the accuracy of the results. However, it is still important to evaluate the utilized model using statistical measures. Thus, as recommended by [23], the Relative Root Mean Square Error (NRMSE) is used to verify the utilized model. Here, Equation (1) is used to compute the initial required size of the PV system that can cover the load demand. In addition to this, the extra produced energy that comes out from both the PV and the GTG systems is used to design the battery bank capacity, as shown in Figure 4c and calculated by Equation (4).
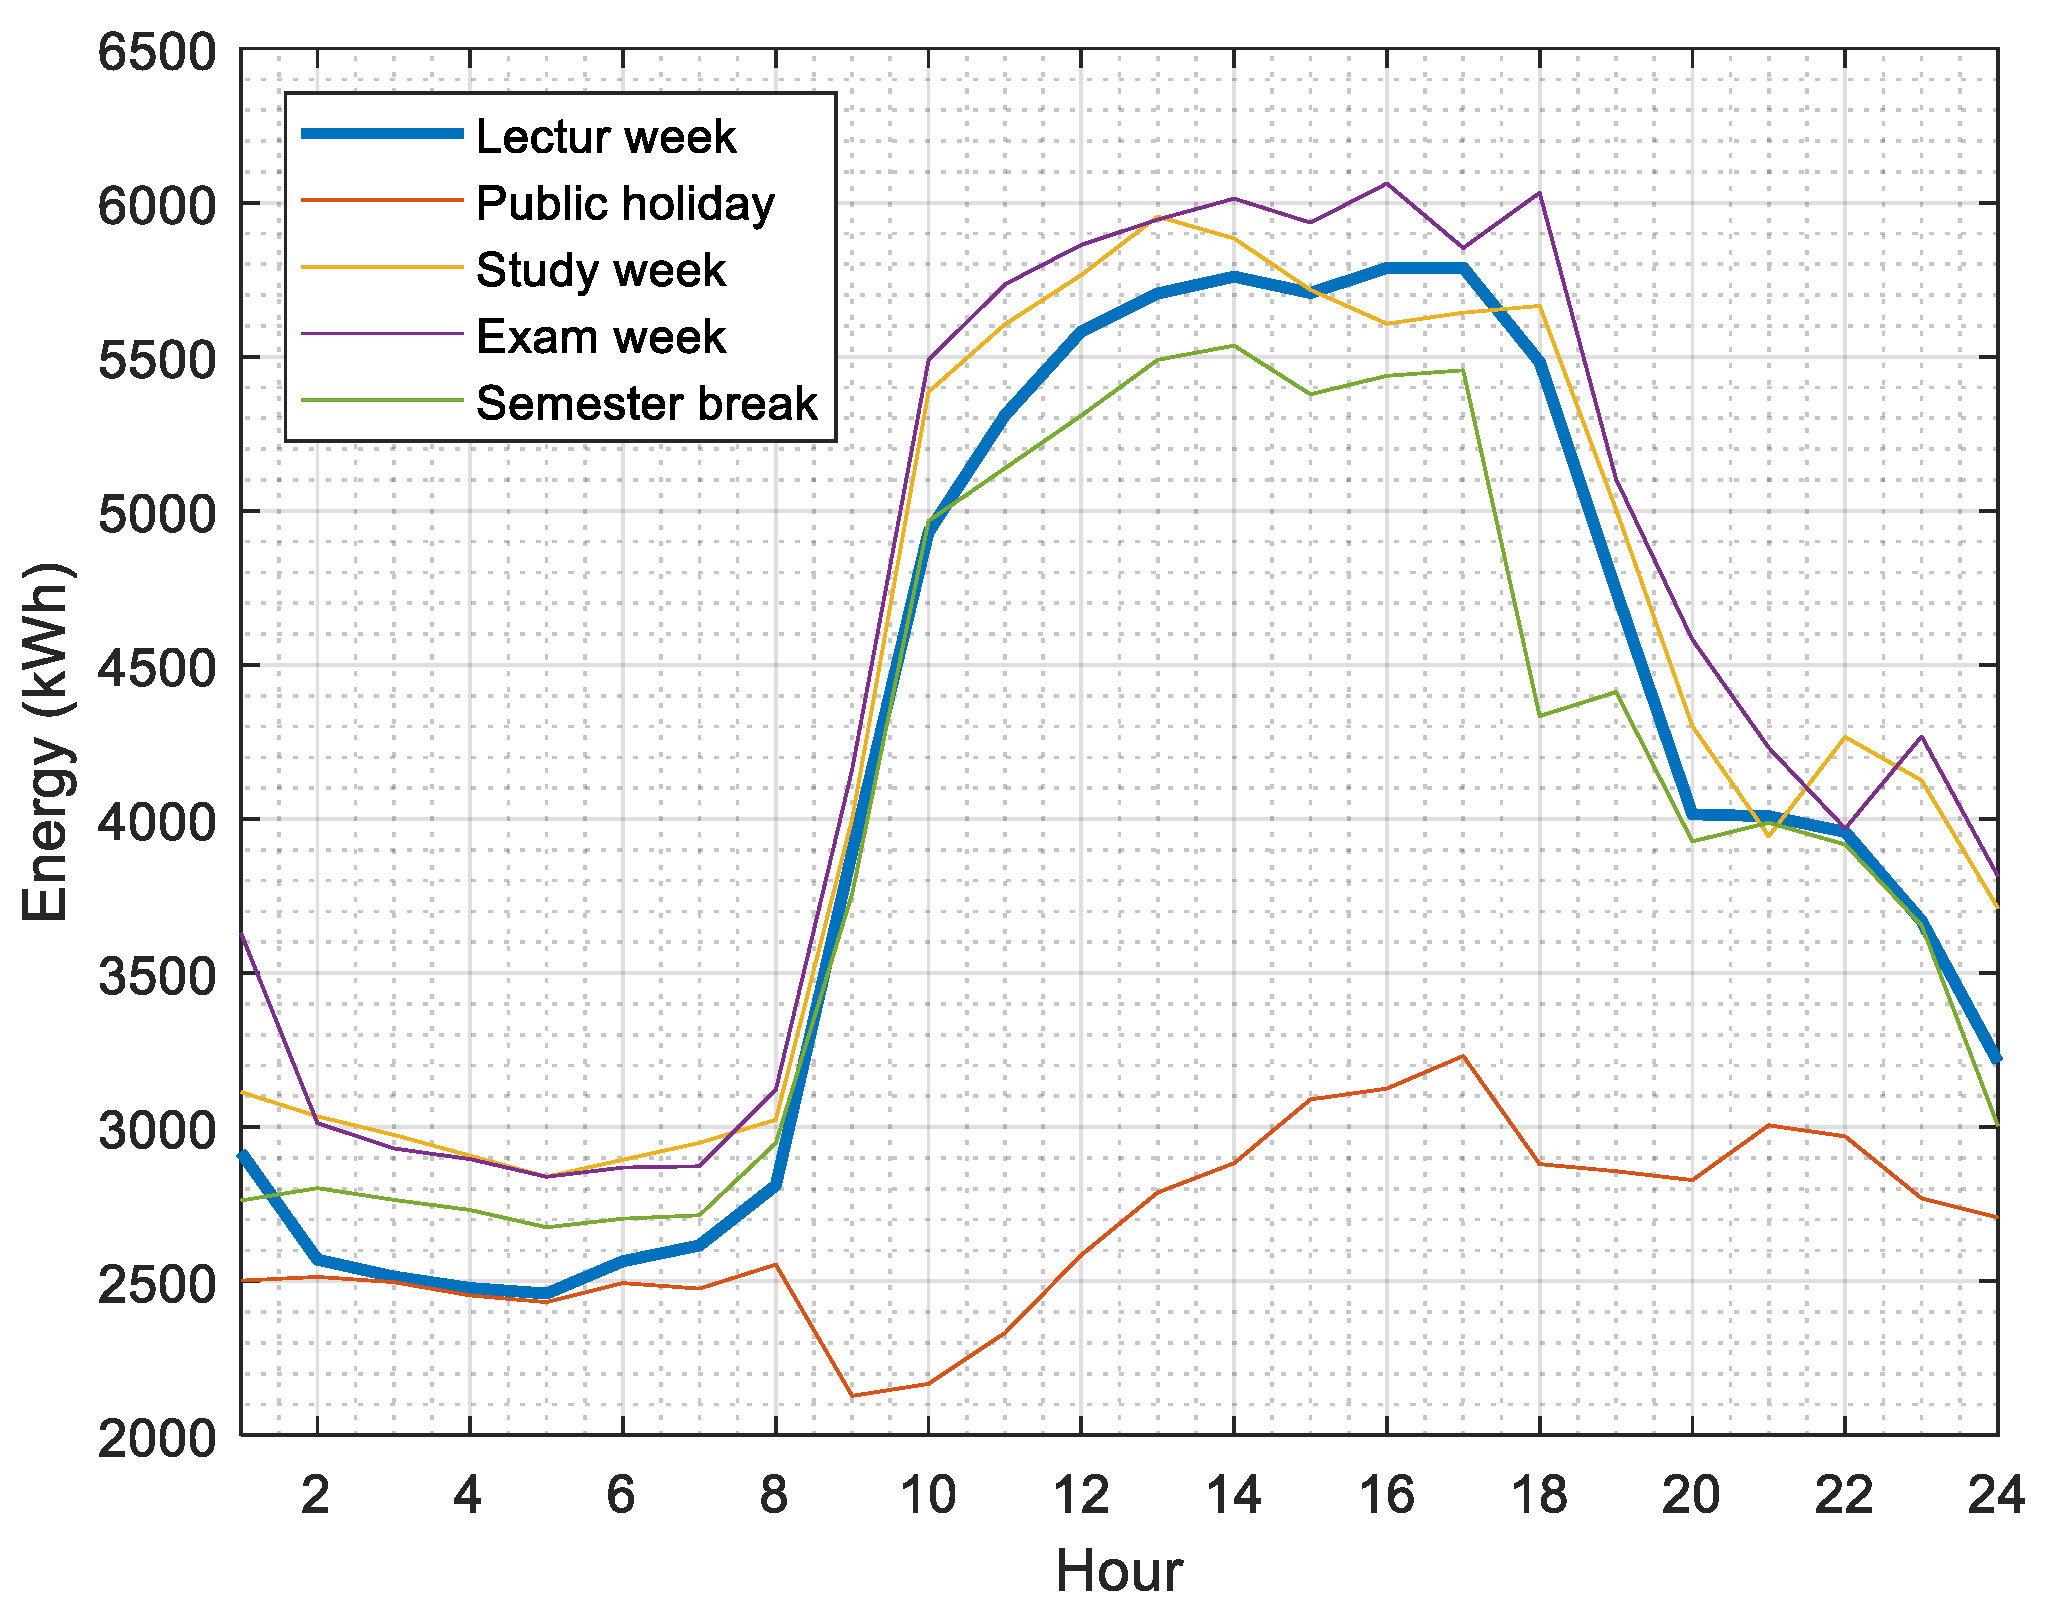
This investigation takes place in Malaysia, in Seri Iskandar, Perak, and the case study for this research is the Universiti Teknologi PETRONAS system that includes academic buildings, laboratories, street lights, sports fields, and residential villages. The load data has been gathered from the power substations distributed among the campus. The existing power supply system consists of two GTG units, where each set is 4.2 MW with a total supply power of 8.4 MW. The maximum demand during the day is 6.062 MWh with a 107.711 MWh total load demand per day. During the year, the UTP (Universiti Teknologi PETRONAS) has different load curves as the load demand is not the same during semester days. The lecturing week curve that is shown in Figure 5 is the main load curve that has been used in this study. Based on the load demand, the size of the SAPVS with a battery that can supply the UTP is calculated. The size of the PV model has been computed by (1), and the output energy generated by the array is also calculated by (3). After that, the size of the storage system has been computed by (2), and the LLP is figured out by (4).
L L P = i = 1 365 E n e r g y   d e f i c i t s i j = 1 365 E n e r g y   d e m a n d j
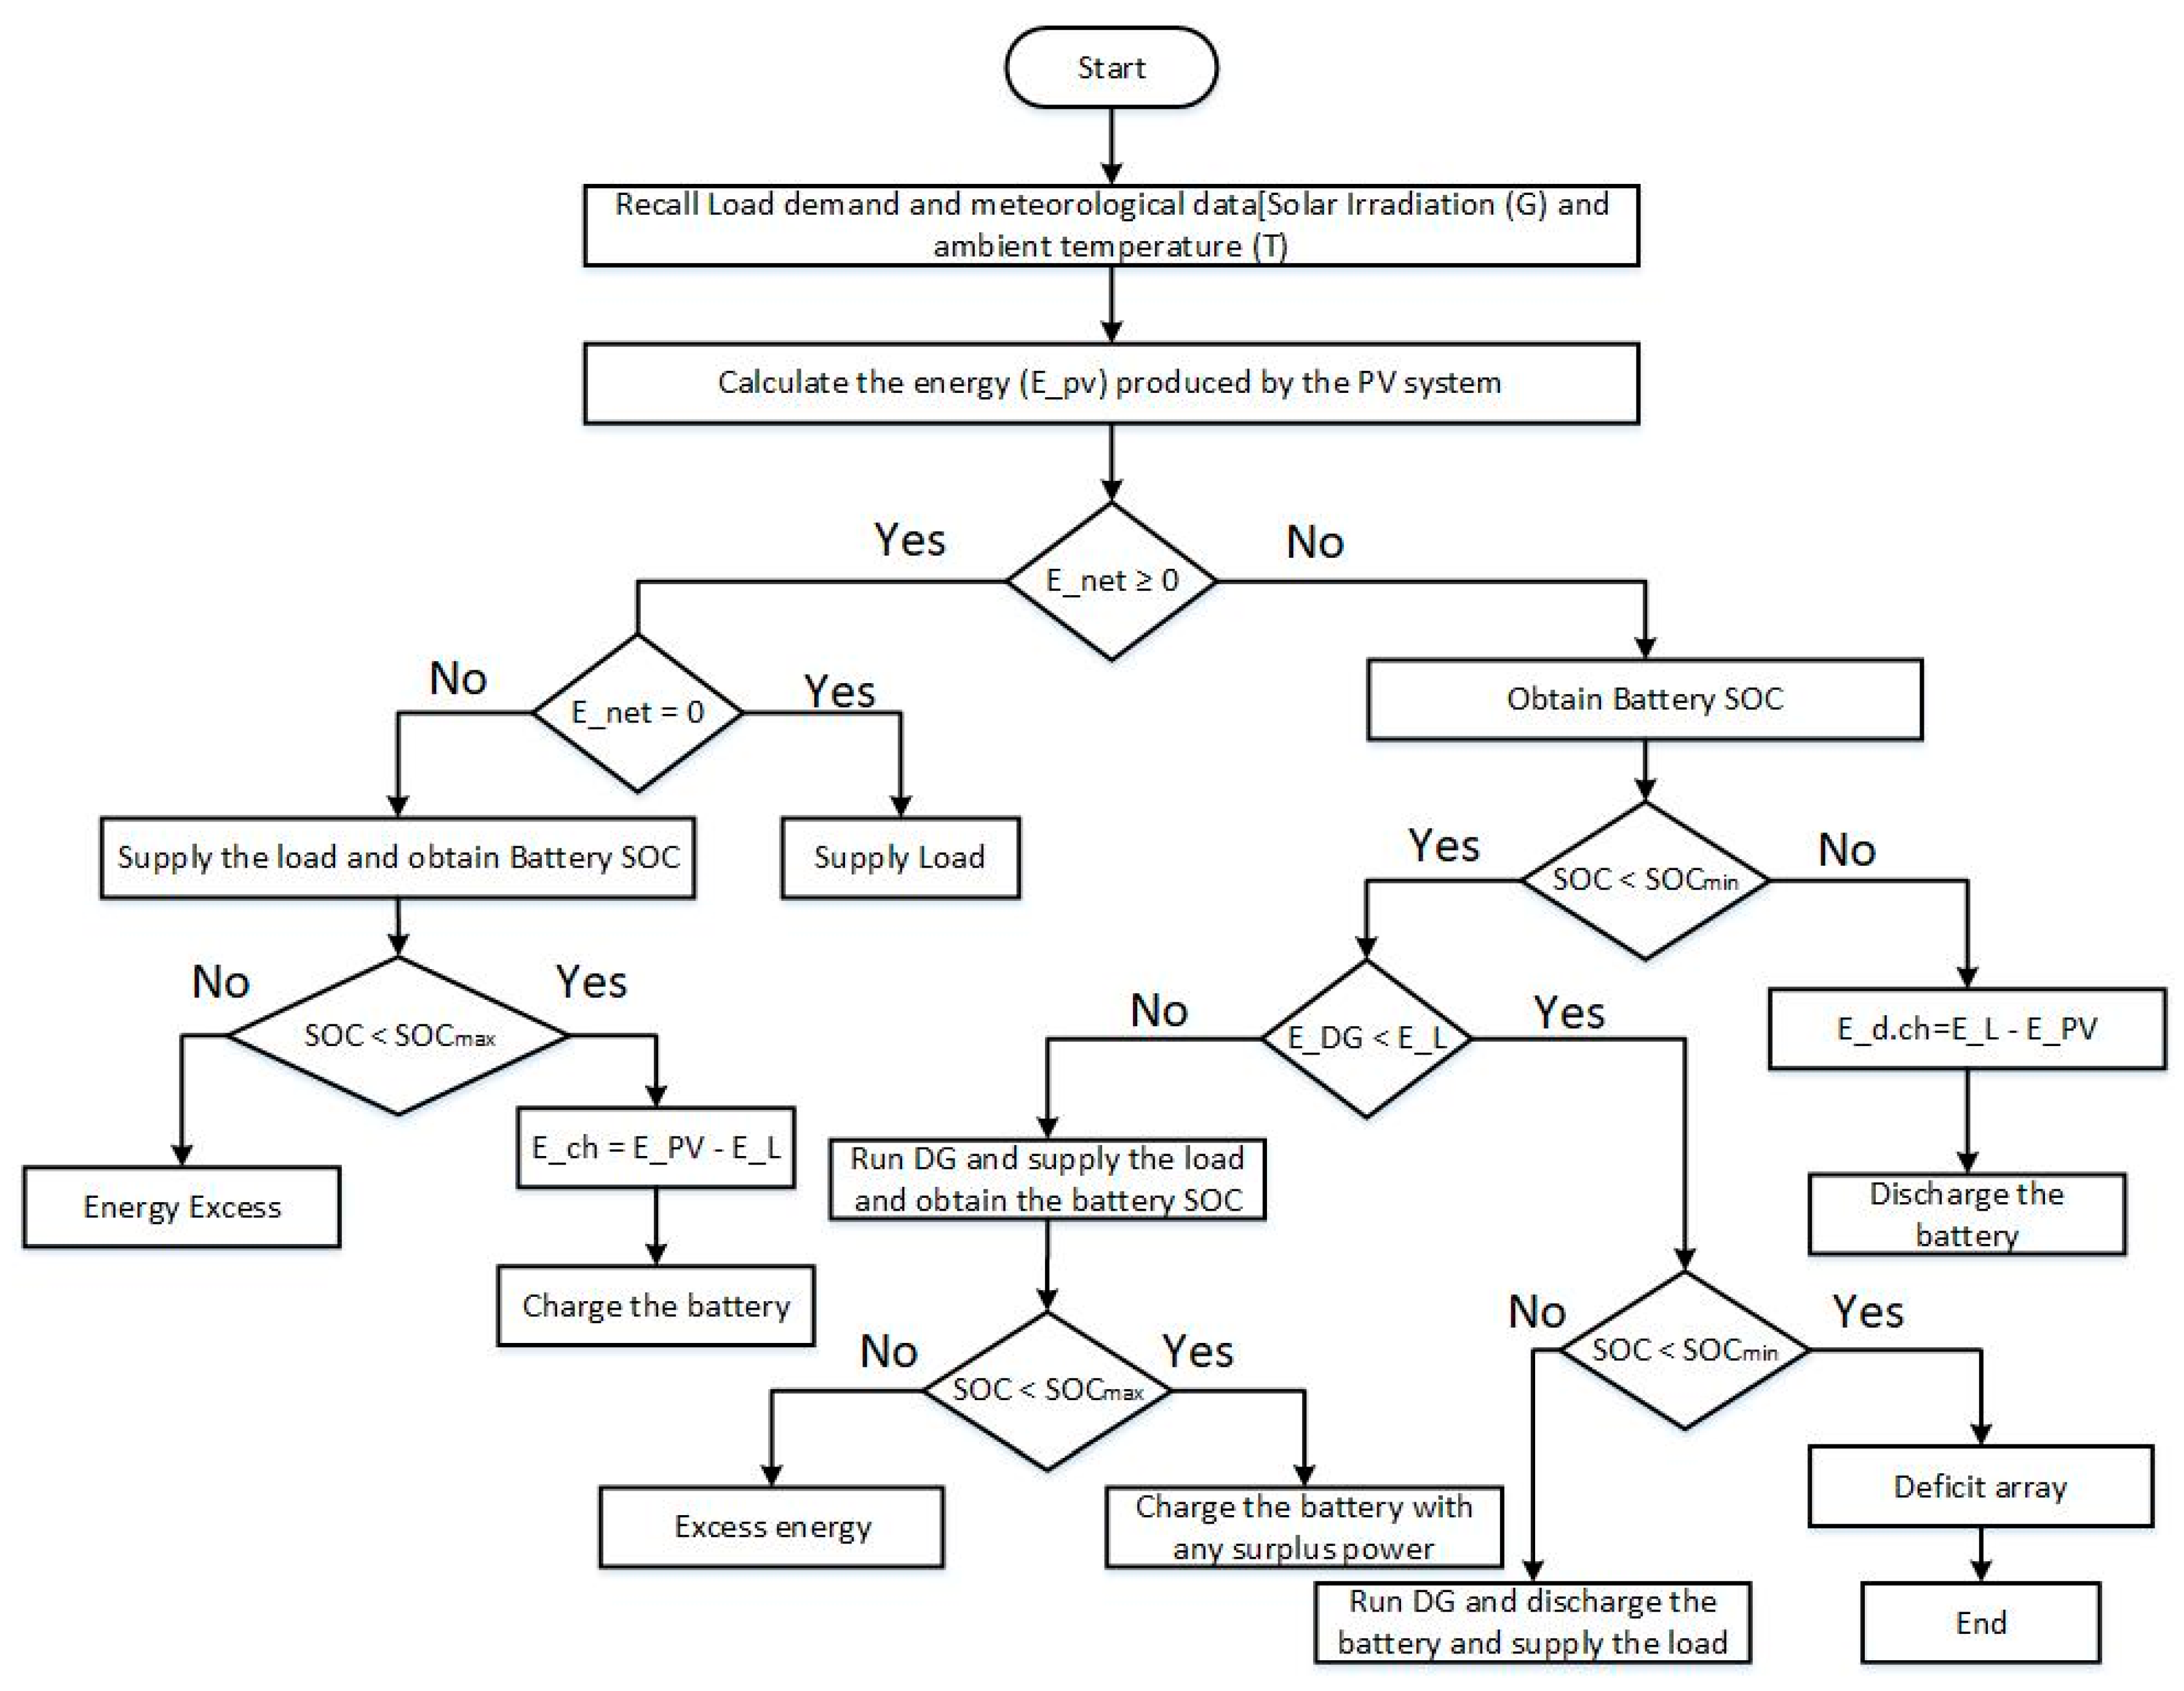
Figure 6 shows the optimization algorithm utilized in this research. The primary objective of this optimization is to consider the control part of the battery in addition to use the extra produced energy that is gained by the system sources to design the battery capacity. The cycle charge strategy was used with some modifications in part of the battery design to use the excess energy. Figure 6 shows the cycle charge strategy, and Figure 4b and c are presenting the modifications of the battery design. After designing the system, the LLP is calculated to make sure that the system is achieving the technical requirements. ATLCC is calculated to choose the best optimum size that acquires the technical needs with the minimum ATLCC.
In general, most of the previous optimization algorithms did not consider the control technique or the dynamic battery model to design the system. In this research, a numerical algorithm for a PV, GTG, and dynamic battery accurate models is used. Based on [23], the cycle charge strategy is more economical than the load following strategy dispatch for the battery model. The cycle charge strategy that is shown in Figure 6 has some drawbacks. Thus, new modifications are added to the cycle charge strategy dispatch to increase the accuracy of the battery sizing and performance. Following the cycle charge strategy, there are two conditions that are expressed in Equation (5).
E n e t = { S u p p l y   t h e   l o a d   a n d   C h e c k   t h e   b a t t e r y   c o n d i t o n   ,     i f   E n e t > 0 ; S u p p l y   t h e   l o a d   o n l y ,   i f   E n e t = 0 ;
The first condition of Equation (5) also has two conditions, which are figured in Equation (6).
S O C = { C h a r g e   t h e   b a t t e r y   ,     i f   S O C < S O C m a x ; E x c e s s   E n e r g y ,   i f   S O C = S O C m a x ;
Equation (7) shows that the condition of charging the battery is not considered if the extra generated energy is enough to charge the battery or may exceed its maximum capacity. To overcome this disadvantage, there is necessary feedback to ensure that the proposed algorithm considers all the battery conditions. Similarly, at the right side of the algorithm, while checking the battery discharging process, there is no feedback to show when the battery is already fully discharged and when the diesel generator is needed to be operated to satisfy the demand of the system. Furthermore, the algorithm does not consider the value of LLP. Moreover, the optimum size of energy sources such as the PV array and the diesel generator has not been considered, nor has the storage system capacity. Besides, there is no use of the surplus power that has been generated from the PV array only or the diesel generator. The new algorithm covers all those disadvantages besides the economic analysis of the system.
The accepted sizes of the islanded system for the UTP is calculated and the ATLCC is computed by (7). The definition of the ATLCC in terms of (USD/year) is the summation of the annualized capital costs, C c a p ,   a , the operation and annualized maintenance costs,   C o & m ,   a , and the annualized replacement costs, C r e p ,   a . The annualized salvage value   C s ,   a is deducted from the sum of C c a p ,   a   ,   C o & m ,   a ,   a n d   C r e p ,   a as follows:
A T L C C = D e v i c e   C c a p ,   a + C o & m ,   a + C r e p ,   a + C s ,   a
In this research, the C r e p ,   a and the C s ,   a are calculated within the maintenance cost; due to this, they are equal to zero in Equation (7).
The ATLCC has been formulated as follows:
C c a p ,   a = C c a p ( 1 + n d r ) L s 1 n d r ( 1 + n d r ) L s
C o & m ,   a = C o & m ( 1 + n d r ) L s 1 n d r ( 1 + n d r ) L s
n d r = [ ( 1   +   i n t e r s t % 1   +   i n f l a t i o n % ) 1 ]
C c a p = C c a p , P V + C c a p , I n v + C c a p , O C + C c a p ,   B a t + C c a p , C C
C o & m = C o & m , P V + C o & m , I n v + C o & m , O C   + C o & m ,   B a t + C o & m , C C
where C c a p and C o & m are the total capital cost and the operating and maintenance expenses during the expected lifespan of the system, respectively. L s is the total lifetime of the according to the study, and ndr is the net of inflation rate discount. C c a p ,   P V , C c a p , I n v , C c a p , O C , C c a p ,   B a t , and C c a p ,   C C are the total capital cost for the PV array, inverter, other, battery, and the charger controller in conjunction. C o & m , P V , C o & m , I n v , C o & m , O C , C o & m , B a t , and C o & m , C C are the total operating and maintenance cost for the PV array, inverter, other, battery, and the charger controller jointly. Moreover, to calculate the expenses of the energy, levelized cost of energy (LCE) is used and computed by Equation (13).
L C E = ATLCC E t o t
where E t o t is the annual total load demand.
Similarly, the ATLCC is calculated for the proposed H-PVGTG system. However, the ATLCC of the standalone GTG existing system is calculated based on statistics from its control unit. Furthermore, the ATLCC for all these systems is compared and analyzed to show the impact of the proposed algorithm.

3. Results

In this research, all the data are collected from the case study location. The solar irradiation and the module temperature have been measured by sensors and the data collected through a data logger for one year with an interval of one hour with PSHa of 4.4 hours. To verify the experimental output data, (3) is used on the 2-kW PV module and the result shown in Figure 3. Based on [21], various scales of the NRMSE can be identified to show the models strength. If the NRMSE is less than 10%, it is very good, and if it is between 10% and 20%, this means that it is good. NRMSE is pearly accepted if it is between 20% and 30%, but, if its value is more than 30%, it is poor and cannot be accepted.
Based on Figure 4a, the meteorological data and the load demand data were called; furthermore, the sizing of the PV array, GTG system, and the storage system capacity is determined. At the end of this section, the net energy ( E n e t ) has been calculated. If E n e t   ≥ 0 the flow will go toward the excess energy section in Figure 4c, else it will go to the deficit energy section in Figure 4, section (b). After the end of the cycle flow among the first three sections, the accepted data is stored in the section of the system optimization parameters and the cost calculation in Figure 4d.
At the end of Figure 4a, if the value of E n e t = 0 then supply the load and save this value in the matrix of the accepted systems. If E n e t > 0, the battery S O C is going to be checked, and, based on the result, there are two conditions. The first option if the battery is already full is the surplus power will be excess energy and used to redesign the size of the battery bank to fit the extra produced energy, and the second one is if the storage system is not completely charged; therefore, the excess energy will keep charging the battery until S O C = S O C m a x , then the flow will go again to the first condition to resize the storage system. After the Figure 4c, process has ended, the new values of the system have been added to the accepted systems matrix. If E n e t < 0, in this case, the system automatically will go to the deficit energy section, which is placed in Figure 4b, to find the way to overcome the energy shortage either by the battery storage system or by the GTG. The deficit energy section is essentially trying to reduce the gap between the load demand and the generated energy. To achieve this, there are two options, the first of which is to discharge the battery system after checking its SOC to make sure that S O C > S O C m i n . The second option is to run the GTG and increase its power production. Afterward, check the value of E n e t to make sure that there is no deficit power; if there is, it must be within the allowable limit of the LLP value. In case of the inability to reduce the gap to the accepted range in the power generation system, then the flow of the chart goes to system sizing section at Figure 4a, to find a way to overcome this disablement. The flowchart will keep flowing like this until all possible conditions are tried. Then, by filtering the results, the optimum size of the system units is decided in terms of the ATLCC of the system for 25 years.
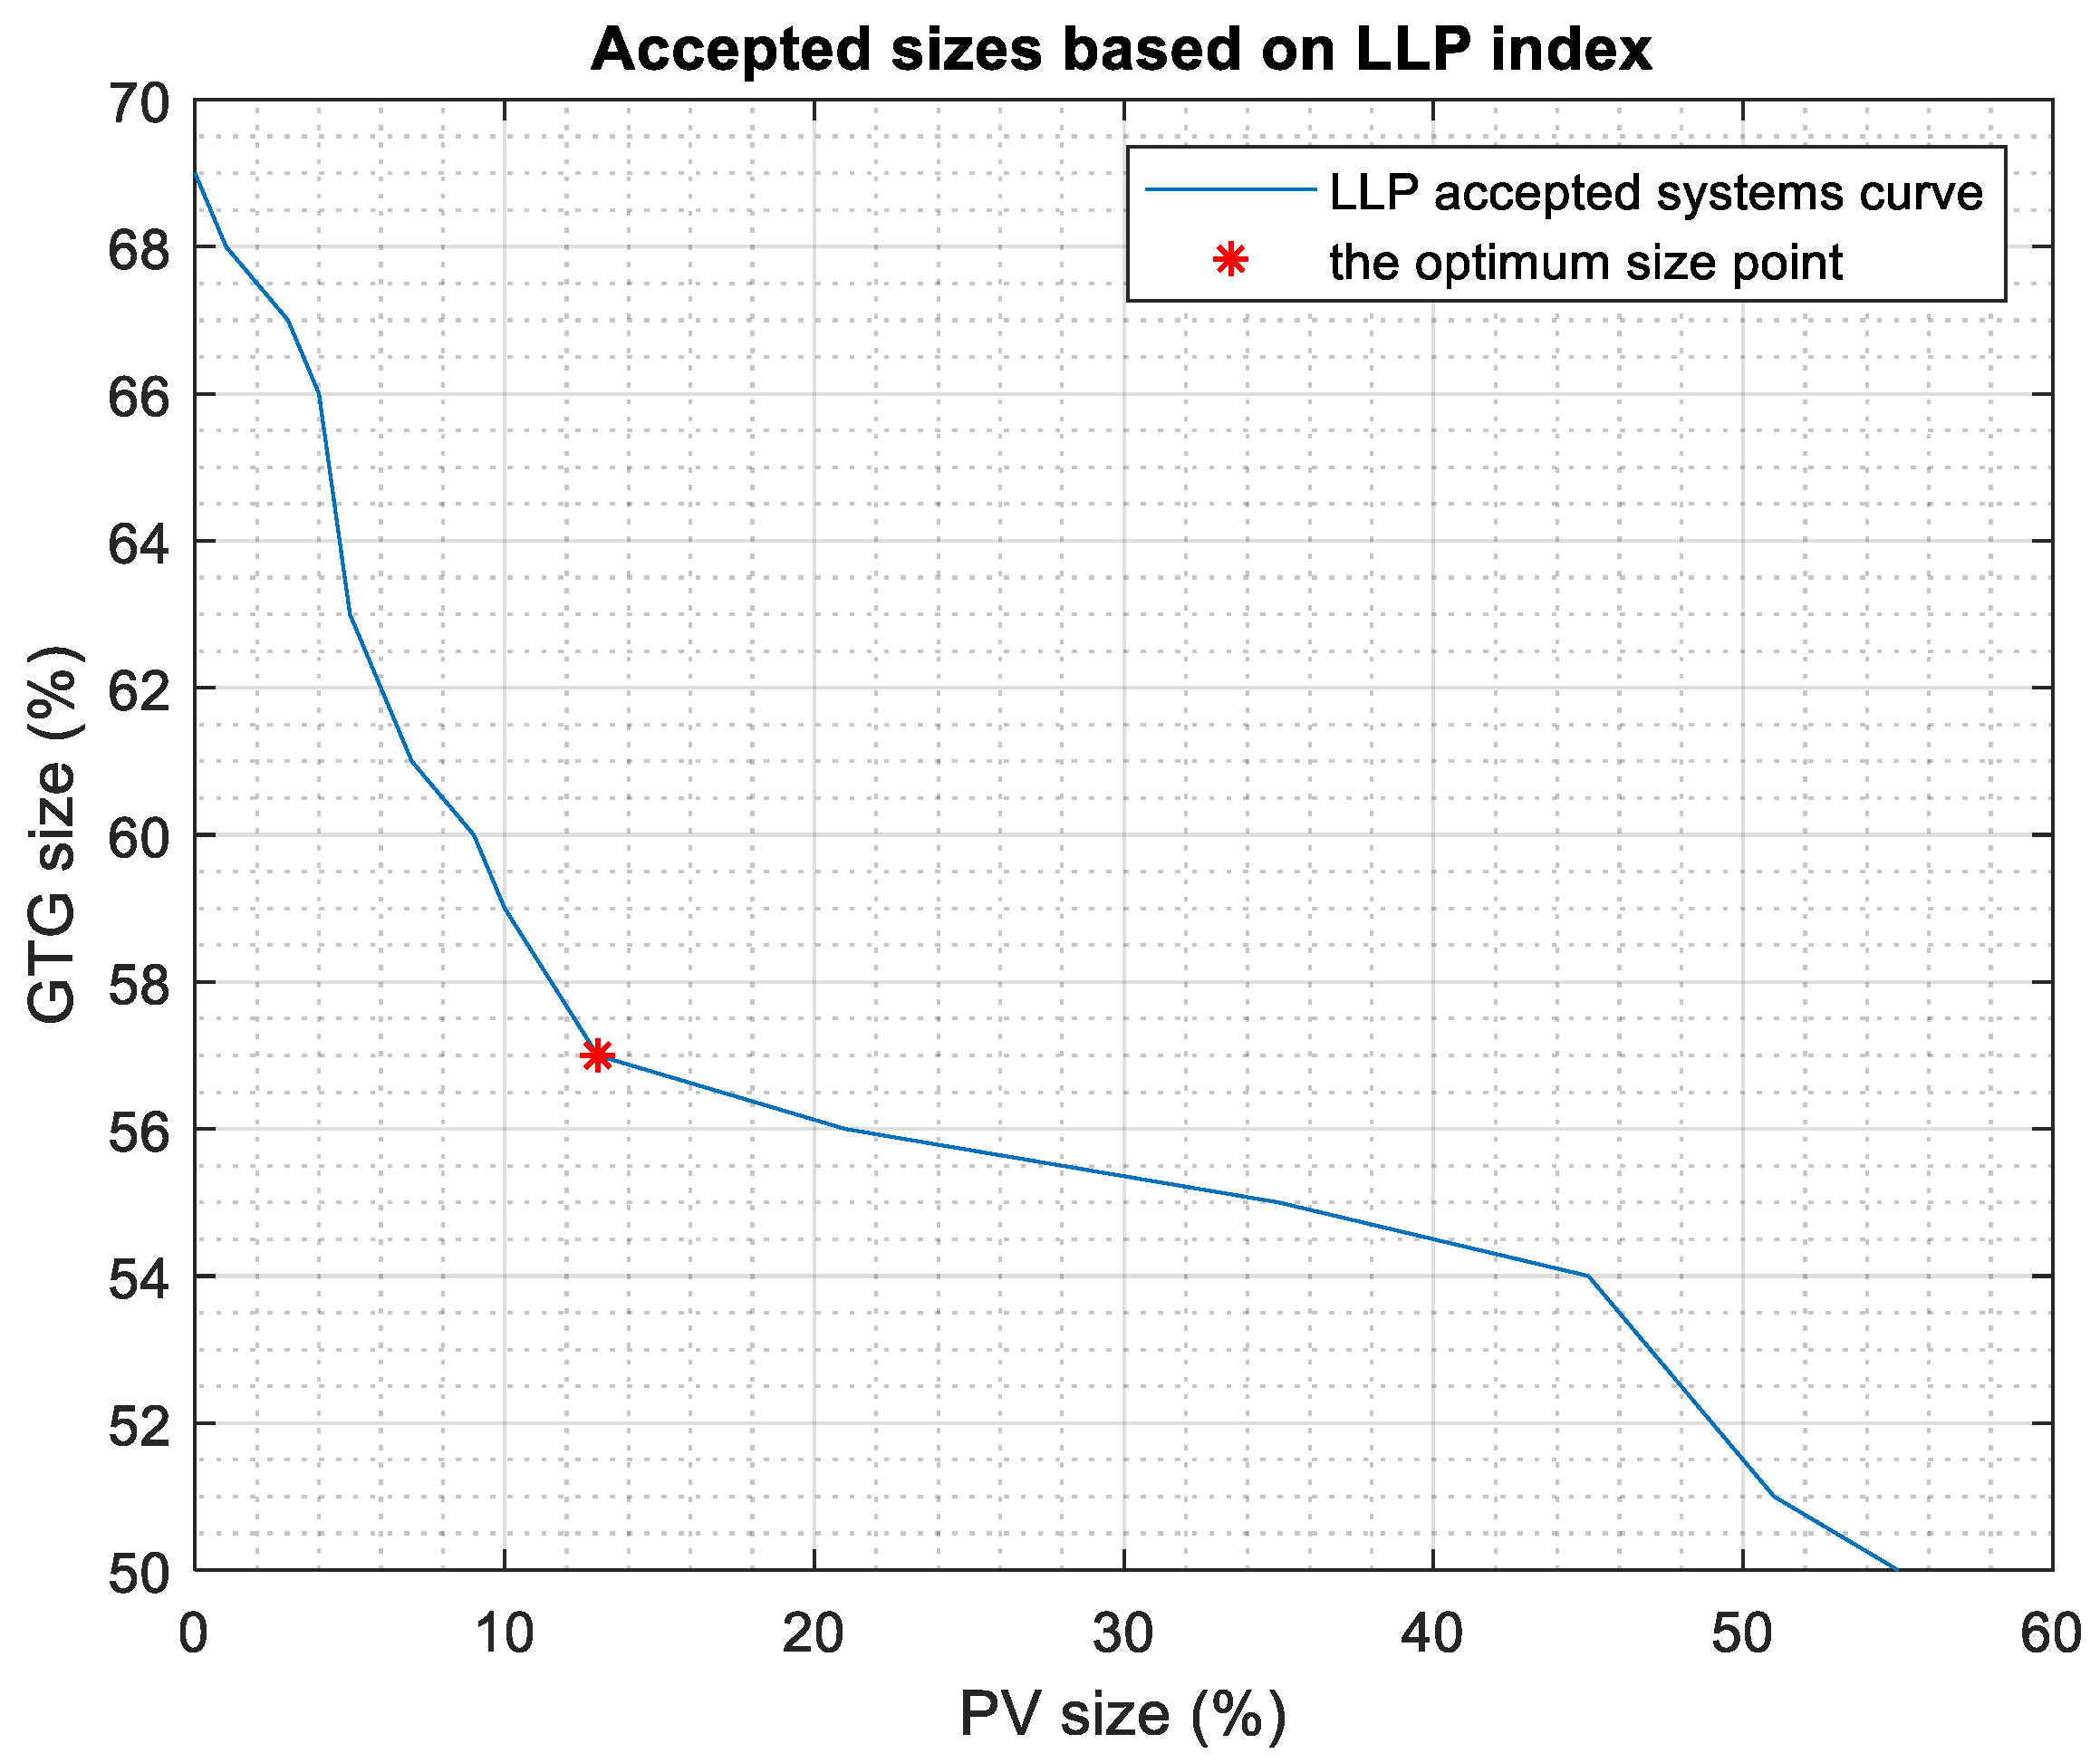
Based on the proposed algorithm, the size of the battery will not follow Equation (2) to calculate the battery size, but it will be designed based on the excess energy produced from the power sources during the generation process. After the sizing step, the accepted design space has been calculated. Figure 7 shows the accepted design space as a percentage from the maximum size of each power source and the storage system. To find the best size system between all design spaces, the lowest total system cost has been chosen. The red point in Figure 7 is the optimum size point based on the annual system cost. Table 1 shows the comparison between the annual cost of the suggested system, the GTG existing system, and the TNB (Tenaga National Berhard). By using the TNB, the annual savings will be USD 1.167 million per year, while the hybrid system will save USD 2.1 million per year.
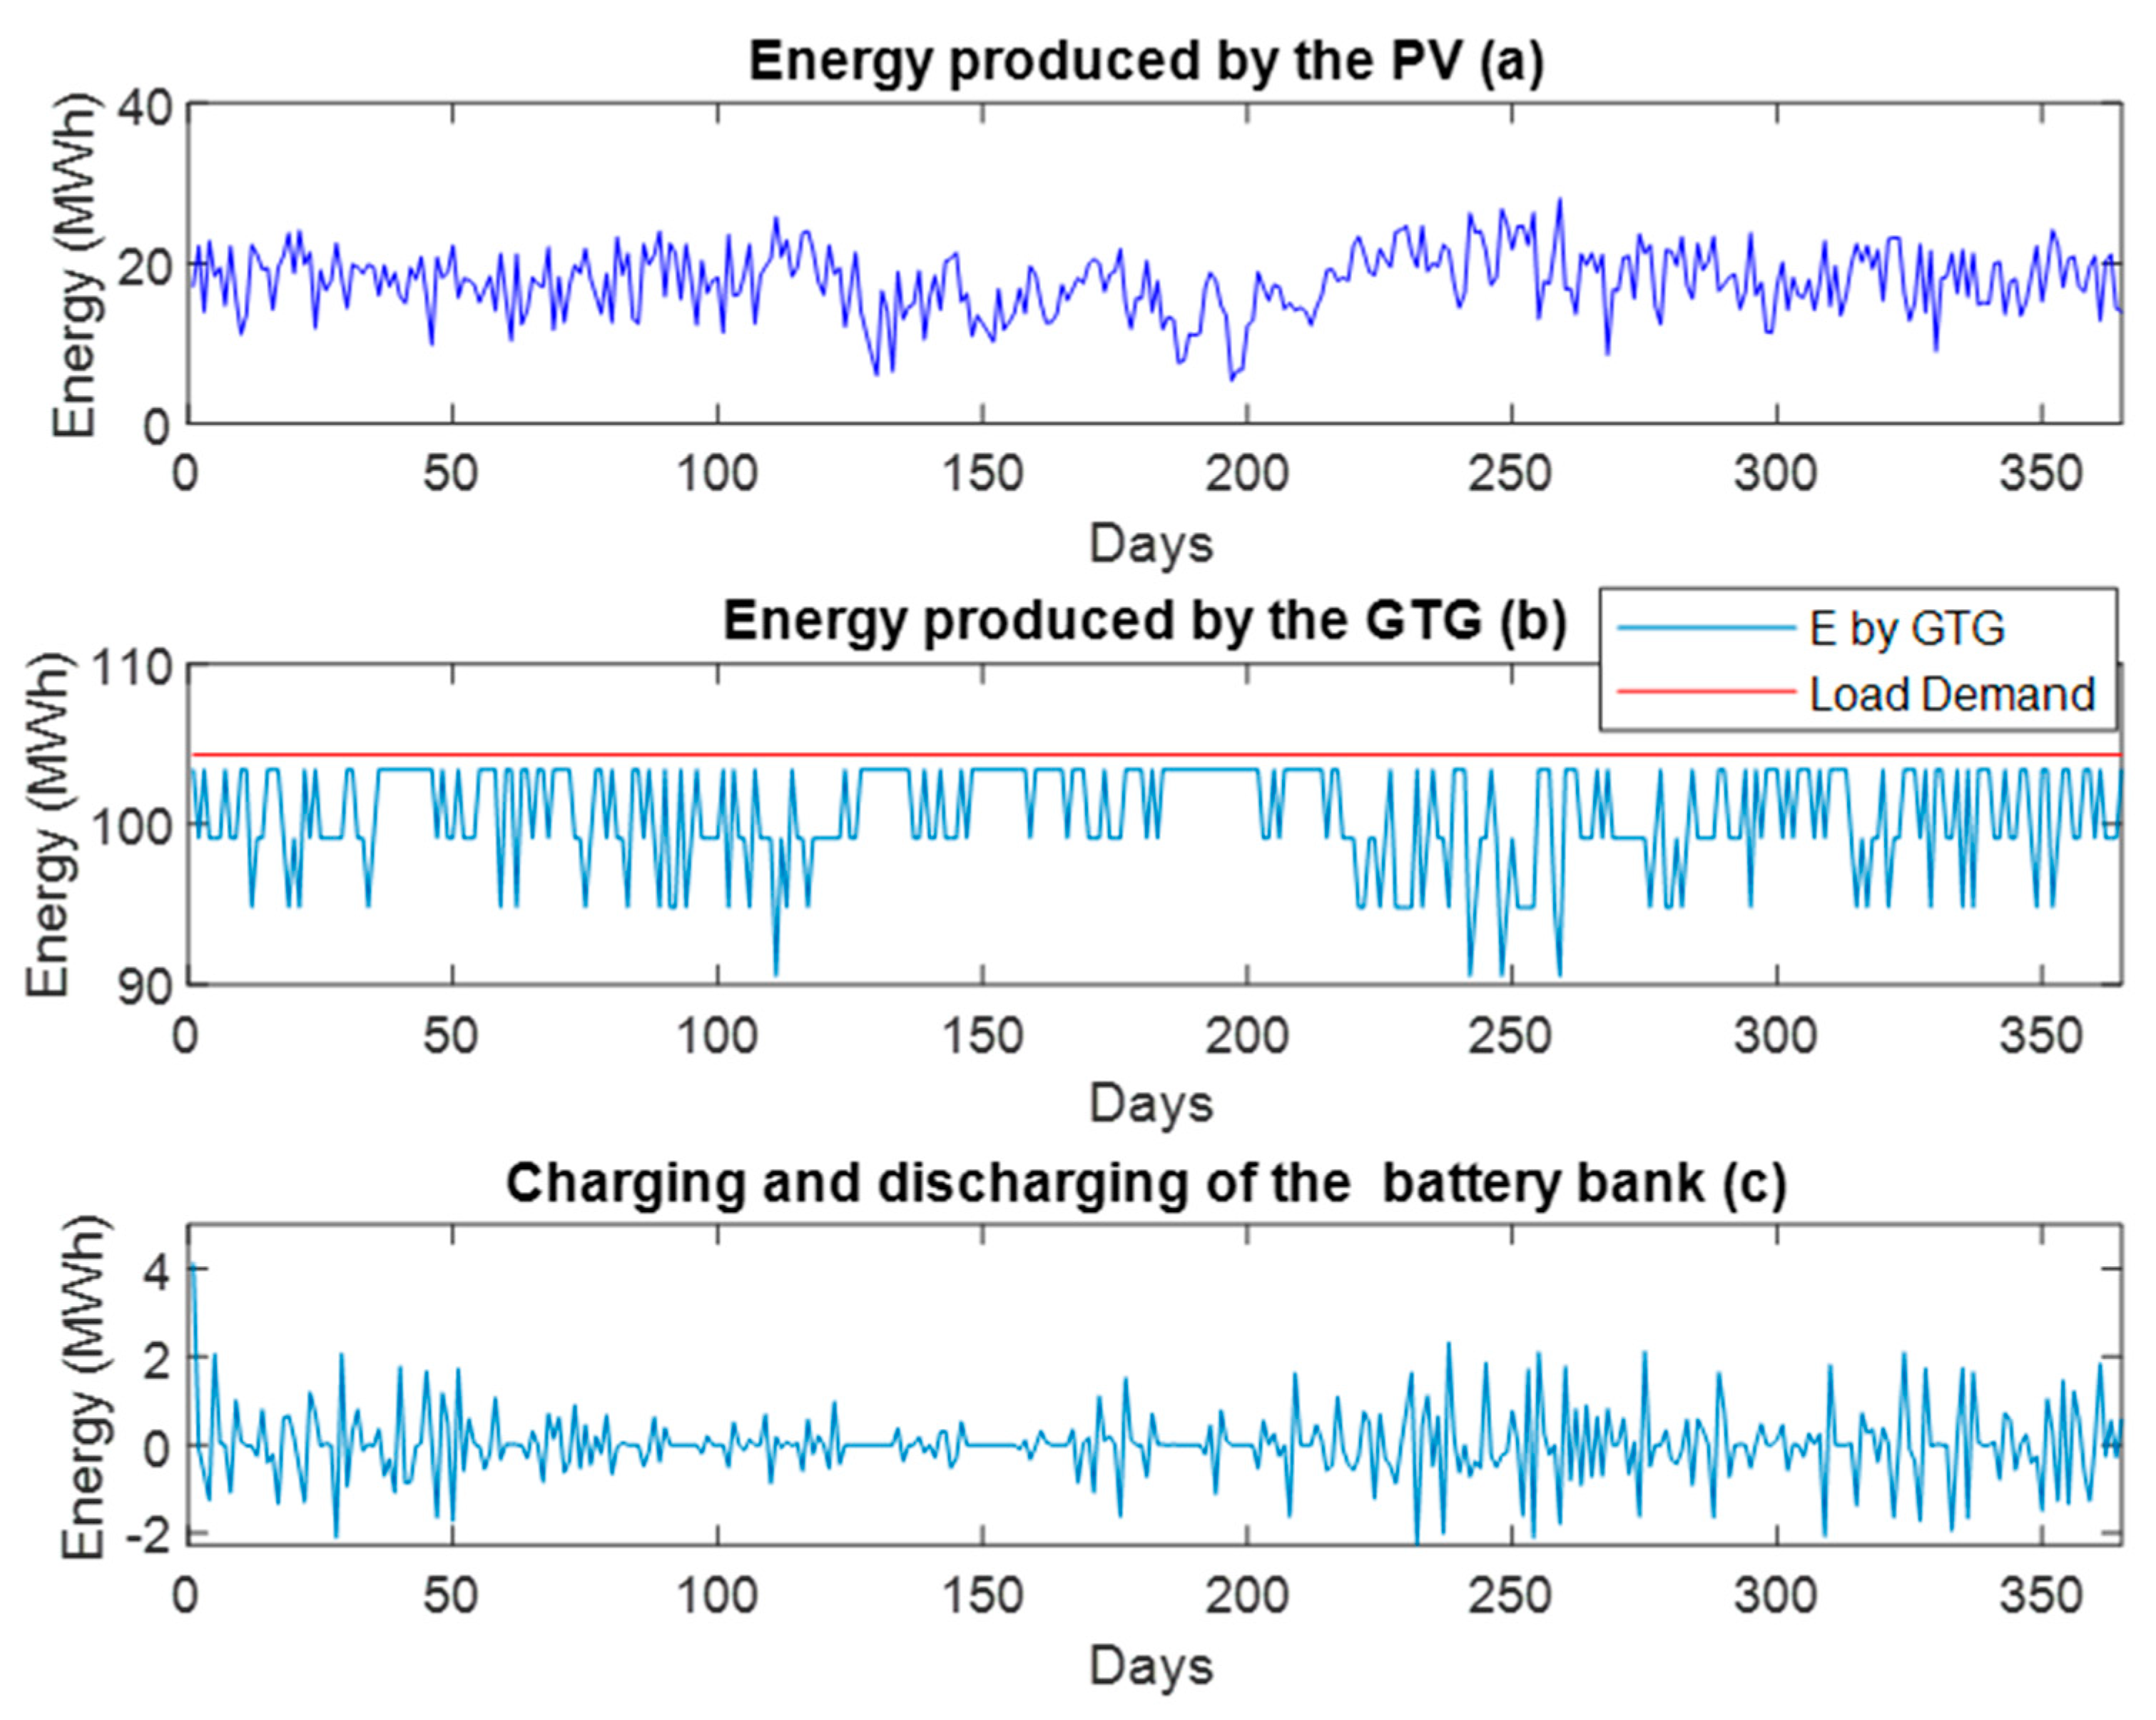
Figure 8 indicates the simulation results of the proposed algorithm in one year. Figure 8a, shows the produced energy by the PV power source. Moreover, the total energy resulted from the PV power source through the year is 6.464 GWh (17.7 MWh as the average production in the single day). Figure 8b, shows the GTG energy output in one year, which is 36.7 GWh (100.6 MWh as a mean daily output). Figure 8c, shows that the battery bank supply is only 4.8 MWh over the whole year. Meanwhile, Figure 9 presents 280 MWh deficit energy for one year. By using (5), the LLP of the suggested system is 0.0097. This value of LLP is not equal to zero, but it falls within the allowable range.

4. Conclusions

In this research, size optimization of the H-PVGTG system has been done and simulated. An improved numerical algorithm is proposed so as to design the system at zero load rejection. Accurate models for the PV array and system energy flow modes are also given in this study. The validation of the utilized system models was done first. Then, a one-year simulation of the system is conducted. The aim of simulating the system is to check its ability to fulfil the load demand and consequently calculate the system’s LLP. The conducted optimization first generated the design space, which contains many possible configurations of the system. After that, evaluation of these configurations was done based on system availability and cost. The optimization reached the lowest ATLCC with the accepted technical requirements. The proposed algorithm found the solution to this problem and has been considered the battery control section. A comparison between the existing system (GTG), electricity grid, standalone PV, and the proposed hybrid system has been presented in terms of the ATLCC. The result of the optimization shows that the improved algorithm reduced the ATLCC by 38% as compared to the existing system at an LLP of 0.0097. Thus, the proposed system is the most feasible option for powering the adapted load demand in the selected site.

Author Contributions

M.A., T.K., M.F.A. and M.F.R.: methodology, investigation, formal analysis, validation, writing paper draft. T.K. and M.A. supervision. T.K.: editing the paper. All authors have read and agreed to the published version of the manuscript.

Funding

This research was funded by UTP URIF & GA Scheme. Part of the authors is supported by An-Najah National University fund No. ANNU-1819-Sc010.

Conflicts of Interest

The authors declare no conflict of interest.

References

  1. Bhattacharya, M.; Paramati, S.R.; Ozturk, I.; Bhattacharya, S. The effect of renewable energy consumption on economic growth: Evidence from top 38 countries. Applied Energy 2016, 162, 733–744. [Google Scholar] [CrossRef]
  2. Mamaghani, A.H.; Escandon, S.A.A.; Najafi, B.; Shirazi, A.; Rinaldi, F. Techno-economic feasibility of photovoltaic, wind, diesel and hybrid electrification systems for off-grid rural electrification in Colombia. Renew. Energy 2016, 97, 293–305. [Google Scholar] [CrossRef]
  3. Saboori, H.; Hemmati, R.; Jirdehi, M.A. Reliability improvement in radial electrical distribution network by optimal planning of energy storage systems. Energy 2015, 93, 2299–2312. [Google Scholar] [CrossRef]
  4. Pavković, D.; Hoić, M.; Deur, J.; Petrić, J. Energy storage systems sizing study for a high-altitude wind energy application. Energy 2014, 76, 91–103. [Google Scholar] [CrossRef]
  5. Cucchiella, F.; D’Adamo, I.; Gastaldi, M.; Stornelli, V. Solar Photovoltaic Panels Combined with Energy Storage in a Residential Building: An Economic Analysis. Sustainability 2018, 10, 3117. [Google Scholar] [CrossRef] [Green Version]
  6. Mohd Shatar, N.; Abdul Rahman, M.A.; Muhtazaruddin, M.N.; Shaikh Salim, S.A.Z.; Singh, B.; Muhammad-Sukki, F.; Bani, N.A.; Mohd Saudi, A.S.; Ardila-Rey, J.A. Performance Evaluation of Unconcentrated Photovoltaic-Thermoelectric Generator Hybrid System under Tropical Climate. Sustainability 2019, 11, 6192. [Google Scholar] [CrossRef] [Green Version]
  7. Khatib, T.; Mohamed, A.; Sopian, K. Optimization of a PV/wind micro-grid for rural housing electrification using a hybrid iterative/genetic algorithm: Case study of Kuala Terengganu, Malaysia. Energy Build. 2012, 47, 321–331. [Google Scholar] [CrossRef]
  8. Chen, P.-J.; Wang, F.-C. Design optimization for the hybrid power system of a green building. Int. J. Hydrogen Energy 2018, 43, 2381–2393. [Google Scholar] [CrossRef]
  9. Sadeghi, S.; Ameri, M. Comparison the combination of different power generators with photovoltaic panels and batteries. In Computer Applications for Security, Control and System Engineering; Springer: Berlin/Heidelberg, Germany, 2012; pp. 376–387. [Google Scholar]
  10. Basrawi, F.; Yamada, T.; Obara, S.Y. Economic and environmental based operation strategies of a hybrid photovoltaic–microgas turbine trigeneration system. Appl. Energy 2014, 121, 174–183. [Google Scholar] [CrossRef] [Green Version]
  11. Comodi, G.; Renzi, M.; Cioccolanti, L.; Caresana, F.; Pelagalli, L. Hybrid system with micro gas turbine and PV (photovoltaic) plant: Guidelines for sizing and management strategies. Energy 2015, 89, 226–235. [Google Scholar] [CrossRef]
  12. Jaber, J.; Odeh, S.; Probert, S. Integrated PV and gas-turbine system for satisfying peak-demands. Appl. Energy 2003, 76, 305–319. [Google Scholar] [CrossRef]
  13. Sinha, S.; Chandel, S. Review of recent trends in optimization techniques for solar photovoltaic–wind based hybrid energy systems. Renew. Sustain. Energy Rev. 2015, 50, 755–769. [Google Scholar] [CrossRef]
  14. Khatib, T.; Mohamed, A.; Sopian, K. A review of photovoltaic systems size optimization techniques. Renew. Sustain. Energy Reviews 2013, 22, 454–465. [Google Scholar] [CrossRef]
  15. Shen, W. Optimally sizing of solar array and battery in a standalone photovoltaic system in Malaysia. Renewable energy 2009, 34, 348–352. [Google Scholar] [CrossRef]
  16. Yang, Y.; Guo, S.; Liu, D.; Li, R.; Chu, Y. Operation optimization strategy for wind-concentrated solar power hybrid power generation system. Energy Convers. Manag. 2018, 160, 243–250. [Google Scholar] [CrossRef]
  17. Bataineh, K.; Dalalah, D. Optimal configuration for design of stand-alone PV system. Smart Grid Renew. Energy 2012, 3, 139–147. [Google Scholar] [CrossRef] [Green Version]
  18. Kouro, S.; Leon, J.I.; Vinnikov, D.; Franquelo, L.G. Grid-connected photovoltaic systems: An overview of recent research and emerging PV converter technology. IEEE Ind. Electron. Mag. 2015, 9, 47–61. [Google Scholar] [CrossRef]
  19. Vivas, F.; De las Heras, A.; Segura, F.; Andújar, J. A review of energy management strategies for renewable hybrid energy systems with hydrogen backup. Renew. Sustain. Energy Rev. 2018, 82, 126–155. [Google Scholar] [CrossRef]
  20. Ogunjuyigbe, A.; Ayodele, T.; Akinola, O. Optimal allocation and sizing of PV/Wind/Split-diesel/Battery hybrid energy system for minimizing life cycle cost, carbon emission and dump energy of remote residential building. Appl. Energy 2016, 171, 153–171. [Google Scholar] [CrossRef]
  21. Kaabeche, A.; Ibtiouen, R. Techno-economic optimization of hybrid photovoltaic/wind/diesel/battery generation in a stand-alone power system. Solar Energy 2014, 103, 171–182. [Google Scholar] [CrossRef]
  22. Belaid, S.; Mellit, A. Prediction of daily and mean monthly global solar radiation using support vector machine in an arid climate. Energy Convers. Manag. 2016, 118, 105–118. [Google Scholar] [CrossRef]
  23. Ameen, A.M.; Pasupuleti, J.; Khatib, T. Simplified performance models of photovoltaic/diesel generator/battery system considering typical control strategies. Energy Convers. Manag. 2015, 99, 313–325. [Google Scholar] [CrossRef]
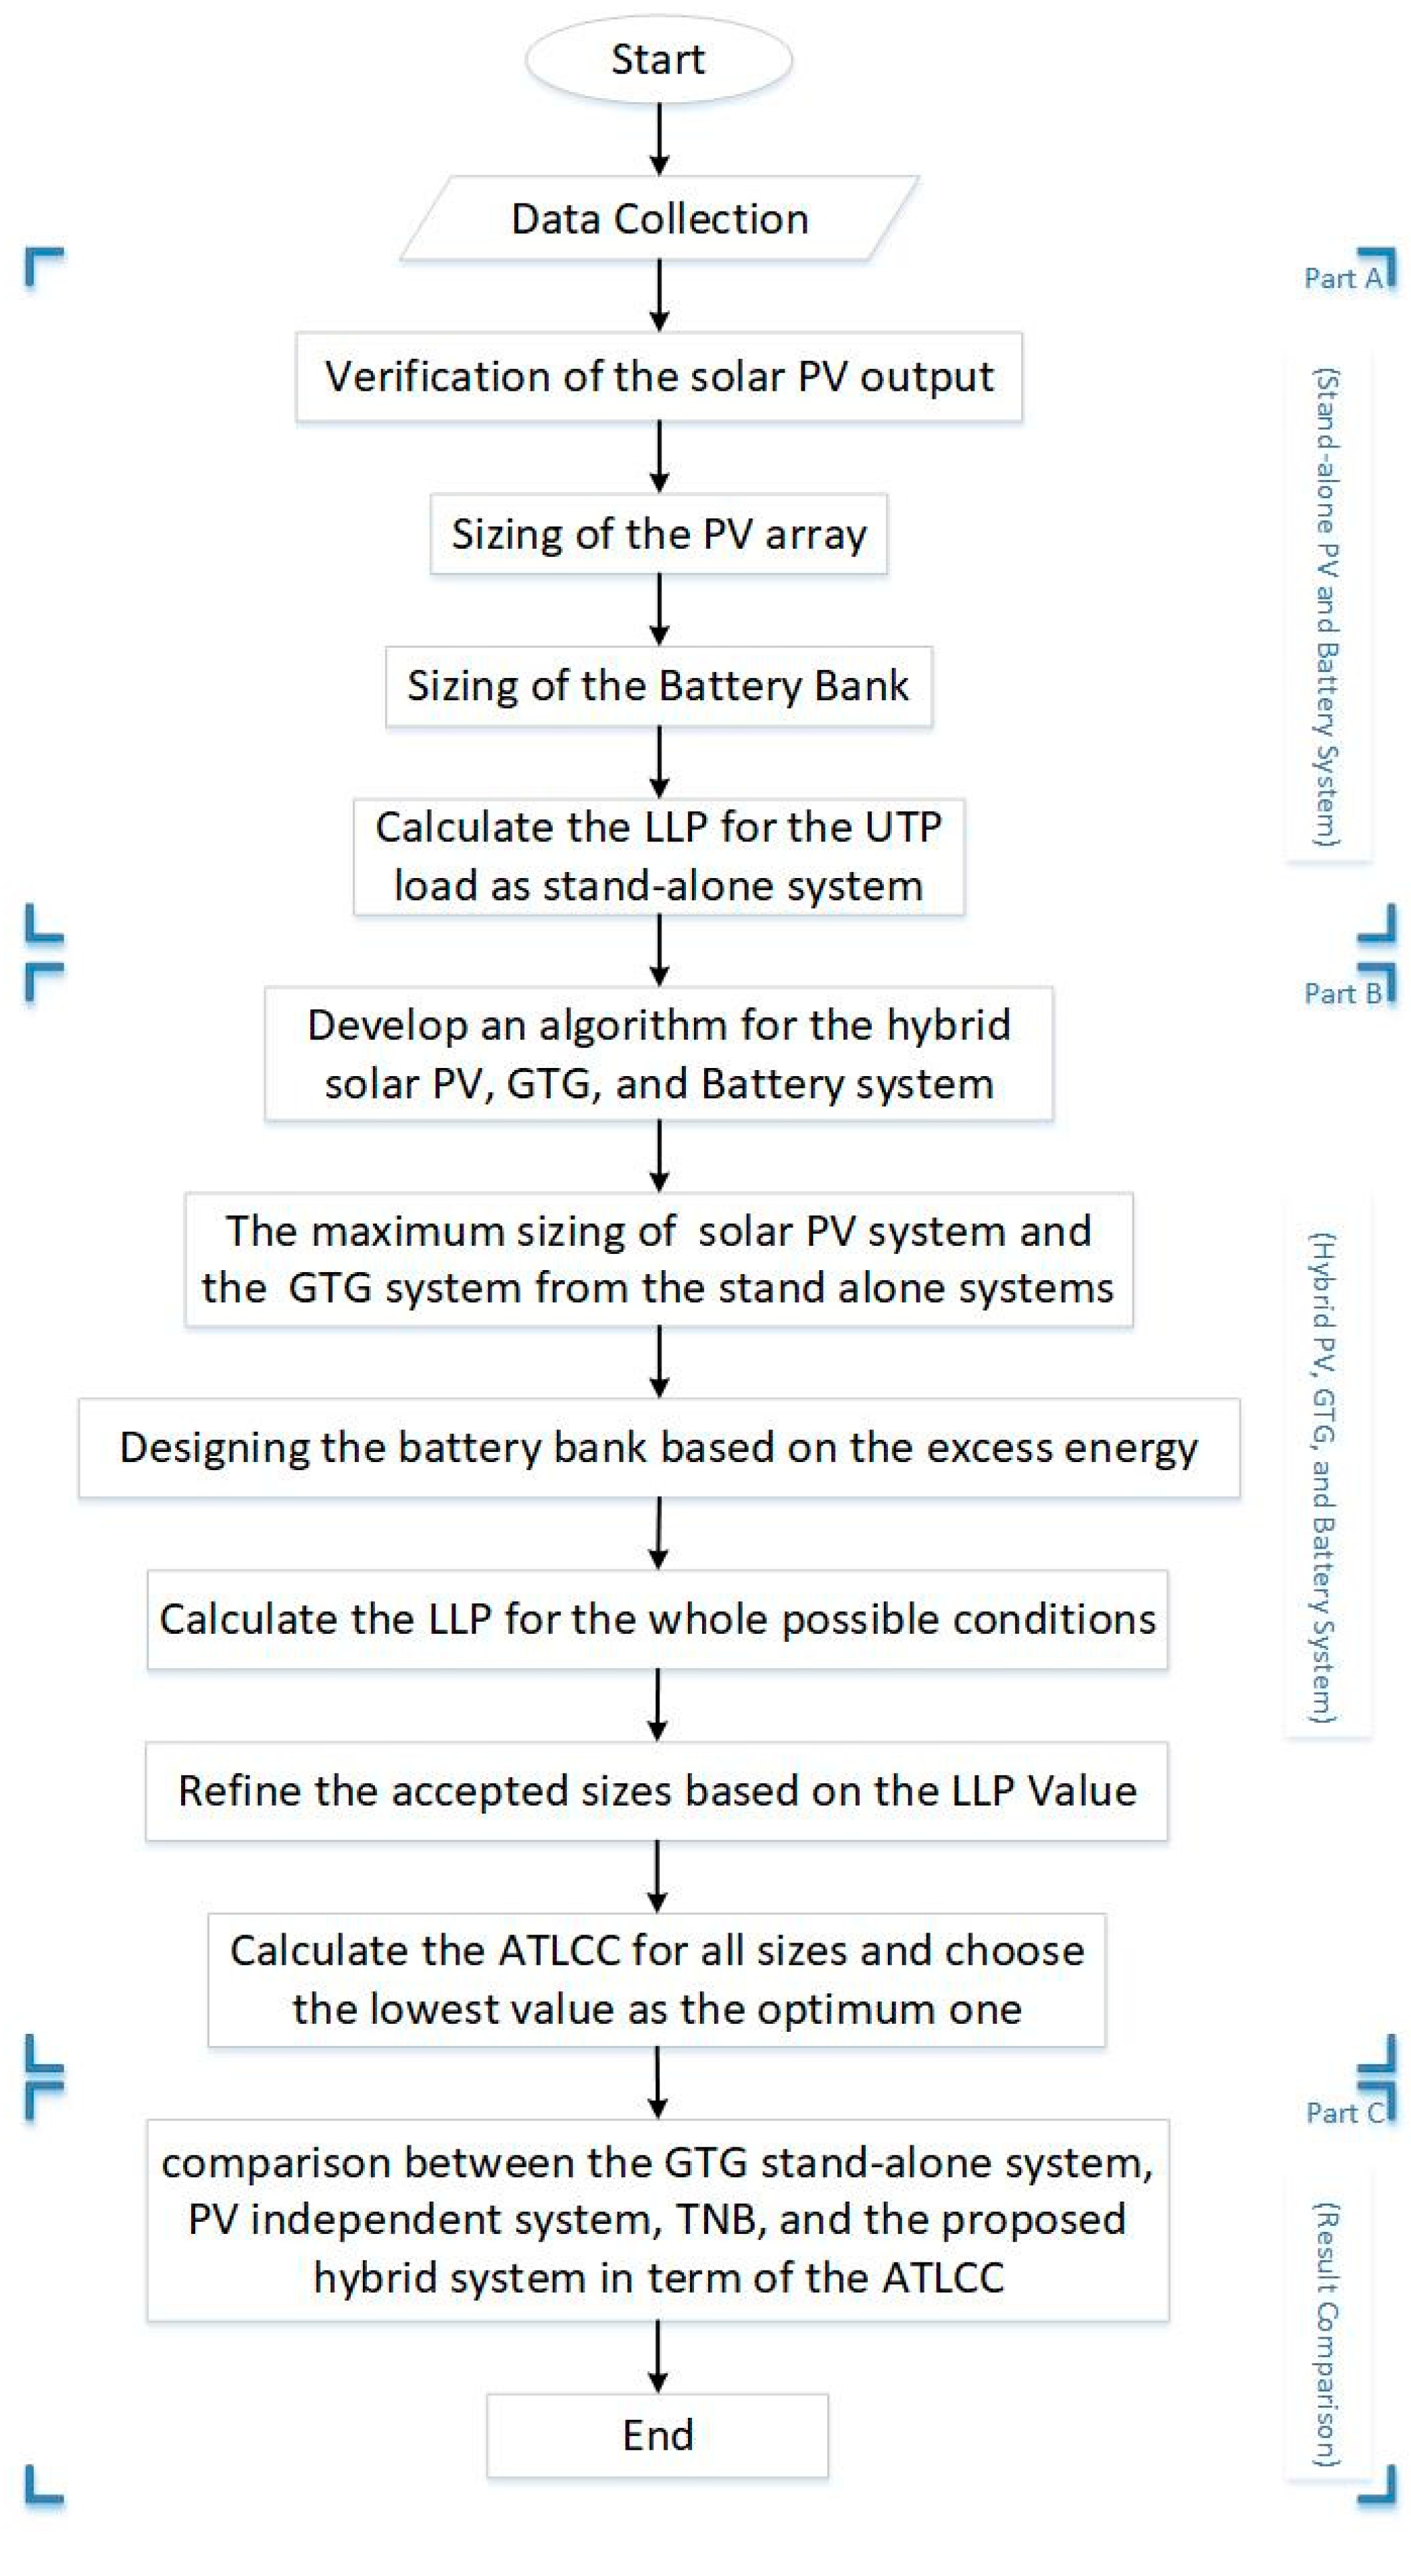
Figure 1. Methodology flowchart.
Cleantechnol 02 00016 g001
Figure 2. Hybrid photovoltaic (PV)/GTG (Gas turbine generator) system configuration.
Cleantechnol 02 00016 g002
Figure 3. Verification of the PV mathematical model.
Cleantechnol 02 00016 g003
Figure 4. Proposed algorithm: (a) data calling and system specifications, (b) the deficit energy section, (c) the excess energy section and (d) optimum sizing options with cost calculations.
Cleantechnol 02 00016 g004
Figure 5. UTP load Profile.
Cleantechnol 02 00016 g005
Figure 6. Cycle charge dispatch strategy.
Cleantechnol 02 00016 g006
Figure 7. Loss of load probability (LLP) values in different system sizes.
Cleantechnol 02 00016 g007
Figure 8. Energy production, (a) energy produced by PV array (b) energy produced GTG; (c) Battery charging and discharging energy.
Cleantechnol 02 00016 g008
Figure 9. The deficit energy for the proposed design through that particular year.
Cleantechnol 02 00016 g009
Table 1. Cost saving comparison.
Yearly (USD)Proposed SystemGTG SystemTNB System
Tariff0.0466810.075304210.05952902
Savings2,171,345.017501,167,514.0812