Process and Carbon Footprint Analyses of the Allam Cycle Power Plant Integrated with an Air Separation Unit


Abstract
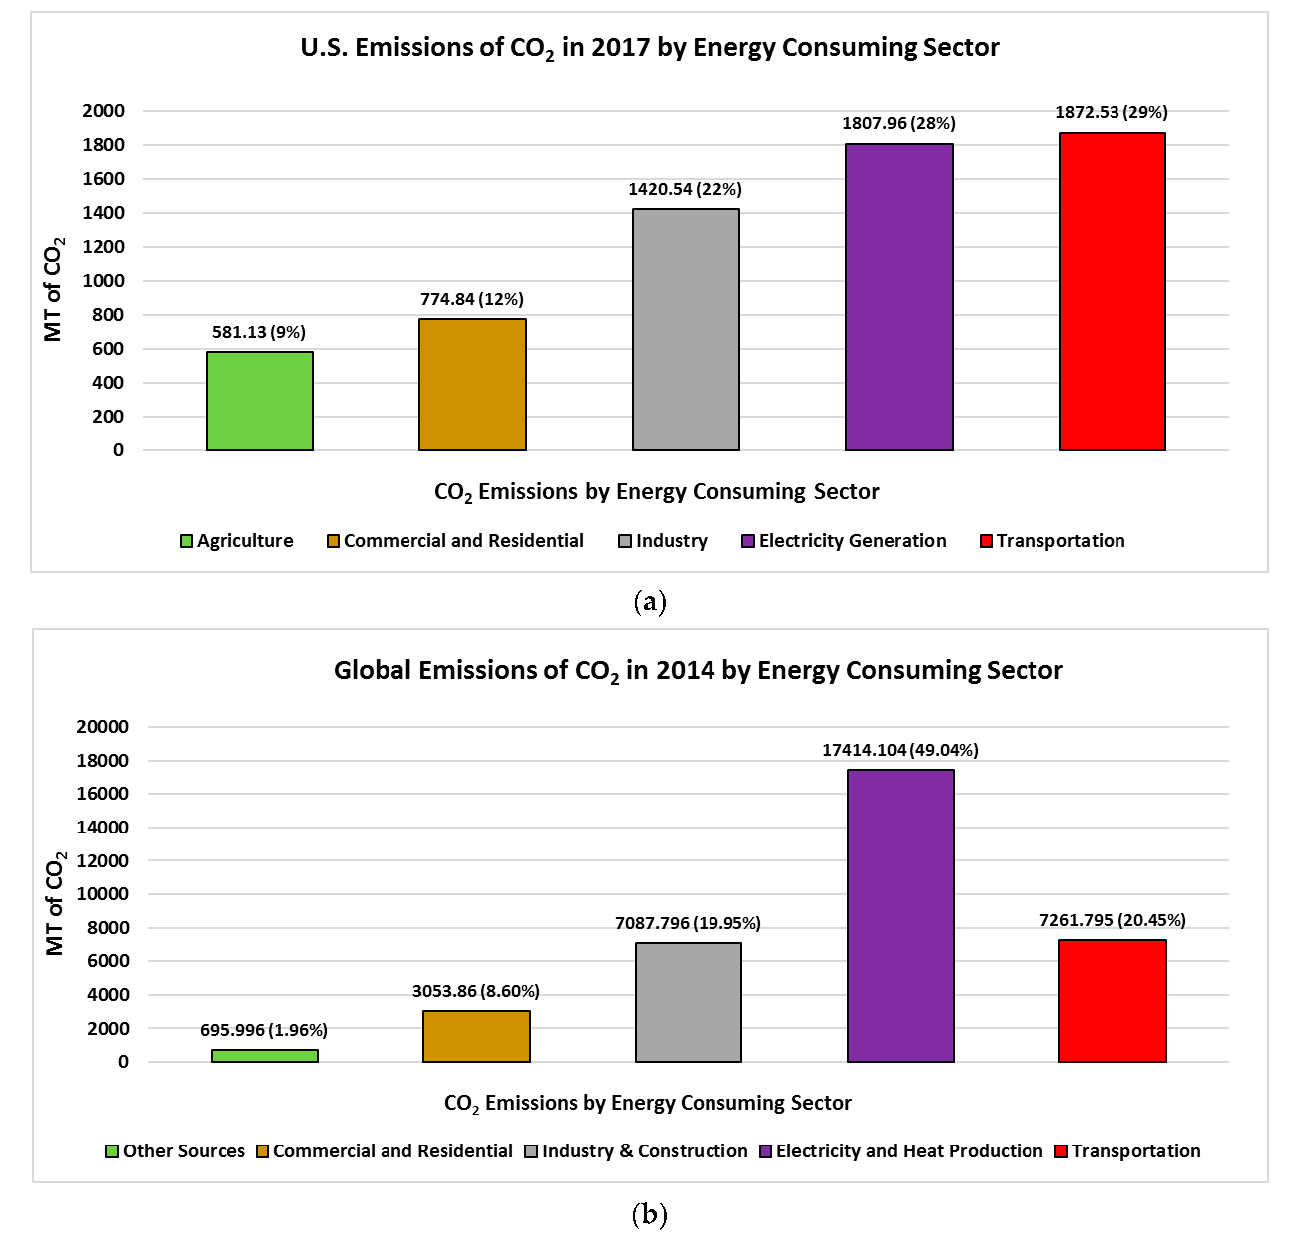
1. Introduction
2. Methodology
2.1. Process Modeling Basis
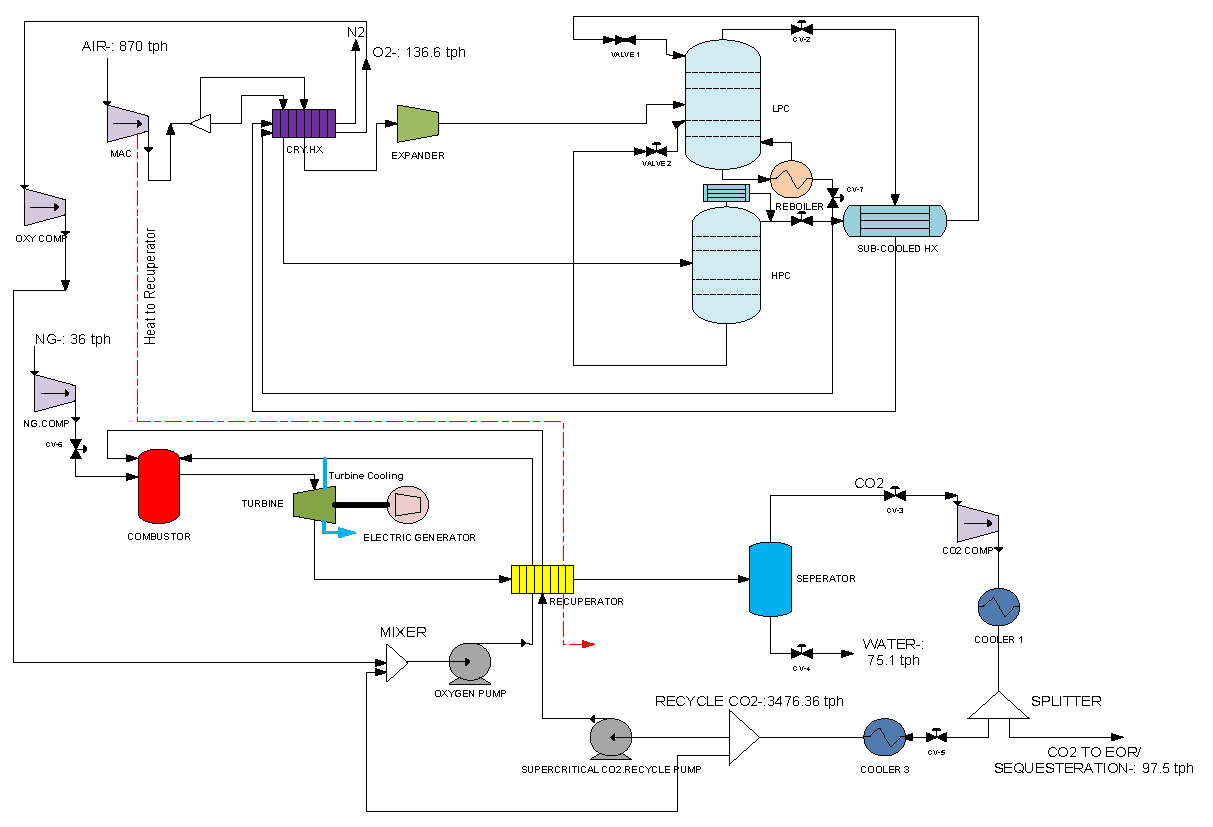
2.2. Air Separation Unit Modeling
2.3. Allam Cycle Modeling
2.4. Exergy Analysis for the Integrated Plants
2.5. Carbon Footprint Analysis
3. Results and Discussion
3.1. Exergy Analysis
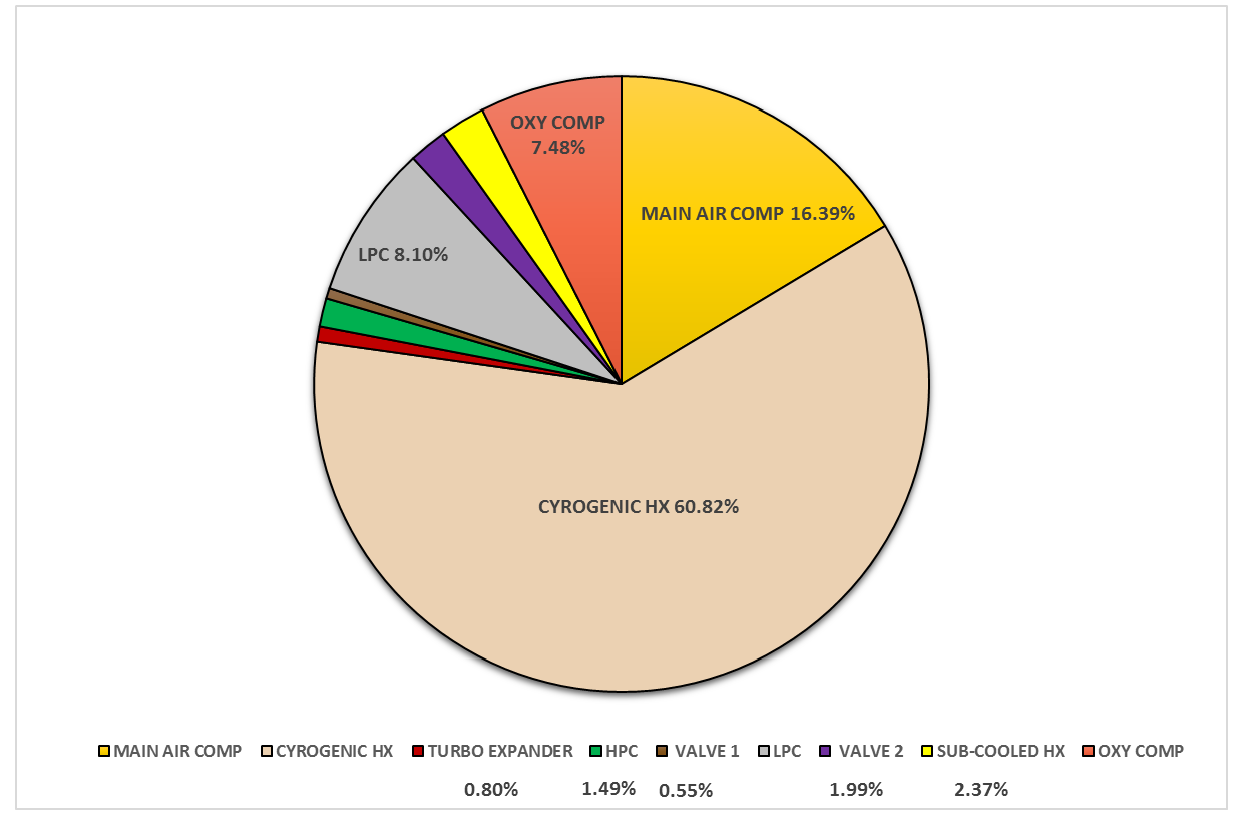
3.1.1. Exergy Analysis Results of the Air Separation Unit (ASU)
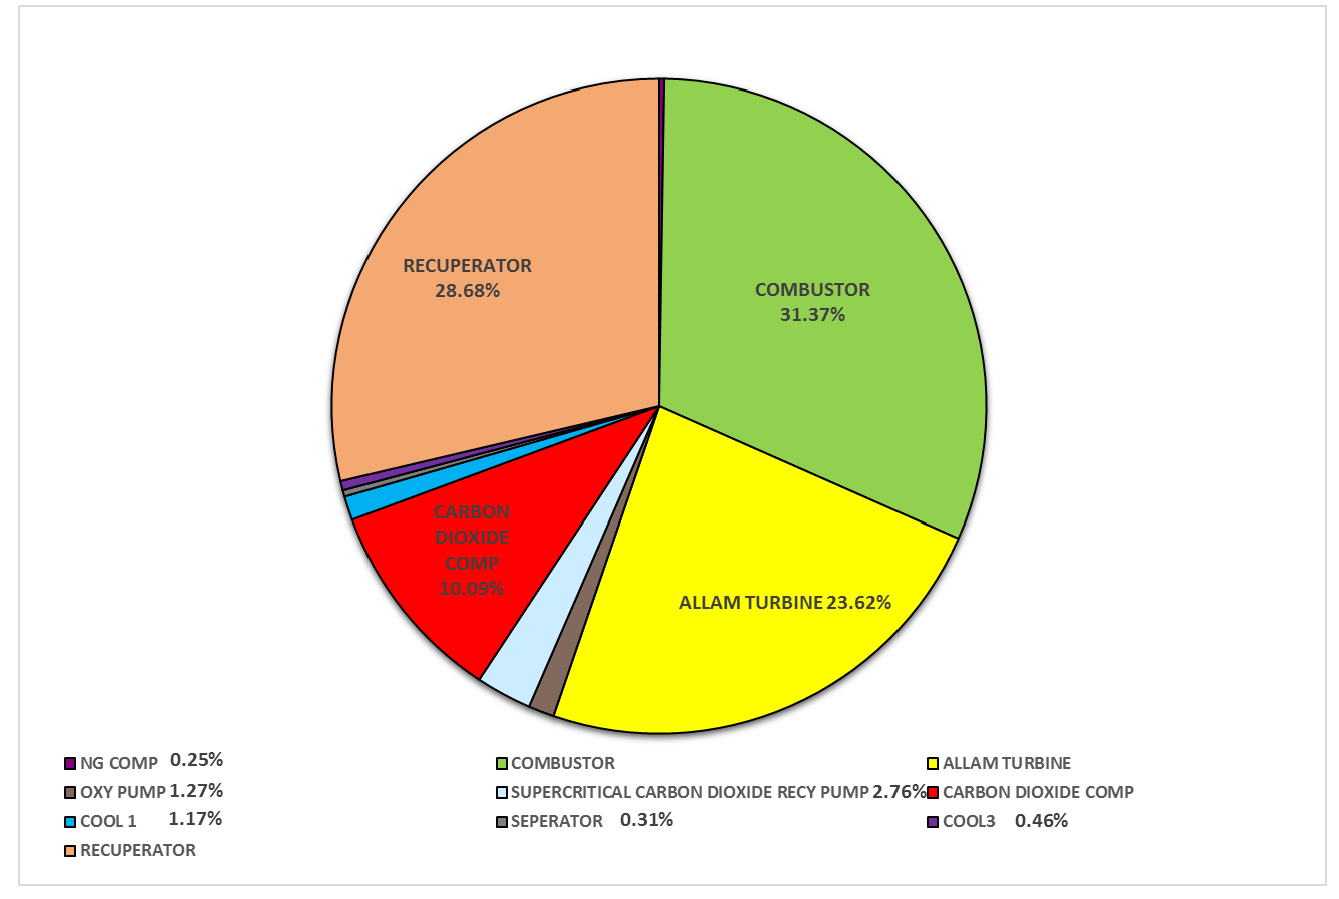
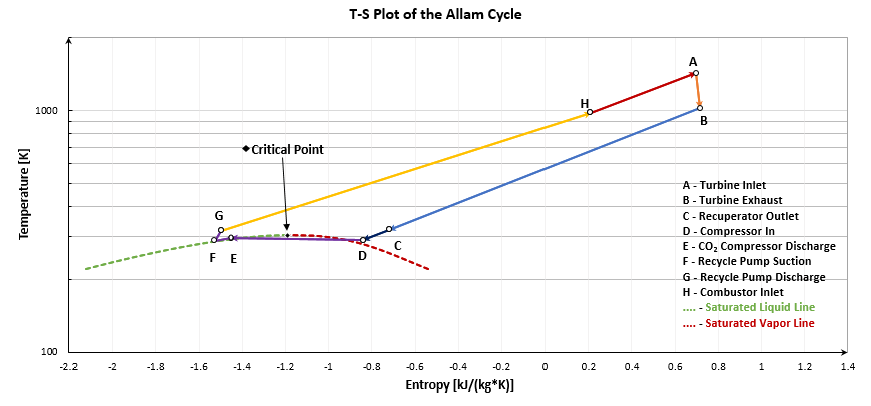
3.1.2. Exergy Analysis Results of the Allam Cycle
3.2. Sensitivity Analysis of the ASU Operating Parameters on the Allam Power Cycle
- distillate to feed ratio of the high pressure column;
- reflux ratio of the low pressure column;
- ambient air temperature; and
- ambient air pressure.
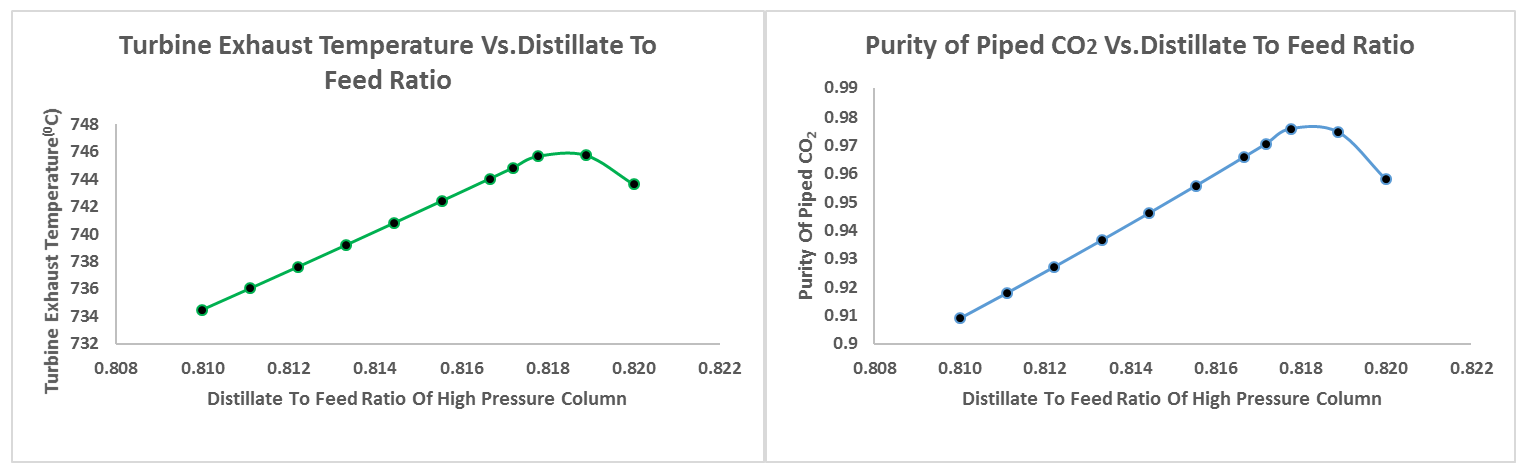
3.2.1. Effect of Varying the Distillate to Feed Ratio in the High Pressure Column (HPC)
3.2.2. Effect of Varying the Reflux Ratio of the Low Pressure Column (LPC)
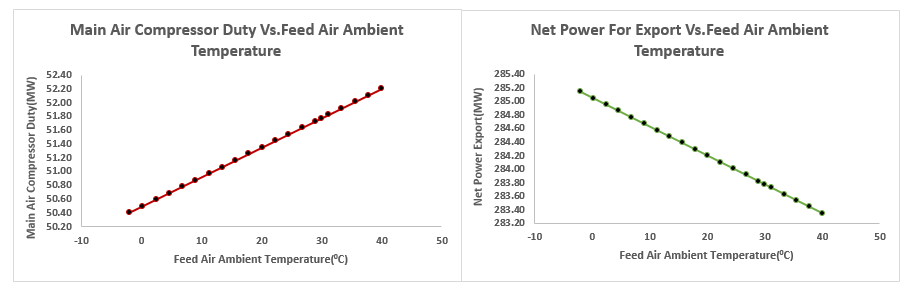
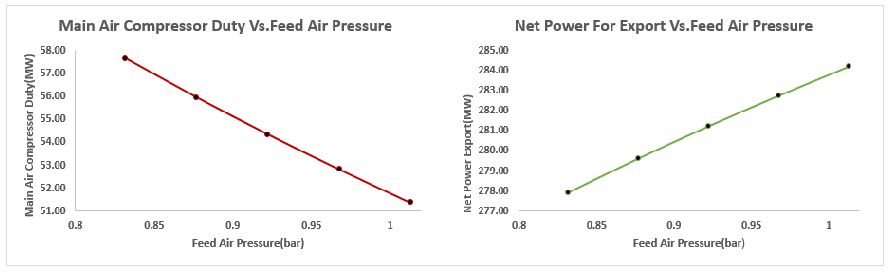
3.2.3. Effect of the Ambient Air Temperature and Pressure to the ASU Power Demand
3.3. Carbon Footprint Comparison and Impact on Global Carbon Dioxide Emission Levels
- Carbon print reduction: from 34.22 Gt/yr to 22.95 Gt/yr
- Years to reach 450 ppm level: (450 − 409.36) ppm/[(22.95 Gt/yr) × (0.127 ppm/Gt)] = 13.9 yr
- Years to reach 450 ppm level: (450 − 409.36) ppm/[(34.22 Gt/yr) × (0.127 ppm/Gt)] = 9.4 yr
4. Conclusions and Recommendations
Author Contributions
Funding
Acknowledgments
Conflicts of Interest
References
- USA Global Change Research Program. Fourth National Climate Assessment. Impacts, Risks and Adaptation in the United States; USA Global Change Research Program: Washington, DC, USA, 2018; Volume 2. [Google Scholar]
- The Intergovernmental Panel on Climate Change. Global Warming of 1.5 °C; Special Report; The Intergovernmental Panel on Climate Change: Geneva, Switzerland, 2018. [Google Scholar]
- International Energy Agency. World Energy Statistics, Database Documentation; International Energy Agency: Paris, France, 2019. [Google Scholar]
- The Intergovernmental Panel on Climate Change. Climate Change: Mitigation of Climate Change; AR 15 Contribution to the Fifth Assessment Report; The Intergovernmental Panel on Climate Change: Geneva, Switzerland, 2014. [Google Scholar]
- Sources of Greenhouse Gas Emissions. Greenhouse Gas Emission. Available online: https://www.epa.gov (accessed on 23 May 2019).
- Brown, A.; Dobrotova, Z. Renewable Energy: Markets and Prospects by Technology; International Energy Agency: Paris, France, 2011. [Google Scholar]
- Allam, R.; Palmer, M.; Brown, G.W., Jr.; Glenn, W. System and Method for High Efficiency Power Generation Using a Carbon Dioxide Circulating Working Fluid. U.S. Patent 8,596,075, 3 December 2013. [Google Scholar]
- Leung, D.Y.C.; Caramanna, G.; Maroto-Valer, M.M. An overview of current status of carbon dioxide capture and storage technologies. Renew. Sustain. Energy Rev. 2014, 39, 426–443. [Google Scholar] [CrossRef]
- Great Plains Institute. Before and after: How the FUTURE Act Reformed the 45Q Carbon Capture and Storage Tax Credit. 5 March 2018. Available online: https://www.betterenergy.org (accessed on 10 May 2019).
- Allam, R.; Martin, S.; Forrest, B.; Fetvedt, J.; Lu, X.; Freed, D.; Brown, G.W., Jr.; Sasaki, T.; Itoh, M.; Manning, J. Demonstration of the Allam Cycle: An update on the development status of a high efficiency supercritical carbon dioxide power process employing full carbon capture. Energy Procedia 2017, 114, 5948–5966. [Google Scholar] [CrossRef]
- Isles, J. Gearing up for a new supercritical CO2 power cycle system. Gas Turbine World. 2014, 44, 14–18. [Google Scholar]
- Penkuhn, M.; Tsatsaronis, G. Exergy Analysis of the Allam Cycle. In Proceedings of the 5th International Symposium-Supercritical CO2 power cycles, San Antonio, TX, USA, 28–31 March 2016. [Google Scholar]
- U.S. Department of Energy. Quadrennial Technology Review. Supercritical Carbon Dioxide Brayton Cycle, Technology Assessments; U.S. Department of Energy: Washington, DC, USA, 2015; Chapter 4.
- Xu, Z.; Zhao, J.; Chen, X.; Shao, Z.; Qian, J.; Zhu, L.; Zhou, Z.; Qin, H. Automatic load change system of cryogenic air separation process. Sep. Purif. Technol. 2011, 81, 451–465. [Google Scholar] [CrossRef]
- Huang, R.; Zavala, V.M.; Biegler, L.T. Advanced step nonlinear model predictive control for air separation units. J. Process Control 2009, 19, 678–685. [Google Scholar] [CrossRef]
- Allam, R.J. Cryogenic Air Separation Method for Producing Oxygen at High Pressures. U.S. Patent 2018/0073804, 15 March 2018. [Google Scholar]
- Ertesvag, I.S. Sensitivity of chemical exergy for atmospheric gases and gaseous fuels to variations in ambient conditions. Energy Convers. Manag. 2007, 48, 1983–1995. [Google Scholar] [CrossRef]
- Araujo, A.B.; Vasconcelos, R.P. Exergetic analysis of distillation processes—A case study. Energy 2012, 32, 392–399. [Google Scholar] [CrossRef]
- Olaleye, A.K.; Wang, M.; Kelsall, G. Steady State Simulation and Exergy Analysis of Supercritical Coal-fired Power Plant with CO2 capture. Fuel 2015, 151, 57–72. [Google Scholar] [CrossRef]
- Kaushik, S.C.; Reddy, S.V.; Tyagi, S.K. Energy and exergy analysis of thermal power plants: A review. Renew. Sustain. Energy Rev. 2011, 15, 1857–1872. [Google Scholar] [CrossRef]
- National Oceanic and Atmospheric Administration (NOAA). Local Climatological Data Annual Summary with Comparative Data; KIAH: Houston, TX, USA, 2016. Available online: https://www.weather.gov (accessed on 15 May 2019).
- Raibhole, V.N.; Sapali, S.N. Simulation and Parametric Analysis of Cryogenic Oxygen Plant for Biomass Gasification. Mech. Eng. Res. 2012, 2, 97–107. [Google Scholar] [CrossRef]
- Li, M.L.; Lee, H.Y.; Lee, M.W.; Chien, I.L. Simulation and Formula Regression of an Air Separation Unit in China Steel Corporation; ADCONP: Sandton, South Africa, 2014; pp. 213–218. [Google Scholar]
- Singh, O.K. Combustion simulation and emission control in natural gas fueled combustor of gas turbine. J. Therm. Anal. Calorim. 2016, 125, 949–957. [Google Scholar] [CrossRef]
- Nag, P.K. Power Plant Engineering; McGraw-Hill: New York, NY, USA, 2007. [Google Scholar]
- Scaccabarozzi, R.; Gatti, M.; Martelli, E. Thermodynamic analysis and numerical optimization of the NET Power oxy-combustion cycle. Appl. Energy 2016, 178, 505–526. [Google Scholar] [CrossRef]
- White, C.; Weiland, N. Preliminary cost and performance results for a natural gas fired direct sCO2 power plant. In Proceedings of the 6th International Supercritical CO2 Power Cycles Symposium, Pittsburgh, PA, USA, 27–29 March 2018. [Google Scholar]
- Allam, R.; Palmer, M.; Brown, G.W., Jr.; Fetvedt, J.; Freed, D.; Nomoto, H.; Itoh, M.; Okita, N.; Jones, C., Jr. High efficiency and low cost of electricity generation from fossil fuels while eliminating atmospheric emissions, including carbon dioxide. Energy Procedia 2013, 37, 1135–1149. [Google Scholar] [CrossRef]
- Larralde, E. Selection of Gas Compressors: Part 1; Elsevier: Amsterdam, The Netherlands, 2011. [Google Scholar]
- Mitchell, C.; Avagyan, V.; Chalmers, H.; Lcuquiaud, M. An initial assessment of the value of the Allam Cycle power plants with liquid oxygen storage in future GB electricity system. Int. J. Greenh. Gas Control 2019, 87, 1–18. [Google Scholar] [CrossRef]
- Kotas, T.J. The Exergy Method of Thermal Plant Analysis, 2nd ed.; Krieger Publishing Company: Malabar, FL, USA, 1995. [Google Scholar]
- Tsatsaronis, G. Thermoeconomic analysis and optimization of energy systems. Prog. Energy Combust. Sci. 1993, 19, 227–257. [Google Scholar] [CrossRef]
- Ahrendts, J. Reference States. Energy 1980, 5, 667–677. [Google Scholar] [CrossRef]
- Tsatsarnois, G. Definitions and nomenclature in exergy analysis and exergoeconomics. Energy 2007, 32, 249–253. [Google Scholar] [CrossRef]
- Van der Ham, L.V.; Kjelstrup, S. Exergy analysis of two cryogenic air separation processes. Energy 2010, 35, 4731–4739. [Google Scholar] [CrossRef]
- Sapali, S.N.; Raibhole, V.N. Exergy Analysis of Cryogenic Air Separation Unit Integrated with Biomass Gasifier. In Proceedings of the World Congress on Engineering and Computer Science WCECS, San Francisco, CA, USA, 23–25 October 2013; Volume 2. [Google Scholar]
- Carbon Footprint of Electricity Generation Parliamentary Office of Science and Technology. Number 268. October 2006. Available online: https://www.parliament.uk/post (accessed on 20 May 2019).
- White, C.; Weiland, N.; Shelton, W.; Gray, D. Preliminary Baseline for Direct Fired sCO2 cycles. In Proceedings of the 5th International Supercritical CO2 Power Cycles Symposium, San Antonio, TX, USA, 29–31 March 2016. [Google Scholar]
- CB & I/Stone & Webster, Inc. Assessment of Natural Gas Combined Cycle Plants for Carbon Dioxide Capture and Storage in a Gas Dominated Electricity Market; Final Project Report; CB & I/Stone & Webster, Inc.: Stoughton, MA, USA, 2014. [Google Scholar]
- National Energy Technology Laboratory. Life Cycle Analysis: Integrated Gasification Combined Cycle (IGCC) Power Plant; DOE/NETL-403/110209; National Energy Technology Laboratory: Pittsburgh, PA, USA, 2010. [Google Scholar]
- Zhu, A.; Chen, Y.; Wu, J.; Zhang, S.; Zheng, S. A modified Allam Cycle without compressors realizing efficient power generation with peak load shifting and CO2 capture. Energy 2019, 174, 478–487. [Google Scholar] [CrossRef]


| Site Conditions | Air Composition (Mass/Mass) | Natural Gas Composition (Mole/Mole) |
|---|---|---|
| Site: Houston, TX | Nitrogen (N2): 0.7809 | Nitrogen (N2): 0.002 |
| Ambient Pressure: 1.013 bar | Oxygen (O2): 0.2095 | Methane (CH4): 0.97 |
| Dry Bulb Temperature: 21.89 °C | Argon (Ar): 0.0093 | Ethane (C2H6): 0.015 |
| Wet Bulb Temperature: 18.28 °C | Carbon Dioxide (CO2): 0.003 | Propane (C3H8): 0.013 |
| Relative Humidity: 64% | Pressure: 1.013 bar | N-Butane (C4H10): 0.004 |
| CW Temperature: 15.6 °C | Temperature: 30 °C | Carbon Dioxide (CO2): 0.010 |
| CW Pressure: 3.0 bar | Flow Rate: 870 tph | Pressure: 30 bar |
| Temperature: 38 °C | ||
| LHV: 47457 kJ/kg | ||
| HHV: 52581 kJ/kg | ||
| Flow Rate: 36 tph |
| Column Parameters | HPC | LPC |
|---|---|---|
| Number of Stages | 39 | 55 |
| Feed Temperature (°C) | −178 | −192 |
| Reflux Ratio | 0.196 | 0.72 |
| Condenser Temperature (°C) | −176 | −192.8 |
| Condenser Pressure (bar) | 5.8 | 1.2 |
| Distillate Rate (kmol/h) | 22179.5 | 25891.8 |
| Reboiler Temperature (°C) | −173.35 | −181.5 |
| Bottom Rate (kmol/h) | 4961.34 | 4264.65 |
| Plant Performance Parameters | ASU with O2 Compressor | ASU with O2 Pump |
|---|---|---|
| Net Electric Power Output (MW) | 284 | 305.4 |
| Plant Thermal Efficiency (%) | 59.8 | 64.3 |
| Net Specific Work (kJ/kg) | 307 | 330.5 |
| Power Consumption in ASU (MW) | 71.3 | 52.2 |
| ASU Specific Power Demand (kW/scmh) | 0.5 | 0.4 |
| Pump/Comp. Power Consumption (MW) | 19.5 | 0.4 |
| Component | Exergy Efficiency (%) | Exergy Efficiency (%) |
|---|---|---|
| This Work | Sapali et al., 2013 | |
| Main Air Compressor | 70.6 | 64.4 |
| Cryogenic Heat Exchanger | 57.7 | 56.4 |
| Turbo Expander | 59.9 | 50.2 |
| High Pressure Column | 44.9 | 50.2 |
| Joule Thompson Valve 1 | 98.0 | NA |
| Low Pressure Column | 79.8 | 54.0 |
| Joule Thompson Valve 2 | 98.4 | NA |
| Sub-Cooled Heat Exchanger | 69.1 | 88.2 |
| Oxygen Compressor | 65.6 | NA |
| Component | Exergy Efficiency (%) | Exergy Efficiency (%) |
|---|---|---|
| This Work | Penkuhn et al., 2016 | |
| Natural Gas Compressor | 89.7 | 85.7 |
| Combustor | 95.2 | 78.3 |
| Allam Turbine | 91.0 | 92.8 |
| Oxygen Pump | 71.3 | 50.1 |
| Supercritical CO2 Pump | 74.7 | 68.2 |
| CO2 Compressor | 60.9 | 85.5 |
| Cooler 1 | 23.3 | NA |
| Separator | 99.5 | 89.6 |
| Cooler 3 | 14.0 | 22.2 |
| Recuperator | 86.3 | 96.8 |
| Comparison Indicators | IGCC * | NGCC * | Recompression sCO2 Brayton Cycle | Allam Cycle | ||
|---|---|---|---|---|---|---|
| With CC * | Without CC * | With CC * | Without CC * | Without CC | ||
| Thermal Efficiency (%) | 38.6 | 44.2 | 47.7 | 53.8 *** | 52.1 | 59.8 |
| Carbon Capture (%) | 90.1 | 0 | 90.7 | 0 | 0 | 100 |
| Carbon Footprint (gCO2/kWh) | 109.7 | 968 | 39 | 373 | 385.3 | 0 ** |
| Cycle | Brayton + Rankine | Brayton | Brayton | |||
© 2019 by the authors. Licensee MDPI, Basel, Switzerland. This article is an open access article distributed under the terms and conditions of the Creative Commons Attribution (CC BY) license (http://creativecommons.org/licenses/by/4.0/).
Share and Cite
Fernandes, D.; Wang, S.; Xu, Q.; Buss, R.; Chen, D. Process and Carbon Footprint Analyses of the Allam Cycle Power Plant Integrated with an Air Separation Unit. Clean Technol. 2019, 1, 325-340. https://doi.org/10.3390/cleantechnol1010022
Fernandes D, Wang S, Xu Q, Buss R, Chen D. Process and Carbon Footprint Analyses of the Allam Cycle Power Plant Integrated with an Air Separation Unit. Clean Technologies. 2019; 1(1):325-340. https://doi.org/10.3390/cleantechnol1010022
Chicago/Turabian StyleFernandes, Dan, Song Wang, Qiang Xu, Russel Buss, and Daniel Chen. 2019. "Process and Carbon Footprint Analyses of the Allam Cycle Power Plant Integrated with an Air Separation Unit" Clean Technologies 1, no. 1: 325-340. https://doi.org/10.3390/cleantechnol1010022
APA StyleFernandes, D., Wang, S., Xu, Q., Buss, R., & Chen, D. (2019). Process and Carbon Footprint Analyses of the Allam Cycle Power Plant Integrated with an Air Separation Unit. Clean Technologies, 1(1), 325-340. https://doi.org/10.3390/cleantechnol1010022