Using a Reference Color Plate to Correct Smartphone-Derived Soil Color Measurements with Different Smartphones Under Different Lighting Conditions
Abstract
1. Introduction
2. Materials and Methods
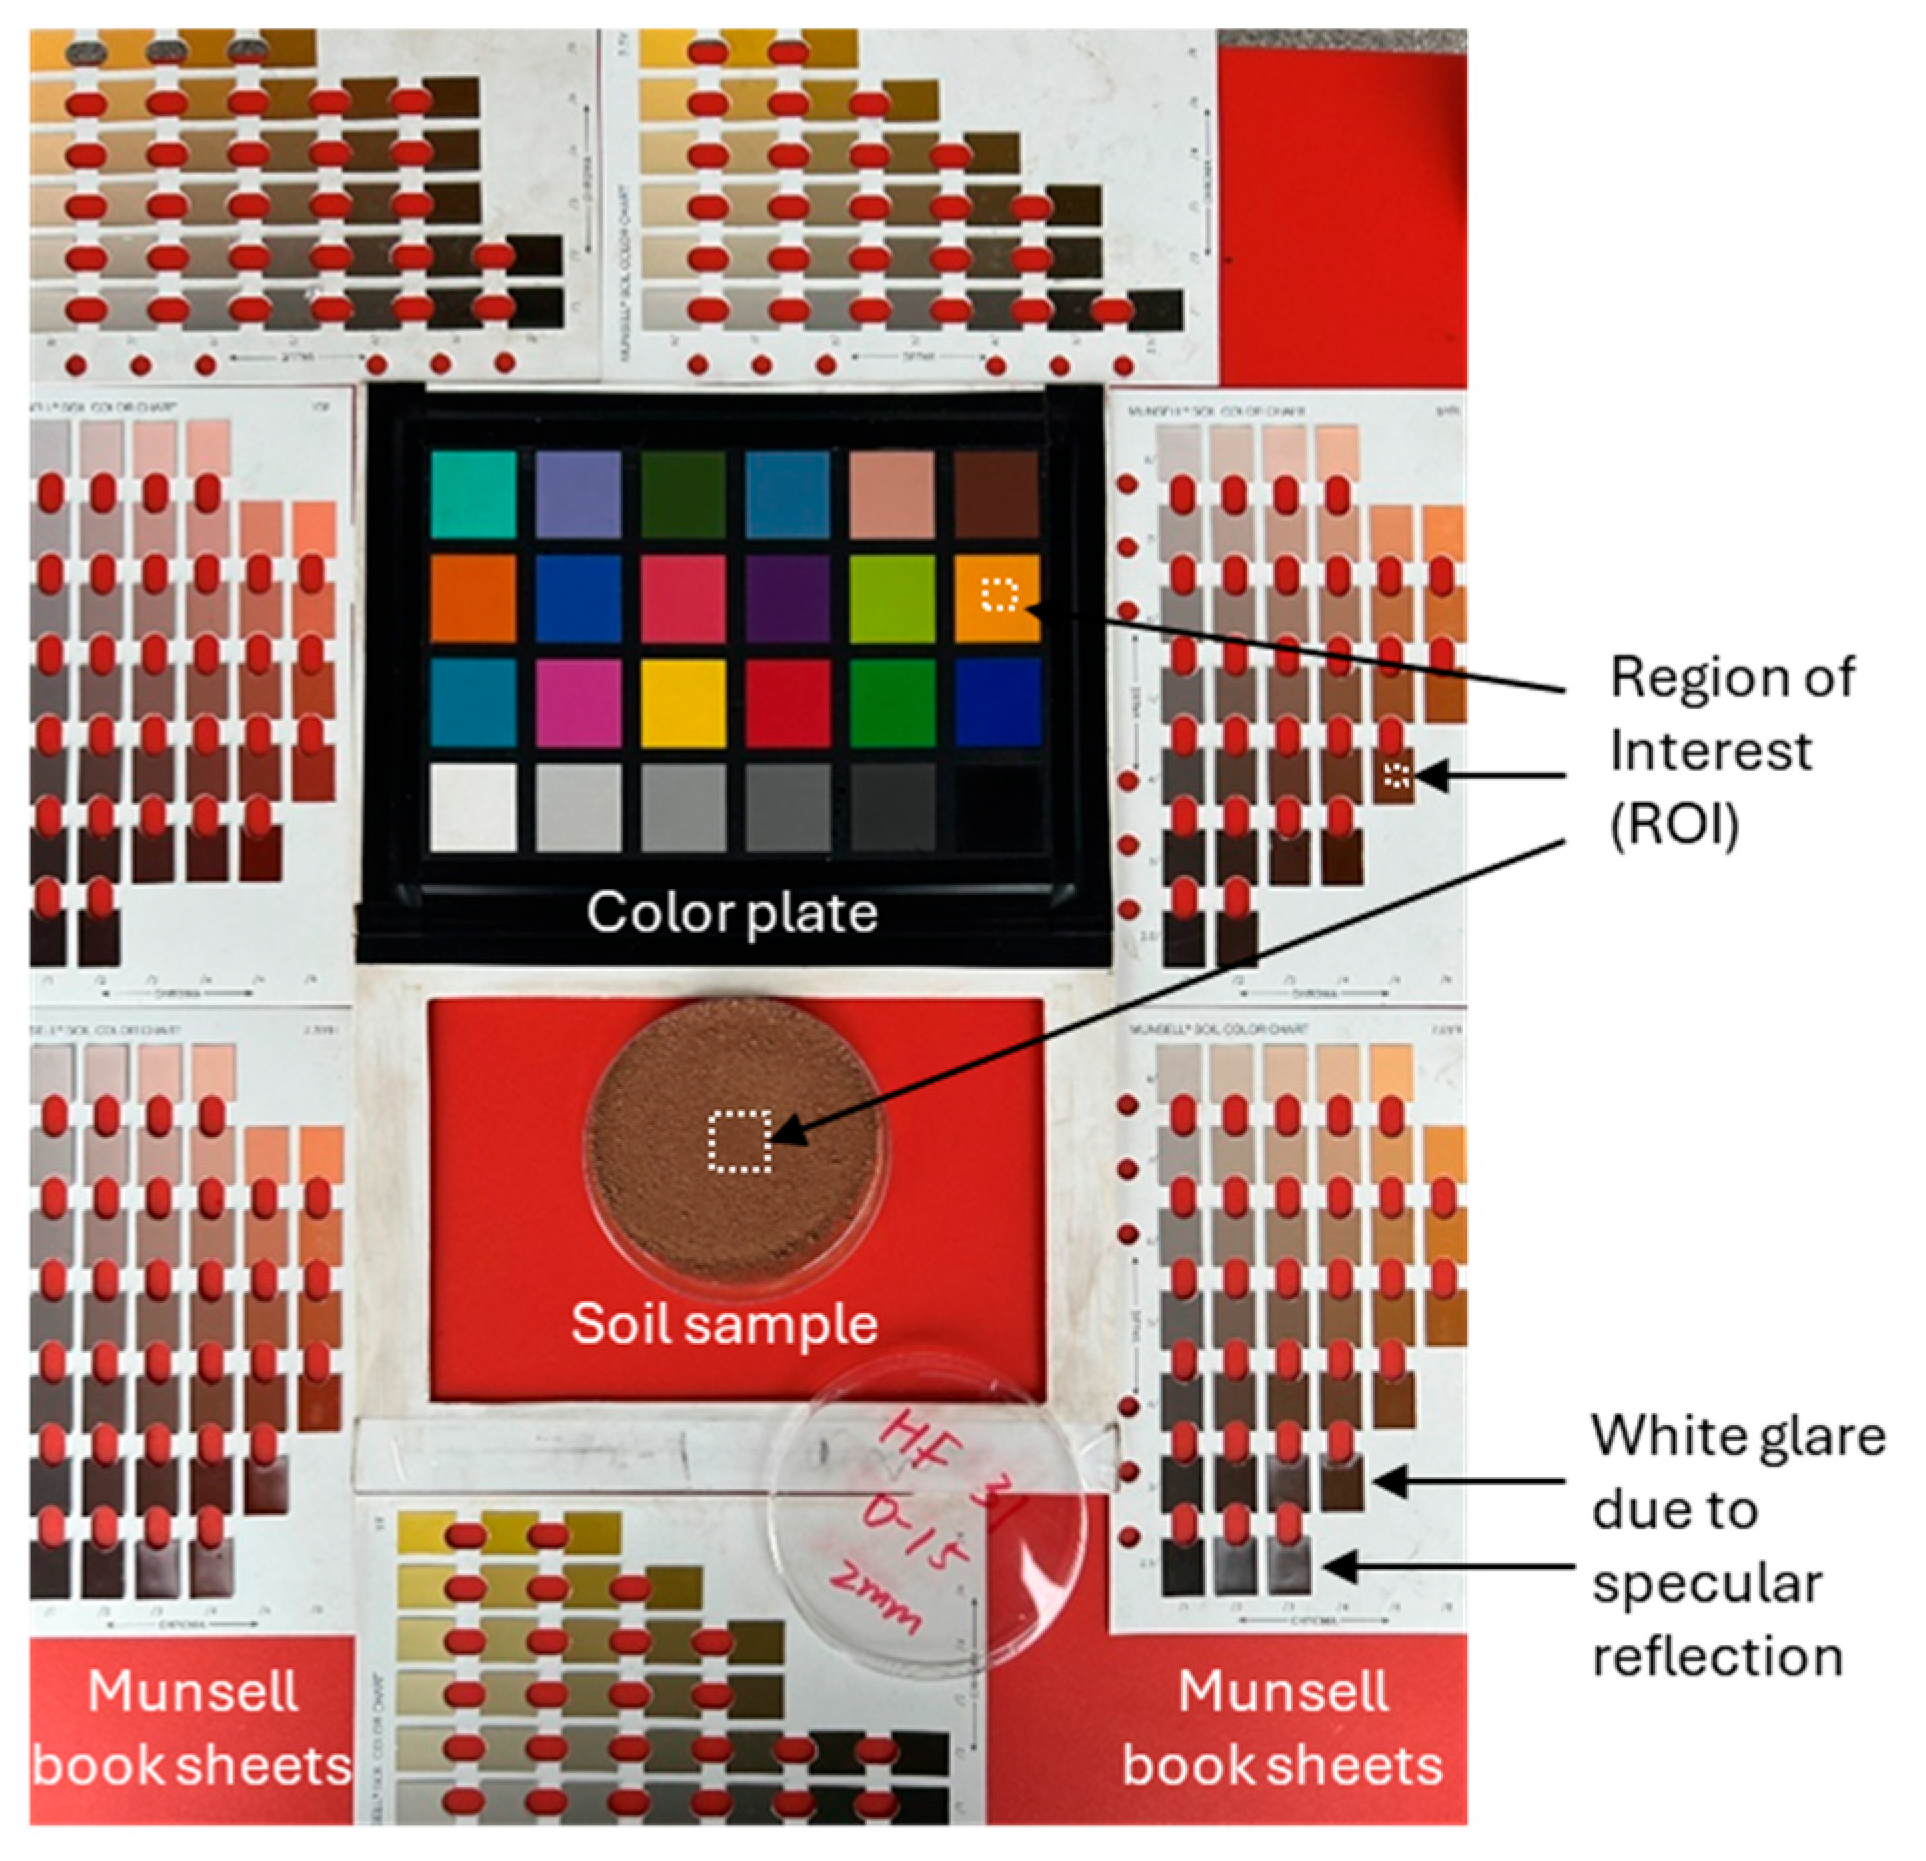
2.1. Measuring Objects
2.2. Reference Color Values Measured with FieldSpec 4
2.3. Image Acquisition
2.4. Image Processing and Color Calibration
2.5. Precision and Accuracy Assessment for the Uncalibrated and Calibrated Data
3. Results
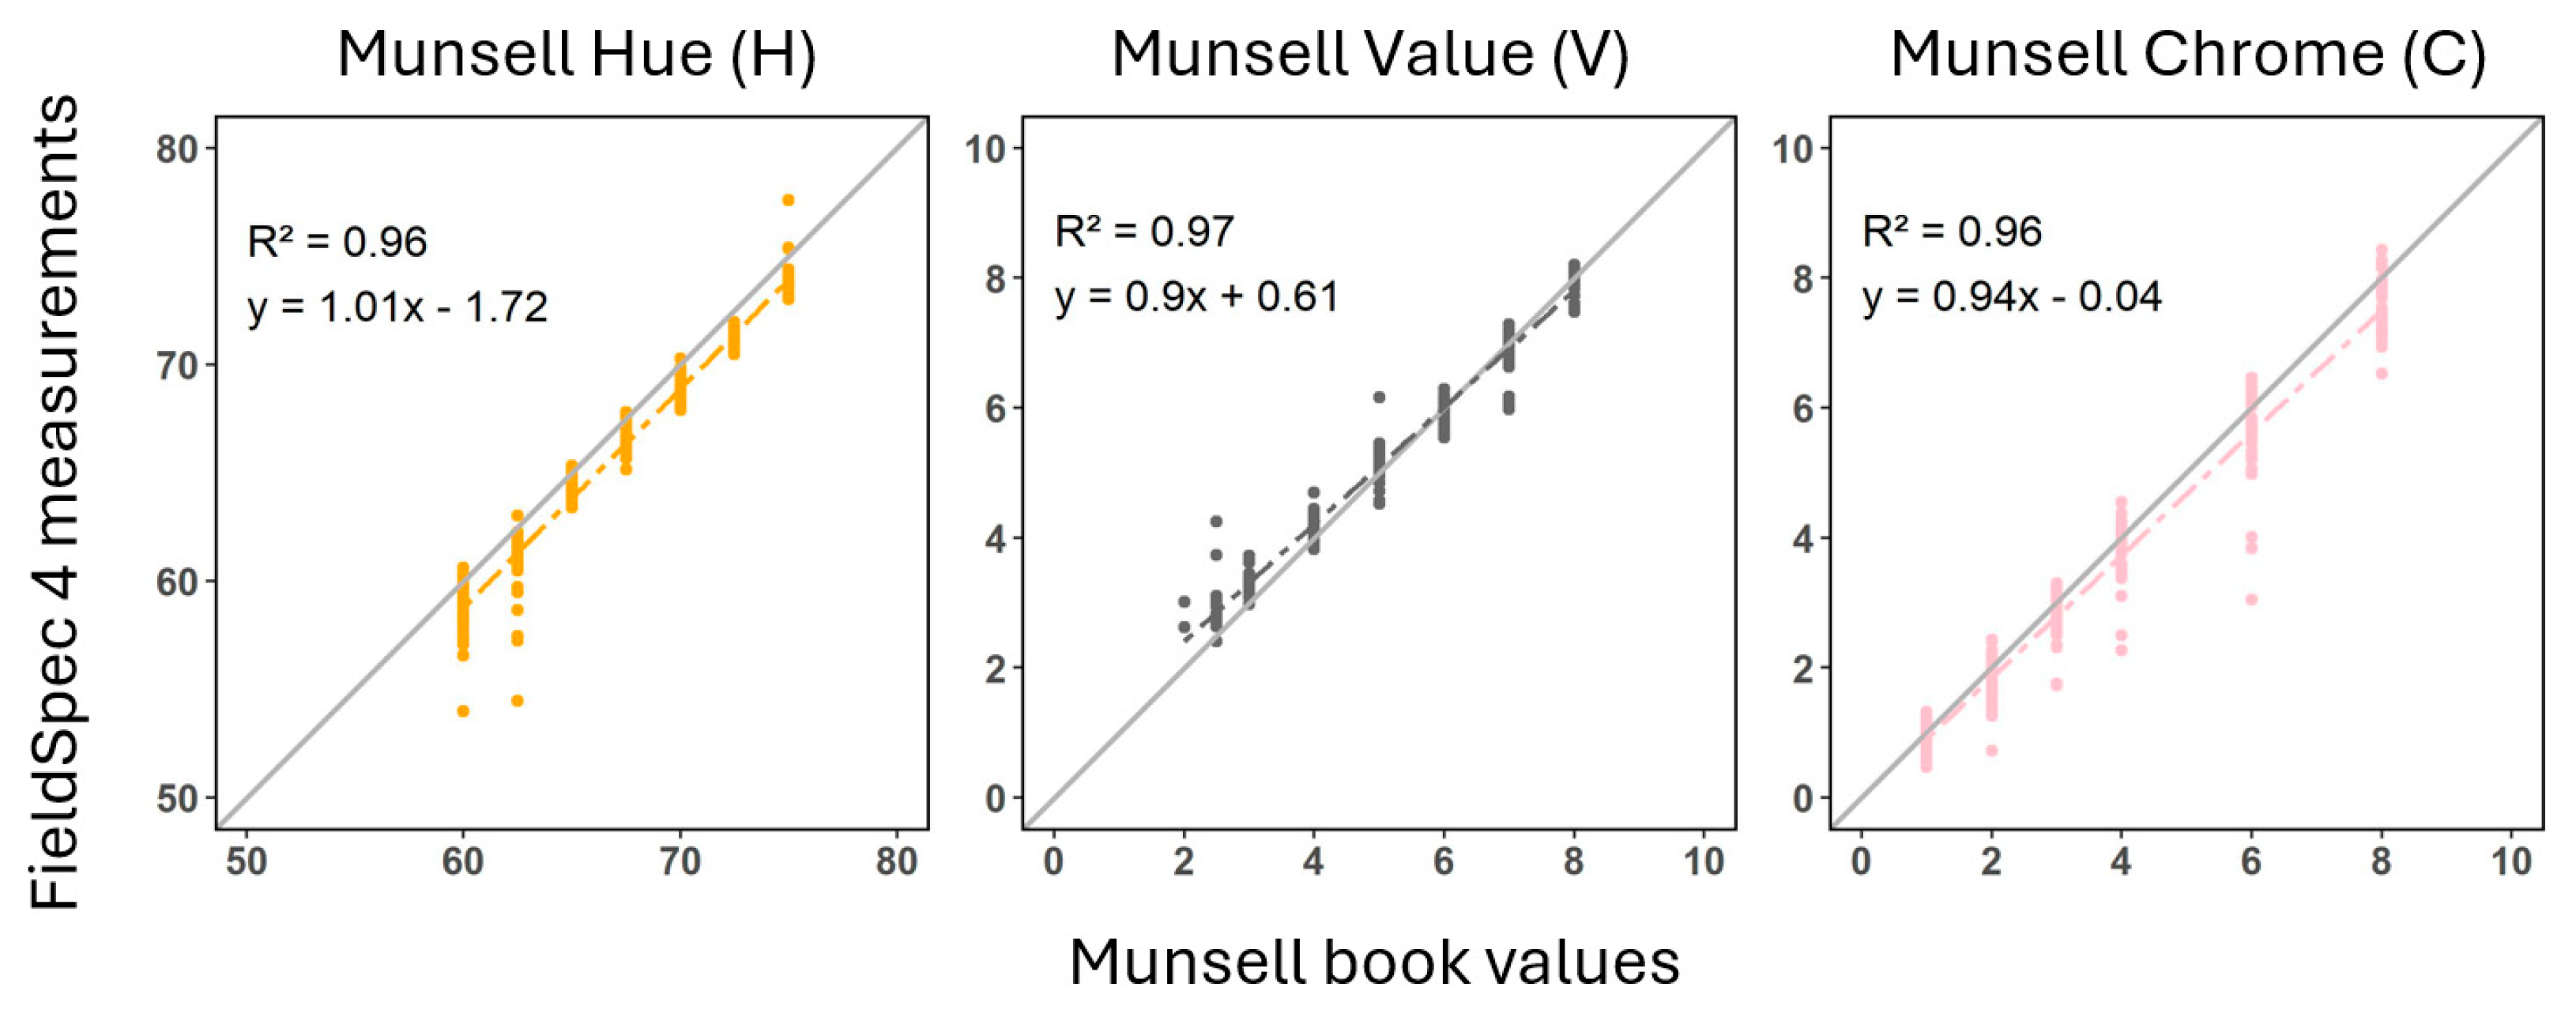
3.1. The FieldSpec 4 Measurements
3.2. The Color Plate Squares
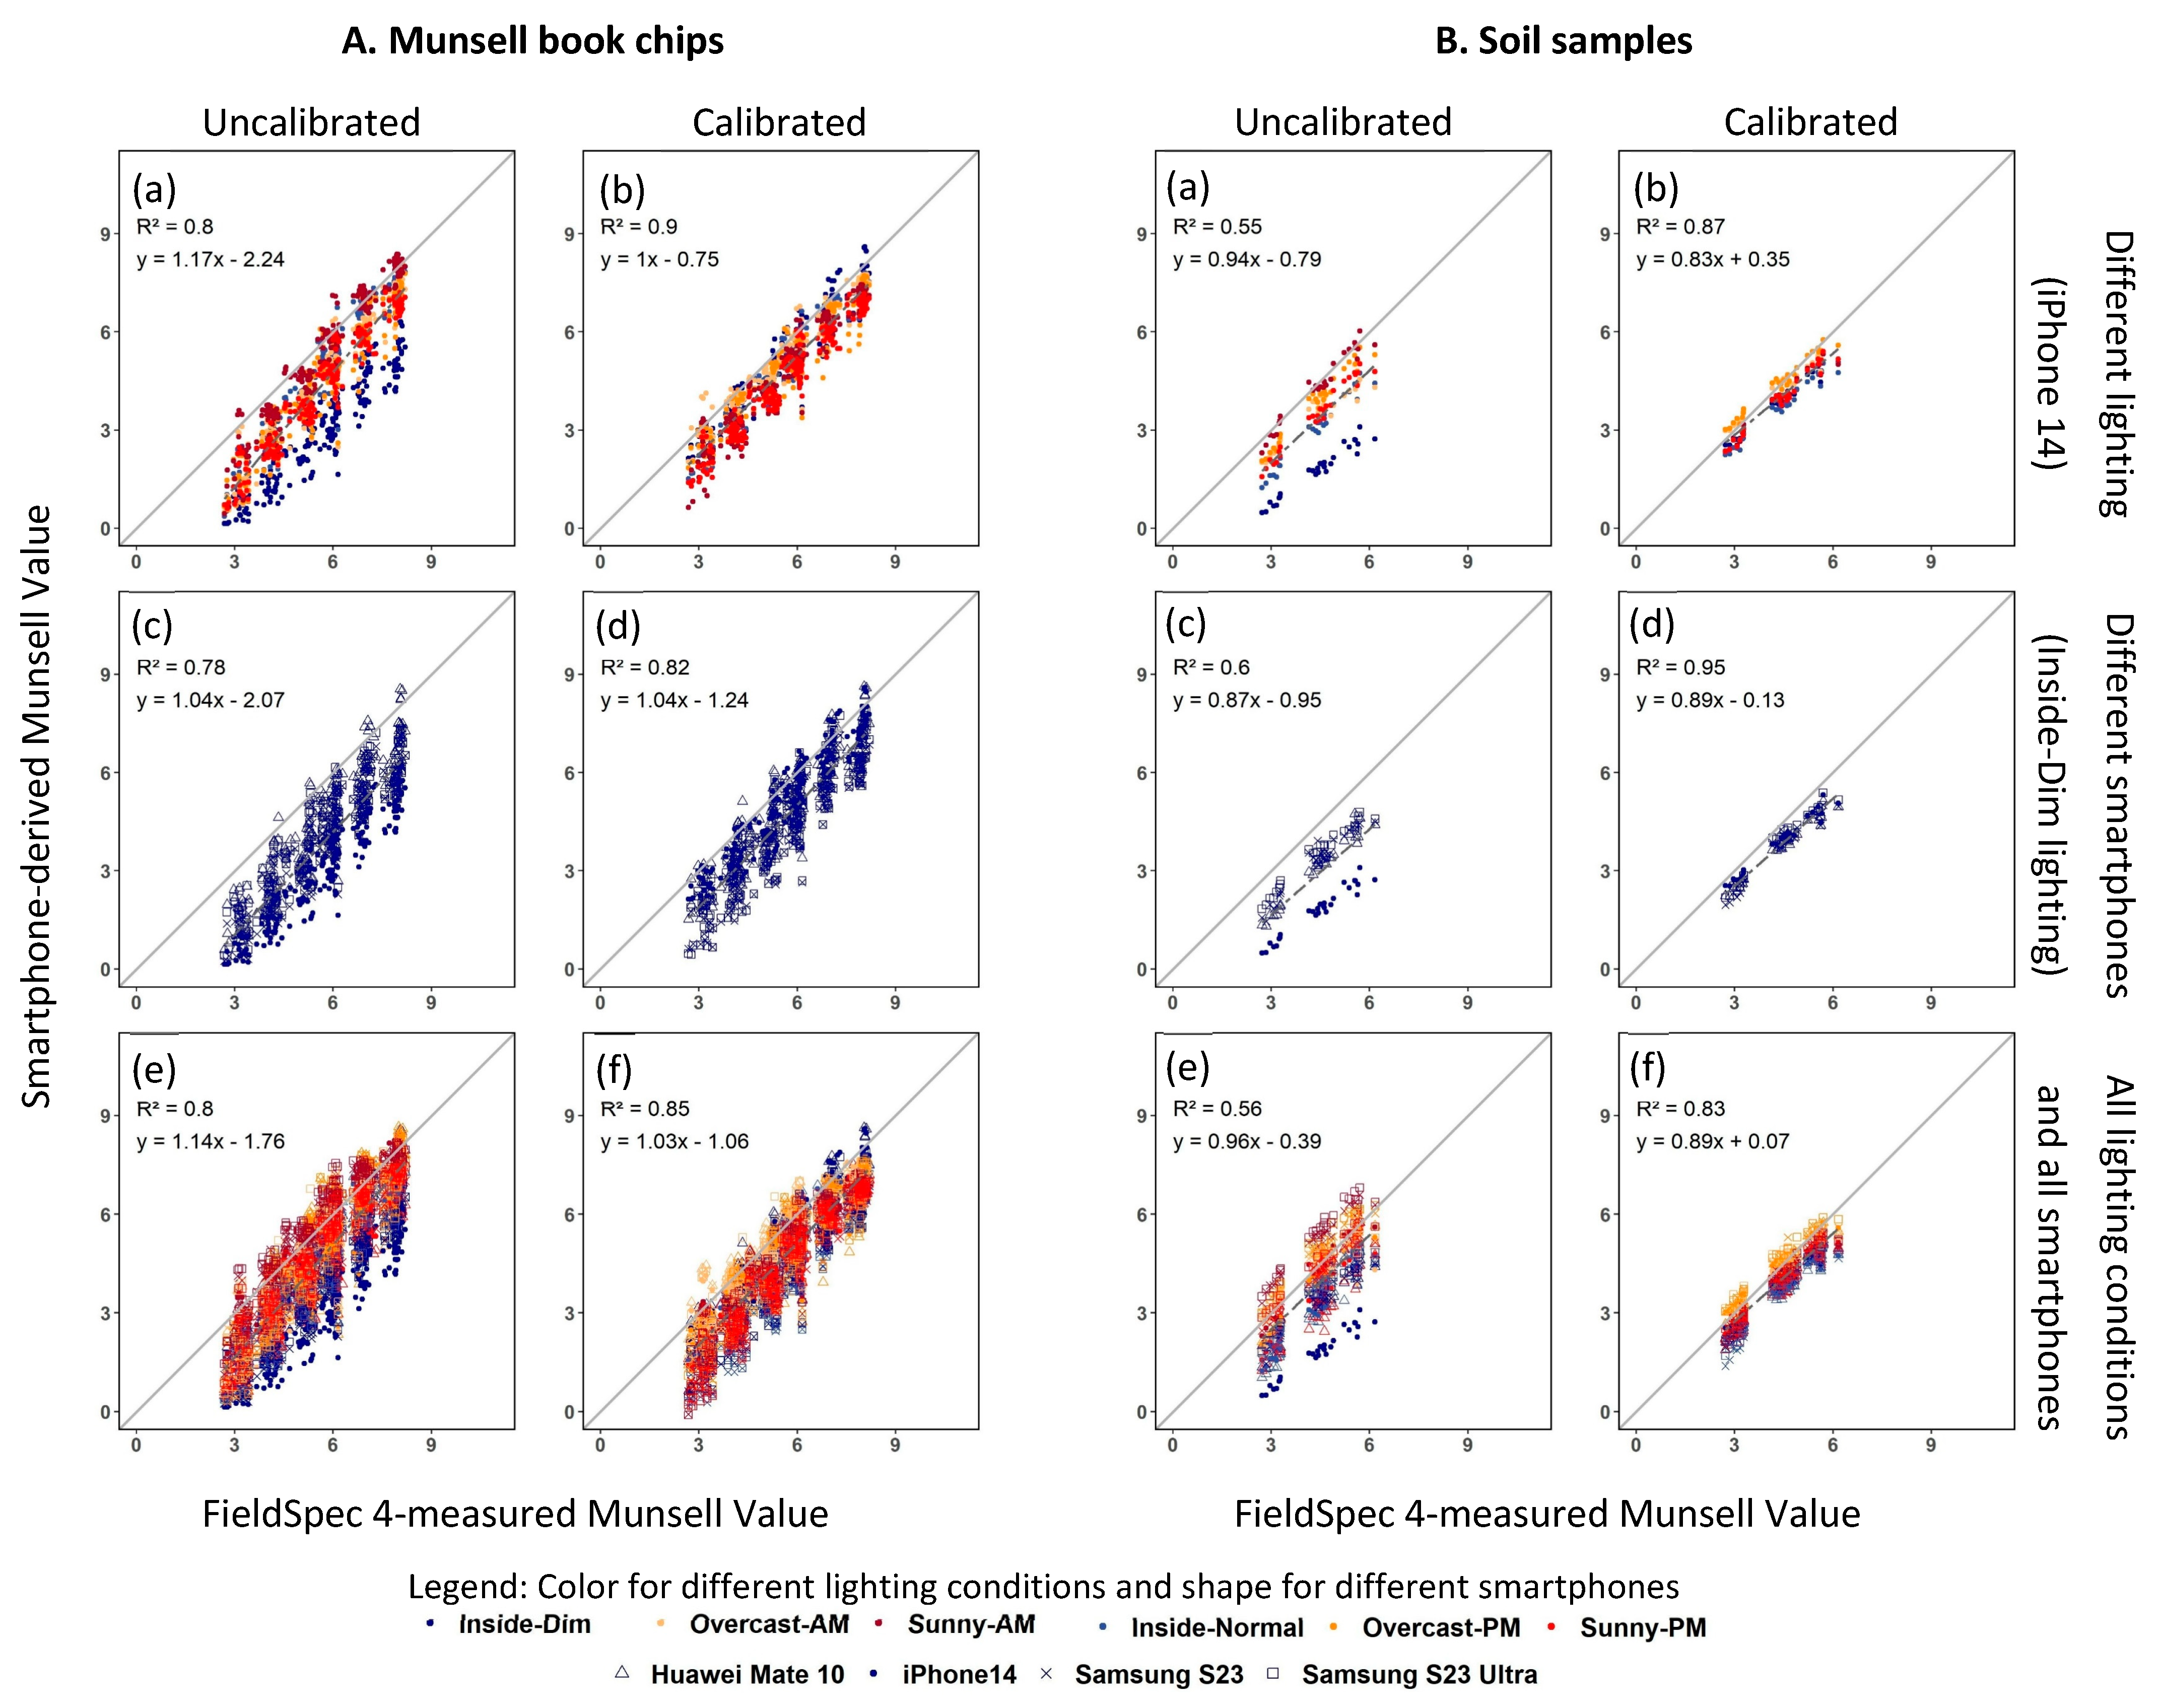
3.3. The Munsell Book Chips
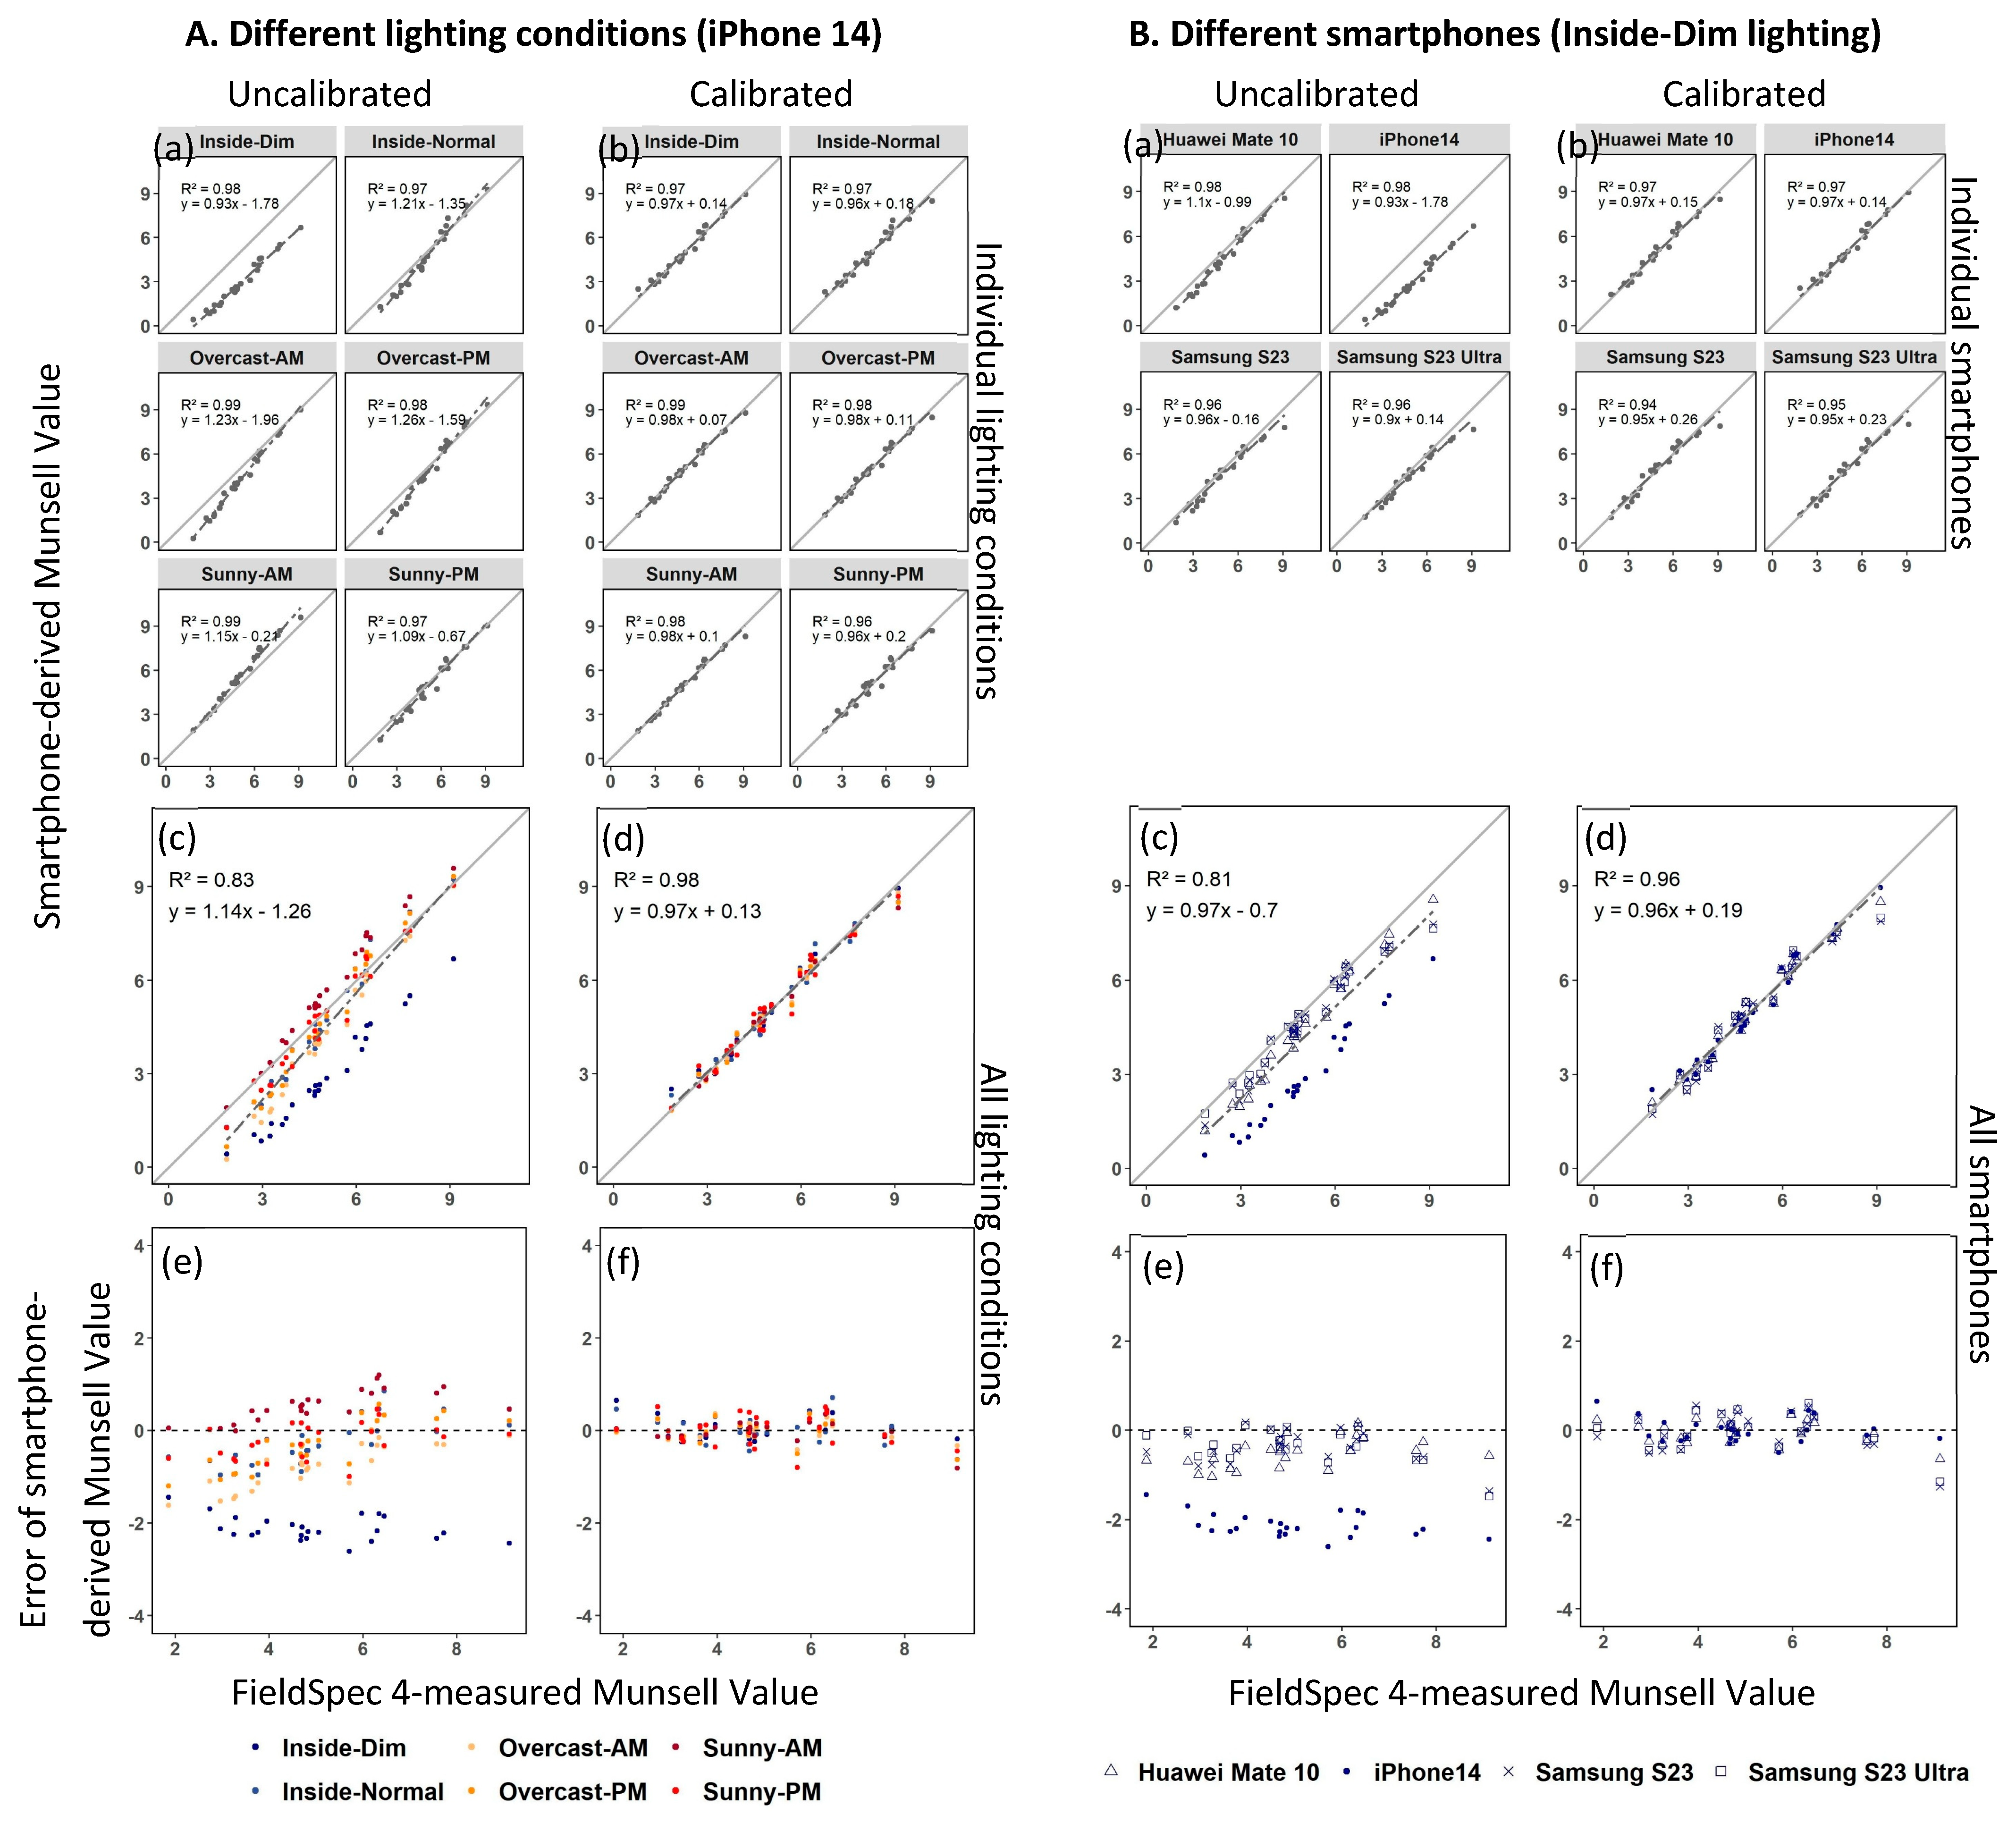
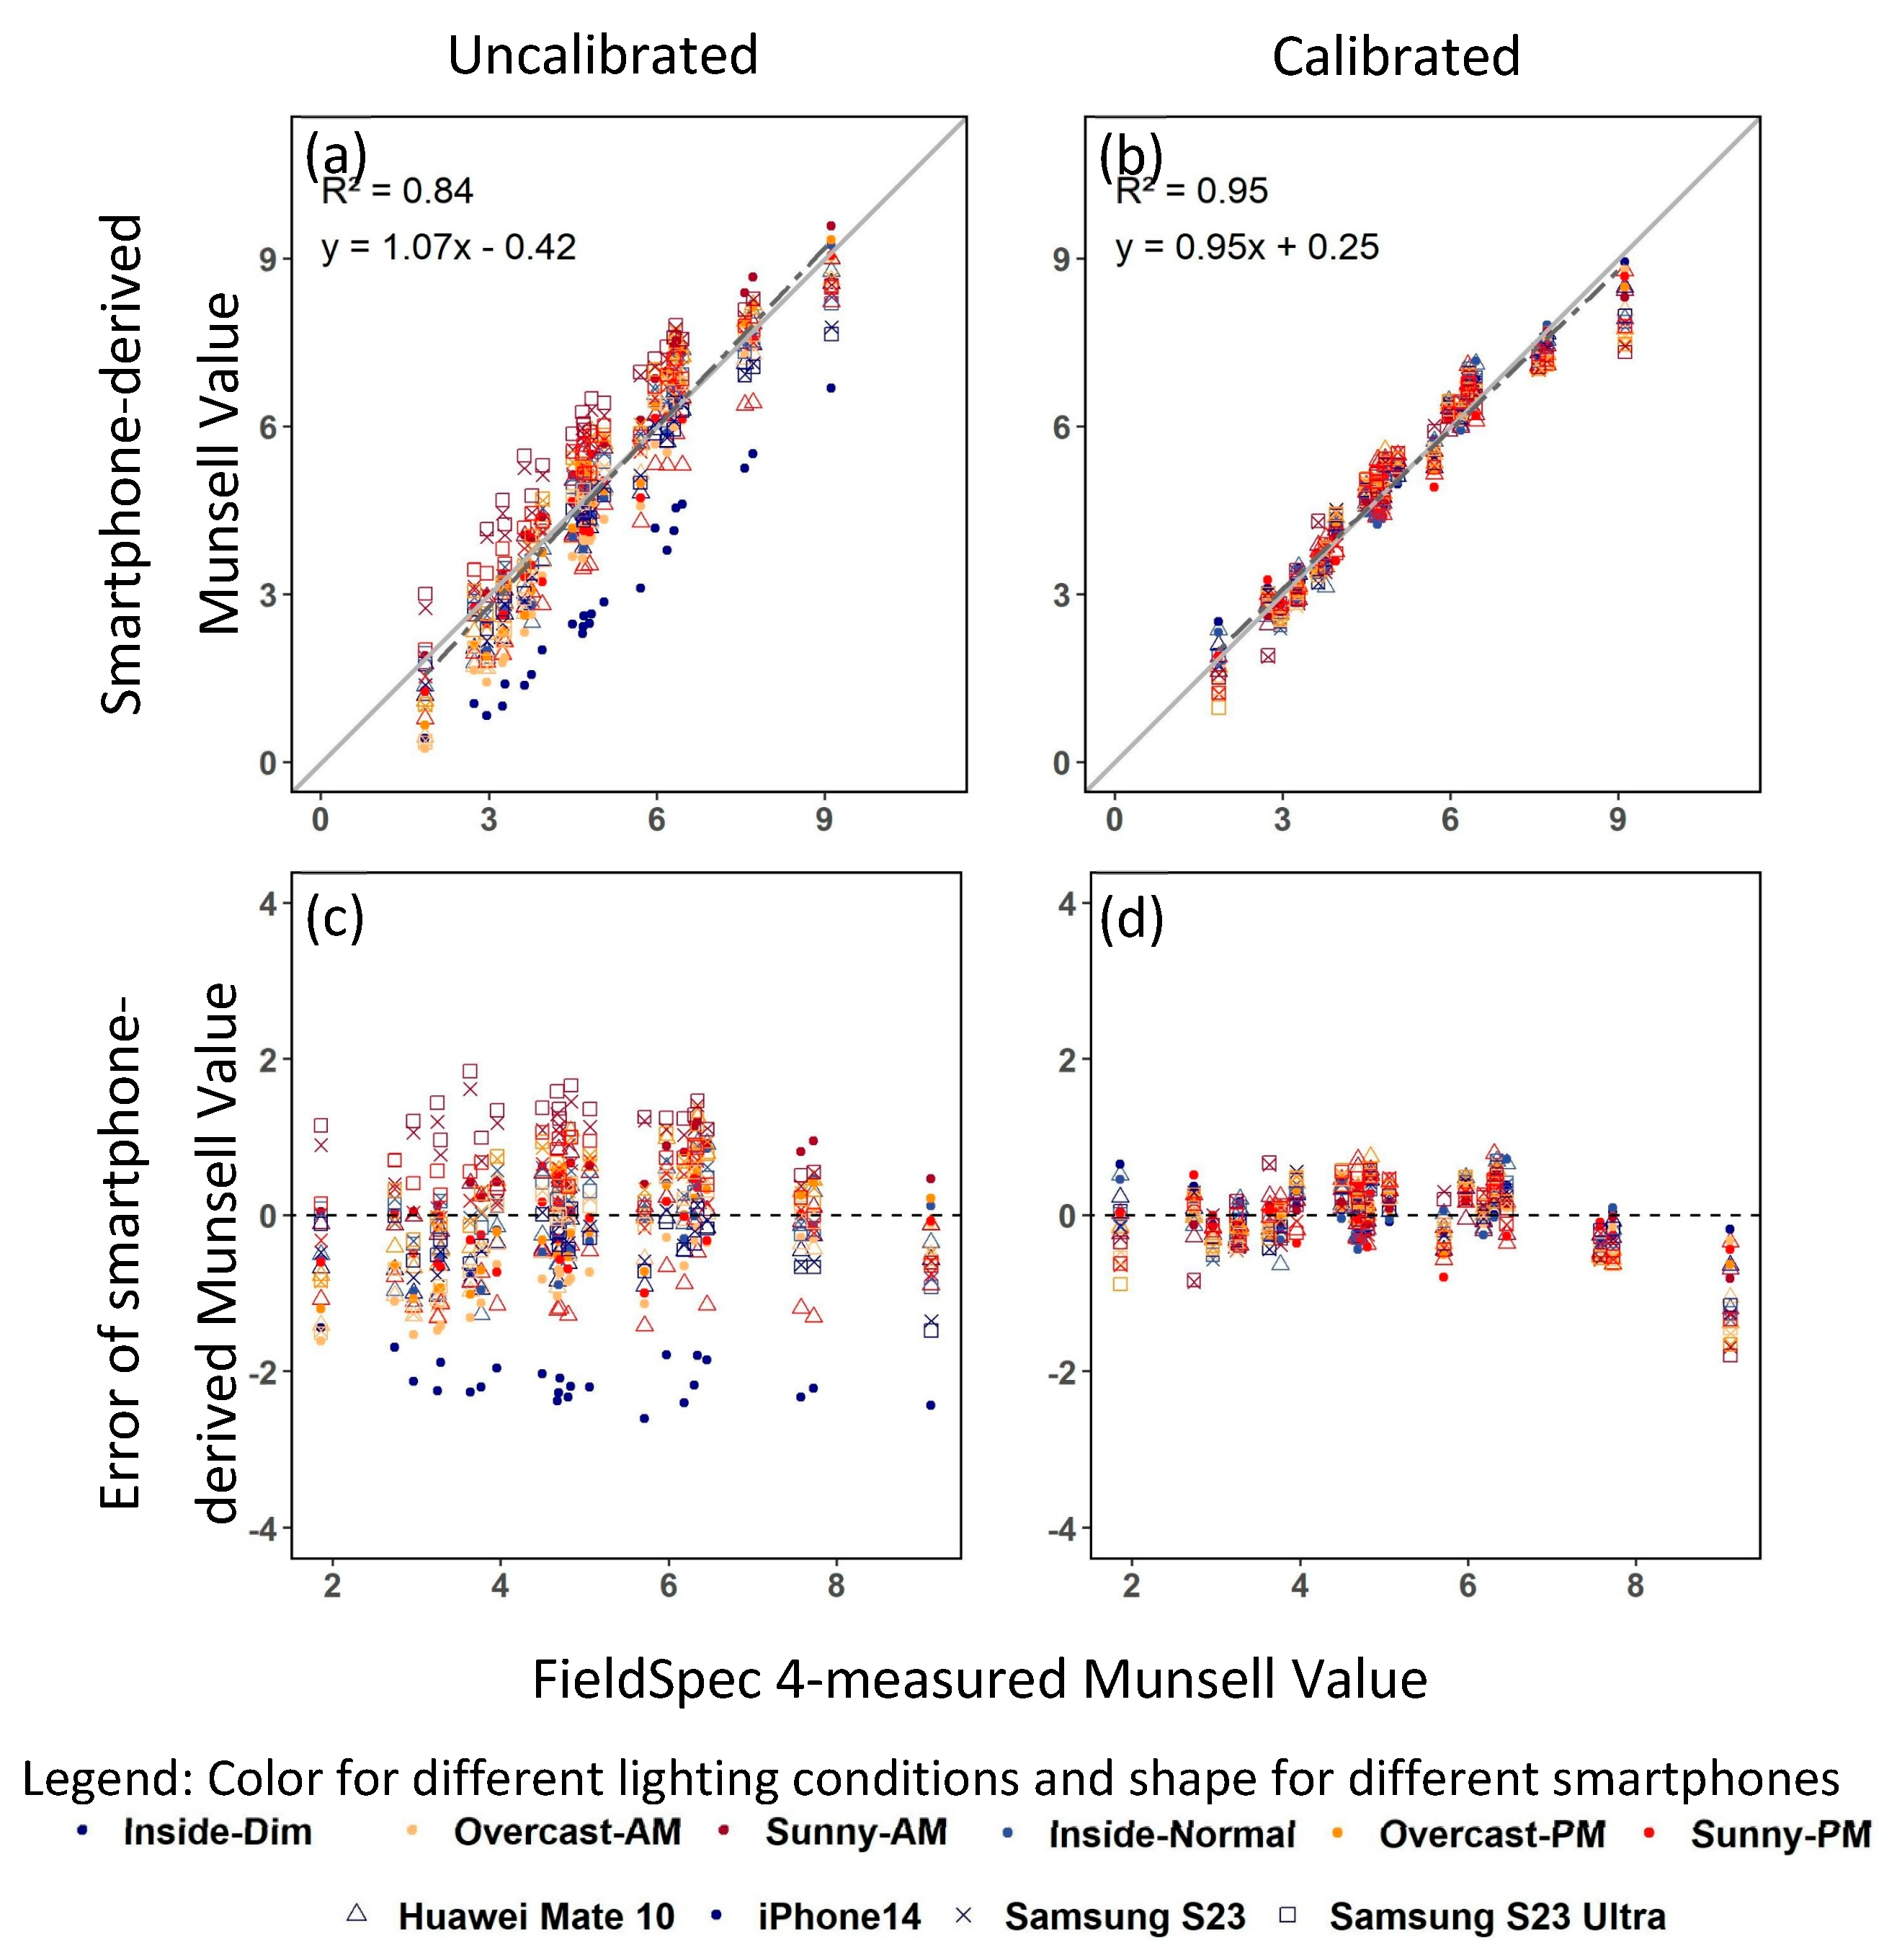
3.4. Soil Samples
4. Discussion
4.1. The Color Reference
4.2. Choosing Smartphones and Lighting Conditions
4.3. Applications of the Calibration Method
5. Conclusions
Supplementary Materials
Author Contributions
Funding
Institutional Review Board Statement
Informed Consent Statement
Data Availability Statement
Acknowledgments
Conflicts of Interest
References
- Bigham, J.; Ciolkosz, E.; Luxmoore, R. Soil Color: Proceedings of a Symposium Sponsored by Divisions S-5 and S-9 of the Soil Science Society of America in San Antonio, Texas, 21–26 October 1990; Soil Science Society of America: Madison, WI, USA, 1993. [Google Scholar]
- Naeimi, M.; Daggupati, P.; Biswas, A. Image-based soil characterization: A review on smartphone applications. Comput. Electron. Agric. 2024, 227, 109502. [Google Scholar] [CrossRef]
- Persson, M. Estimating surface soil moisture from soil color using image analysis. Vadose Zone J. 2005, 4, 1119–1122. [Google Scholar] [CrossRef]
- Wills, S.A.; Burras, C.L.; Sandor, J.A. Prediction of soil organic carbon content using field and laboratory measurements of soil color. Soil Sci. Soc. Am. J. 2007, 71, 380–388. [Google Scholar] [CrossRef]
- Liles, G.C.; Beaudette, D.E.; O’Geen, A.T.; Horwath, W.R. Developing predictive soil C models for soils using quantitative color measurements. Soil Sci. Soc. Am. J. 2013, 77, 2173–2181. [Google Scholar] [CrossRef]
- Fu, Y.; Taneja, P.; Lin, S.; Ji, W.; Adamchuk, V.; Daggupati, P.; Biswas, A. Predicting soil organic matter from cellular phone images under varying soil moisture. Geoderma 2020, 361, 114020. [Google Scholar] [CrossRef]
- Viscarra Rossel, R.A.; Cattle, S.R.; Ortega, A.; Fouad, Y. In situ measurements of soil colour, mineral composition and clay content by vis–NIR spectroscopy. Geoderma 2009, 150, 253–266. [Google Scholar] [CrossRef]
- Ibáñez-Asensio, S.; Marques-Mateu, A.; Moreno-Ramón, H.; Balasch, S. Statistical relationships between soil colour and soil attributes in semiarid areas. Biosyst. Eng. 2013, 116, 120–129. [Google Scholar] [CrossRef]
- Moritsuka, N.; Matsuoka, K.; Katsura, K.; Sano, S.; Yanai, J. Soil color analysis for statistically estimating total carbon, total nitrogen and active iron contents in Japanese agricultural soils. Soil Sci. Plant Nutr. 2014, 60, 475–485. [Google Scholar] [CrossRef]
- Han, P.; Dong, D.; Zhao, X.; Jiao, L.; Lang, Y. A smartphone-based soil color sensor: For soil type classification. Comput. Electron. Agric. 2016, 123, 232–241. [Google Scholar] [CrossRef]
- Young, T., II. The Bakerian Lecture. On the theory of light and colours. Philos. Trans. R. Soc. Lond. 1802, 92, 12–48. [Google Scholar] [CrossRef]
- Buchsbaum, G.; Gottschalk, A. Trichromacy, opponent colours coding and optimum colour information transmission in the retina. Proc. R. Soc. Lond. Ser. B Biol. Sci. 1983, 220, 89–113. [Google Scholar]
- Tkalcic, M.; Tasic, J.F. Colour spaces: Perceptual, historical and applicational background. In Proceedings of the IEEE Region 8 EUROCON 2003 Computer as a Tool, Ljubljana, Slovenia, 22–24 September 2003; Volume 301, pp. 304–308. [Google Scholar]
- Pendleton, R.L.; Nickerson, D. Soil colors and special Munsell soil color charts. Soil Sci. 1951, 71, 35–44. [Google Scholar] [CrossRef]
- Torrent, J.; Barrón, V. Laboratory measurement of soil color: Theory and practice. Soil Color 1993, 31, 21–33. [Google Scholar]
- Marcus, R.T. Chapter 2—The Measurement of Color. In AZimuth; Nassau, K., Ed.; North-Holland: Dutch, The Netherlands, 1998; Volume 1, pp. 31–96. [Google Scholar]
- Barthod, L.R.; Liu, K.; Lobb, D.A.; Owens, P.N.; Martínez-Carreras, N.; Koiter, A.J.; Petticrew, E.L.; McCullough, G.K.; Liu, C.; Gaspar, L. Selecting color-based tracers and classifying sediment sources in the assessment of sediment dynamics using sediment source fingerprinting. J. Environ. Qual. 2015, 44, 1605–1616. [Google Scholar] [CrossRef]
- Stiglitz, R.; Mikhailova, E.; Post, C.; Schlautman, M.; Sharp, J. Evaluation of an inexpensive sensor to measure soil color. Comput. Electron. Agric. 2016, 121, 141–148. [Google Scholar] [CrossRef]
- Das, B.; Chakraborty, D.; Singh, V.K.; Das, D.; Sahoo, R.N.; Aggarwal, P.; Murgaokar, D.; Mondal, B.P. Partial least square regression based machine learning models for soil organic carbon prediction using visible–near infrared spectroscopy. Geoderma Reg. 2023, 33, e00628. [Google Scholar] [CrossRef]
- Mouazen, A.; Karoui, R.; Deckers, J.; De Baerdemaeker, J.; Ramon, H. Potential of visible and near-infrared spectroscopy to derive colour groups utilising the Munsell soil colour charts. Biosyst. Eng. 2007, 97, 131–143. [Google Scholar] [CrossRef]
- Parry, J.; Cowan, W.; Heginbottom, J. Soils Studies Using Color Photos. Photogramm. Eng. 1969, 35, 44–56. [Google Scholar]
- Chen, F.; Kissel, D.E.; West, L.T.; Adkins, W. Field-scale mapping of surface soil organic carbon using remotely sensed imagery. Soil Sci. Soc. Am. J. 2000, 64, 746–753. [Google Scholar] [CrossRef]
- Levin, N.; Ben-Dor, E.; Singer, A. A digital camera as a tool to measure colour indices and related properties of sandy soils in semi-arid environments. Int. J. Remote Sens. 2005, 26, 5475–5492. [Google Scholar] [CrossRef]
- Aitkenhead, M.; Coull, M.; Gwatkin, R.; Donnelly, D. Automated Soil Physical Parameter Assessment Using Smartphone and Digital Camera Imagery. J. Imaging 2016, 2, 35. [Google Scholar] [CrossRef]
- Aitkenhead, M.; Cameron, C.; Gaskin, G.; Choisy, B.; Coull, M.; Black, H. Digital RGB photography and visible-range spectroscopy for soil composition analysis. Geoderma 2018, 313, 265–275. [Google Scholar] [CrossRef]
- Gómez-Robledo, L.; López-Ruiz, N.; Melgosa, M.; Palma, A.J.; Capitán-Vallvey, L.F.; Sánchez-Marañón, M. Using the mobile phone as Munsell soil-colour sensor: An experiment under controlled illumination conditions. Comput. Electron. Agric. 2013, 99, 200–208. [Google Scholar] [CrossRef]
- Taneja, P.; Vasava, H.K.; Daggupati, P.; Biswas, A. Multi-algorithm comparison to predict soil organic matter and soil moisture content from cell phone images. Geoderma 2021, 385, 114863. [Google Scholar] [CrossRef]
- Kirillova, N.; Zhang, Y.; Hartemink, A.; Zhulidova, D.; Artemyeva, Z.; Khomyakov, D. Calibration methods for measuring the color of moist soils with digital cameras. Catena 2021, 202, 105274. [Google Scholar] [CrossRef]
- Yang, J.; Shen, F.; Wang, T.; Luo, M.; Li, N.; Que, S. Effect of smart phone cameras on color-based prediction of soil organic matter content. Geoderma 2021, 402, 115365. [Google Scholar] [CrossRef]
- Liu, G.; Tian, S.; Xu, G.; Zhang, C.; Cai, M. Combination of effective color information and machine learning for rapid prediction of soil water content. J. Rock Mech. Geotech. Eng. 2023, 15, 2441–2457. [Google Scholar] [CrossRef]
- HunterLab. Spectrophotometer vs. Colorimeter: What’s the Difference? Available online: https://www.hunterlab.com/blog/spectrophotometer-vs-colorimeter-whats-the-difference/ (accessed on 6 June 2025).
- Baek, S.-H.; Park, K.-H.; Jeon, J.-S.; Kwak, T.-Y. A Novel Method for Calibration of Digital Soil Images Captured under Irregular Lighting Conditions. Sensors 2023, 23, 296. [Google Scholar] [CrossRef]
- Baek, S.-H.; Jeon, J.-S.; Kwak, T.-Y. Color calibration of moist soil images captured under irregular lighting conditions. Comput. Electron. Agric. 2023, 214, 108299. [Google Scholar] [CrossRef]
- Datacolor. Spyder Checkr User Guide. Available online: https://www.google.com/url?sa=t&rct=j&q=&esrc=s&source=web&cd=&ved=2ahUKEwjOzpfo8KSPAxWwvokEHTYBGWAQFnoECCMQAQ&url=https%3A%2F%2Fwww.datacolor.com%2Fspyder%2Fwp-content%2Fuploads%2F2023%2F07%2FSpyder-Checkrs-User-Guide-FINAL-EN.pdf&usg=AOvVaw3dZZxCAW22cU6QUmSTHlsD&opi=89978449 (accessed on 19 August 2025).
- Gama, J.; Centore, P.; Davis, G. Munsellinterpol: Interpolate Munsell Renotation Data from Hue/Chroma to CIE/RGB. R Package Version 2.6.1. 2020. Available online: https://cran.r-project.org/web/packages/munsellinterpol/index.html (accessed on 19 August 2025).
- Ooms, J. Magick: Advanced Graphics and Image-Processing in R, Version 2.7.4. 2023. Available online: http://CRAN.R-project.org/package=magick (accessed on 19 August 2025).
- Wickham, H.; Averick, M.; Bryan, J.; Chang, W.; McGowan, L.D.A.; François, R.; Grolemund, G.; Hayes, A.; Henry, L.; Hester, J. Welcome to the Tidyverse. J. Open Source Softw. 2019, 4, 1686. [Google Scholar] [CrossRef]
| Smartphone | Pixels | Aperture | Focal Length | Sensor Size | Pixel Size | Autofocus | Stabilization |
|---|---|---|---|---|---|---|---|
| Huawei Mate 10 | 12 MP | f/1.6 | 27 mm | 1/2.9″ | 1.25 µm | PDAF | OIS |
| iPhone 14 | 12 MP | f/1.5 | 26 mm | 1/1.7″ | 1.9 µm | dual pixel PDAF | sensor-shift OIS |
| Samsung S23 | 50 MP | f/1.8 | 24 mm | 1/1.56″ | 1.0 µm | dual pixel PDAF | OIS |
| Samsung S23 Ultra | 200 MP | f/1.7 | 24 mm | 1/1.3″ | 0.6 µm | multi-directional PDAF | OIS |
| Color Plate Squares (n = 24) | Munsell Book Chips (n = 238) | Soil Samples (n = 30) | ||||||||||
|---|---|---|---|---|---|---|---|---|---|---|---|---|
| Avg | SD | CV (%) | Avg | SD | CV (%) | Avg | SD | CV (%) | ||||
| Mean of the n objects | ||||||||||||
| R (Red) | 125.0 | 0.14 | 0.16 | 157.6 | 0.67 | 0.43 | 128.0 | 0.39 | 0.35 | |||
| G (Green) | 116.2 | 0.08 | 0.08 | 128.7 | 0.66 | 0.56 | 103.3 | 0.32 | 0.34 | |||
| B (Blue) | 103.6 | 0.09 | 0.14 | 105.2 | 0.64 | 0.66 | 80.2 | 0.26 | 0.35 | |||
| H (Hue) | 52.4 | 0.02 | 0.03 | 66.1 | 0.05 | 0.08 | 68.4 | 0.02 | 0.03 | |||
| V (Value) | 5.0 | 0.00 | 0.06 | 5.5 | 0.03 | 0.49 | 4.5 | 0.01 | 0.33 | |||
| C (Chroma) | 6.1 | 0.01 | 0.27 | 3.2 | 0.02 | 0.66 | 2.9 | 0.01 | 0.45 | |||
| 90th percentile of the n objects | ||||||||||||
| R (Red) | 216.4 | 0.33 | 0.28 | 220.3 | 1.52 | 1.00 | 158.1 | 0.66 | 0.71 | |||
| G (Green) | 182.6 | 0.19 | 0.19 | 191.2 | 1.38 | 1.10 | 134.1 | 0.52 | 0.68 | |||
| B (Blue) | 156.5 | 0.20 | 0.19 | 163.3 | 1.36 | 1.25 | 102.0 | 0.43 | 0.66 | |||
| H (Hue) | 84.7 | 0.03 | 0.06 | 73.2 | 0.08 | 0.13 | 70.2 | 0.04 | 0.05 | |||
| V (Value) | 7.2 | 0.01 | 0.14 | 7.9 | 0.05 | 0.98 | 5.6 | 0.02 | 0.67 | |||
| C (Chroma) | 11.5 | 0.02 | 0.51 | 6.5 | 0.04 | 1.54 | 4.0 | 0.02 | 0.70 | |||
| Uncalibrated | Calibrated | ||||||||||||||
|---|---|---|---|---|---|---|---|---|---|---|---|---|---|---|---|
| R | G | B | H | V | C | R | G | B | H | V | C | ||||
| Mean (of n objects) of Mean Errors (of six lighting conditions) | |||||||||||||||
| Color plate squares (n = 24) | |||||||||||||||
| Huawei Mate 10 | −5.86 | −9.00 | −0.50 | 0.06 | −0.27 | 0.70 | 0.06 | −0.15 | 0.05 | 0.05 | −0.01 | 0.02 | |||
| iPhone14 | −13.63 | −13.06 | −8.36 | 0.33 | −0.54 | 0.14 | 0.14 | −0.03 | 0.16 | 0.01 | 0.00 | 0.01 | |||
| Samsung S23 | 4.51 | 4.85 | 15.93 | 0.59 | 0.22 | 1.12 | −0.05 | −0.27 | −0.11 | 0.11 | −0.01 | 0.02 | |||
| S23 Ultra | 6.24 | 6.22 | 19.93 | 0.15 | 0.27 | 0.90 | −0.06 | −0.27 | −0.12 | 0.05 | −0.01 | 0.02 | |||
| Munsell book chips (n = 219) | |||||||||||||||
| Huawei Mate 10 | −30.12 | −22.91 | −17.94 | −3.37 | −0.97 | −0.22 | −24.69 | −14.63 | −17.23 | −3.00 | −0.70 | −0.41 | |||
| iPhone14 | −39.64 | −29.54 | −27.93 | −0.62 | −1.28 | −0.29 | −25.68 | −16.51 | −19.20 | −0.86 | −0.73 | −0.16 | |||
| Samsung S23 | −30.09 | −19.22 | −17.28 | −1.47 | −0.87 | −0.22 | −34.86 | −23.98 | −31.59 | −1.62 | −1.08 | −0.40 | |||
| S23 Ultra | −27.38 | −16.08 | −11.48 | −2.08 | −0.75 | −0.32 | −33.69 | −22.53 | −31.81 | −1.78 | −1.03 | −0.33 | |||
| Soil samples (n = 30) | |||||||||||||||
| Huawei Mate 10 | −25.56 | −22.72 | −15.16 | −3.63 | −0.93 | −0.43 | −20.64 | −11.27 | −15.53 | −3.44 | −0.55 | −0.54 | |||
| iPhone14 | −33.71 | −24.31 | −19.18 | 0.28 | −1.08 | −0.67 | −21.04 | −8.53 | −11.74 | −0.21 | −0.40 | −0.46 | |||
| Samsung S23 | −11.11 | −4.12 | −0.63 | −2.86 | −0.23 | −0.45 | −16.37 | −7.74 | −14.98 | −2.97 | −0.40 | −0.39 | |||
| S23 Ultra | −6.41 | 0.39 | 7.47 | −3.99 | −0.04 | −0.62 | −14.33 | −5.67 | −11.89 | −3.73 | −0.32 | −0.49 | |||
| Mean (of n objects) of SD of Errors (of six lighting conditions) | |||||||||||||||
| Color plate squares (n = 24) | |||||||||||||||
| Huawei Mate 10 | 21.69 | 11.69 | 13.66 | 2.66 | 0.52 | 1.59 | 7.03 | 4.88 | 7.04 | 2.91 | 0.20 | 1.34 | |||
| iPhone14 | 25.39 | 22.80 | 28.67 | 2.99 | 0.92 | 1.75 | 5.40 | 4.45 | 6.13 | 3.27 | 0.17 | 1.43 | |||
| Samsung S23 | 16.94 | 13.26 | 22.28 | 3.00 | 0.51 | 1.81 | 6.30 | 4.27 | 7.49 | 3.31 | 0.18 | 1.42 | |||
| S23 Ultra | 16.89 | 15.51 | 26.08 | 2.98 | 0.59 | 1.88 | 7.03 | 4.72 | 7.11 | 3.23 | 0.19 | 1.42 | |||
| Munsell book chips (n = 219) | |||||||||||||||
| Huawei Mate 10 | 23.96 | 15.60 | 13.34 | 11.47 | 0.67 | 1.10 | 13.42 | 10.86 | 13.86 | 10.11 | 0.45 | 1.04 | |||
| iPhone14 | 24.88 | 19.89 | 19.81 | 11.66 | 0.83 | 0.97 | 10.45 | 9.39 | 12.59 | 10.13 | 0.36 | 0.88 | |||
| Samsung S23 | 21.57 | 17.54 | 19.94 | 12.38 | 0.71 | 1.28 | 13.75 | 12.09 | 14.57 | 10.67 | 0.50 | 1.10 | |||
| S23 Ultra | 21.13 | 18.41 | 23.52 | 12.42 | 0.74 | 1.28 | 14.42 | 12.34 | 16.36 | 10.50 | 0.50 | 1.16 | |||
| Soil samples (n = 30) | |||||||||||||||
| Huawei Mate 10 | 18.82 | 13.52 | 12.63 | 7.46 | 0.59 | 1.01 | 13.49 | 7.98 | 9.53 | 6.68 | 0.32 | 1.00 | |||
| iPhone14 | 24.73 | 20.40 | 19.93 | 9.85 | 0.89 | 0.85 | 10.99 | 8.11 | 11.78 | 8.86 | 0.29 | 0.66 | |||
| Samsung S23 | 20.84 | 17.43 | 18.51 | 10.87 | 0.71 | 1.10 | 13.14 | 10.65 | 10.98 | 9.23 | 0.42 | 0.89 | |||
| S23 Ultra | 21.06 | 18.52 | 19.72 | 12.38 | 0.74 | 0.94 | 13.20 | 10.26 | 12.12 | 10.50 | 0.41 | 0.80 | |||
| Uncalibrated | Calibrated | ||||||||||||||
|---|---|---|---|---|---|---|---|---|---|---|---|---|---|---|---|
| R | G | B | H | V | C | R | G | B | H | V | C | ||||
| Mean (of n objects) of Mean Errors (of four smartphones) | |||||||||||||||
| Color plate squares (n = 24) | |||||||||||||||
| Inside-Dim | −18.02 | −21.02 | −13.98 | 0.63 | −0.83 | −0.41 | 0.13 | −0.07 | 0.12 | 0.02 | −0.01 | 0.01 | |||
| Inside-Normal | 8.06 | −2.58 | −5.60 | 1.63 | −0.05 | 0.03 | 0.01 | −0.13 | 0.06 | 0.02 | −0.01 | 0.02 | |||
| Overcast-AM | −9.73 | −11.87 | −6.54 | 0.73 | −0.40 | 0.96 | −0.03 | −0.20 | −0.04 | 0.01 | −0.01 | 0.01 | |||
| Overcast-PM | 5.56 | 2.50 | 8.15 | 0.65 | 0.17 | 1.11 | −0.01 | −0.21 | −0.07 | 0.02 | −0.01 | 0.02 | |||
| Sunny-AM | 22.91 | 17.16 | 20.32 | 1.06 | 0.72 | 0.51 | −0.05 | −0.29 | −0.08 | 0.04 | −0.01 | 0.03 | |||
| Sunny-PM | −21.91 | −0.66 | 38.14 | −3.01 | −0.09 | 2.08 | 0.08 | −0.18 | −0.02 | 0.24 | −0.01 | 0.03 | |||
| Munsell book chips (n = 219) | |||||||||||||||
| Inside-Dim | −54.44 | −42.74 | −36.67 | 2.19 | −1.82 | −0.92 | −35.81 | −21.74 | −24.68 | 1.78 | −1.00 | −0.59 | |||
| Inside-Normal | −24.64 | −23.76 | −33.90 | 3.21 | −0.98 | 0.60 | −33.22 | −21.43 | −28.58 | 2.41 | −0.93 | 0.58 | |||
| Overcast-AM | −24.83 | −16.39 | −14.98 | 1.23 | −0.74 | −0.45 | −16.64 | −7.12 | −7.83 | 0.61 | −0.40 | −0.82 | |||
| Overcast-PM | −25.44 | −16.94 | −16.33 | 2.56 | −0.77 | −0.43 | −31.60 | −18.99 | −21.93 | 2.04 | −0.89 | −0.77 | |||
| Sunny-AM | −7.24 | −4.31 | −11.17 | 1.99 | −0.22 | 0.32 | −29.72 | −21.12 | −32.41 | 1.29 | −0.93 | 0.15 | |||
| Sunny-PM | −54.23 | −27.48 | 1.11 | −22.49 | −1.28 | −0.70 | −31.39 | −26.09 | −34.30 | −19.04 | −1.17 | −0.52 | |||
| Soil samples (n = 30) | |||||||||||||||
| Inside-Dim | −43.91 | −35.70 | −26.83 | 0.24 | −1.53 | −0.90 | −27.73 | −13.60 | −16.32 | −0.21 | −0.63 | −0.53 | |||
| Inside-Normal | −28.10 | −26.46 | −27.67 | 1.10 | −1.09 | 0.15 | −36.22 | −19.59 | −22.03 | 0.19 | −0.83 | 0.15 | |||
| Overcast-AM | −12.68 | −8.63 | −5.27 | 0.75 | −0.38 | −0.41 | −7.03 | 1.51 | −0.35 | 0.24 | −0.04 | −0.72 | |||
| Overcast-PM | −4.59 | 0.62 | 5.22 | 0.26 | −0.02 | −0.58 | −5.27 | 2.92 | 0.00 | −0.13 | 0.03 | −0.91 | |||
| Sunny-AM | 8.87 | 7.21 | 2.96 | 0.50 | 0.29 | 0.36 | −17.83 | −10.58 | −20.64 | −0.18 | −0.49 | 0.31 | |||
| Sunny-PM | −34.77 | −13.19 | 10.35 | −18.15 | −0.69 | −1.90 | −14.48 | −10.50 | −21.85 | −15.44 | −0.55 | −1.14 | |||
| Mean (of n objects) of SD of Errors (of four smartphones) | |||||||||||||||
| Color plate squares (n = 24) | |||||||||||||||
| Inside-Dim | 22.59 | 20.22 | 25.38 | 1.46 | 0.88 | 1.00 | 6.47 | 4.00 | 7.02 | 1.67 | 0.15 | 0.83 | |||
| Inside-Normal | 9.97 | 9.36 | 11.53 | 1.13 | 0.35 | 0.57 | 5.80 | 4.46 | 10.00 | 1.25 | 0.14 | 0.55 | |||
| Overcast-AM | 9.13 | 10.00 | 14.47 | 1.01 | 0.35 | 0.69 | 6.53 | 4.86 | 6.26 | 1.15 | 0.15 | 0.66 | |||
| Overcast-PM | 9.88 | 10.05 | 12.38 | 1.01 | 0.38 | 0.82 | 6.62 | 4.89 | 6.08 | 1.12 | 0.15 | 0.58 | |||
| Sunny-AM | 12.67 | 13.56 | 12.93 | 1.10 | 0.49 | 0.81 | 8.71 | 5.99 | 7.93 | 1.23 | 0.19 | 0.77 | |||
| Sunny-PM | 16.31 | 15.57 | 23.82 | 1.05 | 0.64 | 1.26 | 6.66 | 4.54 | 6.04 | 1.22 | 0.15 | 0.70 | |||
| Munsell book chips (n = 219) | |||||||||||||||
| Inside-Dim | 15.89 | 14.94 | 16.40 | 2.85 | 0.62 | 0.32 | 13.29 | 9.61 | 13.91 | 2.78 | 0.43 | 0.57 | |||
| Inside-Normal | 7.56 | 4.85 | 6.31 | 1.93 | 0.21 | 0.35 | 10.11 | 9.07 | 10.66 | 1.69 | 0.37 | 0.33 | |||
| Overcast-AM | 7.11 | 9.35 | 11.45 | 3.39 | 0.33 | 0.51 | 6.72 | 4.84 | 6.71 | 3.35 | 0.18 | 0.46 | |||
| Overcast-PM | 7.98 | 7.76 | 7.50 | 2.88 | 0.29 | 0.43 | 6.03 | 4.90 | 6.05 | 2.67 | 0.20 | 0.35 | |||
| Sunny-AM | 11.91 | 11.17 | 7.32 | 2.89 | 0.43 | 0.56 | 6.03 | 4.47 | 9.03 | 2.52 | 0.17 | 0.47 | |||
| Sunny-PM | 12.90 | 11.59 | 15.41 | 6.44 | 0.49 | 0.71 | 6.39 | 5.34 | 9.38 | 5.85 | 0.24 | 0.72 | |||
| Soil samples (n = 30) | |||||||||||||||
| Inside-Dim | 20.61 | 17.26 | 17.39 | 3.26 | 0.78 | 0.26 | 5.43 | 3.69 | 5.48 | 2.66 | 0.12 | 0.41 | |||
| Inside-Normal | 8.98 | 9.24 | 7.57 | 1.98 | 0.37 | 0.27 | 4.61 | 2.74 | 3.05 | 1.59 | 0.11 | 0.25 | |||
| Overcast-AM | 11.26 | 13.08 | 13.15 | 1.48 | 0.50 | 0.36 | 4.56 | 4.14 | 4.22 | 1.32 | 0.17 | 0.26 | |||
| Overcast-PM | 11.66 | 12.22 | 12.56 | 3.39 | 0.47 | 0.43 | 5.00 | 3.76 | 3.52 | 3.16 | 0.16 | 0.36 | |||
| Sunny-AM | 18.54 | 17.27 | 12.78 | 1.40 | 0.68 | 0.51 | 6.55 | 3.01 | 4.09 | 0.94 | 0.17 | 0.45 | |||
| Sunny-PM | 15.81 | 15.39 | 18.70 | 13.72 | 0.64 | 0.35 | 5.24 | 4.04 | 3.09 | 12.10 | 0.16 | 0.78 | |||
Disclaimer/Publisher’s Note: The statements, opinions and data contained in all publications are solely those of the individual author(s) and contributor(s) and not of MDPI and/or the editor(s). MDPI and/or the editor(s) disclaim responsibility for any injury to people or property resulting from any ideas, methods, instructions or products referred to in the content. |
© 2025 by the authors. Licensee MDPI, Basel, Switzerland. This article is an open access article distributed under the terms and conditions of the Creative Commons Attribution (CC BY) license (https://creativecommons.org/licenses/by/4.0/).
Share and Cite
Li, S.; Zheng, F.; Koiter, A.J.; Kupriyanovich, Y.; Lobb, D.A.; Goharrokhi, M. Using a Reference Color Plate to Correct Smartphone-Derived Soil Color Measurements with Different Smartphones Under Different Lighting Conditions. Soil Syst. 2025, 9, 93. https://doi.org/10.3390/soilsystems9030093
Li S, Zheng F, Koiter AJ, Kupriyanovich Y, Lobb DA, Goharrokhi M. Using a Reference Color Plate to Correct Smartphone-Derived Soil Color Measurements with Different Smartphones Under Different Lighting Conditions. Soil Systems. 2025; 9(3):93. https://doi.org/10.3390/soilsystems9030093
Chicago/Turabian StyleLi, Sheng, Fangzhou Zheng, Alexander J. Koiter, Yulia Kupriyanovich, David A. Lobb, and Masoud Goharrokhi. 2025. "Using a Reference Color Plate to Correct Smartphone-Derived Soil Color Measurements with Different Smartphones Under Different Lighting Conditions" Soil Systems 9, no. 3: 93. https://doi.org/10.3390/soilsystems9030093
APA StyleLi, S., Zheng, F., Koiter, A. J., Kupriyanovich, Y., Lobb, D. A., & Goharrokhi, M. (2025). Using a Reference Color Plate to Correct Smartphone-Derived Soil Color Measurements with Different Smartphones Under Different Lighting Conditions. Soil Systems, 9(3), 93. https://doi.org/10.3390/soilsystems9030093


