Article

Effects of Nitrogen and Phosphorus Supplementation on Responses of Trembling Aspen and White Spruce Seedlings in Reclamation Soils Amended by Non-Segregating Oil Sands Tailings

1
Institute of Ecology and Biodiversity, School of Life Sciences, Shandong University, Qingdao 266237, China
2
Guangxi Key Laboratory of Mangrove Conservation and Utilization, Guangxi Academy of Marine Sciences (Guangxi Mangrove Research Center), Guangxi Academy of Sciences, Beihai 536000, China
3
Observation and Research Station of Coastal Wetland Ecosystem in Beibu Gulf, Ministry of Natural Resources, Beihai 536015, China
4
Department of Renewable Resources, 442 Earth Sciences Building, University of Alberta, Edmonton, AB T6G 2E3, Canada
*
Author to whom correspondence should be addressed.
Soil Syst. 2025, 9(3), 90; https://doi.org/10.3390/soilsystems9030090
Submission received: 29 March 2025 / Revised: 28 July 2025 / Accepted: 29 July 2025 / Published: 11 August 2025

Abstract

Oil sands mining in northeastern Alberta, Canada, has disturbed large areas of the northern boreal forest which must be restored to pre-disturbance levels through reclamation. The oil sands tailings have high pH and elevated levels of Na+ which are harmful to plants. A novel non-segregating tailing (NST) was developed to accelerate consolidation of fine tailings, yet its effects on boreal plant species are not well characterized. In oil sands reclamation, a capping layer—either forest mineral soil mix (FMM), salvaged from upland boreal forest sites, or peat mineral mix (PMM), sourced from peatlands—is typically applied over overburden materials and coarse tailings sands prior to revegetation. Plants in oil sands revegetation sites frequently experience nutrient deficiencies, such as nitrogen and phosphorus, and impaired physiological processes due to the high pH and soil salinity. In this study, we examined the effects of nitrogen and phosphorus supplements in the NST-amended reclamation soils on growth and physiological parameters of trembling aspen (Populus tremuloides) and white spruce (Picea glauca) seedlings. We found that the growth and physiological responses of seedlings were superior in the mixture of NST and FMM compared with NST and PMM. Phytotoxicity of NST was associated with elevated boron levels. Trembling aspen exhibited greater sensitivity to NST but showed stronger growth improvements with increased nitrogen and phosphorus supplementation compared to white spruce. High levels of nitrogen and phosphorus supplementation alleviated the adverse effects on both species that were caused by mineral nutrient imbalance.

1. Introduction

Oil sands mining in northeastern Alberta, Canada, has disturbed large areas of the northern boreal forest. As of 2023, these mining activities had disturbed about 108,424 ha of forest habitats [1]. The government of Alberta requires that these disturbed areas must be restored through reclamation and revegetation to pre-disturbance levels as the final step of mining closure [2]. The extraction of oil sands bitumen is carried out with recycled hot water containing NaOH and, as a result, the tailings have high pH (pH 8–10) and elevated salinity (>6 ms cm−1) [3], which are harmful to the survival and growth of reclamation plants. Revegetated plants grown at oil sands reclamation sites commonly face problems including reduced availability of essential mineral nutrients [4], water scarcity [5], low soil organic matter [6], presence of naphthenic acids [7], impaired functions of soil microorganism [8], and elevated levels of fluoride and boron [9,10].
In oil sands reclamation, to prevent plant root contact with tailings deposits, forest floor mineral soil mix (FMM) (forest floor materials mixed with underlying mineral soil during salvaging at 1:1 to 1:5 ratio) or peat mineral soil mix (PMM) (peat to mineral soil at 3:2 to 3:4 ratio by volume) are commonly placed on top of saline shale overburden and tailings materials before revegetation [11,12]. These two types of soil have high organic matter content and high water holding capacity and provide the source of nutrients, propagules and soil microorganisms [13]. FMM has a relatively large propagule bank [14] and is more readily decomposable due to the lower ratios of carbon to nitrogen, greater microbial biomass and enzyme activities [13,15]. PMM is more readily available in northern Alberta in larger quantities compared with FMM [16].
In the oil sands processing, to accelerate tailings consolidation, other chemicals may be added, which additionally affect tailings chemistry and might make them more detrimental to plants. To mitigate the phytotoxicity of tailings, increase water use efficiency, and reduce greenhouse gas emissions, Canadian Natural Resources Limited (CNRL) recently developed novel tailings management technologies to consolidate fine tailings and produce non segregating tailings (NST) using thickeners in combination with injecting CO2 to tailings streams to densify and ultimately reduce the final tailings volume before their deposition in the tailings ponds [17,18]. However, the impact of NST on boreal plants need to be thoroughly examined prior to its large-scale use as capping materials in reclamation.
Nitrogen and phosphorus are major essential elements that are required in relatively large quantities for plant growth. In boreal forests, nitrogen availability is among the most significant factors affecting growth of plants and nitrogen turnover rate is related with forest productivity [19,20,21]. In addition, nitrogen can affect canopy cover density as well as species richness and composition [22,23]. Reduced nitrogen availability has been often reported to be one of the major limiting factors for tree growth and site productivity in the oil sands reclamation sites. Oil sands mining reduces organic nitrogen due to the loss of fertile topsoil and mechanical mixing of fertile surface soils with infertile subsurface soils [24,25]. In addition, high soil salinity influences plant nitrogen uptake and assimilation as well as amino acid and protein synthesis [26]. Phosphorous affects many processes in plants including leaf expansion, leaf number [27,28], shoot to root ratios [29], and root hydraulic conductivity [30]. Phosphorus availability is generally low in high pH soils [30], which is of concern in oil sands reclamation areas [3]. Phosphorus deficiency can lead to reduced growth, impaired photosynthesis, and leaf chlorosis in boreal trees under high root zone pH conditions [31]. Additionally, mycorrhizal associations are slow to develop in the oil sands mining sites [32,33], which could further impair plant phosphorus uptake of reclamation plants [34].
In the present study, we examined the growth and physiological responses of trembling aspen (Populus tremuloides Michx.) and white spruce [Picea glauca (Moench) Voss], which are dominant boreal species and commonly used for oil sands reclamation. Trembling aspen has an important role in nutrient cycling in boreal forest due to its rapid growth and high nitrogen demand [35]. White spruce has a relatively high tolerance over a range of soil nutrition levels and moisture conditions [36]. Aspen prefers nitrate as its nitrogen source [37], while white spruce has lower nitrogen requirements compared with aspen and uses ammonium as its main nitrogen source [38]. The objectives of this study were to investigate the responses of these plants growing in two types of reclamation soils (FMM and PMM) with NST amendments and supplied with different N and P levels. The following hypotheses were tested: (1) NST presence negatively affects plant growth, with severity depending on soil type; and (2) soil supplementation with N and P is more effective in enhancing growth and physiological parameters in trembling aspen compared with white spruce.

2. Materials and Methods

2.1. Soil Preparation

Soil substrates that were used in this study included the (a) forest floor mineral soil mix (FMM), (b) peat–mineral soil mix (PMM), (c) non-segregating tailings (NST), (d) 1:1 (by volume) mixture of NST and FMM, and (e) 1:1 (by volume) mixture of NST and PMM. For FMM, approximately 30 cm of the surface soil layer was collected from the boreal forest site near Fort McMurray, Alberta, Canada. Peat–mineral mix (PMM) was collected from CNRL Horizon oil sands reclamation areas. Soils in this region are dominated by organic Mesisols, with Fibrisols, Cryosols, and Orthic and peaty Gleysols, and have a C:N ratio of 33.1 (0.7), sand percentage of 51.4 (1.0), silt percentage of 35.7 (0.6), clay percentage of 12.9 (0.6), and bulk density of 0.82 (0.06) mg m−3 [39]. Non-segregating tailings (NST) sediments were obtained from the CNRL Horizon mine processing facility. All of these different substrates were sealed in pails and delivered to the University of Alberta. For PMM and FMM soil, large aggregates, stones, grass, and tree branches were removed, and the soil was air dried for 3–4 days in order to mix together. The substrate pH was measured at the beginning of the experiment. For each growth substrate sample, 30 g of air-dried powder was mixed with 60 mL of distilled water and shaken for one hour. The slurry was then filtered with a 0.45 μm Teflon membrane filter to obta.in the extract solution. The pH of the solution was then measured using an Orion STAR A111 pH meter (Thermo Fisher Scientific Inc., Waltham, MA, USA).

2.2. Plant Material and Experimental Set-Up

One-year-old greenhouse-grown trembling aspen and white spruce dormant seedlings were obtained from Tree Time Services Inc., Edmonton, AB, Canada. The seedlings were stored for two weeks at 4 °C prior to the experiment. After removing from cold storage, the plants were grown in 2 L pots (each pot contained one seedling) with approximately 1.8 L of the above five growth substrates for two months in the growth room at 22/18 °C (day/night) temperature, 65 ± 10% relative humidity, and 16 h photoperiod with 300 μmol m−2 s−1 photosynthetic photon flux density (PPDF) at the top of the seedlings provided by the full-spectrum fluorescent bulbs (Philips high output, F96T8/TL835/HO, Markham, ON, Canada).
Two levels of N&P nutrient solutions were prepared in 10% Hoagland’s mineral solution [40]. The 10% N&P nutrient solution was 10% Hoagland’s mineral solution (N—1600 µM; P—200 µM) and the 100% N&P nutrient solution was 10% Hoagland’s mineral solution with N and P maintained at the levels of the 100% Hoagland’s solution (N—16,000 µM; P—2000 µM). In both solutions, the other mineral nutrients were maintained at levels of 10% Hoagland’s solution: K—600 µM; Ca—400 µM; S—100 µM; Mg—100 µM; Cl—5 µM; B—2.5 µM; Mn—0.2 µM; Zn—0.2 µM; Cu—0.05 µM; Mo—0.05 µM; Fe—2 µM. The experiment was a 5 × 2 complete randomized factorial design with five soil substrates (NST, NST + PMM, NST + FMM, PMM, and FMM) and two N&P levels (10% and 100%). There were six replicated seedlings of each species per treatment (n = 6). The temperature, humidity, and light intensity inside the growth chamber were relatively uniform. The pots were randomly placed on the frame in the chamber, and the treatments were labeled with color tags. All plants were irrigated with distilled water every two days and provided with 500 mL of 10% or 100% N&P nutrient solution once a week.

2.3. Growth Parameters

Seedling shoot height measurements were taken from the base of the stem to the shoot tip in six seedlings per treatment (n = 6). Root collar diameters were measured twice at perpendicular directions, and the mean values were taken for the analysis (n = 6). The measurements were taken at the time of planting and at harvest after two months of treatment, and the differences between the two measurements were the shoot height growth and root collar diameter growth.
To determine leaf, shoot, and root dry weights, six seedlings of each species were randomly removed from each soil substrate and N&P nutrient treatment combination (n = 6). Leaves were separated from stems and placed in an ultra-low temperature freezer at −80 °C before freeze-drying for 72 h. Roots and stems were dried in an oven at 70 °C for 72 h. Shoot dry weights were determined by adding the dry weights of stems and leaves. For the total dry weights, stem, shoot, and root dry weights from each plant were combined.

2.4. Leaf Chlorophyll Concentrations

Chlorophyll concentrations were determined in fully expanded leaves in the mid-parts of the shoots in six randomly selected seedlings per treatment combination per species (n = 6). The leaves were dried in a freeze-drier (Freeze Dry Lyph-Lock, Labconco, Kansas City, MO, USA) for 72 h and ground in a Thomas Wiley Mini-Mill (Thomas Scientific, Swedesboro, NJ, USA). Chlorophyll was extracted from the leaf samples (10 mg dry weights) with 8 mL dimethyl sulfoxide (DMSO) at 65 °C for 22 h. DMSO is a preferred organic solvent compared with acetone due to its low toxicity and more stable chlorophyll extracts [41]. After filtering, chlorophyll concentrations were measured in DMSO extracts with a spectrophotometer (Genesys 10S UV-Vis, Thermo Fisher Scientific, Waltham, MA, USA), at 648 nm and 665 nm for chlorophyll-a and chlorophyll-b concentrations using the Arnon’s equation of Chla = 14.85A665–5.14A648 and Chlb = 25.48A648–7.36A665 (A—absorbance) [42]. The total chlorophyll concentration was calculated by combining chlorophylls a and b.

2.5. Net Photosynthesis (Pn) and Transpiration (E) Rates

Six seedlings per species were randomly taken from each treatment combination for the measurements of Pn and E after two months of treatments (n = 6). Pn and E rates were measured in the uppermost fully developed leaves using an infrared gas analyzer (LI-6400, LI-COR, Lincoln, NE, USA) at 400 μmol m−2 s−1 photosynthetic photon flux density (PPDF), 400 μmol mol−1 reference CO2 concentration, 200 μmol s−1 flow rate, and 20 °C leaf chamber temperature, at approximately 4–9 h after the onset of photoperiod. The leaves were acclimated in the leaf chamber of LI-6400 for about three minutes to obtain stable results.

2.6. Leaf Elemental Concentrations

Leaf elemental concentrations were determined in six plants of each species from each treatment combination (n = 6). Ground dry leaf samples (0.2 g dry weights) were digested with 10 mL 70% HNO3 and diluted with Milli-Q water to 40 mL. The concentrations of K, Mn, Na, Fe, Zn, B, Mg, Ca, P, and S in extracts were determined by Thermo iCAP6300 Duo inductively coupled plasma-optical emission spectrometer (ICP-OES) (Thermo Fisher Corp., Cambridge, UK). Standard reference materials NIST 1573 and blank samples were used for the quality control of the elemental analysis. Total N was analyzed by the Thermo FLASH 2000 Organic Elemental Analyzer (Thermo Fisher Scientific Inc., Bremen, Germany). Ground dry leaf samples (3 mg dry weight) were packed into a tin or silver capsule for the total N analysis.

2.7. Statistical Analysis

All data were analyzed by two-way ANOVA using the R software (Version 3.5.2, R Core Team, R Foundation for Statistical Computing, Vienna, Austria) to determine statistically significant (p ≤ 0.05) differences between treatments. Soil types and N&P levels were the main factors. Prior to ANOVA, the normality and homogeneity of variance of data were validated with Shapiro–Wilk’s and Levene’s tests, respectively. The data that did not meet the assumptions of normality of distribution and homogeneity of variance were transformed with a log10 function. Comparisons between the treatment means were conducted using Fisher’s LSD test. Principal component analysis (PCA) was conducted on all growth and physiological response parameters as well as leaf elemental concentrations of seedlings of both species treated with NST of two N&P supplement levels, to determine major sources of variation in NST treatment at different N&P nutrition levels. R software (version 4.4.3) package “factoextra” was used to conduct the PCA.

3. Results

3.1. Growth Substrate pH

The initial pH values of NST, NST + PMM, NST + FMM, PMM, and FMM substrates were 8.5, 7.5, 7.2, 5.8, and 5.9, respectively. The pH of NST containing substrates was the highest of all examined substrates. There were no significant differences in pH between the two NST soil amendments and two types of reclamation soils (Figure 1).

3.2. Plant Shoot Heights and Root Collar Diameters

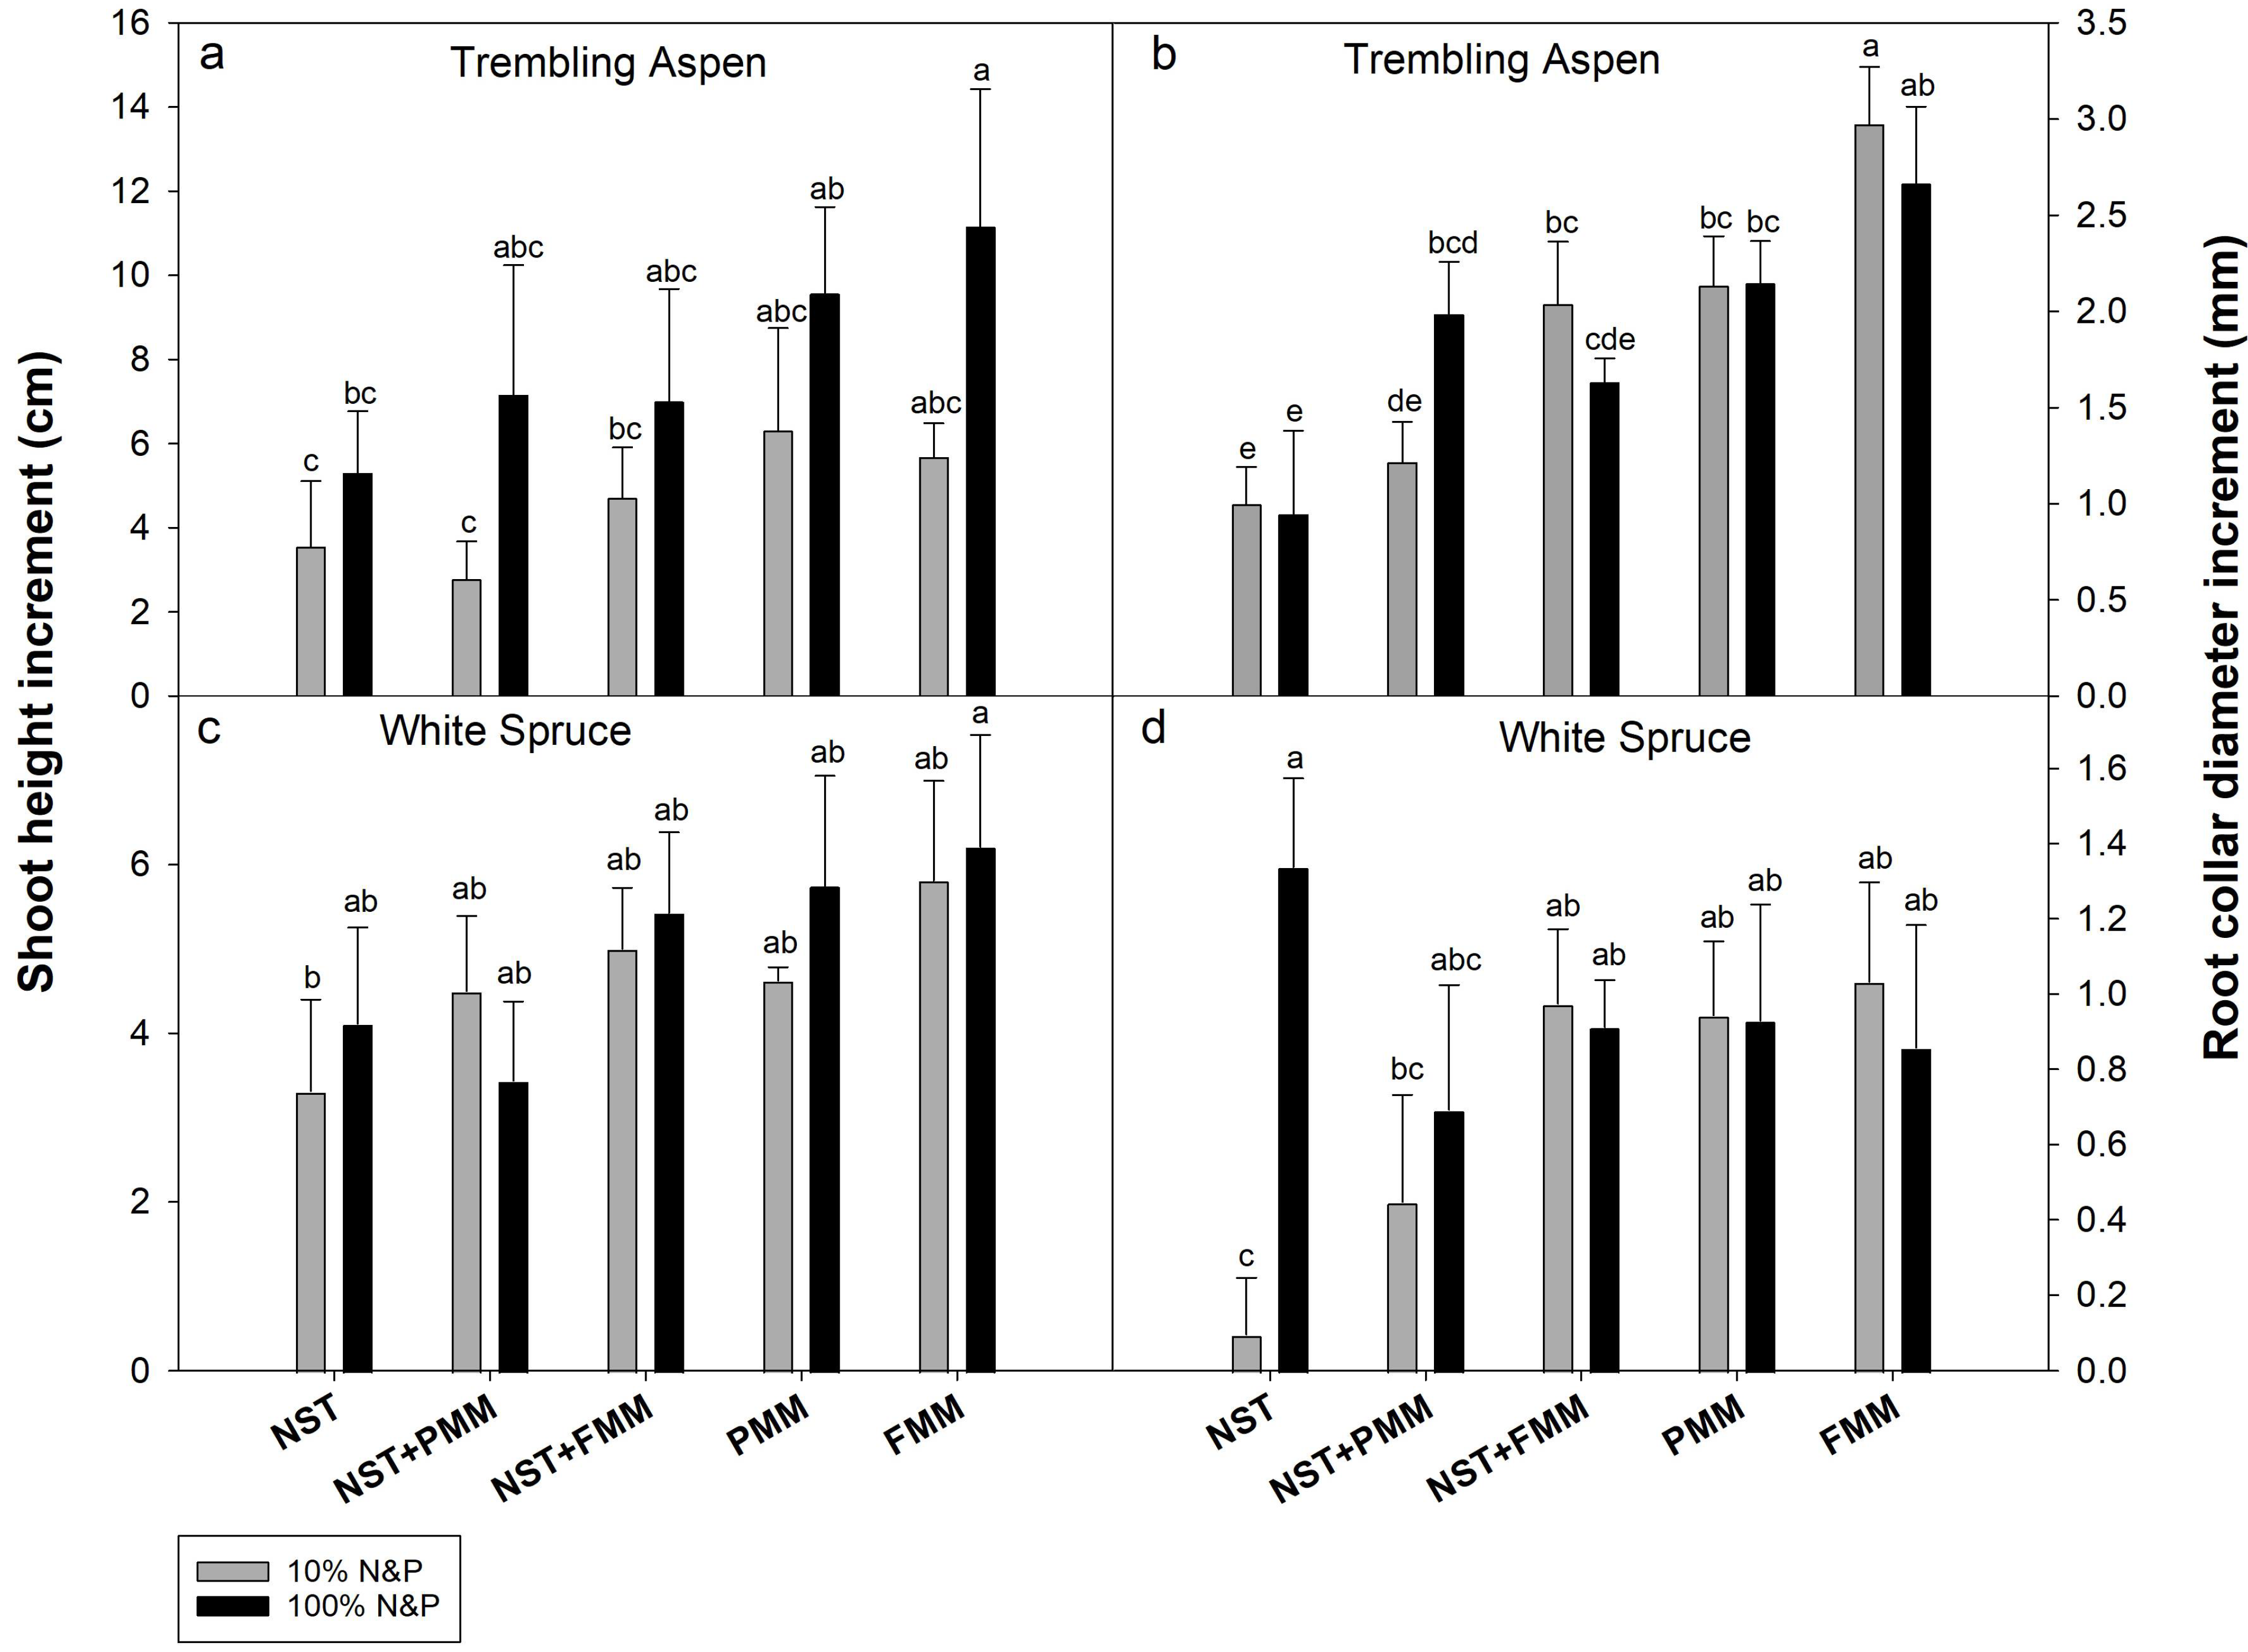
Overall, both trembling aspen and white spruce had the highest growth in FMM, while 100% N&P supplementation had higher or equal enhancement in seedling growth compared with 10% N&P (Figure 2). In trembling aspen, there were significant effects of N&P supplementation levels on height growth. The height growth of seedlings grown in FMM was about 80% greater compared with NST at 100% N&P level (Figure 2a). In trembling aspen, there were significant effects of substrate on the root collar diameter growth (Figure 2b). The root collar diameter growth measured in seedlings grown in NST + FMM, PMM, and FMM was approximated one- to three-fold greater compared with NST and NST + PMM at 10% N&P level (Figure 2b). The root collar diameter growth of seedlings grown in NST + PMM, PMM, and FMM was about 80% to 150% greater compared with NST at 100% N&P level (Figure 2b). In white spruce, the shoot height growth of seedlings grown in FMM with 100% N&P supplementation was about 60% higher compared with NST at 10% N&P level (Figure 2c). The root collar diameter growth measured in seedlings grown in NST + FMM, PMM, and FMM was about three- to six-fold higher than in NST at 10% N&P level (Figure 2d).

3.3. Dry Weights

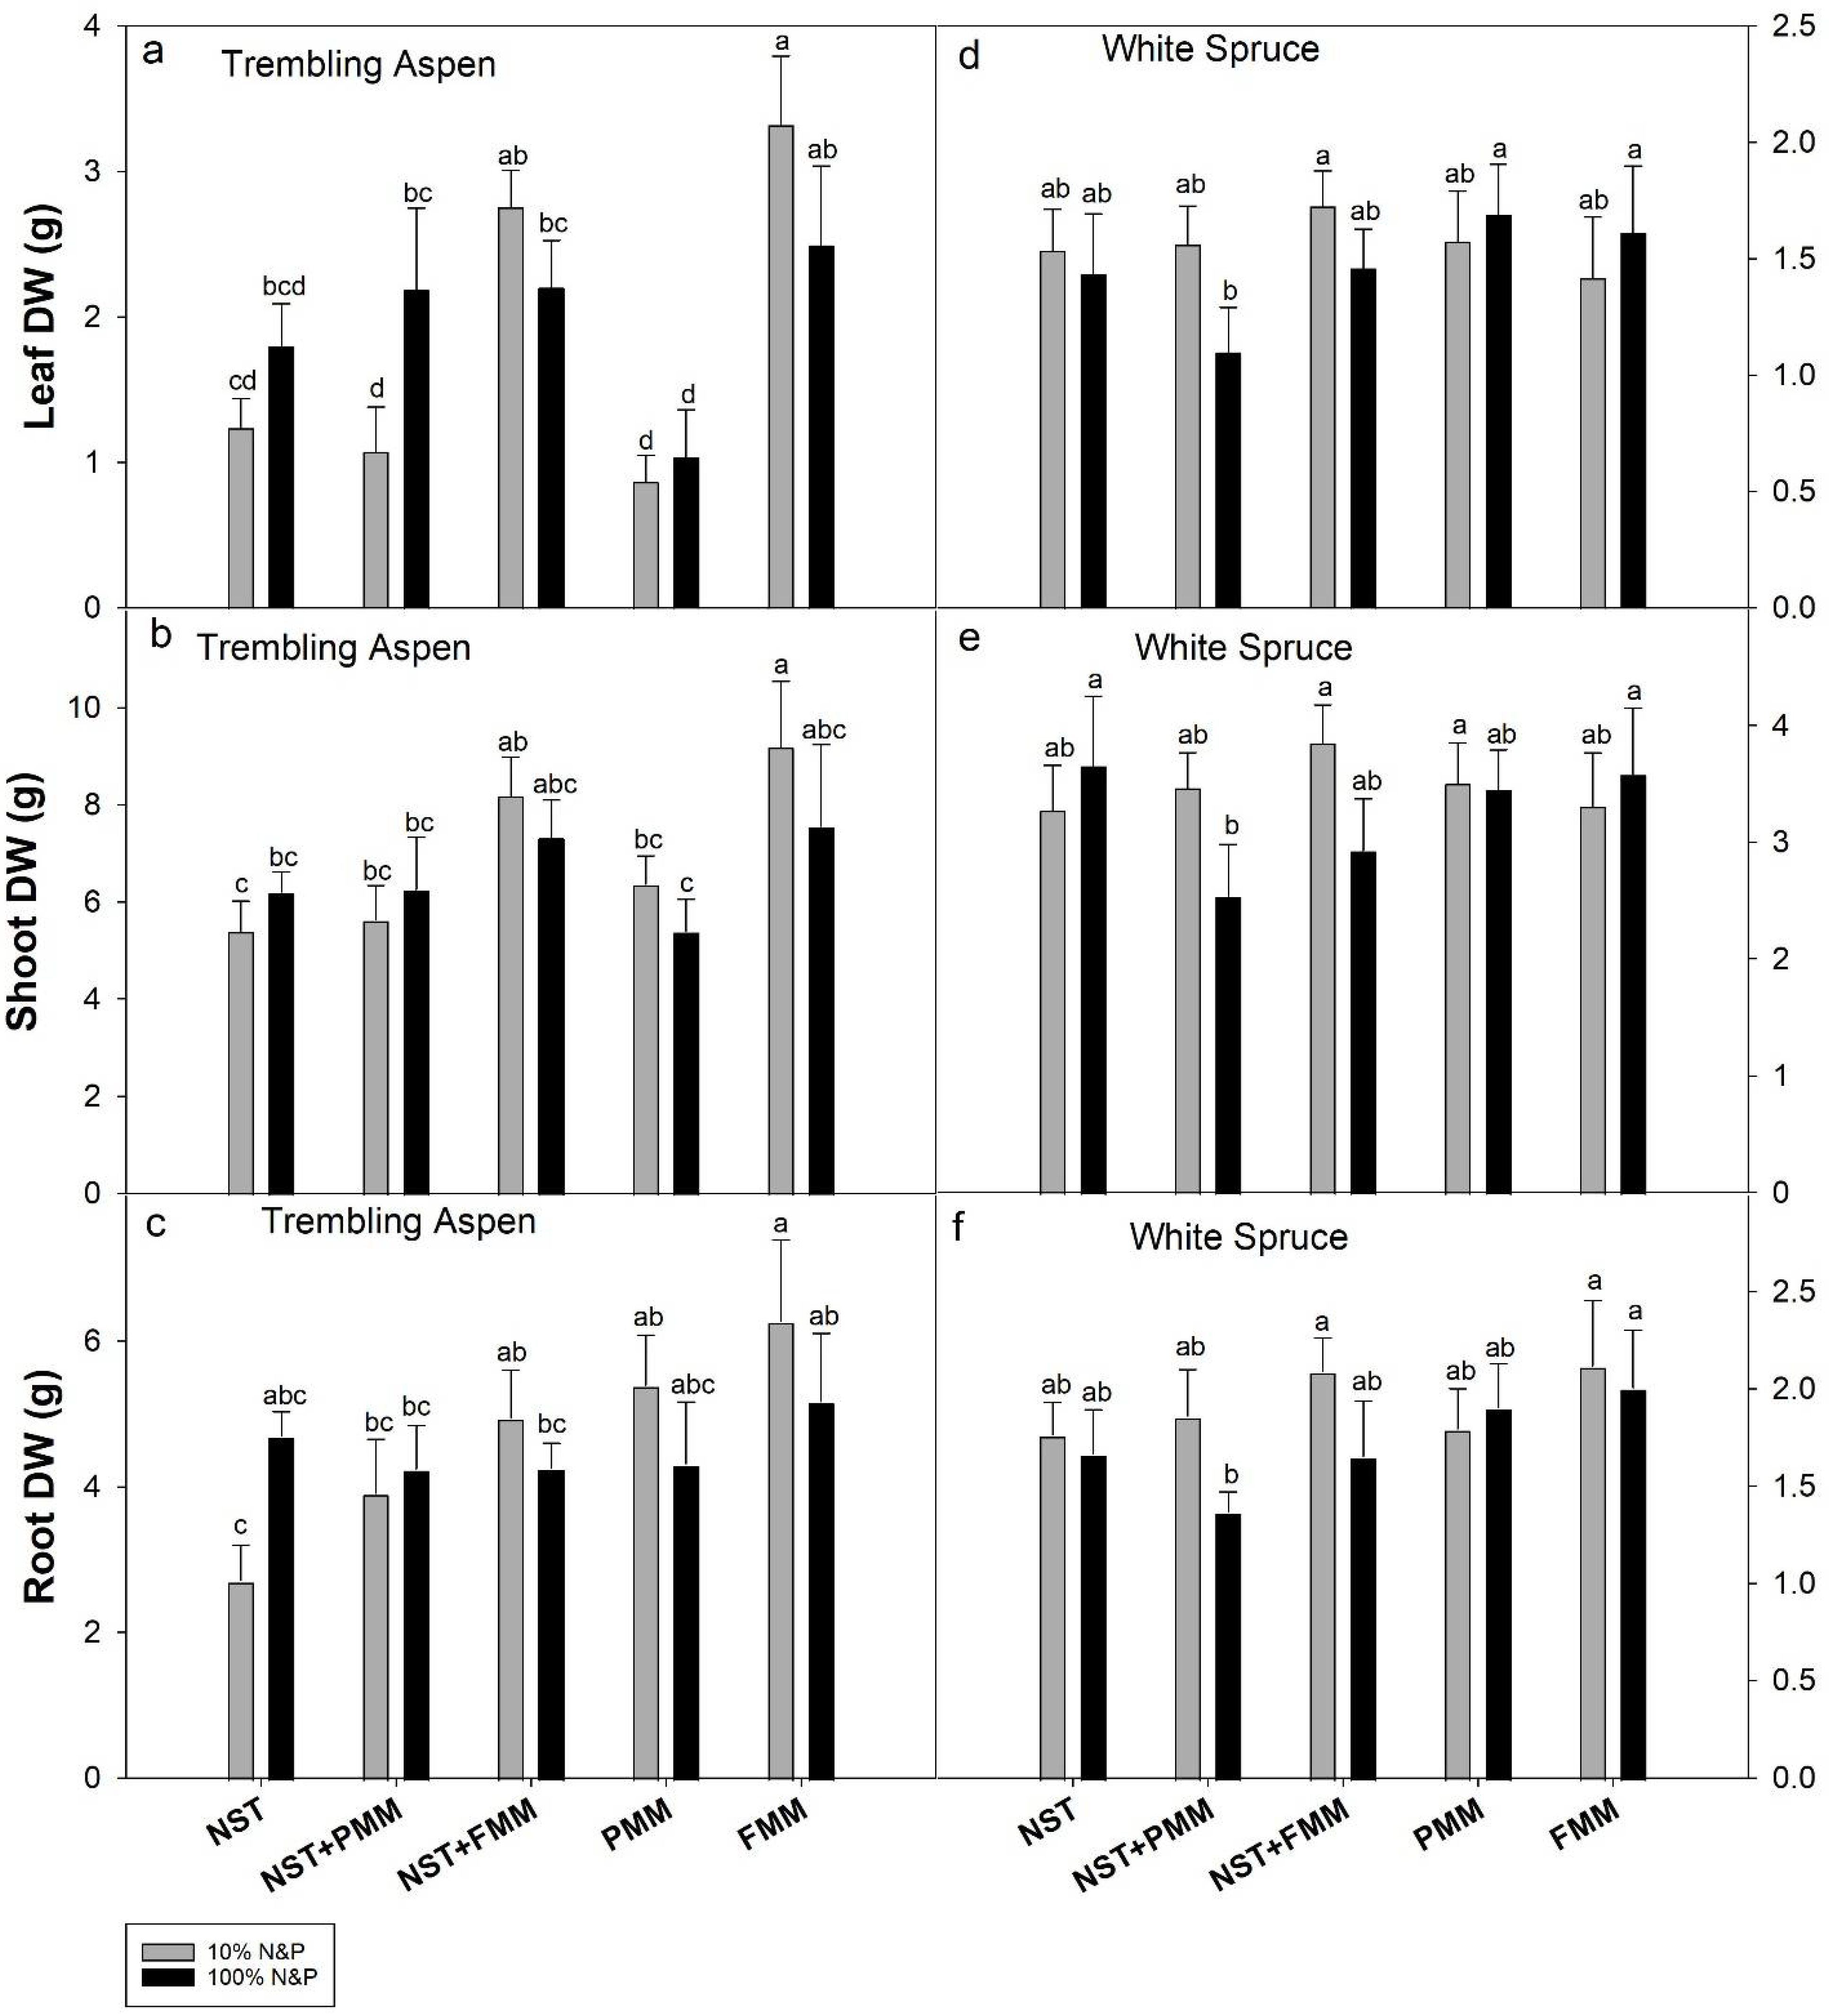
In trembling aspen, the leaf dry weights measured in NST + FMM and FMM were about 80% to 300% higher compared with NST, NST + PMM, and PMM at 10% N&P level (Figure 3a). The leaf dry weights measured in NST + PMM, NST + FMM, and FMM were about 70% to 100% higher than in PMM at 100% N&P level (Figure 3a). The shoot dry weights of plants grown in FMM were about 30% to 50% higher than in NST, NST + PMM, and PMM at 10% N&P level (Figure 3b). The root dry weights of seedlings treated with FMM were about two-fold higher than with NST at 10% N&P level (Figure 3c).
In white spruce, the leaf dry weights of seedlings grown in NST + PMM with 10% N&P, PMM, and FMM with 100% N&P, were about 60% higher than in NST + PMM of 100% N&P (Figure 3d). The shoot and root dry weights of seedlings were the lowest in NST + PMM with 100% N&P (Figure 3e,f).

3.4. Net Photosynthesis (Pn) and Transpiration (E) Rates

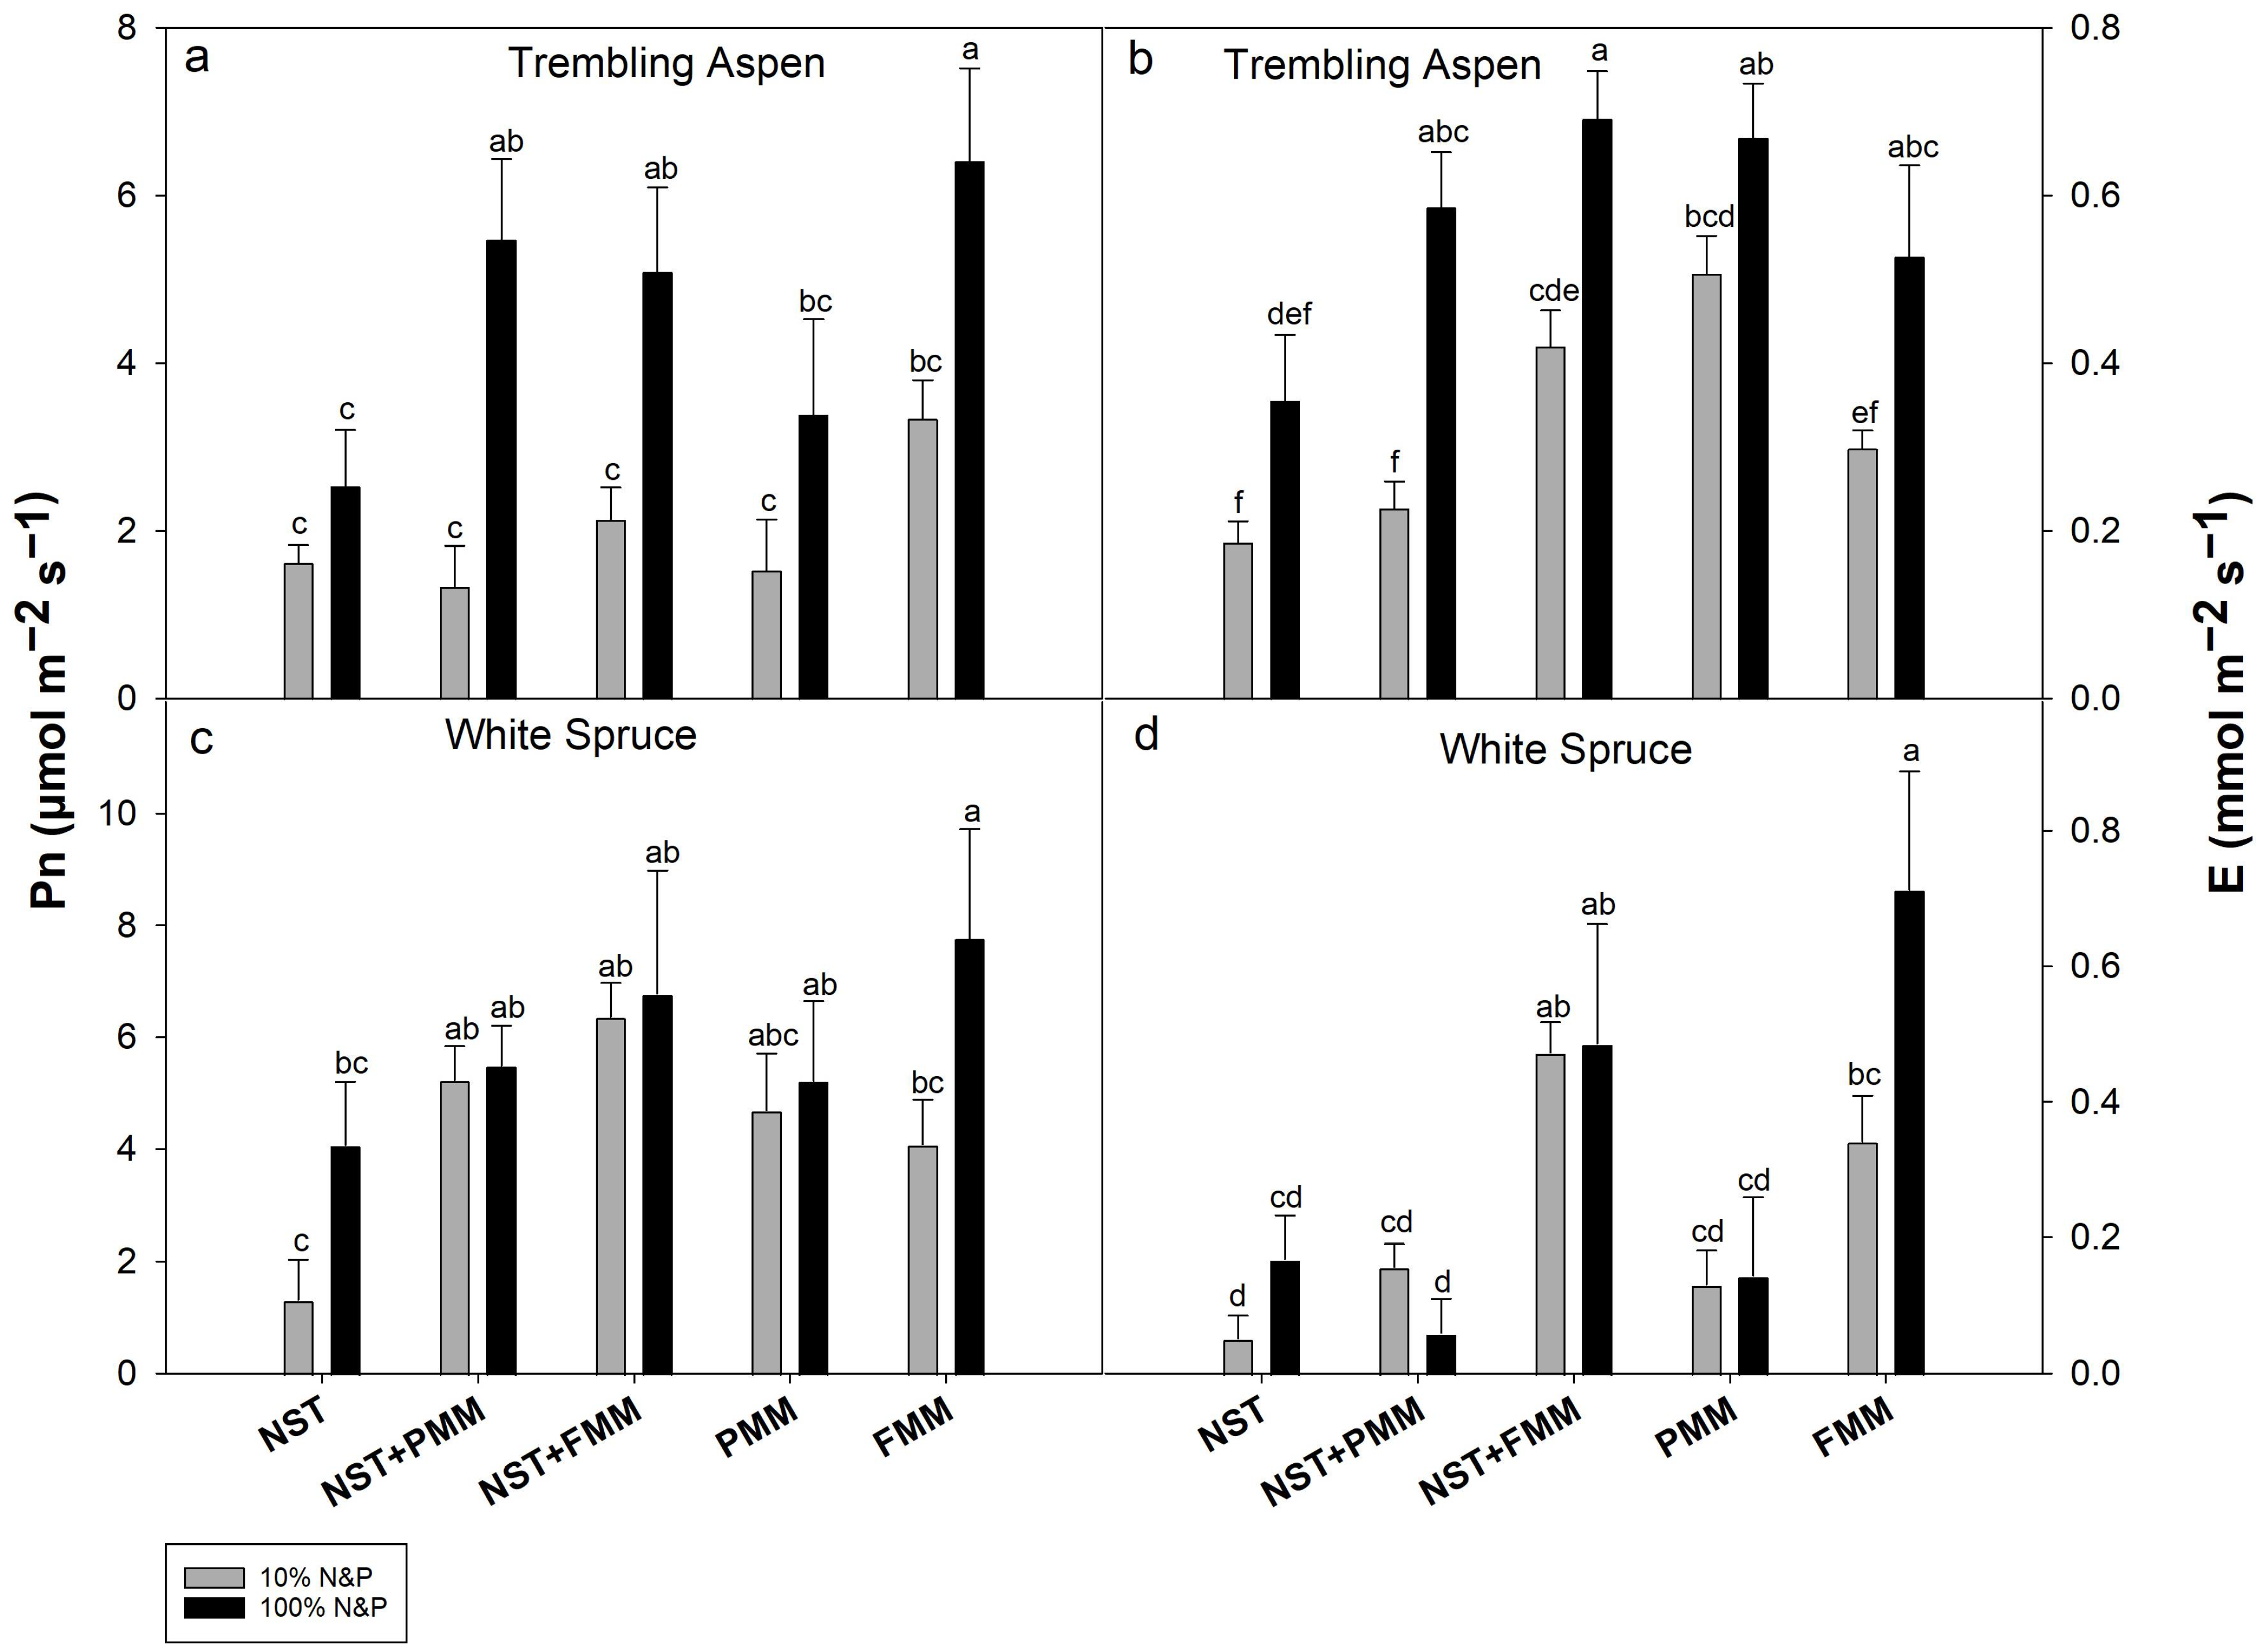
Overall, 100% N&P supplementation had greater benefits for Pn and E in trembling aspen compared with white spruce (Figure 4). In trembling aspen, Pn measured in plants grown in NST was about 30% to 60% lower compared with NST + PMM, NST + FMM, and FMM at 100% N&P level (Figure 4a). E measured in plants grown in NST and NST + PMM with 10% N&P were approximately 30% to 50% lower compared with NST + FMM and PMM (Figure 4b). Overall, both Pn and E of seedlings treated with 100% N&P were significantly higher than with 10% N&P in each growth substrate (Figure 4a,b).
In white spruce, Pn measured in plants grown in NST was 40% to 60% lower than in other substrates at 10% N&P level; while the Pn measured in plants grown in NST was around 30% lower compared with FMM at 100% N&P level (Figure 4c). E measured in plants grown in NST + FMM was about three- to four-fold higher compared with NST, NST + PMM, and PMM at 10% N&P level; E measured in NST + FMM and FMM-grown plants were about three- to six-fold higher than in the other three types of substrates at 100% N&P level (Figure 4d).

3.5. Chlorophyll Concentrations

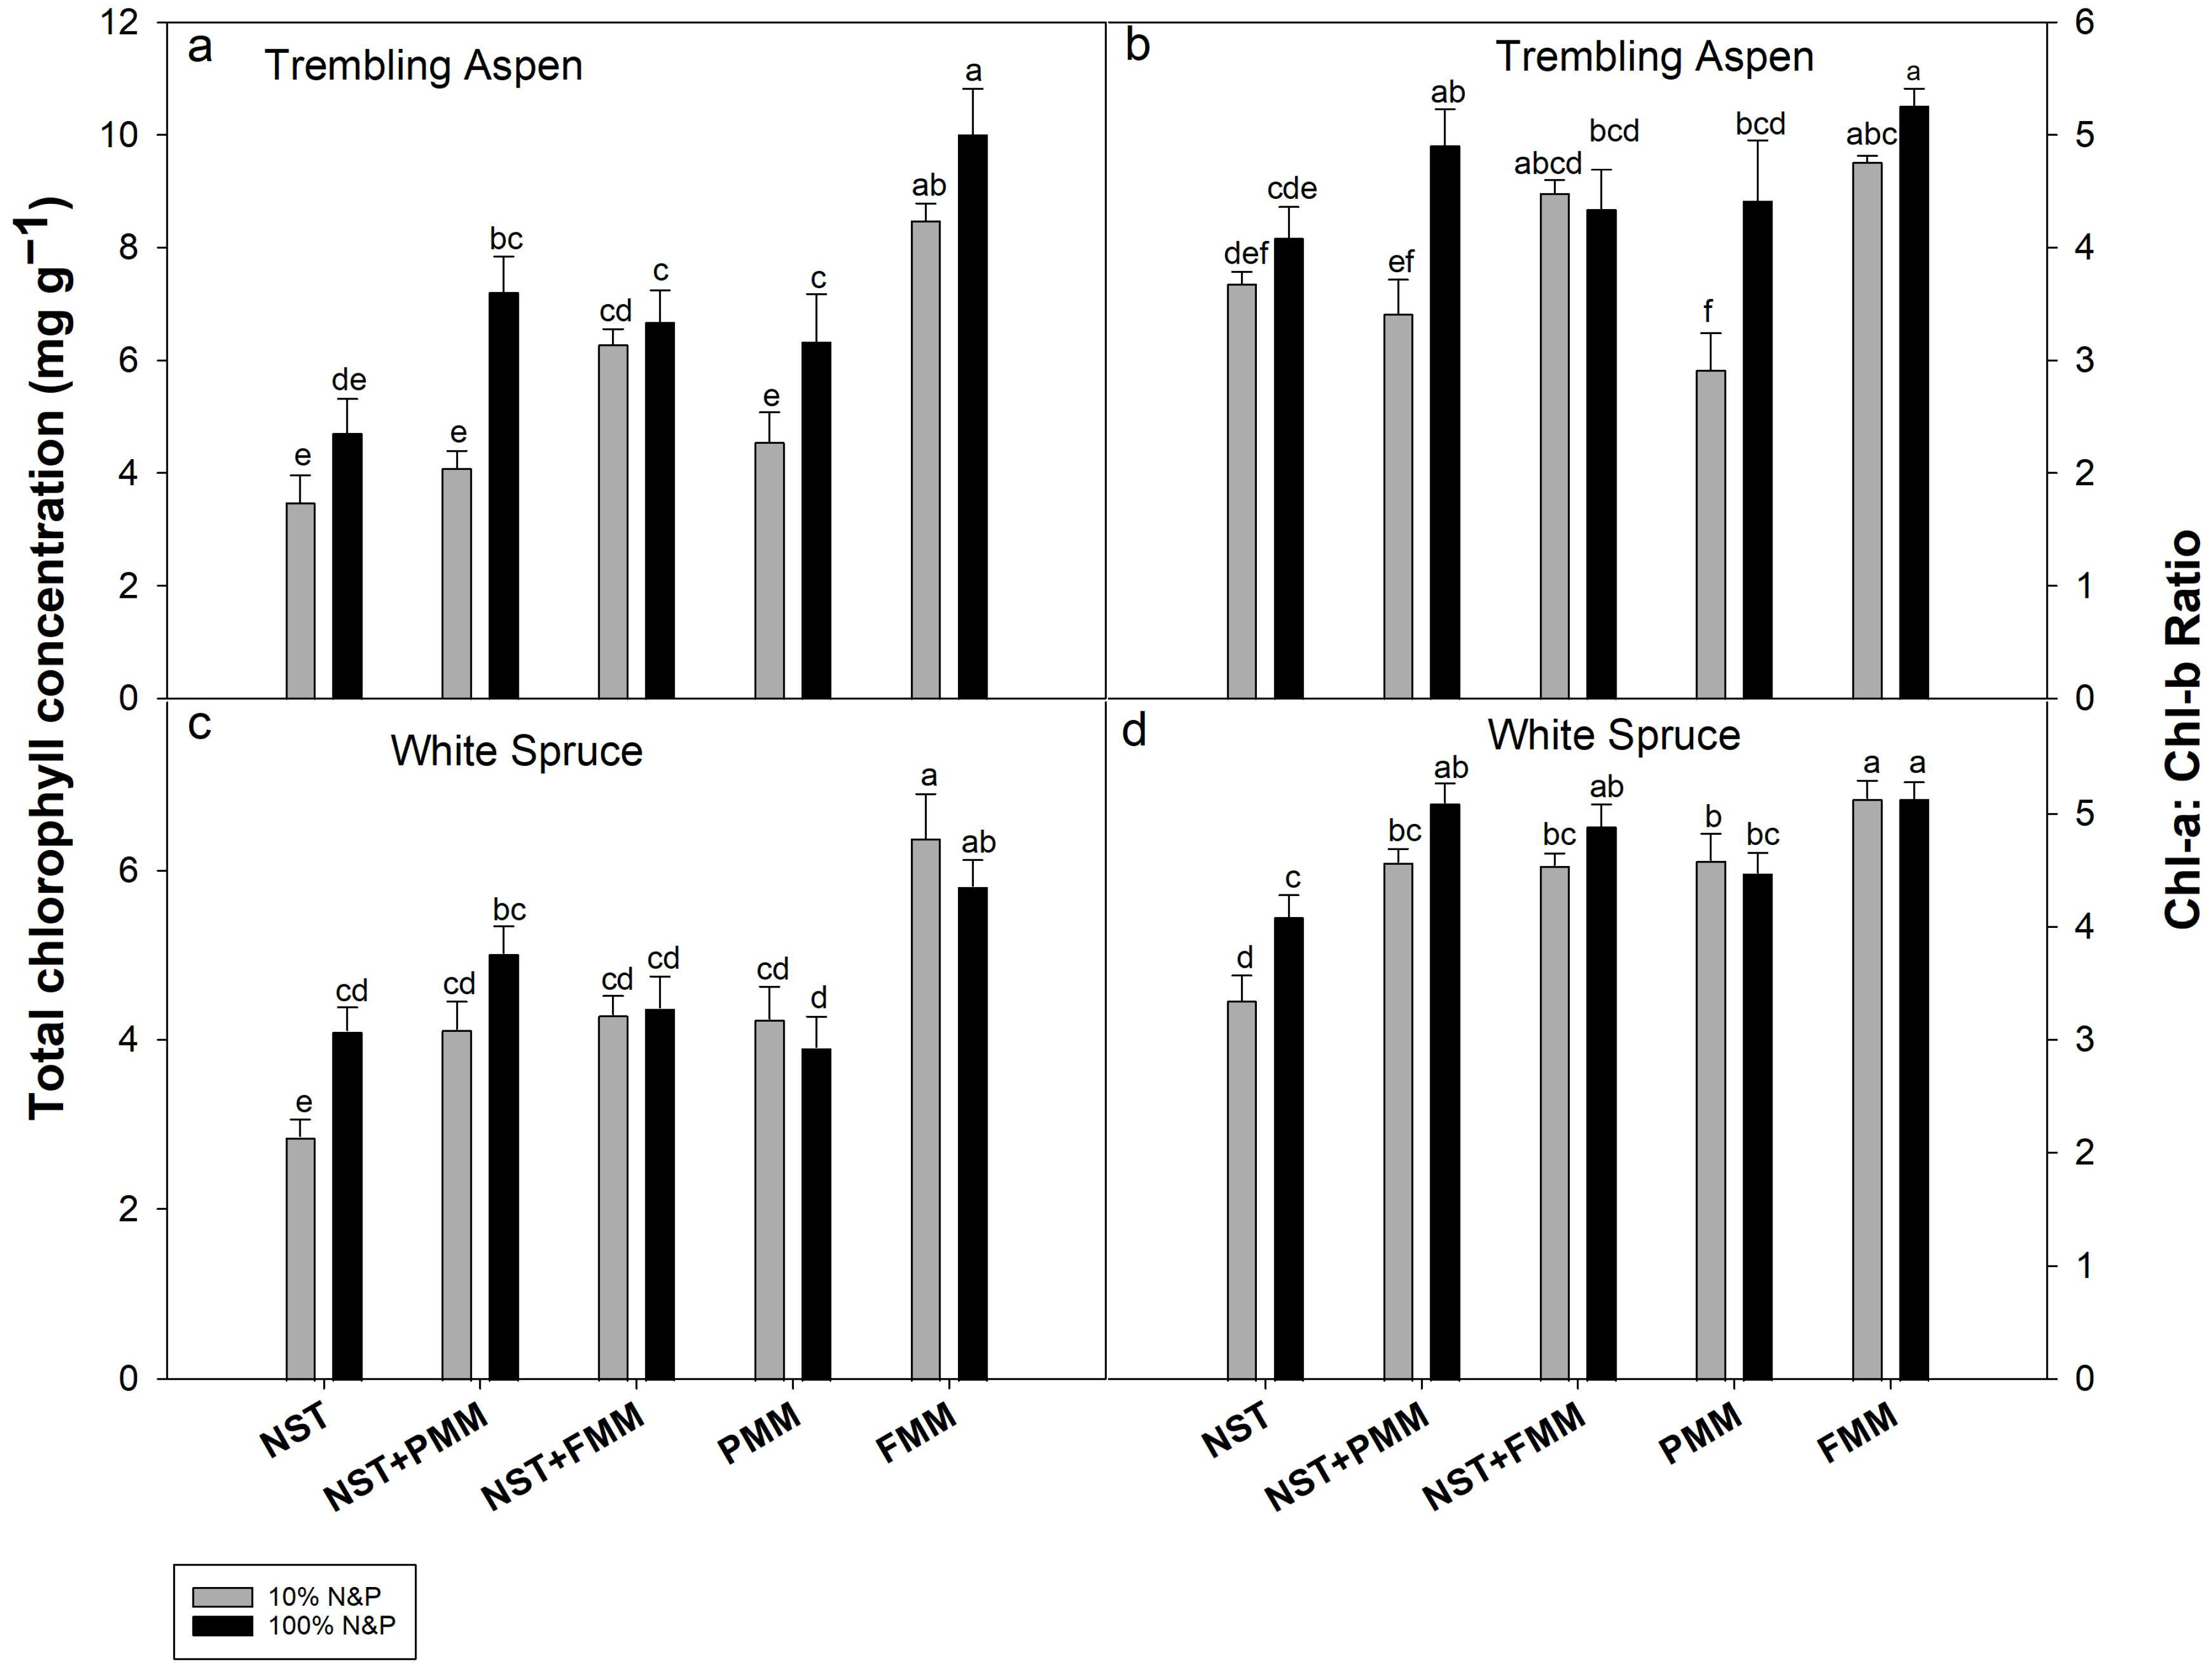
Overall, both trembling aspen and white spruce seedlings growing in FMM had the highest leaf chlorophyll concentration, while 100% N&P supplementation did not notably increase chlorophyll concentrations compared with 10% N&P for seedlings grown in most of the treatment substrates (Figure 5). In trembling aspen, the total chlorophyll concentrations measured in NST, NST + PMM, and PMM were around 30% to 50% lower than in NST + FMM and FMM at 10% N&P level (Figure 5a). The total chlorophyll concentrations measured in trembling aspen grown in NST were about 20% to 40% lower than in the other types of substrates at 100% N&P level (Figure 5a). In trembling aspen, chl-a: chl-b ratios measured in plants grown in FMM were about 20% to 40% higher compared with NST, NST + PMM, and PMM at 10% N&P level (Figure 5b). The ratios measured in trembling aspen grown in FMM were approximately 15% higher than plants grown in NST, NST + FMM, and PMM at 100% N&P level (Figure 5b).
In white spruce, the total chlorophyll concentrations measured in NST were about 10% to 30% lower than in the other four types of substrates at 10% N&P level. The total chlorophyll concentrations in plants grown in FMM were approximately 10% to 20% higher compared with NST, NST + FMM, and PMM at 100% N&P level (Figure 5c). In white spruce, the chl-a–chl-b ratio measured in NST-grown plants was about 20% to 30% lower than in the other types of substrates at 10% N&P level. The ratios measured in NST-grown plants were about 10% to 20% lower than in NST + PMM, NST + FMM, and FMM at 100% N&P level (Figure 5d).

3.6. Leaf Elemental Concentrations

Only the concentrations of total N, P, Mn, and B were presented in Figure 6; as for other elements, the differences between treatments were overall non-significant. Overall, compared with 10% N&P supplementation, 100% N&P did not result in notably higher leaf N and P concentrations in seedlings grown in the same substrate (Figure 6). In trembling aspen, leaf total N concentrations measured in plants grown in NST were approximately 10% lower compared with PMM at 100% N&P level (Figure 6a). Leaf P concentrations measured in trembling aspen grown in NST were about 20% higher compared with PMM and FMM at 10% N&P level (Figure 6b). Leaf Mn concentrations of aspen grown in NST + FMM were about three to four-fold higher compared with NST, NST + PMM, and PMM at both N&P levels (Figure 6c). Leaf B concentrations measured in trembling aspen grown in NST were about 50% to three-fold higher compared with other types of substrates at both N&P levels (Figure 6d).
In white spruce, leaf total N concentrations of seedlings grown in NST were about 15% lower than in FMM at 10% N&P level, while the total N concentrations in NST-grown plants were about 10% to 15% lower than in NST + PMM and FMM at 100% N&P level (Figure 6e). Leaf P concentrations measured in NST-grown plants were approximately 15% higher than in PMM and FMM at 10% N&P level (Figure 6f). Leaf Mn concentrations of white spruce grown in NST + FMM and FMM were about 30% to 100% higher than other types of substrates at both N&P levels (Figure 6g). Leaf B concentrations measured in NST-grown plants were twice the level present in the other types of substrates at 10% N&P level; while leaf B concentrations measured in white spruce grown in NST were about 80% higher than in NST + PMM, PMM, and FMM at 100% N&P level (Figure 6h).

3.7. Principal Component Analysis

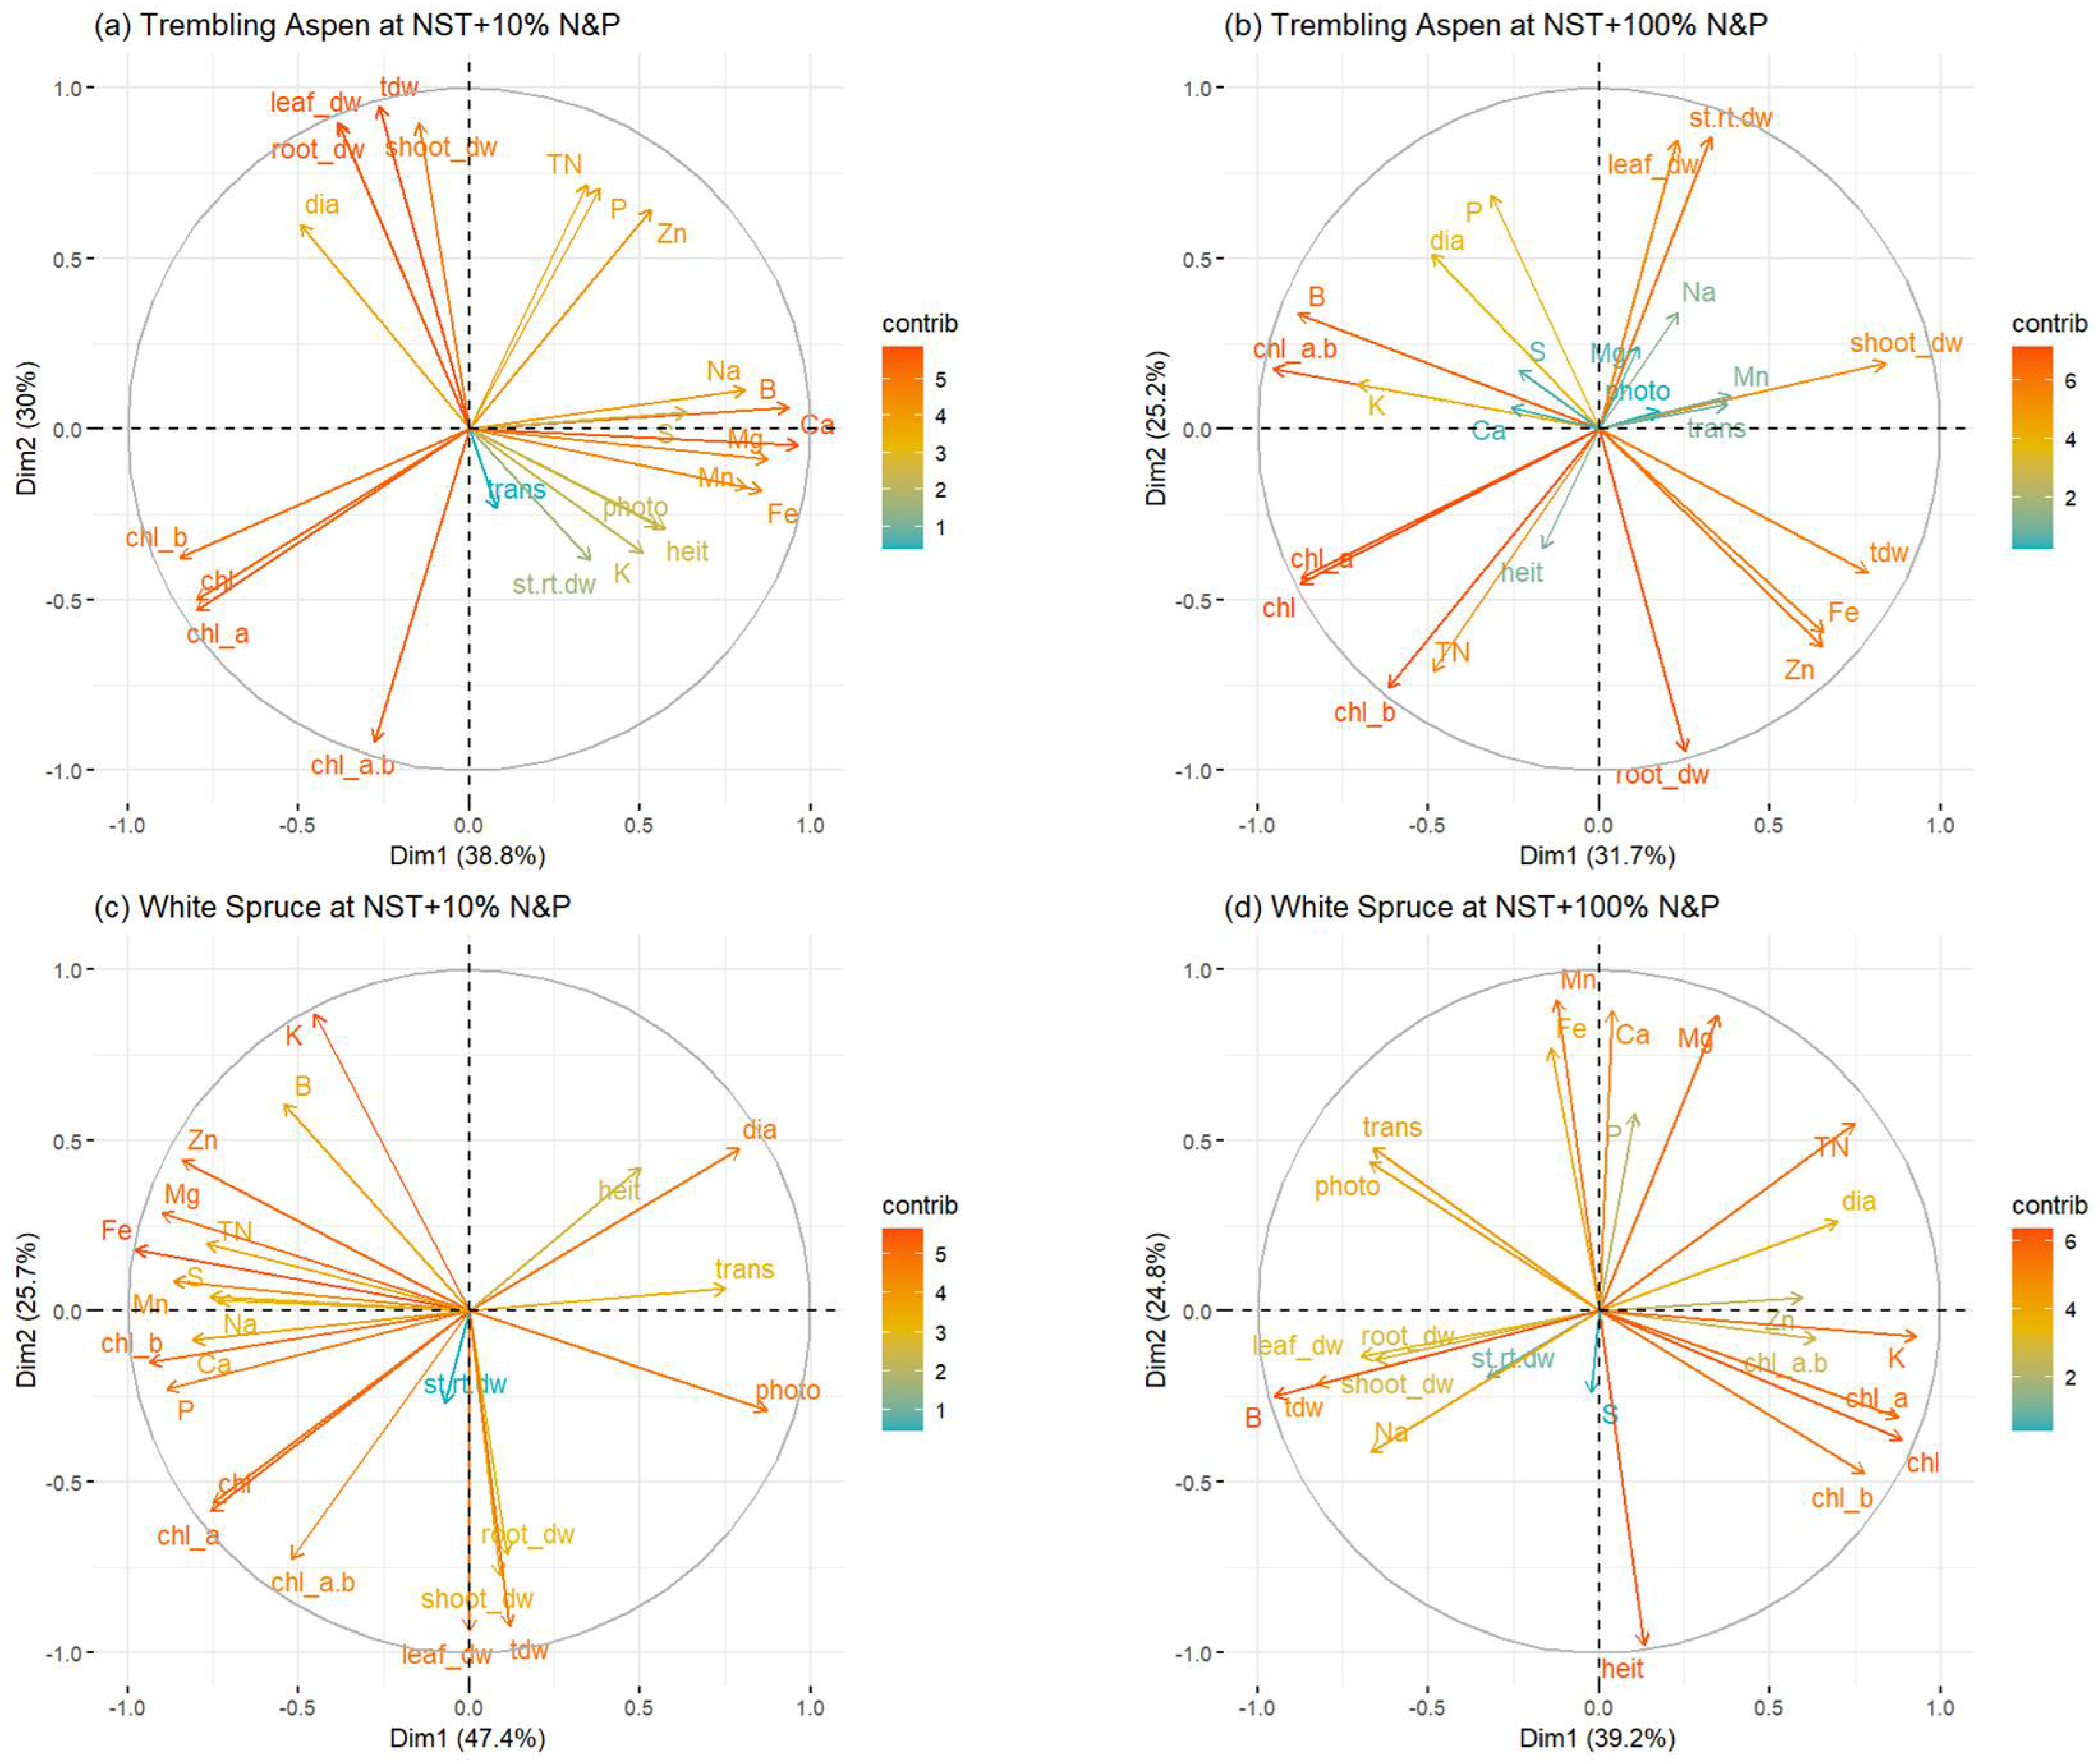
In trembling aspen seedlings treated with NST and 10% N&P, the first principal component (Dim1, 38.8%) and the second principal component (Dim2, 30%) together explained 68.8% of the total variation in all measured growth and physiological responses (Figure 7a). Dim1 was more positively correlated with leaf elemental concentrations of Na, B, Mg, Ca, Fe, Mn, photosynthesis, and height growth, while negatively correlated with leaf chlorophyll concentrations (Figure 7a). Dim2 was more positively correlated with root collar diameter growth, leaf, shoot, and root dry weights (Figure 7a). In trembling aspen seedlings treated with NST and 100% N&P, the first principal component (Dim1, 31.7%) and the second principal component (Dim2, 25.2%) together accounted for 56.9% of the total variation (Figure 7b). Overall, the correlation between growth and physiological response variables of seedlings grown in NST + 100% N&P was not as big as in NST + 10% N&P (Figure 7b). Dim1 was more positively correlated with shoot dry weights and negatively correlated with leaf B concentration and chlorophyll a to b ratio (Figure 7b). Dim2 was negatively correlated with root dry weights and positively correlated with leaf and shoot dry weights and leaf P concentration (Figure 7b).
In white spruce seedlings treated with NST and 10% N&P, the first principal component (Dim1, 47.4%) and the second principal component (Dim2, 25.7%) together explained 73.1% of the total variation (Figure 7c). The Dim1 was more positively correlated with photosynthesis, transpiration, shoot height, and root collar diameter growth, while negatively correlated with leaf elemental and chlorophyll concentrations; whereas, the Dim2 was more negatively correlated with the plant dry weights (Figure 7c). In seedlings treated with NST and 100% N&P, the first principal component (Dim1, 39.2%) and second principal component (Dim2, 25.8%) together explained 64% of the total variation (Figure 7d). Dim1 was more positively correlated with leaf K and Zn concentrations while negatively correlated with plant dry weights and leaf Na concentration; Dim2 was more positively correlated with leaf Mn, Fe, Ca, and P concentrations and negatively correlated with shoot height growth (Figure 7d).

4. Discussion

The present study reports the effects of 10% and 100% N&P supplementation in NST, NST + PMM, NST + FMM, PMM, and FMM growth substrates on growth and physiological responses of trembling aspen and white spruce. All substrates that contained NST had higher pH compared with FMM and PMM. Overall, growth of plants treated with NST was impeded compared with FMM and PMM, and plants had the highest growth in FMM. Supplementation of 100% N&P improved photosynthesis and transpiration rates in both species; however, probably due to the relatively short treatment period, this benefit was not markedly reflected in growth responses. We also found that trembling aspen treated with NST had elevated leaf B concentrations.
Previous studies demonstrated that trembling aspen was less tolerant of high pH than white spruce [43]. NST had an extremely high sodium adsorption ratio (83) compared with reclamation soils (0.7–2.4) [44]. Therefore, the stress responses in trembling aspen were likely largely due to the high pH of NST, while those in white spruce were likely due to the elevated levels of sodium in NST. The results of shoot and root dry weights in trembling aspen grown in NST also demonstrated that high root zone pH is inhibitory to both shoot and root growth [45], since high pH can reduce shoot water potential [43] and the aquaporin-mediated root water flux [46]. In addition, the high pH of NST can also limit the formation of lateral roots and root hairs and inhibit cell elongation in roots [45]. However, due to the fine texture of NST, poor root aeration could be another factor that negatively affected the root growth of plants [44]. The highest dry weights of trembling aspen grown in FMM could be partially attributed to the lower pH of FMM which can benefit plant growth [11]. In white spruce, the chlorophyll-a–chlorophyll-b ratios measured in NST-grown plants were the lowest, indicating that chlorophyll-a was more affected by NST than chlorophyll-b, likely because chlorophyll-a is chemically less stable than chlorophyll-b [47], and the reduced chlorophyll a to b ratio could have a stronger inhibitory effect on photosynthetic efficiency [48]. The decreases in Pn and E observed in white spruce in NST were associated with the decrease in total chlorophyll concentrations. The limitations of Pn and E were also associated with the negative effects of high pH on root water transport and its delivery to leaves, resulting in a decrease in stomatal conductance and reduced CO2 uptake [45].
As expected, addition of PMM and FMM to NST had positive effects on trembling aspen and white spruce under the two different levels of N&P treatments through lowering pH of NST and supplementing mineral nutrients [3]. These benefits might also be partially attributed to the improvement of physical properties of NST to increase its air availability for root respiration [44]. However, NST + FMM was a better growth substrate compared with NST + PMM for trembling aspen at the 10% N&P level, which could be due to the lower carbon-to-nitrogen ratios of FMM than PMM, providing more nitrogen for plants [11]. The results also showed that white spruce was less affected by NST + PMM and NST + FMM at both levels of N&P compared with trembling aspen, which was likely due to the slower growth of white spruce compared with trembling aspen [49].
Since high soil pH commonly reduces the availability of Fe, Mn, P, and Zn [30], the high pH of NST may affect the availability of these elements for revegetated plants growing in reclamation sites affected by NST. When fertilized with 10% N&P level, leaf Mn concentrations in trembling aspen grown in NST were significantly lower than in NST + FMM. As for white spruce, leaf Mn concentrations in NST were significantly lower than in NST + FMM and FMM. The results indicate that NST had negative effects on leaf Mn concentrations of trembling aspen and white spruce mentioned above. When provided with 100% N&P, leaf Mn concentrations of trembling aspen in NST were significantly lower than in NST + FMM and FMM, leaf total N concentrations of trembling aspen in NST were significantly lower than in PMM. Leaf Mn and total N concentrations of white spruce in NST were significantly lower than in NST + FMM and FMM, FMM, NST + PMM, and FMM, respectively. Mn is one of the most commonly deficient nutrients in plants growing in soil with high pH, which can inhibit chlorophyll synthesis and photosynthetic processes [30]. The highest foliar B concentrations in trembling aspen and white spruce seedlings grown in NST were approximately 350 and 150 mg kg−1, respectively. Previous studies reported that poplar leaves could accumulate B concentration to 845 mg kg−1 without significant impairment of physiological functions [50]. Thus, it is unlikely that the foliar B concentration in trembling aspen (350 mg kg−1) results in phytotoxicity as a single factor. To our knowledge, there have been no studies reporting B toxicity levels in white spruce. However, elevated B levels could markedly aggravate the salinity stress in boreal trees [10]. Therefore, more studies are needed to determine the impact of elevated tissue B levels on plant growth and physiological performance at the oil sands reclamation sites.
N and P availability are the main nutritional factors limiting the growth of boreal trees due to their high demand and important roles in many processes in plants [51,52,53]. Therefore, the availability of N and P in soil may quickly affect plant growth. In trembling aspen, leaf dry weights measured in plants growing in NST + FMM, total chlorophyll concentrations in NST + PMM, NST + FMM and PMM, Pn and E in NST + PMM, NST + FMM and FMM were significantly higher when 100% N&P was provided compared with 10% N&P. In white spruce, root collar diameter growth and total chlorophyll concentrations measured in plants grown in NST, as well as Pn and E in FMM were significantly higher at the 100% N&P level compared with the 10% N&P level. More studies are needed to elucidate the detailed biochemical and molecular mechanisms of the benefits of 100% N&P supplementation in plant physiological responses to NST. Results from this study indicated that trembling aspen was more affected by N&P levels than white spruce. These differences were likely due to the rapid growth of trembling aspen compared with white spruce, which creates higher nutritional demand, particularly for nitrogen [54,55]. Future studies should analyze the bioavailability and chemical forms of supplemented nitrogen and phosphorus in the different treatment substrates. However, the direct application of the immediately available, water-soluble fertilizers may elevate soluble salt levels in the root zone which might aggravate the salinity stress of reclamation plants [56]. Other studies reported that controlled-release fertilizer demonstrated advantages in supplementing nitrogen and promoting growth in boreal reclamation plants at lower economical costs compared with immediately released fertilizers [57,58]. Biochar has also been shown to mitigate sodium toxicity of oil sands reclamation materials in greenhouse studies [59] and earthworms have a potential for degradation of crude oil hydrocarbons and improving soil physical properties [60]. All of these approaches or the combination of them should be examined for improving reclamation efforts at NST affected sites.
The PCA revealed that in trembling aspen grown in NST with 10% N&P supplementation, the leaf Na, B, Ca, Mg, Fe, and Mn levels and chlorophyll concentrations were negatively correlated and were the major contributors of Dim1 while the plant dry weights were the key factors of Dim2. However, with 100% N&P supplementation, the negative correlation between leaf elemental and chlorophyll concentrations was not as strong as with a 10% N&P level. In white spruce seedlings grown in NST with 10% N&P supplementation, the Dim1 was mainly accounted by gas exchange parameters and leaf elemental concentrations of Zn, Mg, TN, Fe, S, Mn, Na, Ca, and P, which were negatively correlated, while Dim2 was mainly explained by leaf, shoot, and root dry weights. While with 100% N&P supplementation, the correlation between various leaf elemental concentrations in contribution of principal components was not as close as with 10% N&P supplementation. Thus, for both species, higher N&P supplementation might potentially mitigate the deleterious effects of elevated Na and B levels in NST.

5. Conclusions

The results of this study demonstrate that the growth and physiological responses to NST of trembling aspen and white spruce significantly improved in PMM and FMM-amended substrates. FMM had greater benefits for plant growth compared with PMM when amended with NST. Trembling aspen was more affected by NST compared with white spruce. Supplementation of 100% N&P nutrient level was more effective in enhancing growth and physiological effects compared with 10% N&P, while the benefits were stronger in trembling aspen compared with white spruce.

Author Contributions

The work included in the manuscript is made by the contributions of the article’s authors as follows: Conceptualization, J.J.Z. and W.-Q.Z.; methodology, X.S.; formal analysis, X.S.; investigation, X.S. and W.-Q.Z.; data curation, X.S. and W.-Q.Z.; writing—original draft preparation, X.S.; writing—review and editing, X.S., J.J.Z. and W.-Q.Z.; visualization, X.S. and W.-Q.Z.; supervision, J.J.Z.; project administration, J.J.Z. and W.-Q.Z.; funding acquisition, J.J.Z. All authors have read and agreed to the published version of the manuscript.

Funding

This research was financially supported by Canadian Natural Resources Ltd. (CNRL) and Natural Sciences and Engineering Research Council of Canada (NSERC) Alliance grants program.

Institutional Review Board Statement

Not applicable.

Informed Consent Statement

Not applicable.

Data Availability Statement

The data presented in this study are available upon reasonable request from the corresponding author.

Acknowledgments

We appreciate the help from Ira Sherr, Rob Vassov and Gregory Hook of CNRL for this study.

Conflicts of Interest

The authors declare no conflicts of interest.

References

  1. Alberta Environment and Parks. Oil Sands Mine Reclamation and Disturbance Tracking by Year. 2023. Available online: http://osip.alberta.ca/library/Dataset/Details/27 (accessed on 7 March 2025).
  2. Oil Sands Vegetation Reclamation Committee. Guidelines for Reclamation to Forest Vegetation in the Athabasca Oil Sands Region; Alberta Environmental Protection. Report No. ESD/LM/99-1; Provincial Government of Alberta: Edmonton, AB, Canada, 1998.
  3. Howat, D. Acceptable Salinity, Sodicity and pH Values for Boreal Forest Reclamation; Alberta Environment; Environmental Sciences Division: Edmonton, AB, Canada, 2000. [Google Scholar]
  4. Valentine, D.W.; Kielland, K.; Chapin, F.S., III; McCuire, A.D.; Van Cleve, K. Patterns of biogeochemistry in Alaskan boreal forests. In Alaska’s Changing Boreal Forest; Oxford University Press: New York, NY, USA, 2006; pp. 241–269. [Google Scholar]
  5. Leatherdale, J.; Chanasyk, D.S.; Quideau, S. Soil water regimes of reclaimed upland slopes in the oil sands region of Alberta. Can. J. Soil Sci. 2012, 92, 117–129. [Google Scholar] [CrossRef]
  6. Jamro, G.M.; Chang, S.X.; Naeth, M.A. Organic capping type affected nitrogen availability and associated enzyme activities in reconstructed oil sands soils in Alberta, Canada. Ecol. Eng. 2014, 73, 92–101. [Google Scholar] [CrossRef]
  7. Kamaluddin, M.; Zwiazek, J.J. Naphthenic acids inhibit root water transport, gas exchange and leaf growth in aspen (Populus tremuloides) seedlings. Tree Physiol. 2002, 22, 1265–1270. [Google Scholar] [CrossRef]
  8. MacKenzie, M.D.; Quideau, S.A. Microbial community structure and nutrient availability in oil sands reclaimed boreal soils. Appl. Soil Ecol. 2010, 44, 32–41. [Google Scholar] [CrossRef]
  9. Calvo-Polanco, M.; Zwiazek, J.J.; Jones, M.D.; MacKinnon, M.D. Effects of NaCl on responses of ectomycorrhizal black spruce (Picea mariana), white spruce (Picea glauca) and jack pine (Pinus banksiana) to fluoride. Physiol. Plant. 2009, 135, 51–61. [Google Scholar] [CrossRef] [PubMed]
  10. Apostol, K.G.; Zwiazek, J.J.; MacKinnon, M.D. NaCl and Na2SO4 alter responses of jack pine (Pinus banksiana) seedlings to boron. Plant Soil 2002, 240, 321–329. [Google Scholar] [CrossRef]
  11. Alberta Environment and Water. Best Management Practices for Conservation of Reclamation Materials in the Mineable Oil Sands Region of Alberta; Prepared by MacKenzie, D. for the Terrestrial Subgroup; Best Management Practices Task Group of the Reclamation Working Group of the Cumulative Environmental Management Association: Fort McMurray, AB, Canada, 2011.
  12. Naeth, M.A.; Wilkinson, S.R.; Mackenzie, D.D.; Archibald, H.A.; Powter, C.B. Potential of LFH Mineral Soil Mixes for Reclamation of Forested Lands in Alberta; OSRIN Report No. TR-35. Oil Sands Research and Information Network; University of Alberta, School of Energy and the Environment: Edmonton, AB, Canada, 2013. [Google Scholar]
  13. Mackenzie, D.D.; Naeth, M.A. The role of the forest soil propagule bank in assisted natural recovery after oil sands mining. Restor. Ecol. 2010, 18, 418–427. [Google Scholar] [CrossRef]
  14. MacKenzie, D.D. Oil Sands Mine Reclamation Using Boreal Forest Surface Soil (LFH) in Northern ALBERTA. Ph.D. Thesis, University of Alberta, Department of Renewable Resources, Edmonton, AB, Canada, 2013. [Google Scholar]
  15. Hahn, A.S.; Quideau, S.A. Long-term effects of organic amendments on the recovery of plant and soil microbial communities following disturbance in the Canadian boreal forest. Plant Soil 2013, 363, 331–344. [Google Scholar] [CrossRef]
  16. Fung, M.Y.; Macyk, T.M. Reclamation of oil sands mining areas. In Reclamation of Drastically Disturbed Lands; Barnhisel, R.I., Darmody, R.G., Daniels, W.L., Eds.; American Society of Agronomy: Madison, WI, USA, 2000; Volume 41, pp. 755–774. [Google Scholar]
  17. CNRL (Canadian Natural Resources Limited). Stewardship Report to Stakeholders; CNRL (Canadian Natural Resources Limited): Calgary, AB, Canada, 2022. [Google Scholar]
  18. Zhang, W.Q.; Fleurial, K.; Moawad, M.; Vassov, R.; Macdonald, S.E.; Zwiazek, J.J. Growth responses of 20 boreal forest species to oil sands non-segregating tailings: Significance for reclamation. Restor. Ecol. 2023, 31, e13874. [Google Scholar] [CrossRef]
  19. Gundersen, P.; Sevel, L.; Christiansen, J.R.; Vesterdal, L.; Hansen, K.; Bastrup-Birk, A. Do indicators of nitrogen retention and leaching differ between coniferous and broadleaved forests in Denmark? For. Ecol. Manag. 2009, 258, 1137–1146. [Google Scholar] [CrossRef]
  20. Yan, E.R.; Hu, Y.L.; Salifu, F.; Tan, X.; Chen, Z.C.; Chang, S.X. Effectiveness of soil N availability indices in predicting site productivity in the oil sands region of Alberta. Plant Soil 2012, 359, 215–231. [Google Scholar] [CrossRef]
  21. Duan, M.; House, J.; Chang, S.X. Limiting factors for lodgepole pine (Pinus contorta) and white spruce (Picea glauca) growth differ in some reconstructed sites in the Athabasca oil sands region. Ecol. Eng. 2015, 75, 323–331. [Google Scholar] [CrossRef]
  22. Rowe, E.C.; Healey, J.R.; Edwards-Jones, G.; Hills, J.; Howells, M.; Jones, D.L. Fertilizer application during primary succession changes the structure of plant and herbivore communities. Biol. Conserv. 2006, 131, 510–522. [Google Scholar] [CrossRef]
  23. Walker, L.R.; Moral, R.D. Lessons from primary succession for restoration of severely damaged habitats. Appl. Veg. Sci. 2009, 12, 55–67. [Google Scholar] [CrossRef]
  24. Shrestha, R.K.; Lal, R. Changes in physical and chemical properties of soil after surface mining and reclamation. Geoderma 2011, 161, 168–176. [Google Scholar] [CrossRef]
  25. Duan, M.; Chang, S.X. Nitrogen fertilization improves the growth of lodgepole pine and white spruce seedlings under low salt stress through enhancing photosynthesis and plant nutrition. For. Ecol. Manag. 2017, 404, 197–204. [Google Scholar] [CrossRef]
  26. Dluzniewska, P.; Gessler, A.; Dietrich, H.; Schnitzler, J.P.; Teuber, M.; Rennenberg, H. Nitrogen uptake and metabolism in Populus x canescens as affected by salinity. New Phytol. 2007, 173, 279–293. [Google Scholar] [CrossRef]
  27. Fredeen, A.L.; Rao, I.M.; Terry, N. Influence of phosphorus nutrition on growth and carbon partitioning in Glycine max. Plant Physiol. 1989, 89, 225–230. [Google Scholar] [CrossRef] [PubMed]
  28. Lynch, J.; Lauchli, A.; Epstein, E. Vegetative growth of the common bean in response to phosphorus nutrition. Crop Sci. 1991, 31, 380–387. [Google Scholar] [CrossRef]
  29. George, E.; Horst, W.J.; Neumann, E. Adaptation of plants to adverse chemical soil conditions. In Marschner’s Mineral Nutrition of Higher Plants, 3rd ed.; Marschner, P., Ed.; Academic Press: London, UK, 2012; pp. 409–472. [Google Scholar]
  30. Clarkson, D.T.; Carvajal, M.; Henzler, T.; Waterhouse, R.N.; Smyth, A.J.; Cooke, D.T.; Steudle, E. Root hydraulic conductance: Diurnal aquaporin expression and the effects of nutrient stress. J. Exp. Bot. 2000, 51, 61–70. [Google Scholar] [CrossRef] [PubMed]
  31. Zhang, W.; Zwiazek, J.J. Responses of Reclamation Plants to High Root Zone pH: Effects of Phosphorus and Calcium Availability. J. Environ. Qual. 2016, 45, 1652–1662. [Google Scholar] [CrossRef]
  32. Bois, G.; Piche, Y.; Fung, M.Y.P.; Khasa, D.P. Mycorrhizal inoculum potentials of pure reclamation materials and revegetated tailing sands from the Canadian oil sand industry. Mycorrhiza 2005, 15, 149–158. [Google Scholar] [CrossRef]
  33. Dhar, A.; Comeau, P.G.; Karst, J.; Pinno, B.D.; Chang, S.X.; Naeth, A.M.; Vassov, R.; Bampfylde, C. Plant community development following reclamation of oil sands mine sites in the boreal forest: A review. Environ. Rev. 2018, 26, 286–298. [Google Scholar] [CrossRef]
  34. Bolan, N.S. A critical review on the role of mycorrhizal fungi in the uptake of phosphorus by plants. Plant Soil 1991, 134, 189–207. [Google Scholar] [CrossRef]
  35. Perala, D.A. Populus tremuloides Michx. In Silvics of North America: Volume 2. Hardwoods; Burns, R.M., Honkala, B.H., Eds.; Agriculture Handbook 654; USDA, Forest Service: Washington, DC, USA, 1990. [Google Scholar]
  36. Nienstaedt, H.; Zasada, J.C. Picea glauca (Moench) Voss. In Silvics of North America: Volume 1. Conifers; Burns, R.M., Honkala, B.H., Eds.; Agriculture Handbook 654; USDA, Forest Service: Washington, DC, USA, 1990. [Google Scholar]
  37. Renström, A.; Choudhary, S.; Gandla, M.L.; Jönsson, L.J.; Hedenström, M.; Jämtgård, S.; Tuominen, H. The effect of nitrogen source and levels on hybrid aspen tree physiology and wood formation. Physiol. Plant. 2024, 176, e14219. [Google Scholar] [CrossRef]
  38. Kronzucker, H.J.; Glass, A.D.; Yaeesh Siddiqi, M. Nitrate induction in spruce: An approach using compartmental analysis. Planta 1995, 196, 683–690. [Google Scholar] [CrossRef]
  39. Forsch, K.B.; Dhar, A.; Naeth, M.A. Effects of woody debris and cover soil types on soil properties and vegetation 4–5 years after oil sands reclamation. Restor. Ecol. 2021, 29, e13420. [Google Scholar] [CrossRef]
  40. Epstein, E. Mineral Nutrition of Plants: Principles and Perspectives; Wiley: New York, NY, USA, 1972. [Google Scholar]
  41. Barnes, J.D.; Balaguer, L.; Manrique, E.; Elvira, S.; Davison, A.W. A reappraisal of the use of DMSO for the extraction and determination of chlorophylls a and b in lichens and higher plants. Environ. Exp. Bot. 1992, 32, 85–100. [Google Scholar] [CrossRef]
  42. Sestak, Z.; Catský, J.; Jarvis, P.G. Plant Photosynthetic Production. Manual of Methods; Dr. W. Junk Publishers: The Hague, The Netherlands, 1971. [Google Scholar]
  43. Zhang, W.; Calvo-Polanco, M.; Chen, Z.C.; Zwiazek, J.J. Growth and physiological responses of trembling aspen (Populus tremuloides), white spruce (Picea glauca) and tamarack (Larix laricina) seedlings to root zone pH. Plant Soil 2013, 373, 775–786. [Google Scholar] [CrossRef]
  44. Zhang, W.; Fleurial, K.; Sherr, I.; Vassov, R.; Zwiazek, J.J. Growth and physiological responses of tree seedlings to oil sands non-segregated tailings. Environ. Pollut. 2020, 259, 113945. [Google Scholar] [CrossRef]
  45. Tang, C.; Cobley, B.T.; Mokhtara, S.; Wilson, C.E.; Greenway, H. High pH in the Nutrient Solution Impairs Water Uptake in Lupinus Angustifolius L. Plant Soil 1993, 155, 517–519. [Google Scholar] [CrossRef]
  46. Fischer, M.; Kaldenhoff, R. On the pH regulation of plant aquaporins. J. Biol. Chem. 2008, 283, 33889–33892. [Google Scholar] [CrossRef]
  47. Koca, N.; Karadeniz, F.; Burdurlu, H.S. Effect of pH on chlorophyll degradation and colour loss in blanched green peas. Food Chem. 2007, 100, 609–615. [Google Scholar] [CrossRef]
  48. Voitsekhovskaja, O.V.; Tyutereva, E.V. Chlorophyll b in angiosperms: Functions in photosynthesis, signaling and ontogenetic regulation. J. Plant Physiol. 2015, 189, 51–64. [Google Scholar] [CrossRef]
  49. Munson, A.D.; Margolis, H.A.; Brand, D.G. Seasonal nutrient dynamics in white pine and white spruce in response to environmental manipulation. Tree Physiol. 1995, 15, 141–149. [Google Scholar] [CrossRef]
  50. Robinson, B.H.; Green, S.R.; Chancerel, B.; Mills, T.M.; Clothier, B.E. Poplar for the phytomanagement of boron contaminated sites. Environ. Pollut. 2007, 150, 225–233. [Google Scholar] [CrossRef] [PubMed]
  51. McMillan, R.; Quideau, S.A.; MacKenzie, M.D.; Biryukova, O. Nitrogen mineralization and microbial activity in oil sands reclaimed boreal forest soils. J. Environ. Qual. 2007, 36, 1470–1478. [Google Scholar] [CrossRef]
  52. Jing, J.; Rui, Y.; Zhang, F.; Rengel, Z.; Shen, J. Localized application of phosphorus and ammonium improves growth of maize seedlings by stimulating root proliferation and rhizosphere acidification. Field Crops Res. 2010, 119, 355–364. [Google Scholar] [CrossRef]
  53. Duan, M.; House, J.; Liu, Y.; Chang, S.X. Contrasting responses of gross and net nitrogen transformations to salinity in a reclaimed boreal forest soil. Biol. Fertil. Soils 2018, 54, 385–395. [Google Scholar] [CrossRef]
  54. DeByle, N.V.; Winokur, R.P. Aspen: Ecology and Management in the Western United States; USDA Forest Service General Technical Report RM-119; Rocky Mountain Forest and Range Experiment Station: Fort Collins, CO, USA, 1985. [Google Scholar]
  55. Peterson, E.B.; Peterson, N.M. Ecology and silviculture of trembling aspen. For. Chron. 1996, 5, 28–44. [Google Scholar]
  56. Shaviv, A.; Mikkelsen, R.L. Controlled-release fertilizers to increase efficiency of nutrient use and minimize environmental degradation—A review. Fert. Res. 1993, 35, 1–12. [Google Scholar] [CrossRef]
  57. Hangs, R.D.; Knight, J.D.; Van Rees, K.C.J. Nitrogen accumulation by conifer seedlings and competitor species from 15Nitrogen-labeled controlled-release fertilizer. Soil Sci. Soc. Am. J. 2003, 67, 300–308. [Google Scholar] [CrossRef]
  58. Sloan, J.L.; Uscola, M.; Jacobs, D.F. Nitrogen recovery in planted seedlings, competing vegetation, and soil in response to fertilization on a boreal mine reclamation site. For. Ecol. Manag. 2016, 360, 60–68. [Google Scholar] [CrossRef]
  59. Dietrich, S.T.; MacKenzie, M.D. Biochar affects aspen seedling growth and reclaimed soil properties in the Athabasca oil sands region. Can. J. Soil Sci. 2018, 98, 519–530. [Google Scholar] [CrossRef]
  60. Martinkosky, L.; Barkley, J.; Sabadell, G.; Gough, H.; Davidson, S. Earthworms (Eisenia fetida) demonstrate potential for use in soil bioremediation by increasing the degradation rates of heavy crude oil hydrocarbons. Sci. Total Environ. 2017, 580, 734–743. [Google Scholar] [CrossRef] [PubMed]
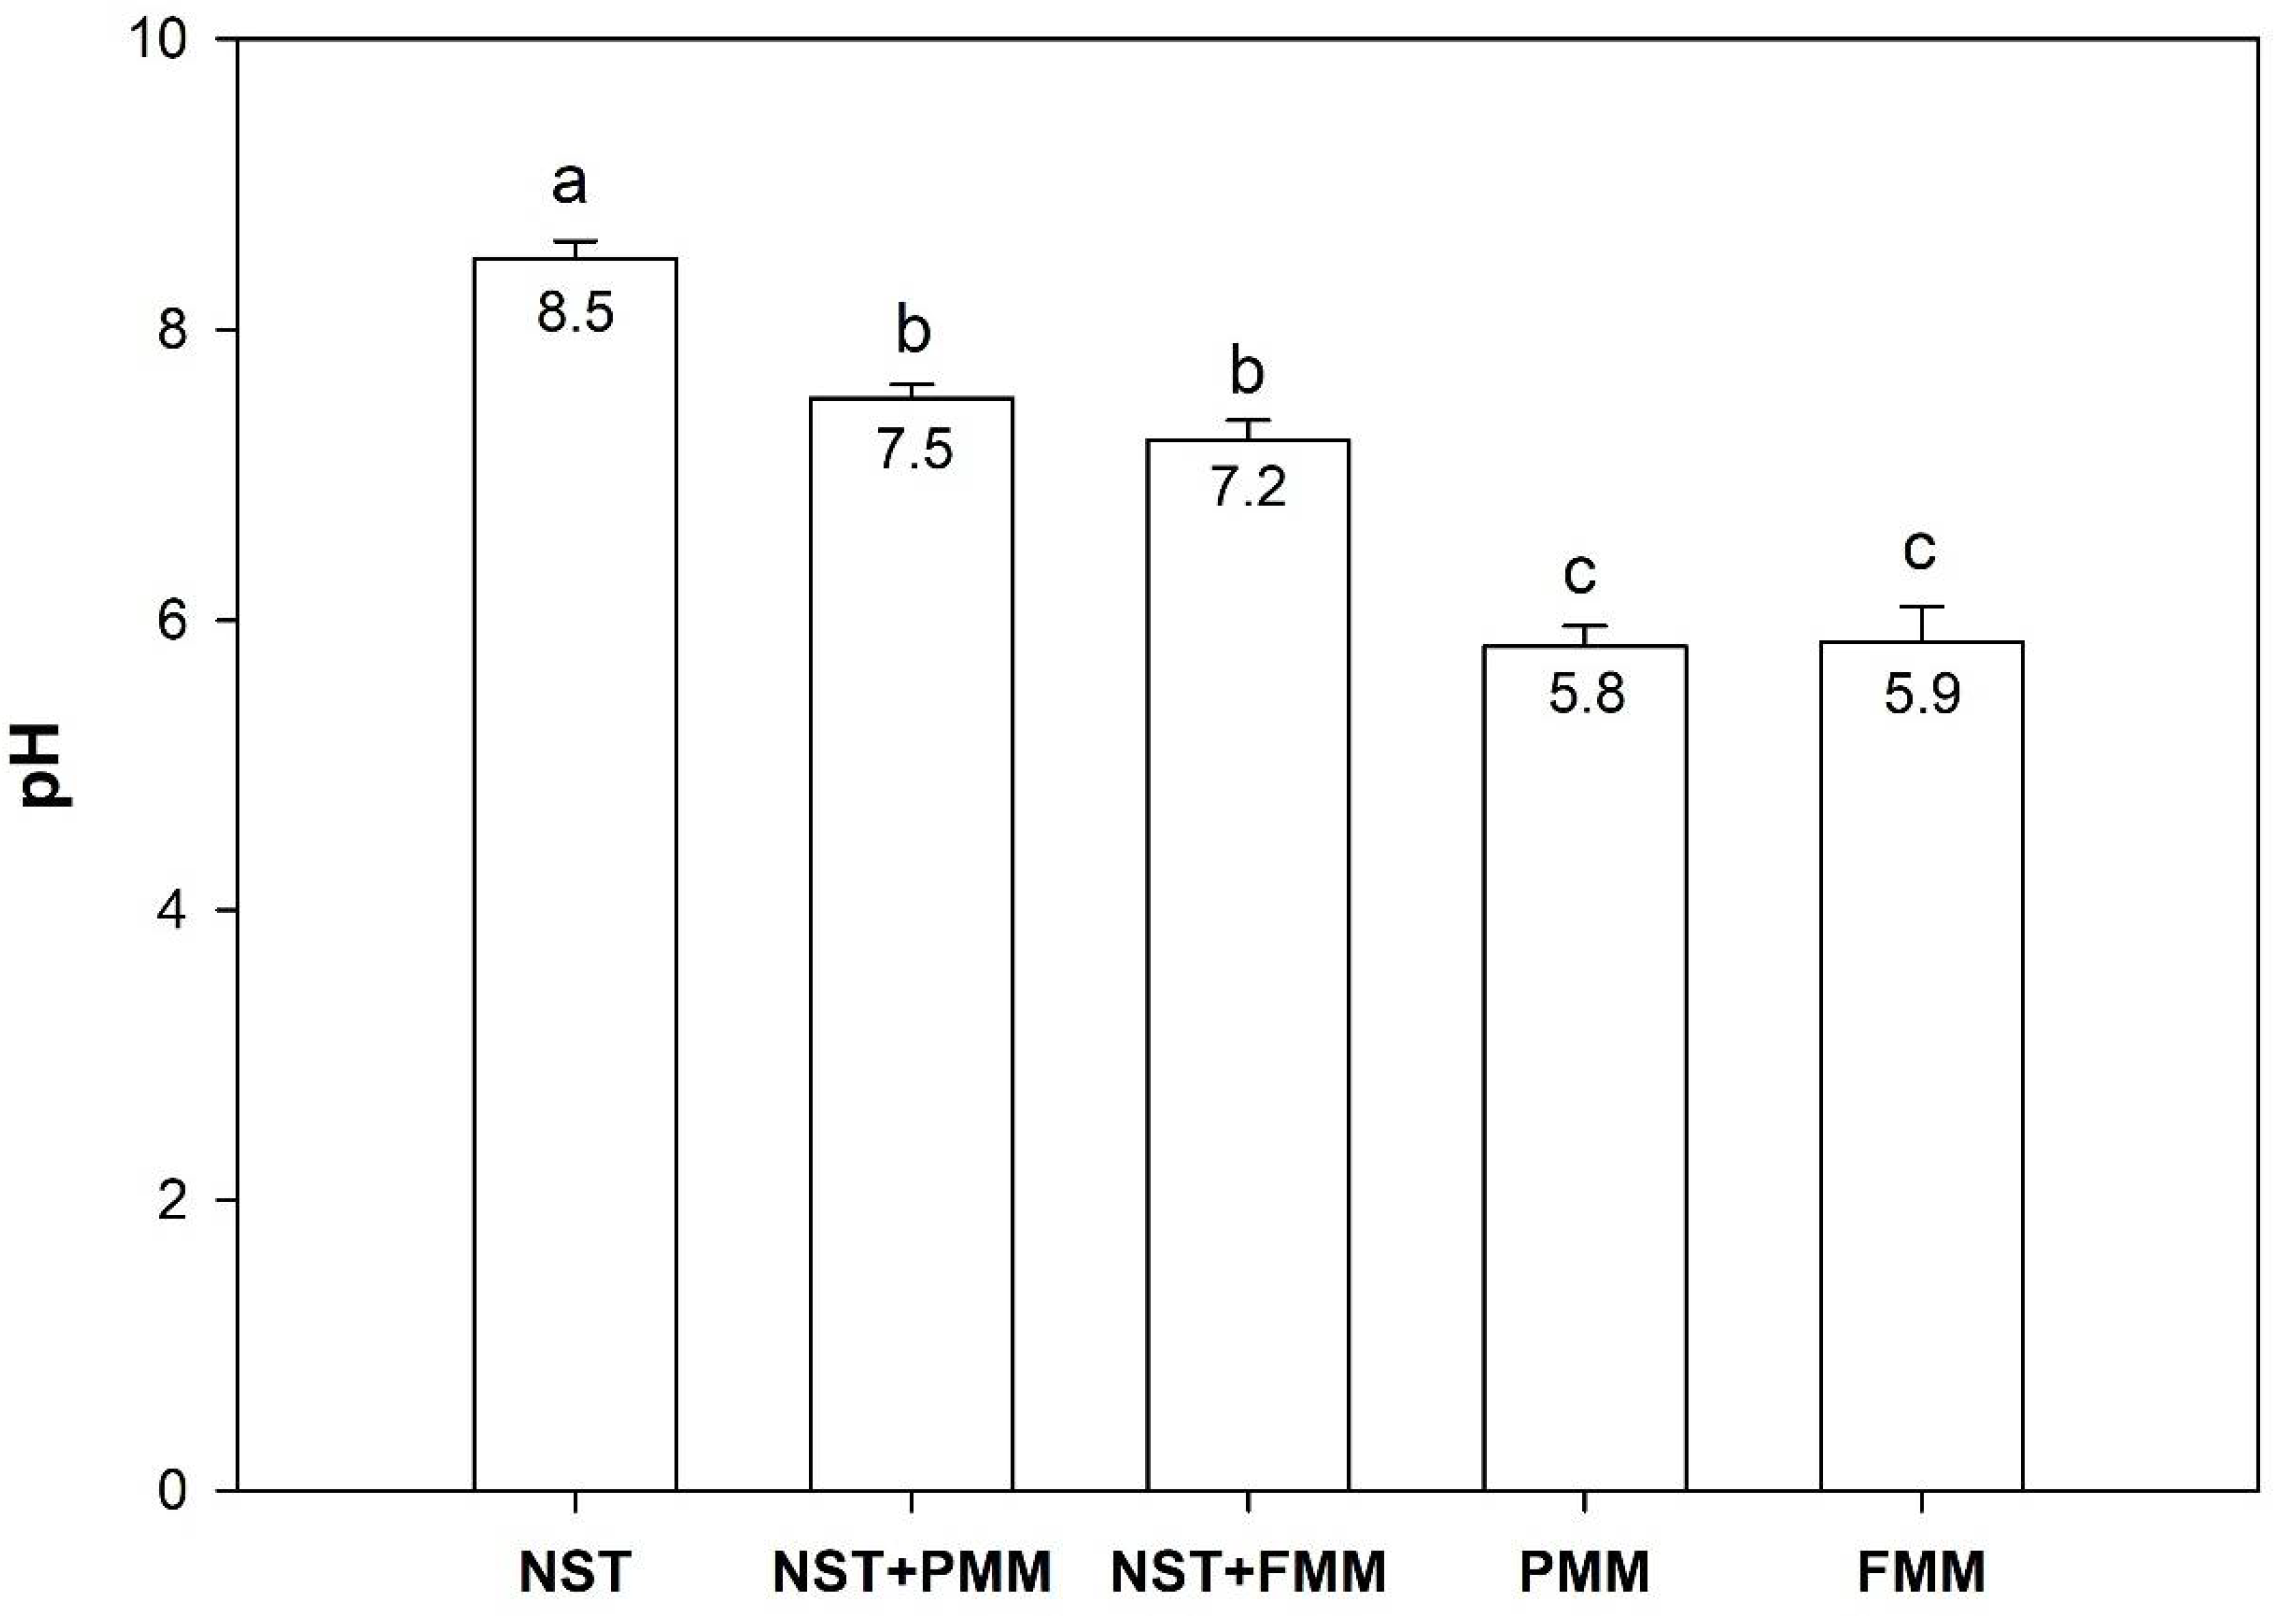
Figure 1. pH of treatment substrates NST, NST + PMM, NST + FMM, PMM, and FMM. Different letters above the bars indicate significant differences (p ≤ 0.05) between treatments determined by Fisher’s LSD test. Means (n = 6) ± SE are shown.
Soilsystems 09 00090 g001
Figure 2. Shoot height increment (cm) and root collar diameter increment (mm) in trembling aspen (a,b) and white spruce (c,d) plants after two months of treatment in the substates of NST, NST + PMM, NST + FMM, PMM, and FMM with 10% and 100% N&P supplementations. Different letters above the bars indicate significant differences (p ≤ 0.05) between treatments determined by Fisher’s LSD test. Means (n = 6) ± SE are shown.
Soilsystems 09 00090 g002
Figure 3. Leaf, shoot, and root dry weights (DW) in trembling aspen (ac) and white spruce (df). plants grown for two months in the substrates of NST, NST + PMM, NST + FMM, PMM, and FMM with 10% and 100% N&P supplementations. Different letters above the bars indicate significant differences (p ≤ 0.05) between treatments determined by Fisher’s LSD test. Means (n = 6) ± SE are shown.
Soilsystems 09 00090 g003
Figure 4. Net photosynthesis (Pn) and transpiration (E) rates in trembling aspen (a,b) and white spruce (c,d). Plants were grown for two months in the substrates of NST, NST + PMM, NST + FMM, PMM, and FMM with 10% and 100% N&P supplementations. Different letters above the bars indicate significant differences (p ≤ 0.05) between treatments determined by Fisher’s LSD test. Means (n = 6) ± SE are shown.
Soilsystems 09 00090 g004
Figure 5. Leaf total chlorophyll concentrations and chlorophyll-a to chlorophyll-b ratios and in trembling aspen (a,b) and white spruce (c,d). Plants were grown for two months in the substrates of NST, NST + PMM, NST + FMM, PMM, and FMM with 10% and 100% N&P supplementations. Different letters above the bars indicate significant differences (p ≤ 0.05) between treatments determined by Fisher’s LSD test. Means (n = 6) ± SE are shown.
Soilsystems 09 00090 g005
Figure 6. Leaf total N, P, Mn, and B concentrations in trembling aspen (ad) and white spruce (eh). Plants were grown for two months in the substrates of NST, NST + PMM, NST + FMM, PMM, and FMM with 10% and 100% N&P supplementations. Different letters above the bars indicate significant differences (p ≤ 0.05) between treatments determined by Fisher’s LSD test. Means (n = 6) ± SE are shown.
Soilsystems 09 00090 g006
Figure 7. Principal component analysis on the relationships of plant growth, physiological, and elemental response variables in seedlings treated with NST and 10% and 100% N&P of trembling aspen (a,b) and white spruce (c,d). TN: total N; photo: net photosynthesis rates; trans: transpiration rates; heit: shoot height growth; dia: root collar diameter growth; chl: total chlorophyll concentration; chl_a: chlorophyll a concentration; chl_b: chlorophyll b concentration; chl_a:b: chlorophyll a to b concentration ratio; tdw: total dry weights; root_dw: root dry weights; shoot_dw: shoot dry weights; st/rt dw: shoot to root dry weights ratio.
Soilsystems 09 00090 g007
Disclaimer/Publisher’s Note: The statements, opinions and data contained in all publications are solely those of the individual author(s) and contributor(s) and not of MDPI and/or the editor(s). MDPI and/or the editor(s) disclaim responsibility for any injury to people or property resulting from any ideas, methods, instructions or products referred to in the content.