Article

Assessing the Effect of Undirected Forest Restoration and Flooding on the Soil Quality in an Agricultural Floodplain

1
Environmental Science, Saint Michael’s College, Colchester, VT 05439, USA
2
Environmental Studies and Science, Saint Michael’s College, Colchester, VT 05439, USA
*
Author to whom correspondence should be addressed.
Soil Syst. 2025, 9(3), 88; https://doi.org/10.3390/soilsystems9030088 (registering DOI)
Submission received: 31 May 2025 / Revised: 29 July 2025 / Accepted: 31 July 2025 / Published: 7 August 2025
(This article belongs to the Special Issue Research on Soil Management and Conservation: 2nd Edition)

Abstract

This study investigated the impacts of land-use history and an episodic flood event on the soil quality of a riverine floodplain ecosystem, providing long-term and short-term disturbance perspectives. The study took place in the Saint Michael’s College Natural Area, which has over a hundred-year history of land-use change. Based on aerial orthoimagery, three zones (a recently abandoned farm field, a new-growth forest, and an old-growth forest) were selected that reflected different land-use histories. Two plots were selected per zone and pooled soil samples were collected from each before and after a major flooding event. Surface soil quality before flooding was often similar among the new- and old-growth forested areas (1.4 mg-P/g-soil, 6.8% soil organic matter (SOM), 0.79 humification index (HIX), and 13% Peak T) but differed from that found in the recently abandoned farm field, which had higher phosphorus levels (1.6 mg-P/g-soil), lower SOM content (3.9%), more microbial-like SOM (0.65 HIX and 17% Peak T), and drier soils. Flooding caused SOM to better resemble that of a forest rather than an agricultural field, and it lowered phosphorus levels. The results of our study suggest that episodic flooding events could help accelerate the restoration of soil organic matter conditions.

1. Introduction

Land-use change and human activities have degraded the health and function of terrestrial and aquatic ecosystems [1,2,3]. Agricultural activities have increased phosphorus inputs to soils and waterways, decreased biodiversity, altered soil pH and salinity, reduced soil organic matter (SOM) and carbon storage, and shifted SOM chemical characteristics [2,4]. Moreover, human activities have changed riverine flows and terrestrial drainages, which have disconnected floodplains, drained wetlands, and quickened the rate at which materials move through the landscape into downstream waterbodies [5]. Collectively, these changes, among others, have diminished the value and health of terrestrial and aquatic ecosystems [6,7]. When considering climate change, in addition to anthropogenic ecosystem degradation, the need to restore floodplains, reforest, and re-naturalize areas, and understand their response to episodic weather events, is even greater [5,8,9]. The purpose of this study is to understand how over a century of land-use change (long-term disturbance) and an episodic flood event (short-term disturbance) impact soil health in a riparian floodplain terrestrial system undergoing restoration.
Agriculture is one persistent disturbance event that drastically alters the biodiversity, energy processing, and the overall composition of an ecosystem [3,10,11,12,13]. Conversion of a forest into a rangeland harms soil health, reduces biodiversity, and shifts pH, soil bulk density, phosphorus availability, and SOM content [14]. Changed hydrology, soil compaction, and disruption of the biotic integrity of ecosystems cause agricultural soils to leach excessive phosphorus into waterways, reduce the soil’s water-holding capacity, and decrease the carbon and SOM content of the soil [2,4,15]. At the same time, agricultural practices shift the nutritional balance in soils, often leading to high levels of total phosphorous and less stable forms of nitrogen. Legacy phosphorus effects of agriculture in soils can persist for decades, leading to long-term depredation of soils and connected aquatic ecosystems [15,16,17,18]. Altogether, land-use and anthropogenic histories of ecosystems influence their current ecosystem structure and function [19].
To counteract the negative impact that agricultural and hydrologic modifications have on soils, ecosystems are being restored [10,11,12]. Floodplain restoration can promote increased SOM storage in soils, improve river quality, and increase overland water storage during floods [16]. It is unclear, however, how much time is required for an ecosystem to recover its natural structure and function [5,10,14,20]. For example, in tropical systems, riparian forest restoration of agricultural sites recovered soil organic carbon in 30 years and improved soil cation exchange and compaction, which should improve the area’s role in watershed function [19,20]. However, several studies have found that excess phosphorus and phosphorus legacies from agricultural lands inhibit the restoration of native vegetation and soil functions [17,18]. Increased hydrologic connectivity and flooding have the potential to help restore ecosystems, but the impact of flooding on soil health is often dependent on local and regional factors [11,21,22,23]. Flooding has been associated with increases or decreases in SOM pools, nutrient leaching from soil into waterways, and the deposition of nutrients and organic matter. One approach to resolve the combined effects of land use and flooding is to take a space-for-time approach. Understanding current soil quality at different stages of restoration, and before and after flooding, can provide insight into the response time needed to fully restore degraded ecosystems.
Monitoring the biogeochemical properties of soil and its components can provide information about how gradients of disturbance impact soil quality, and thus an entire ecosystem. In this study, we investigated how over a century of anthropogenic land use and cover change is connected to present-day soil quality. Soil quality indicators included pH, soil moisture, SOM content, SOM quality, and extractable phosphorus (Pext). Based on the long-term history, we hypothesized that soil quality would be poorest (with lower SOM content, more labile SOM, and higher Pext) in recently abandoned agricultural soils, improved in zones reforested over the past half-century, and of better quality (with higher SOM content, more terrestrial-humic and stable SOM, and lower Pext) in soils from forest zones at least a century old. To assess how these long-term effects interact with episodic events, this study also examined the impact of a major flood on the quality of soils in each of these three zones. By integrating long-term land-use history with a single extreme event, this study provides insight into how both chronic and episodic disturbances influence soil quality in a heavily altered floodplain ecosystem.

2. Materials and Methods

2.1. Site Description and Soil Sampling

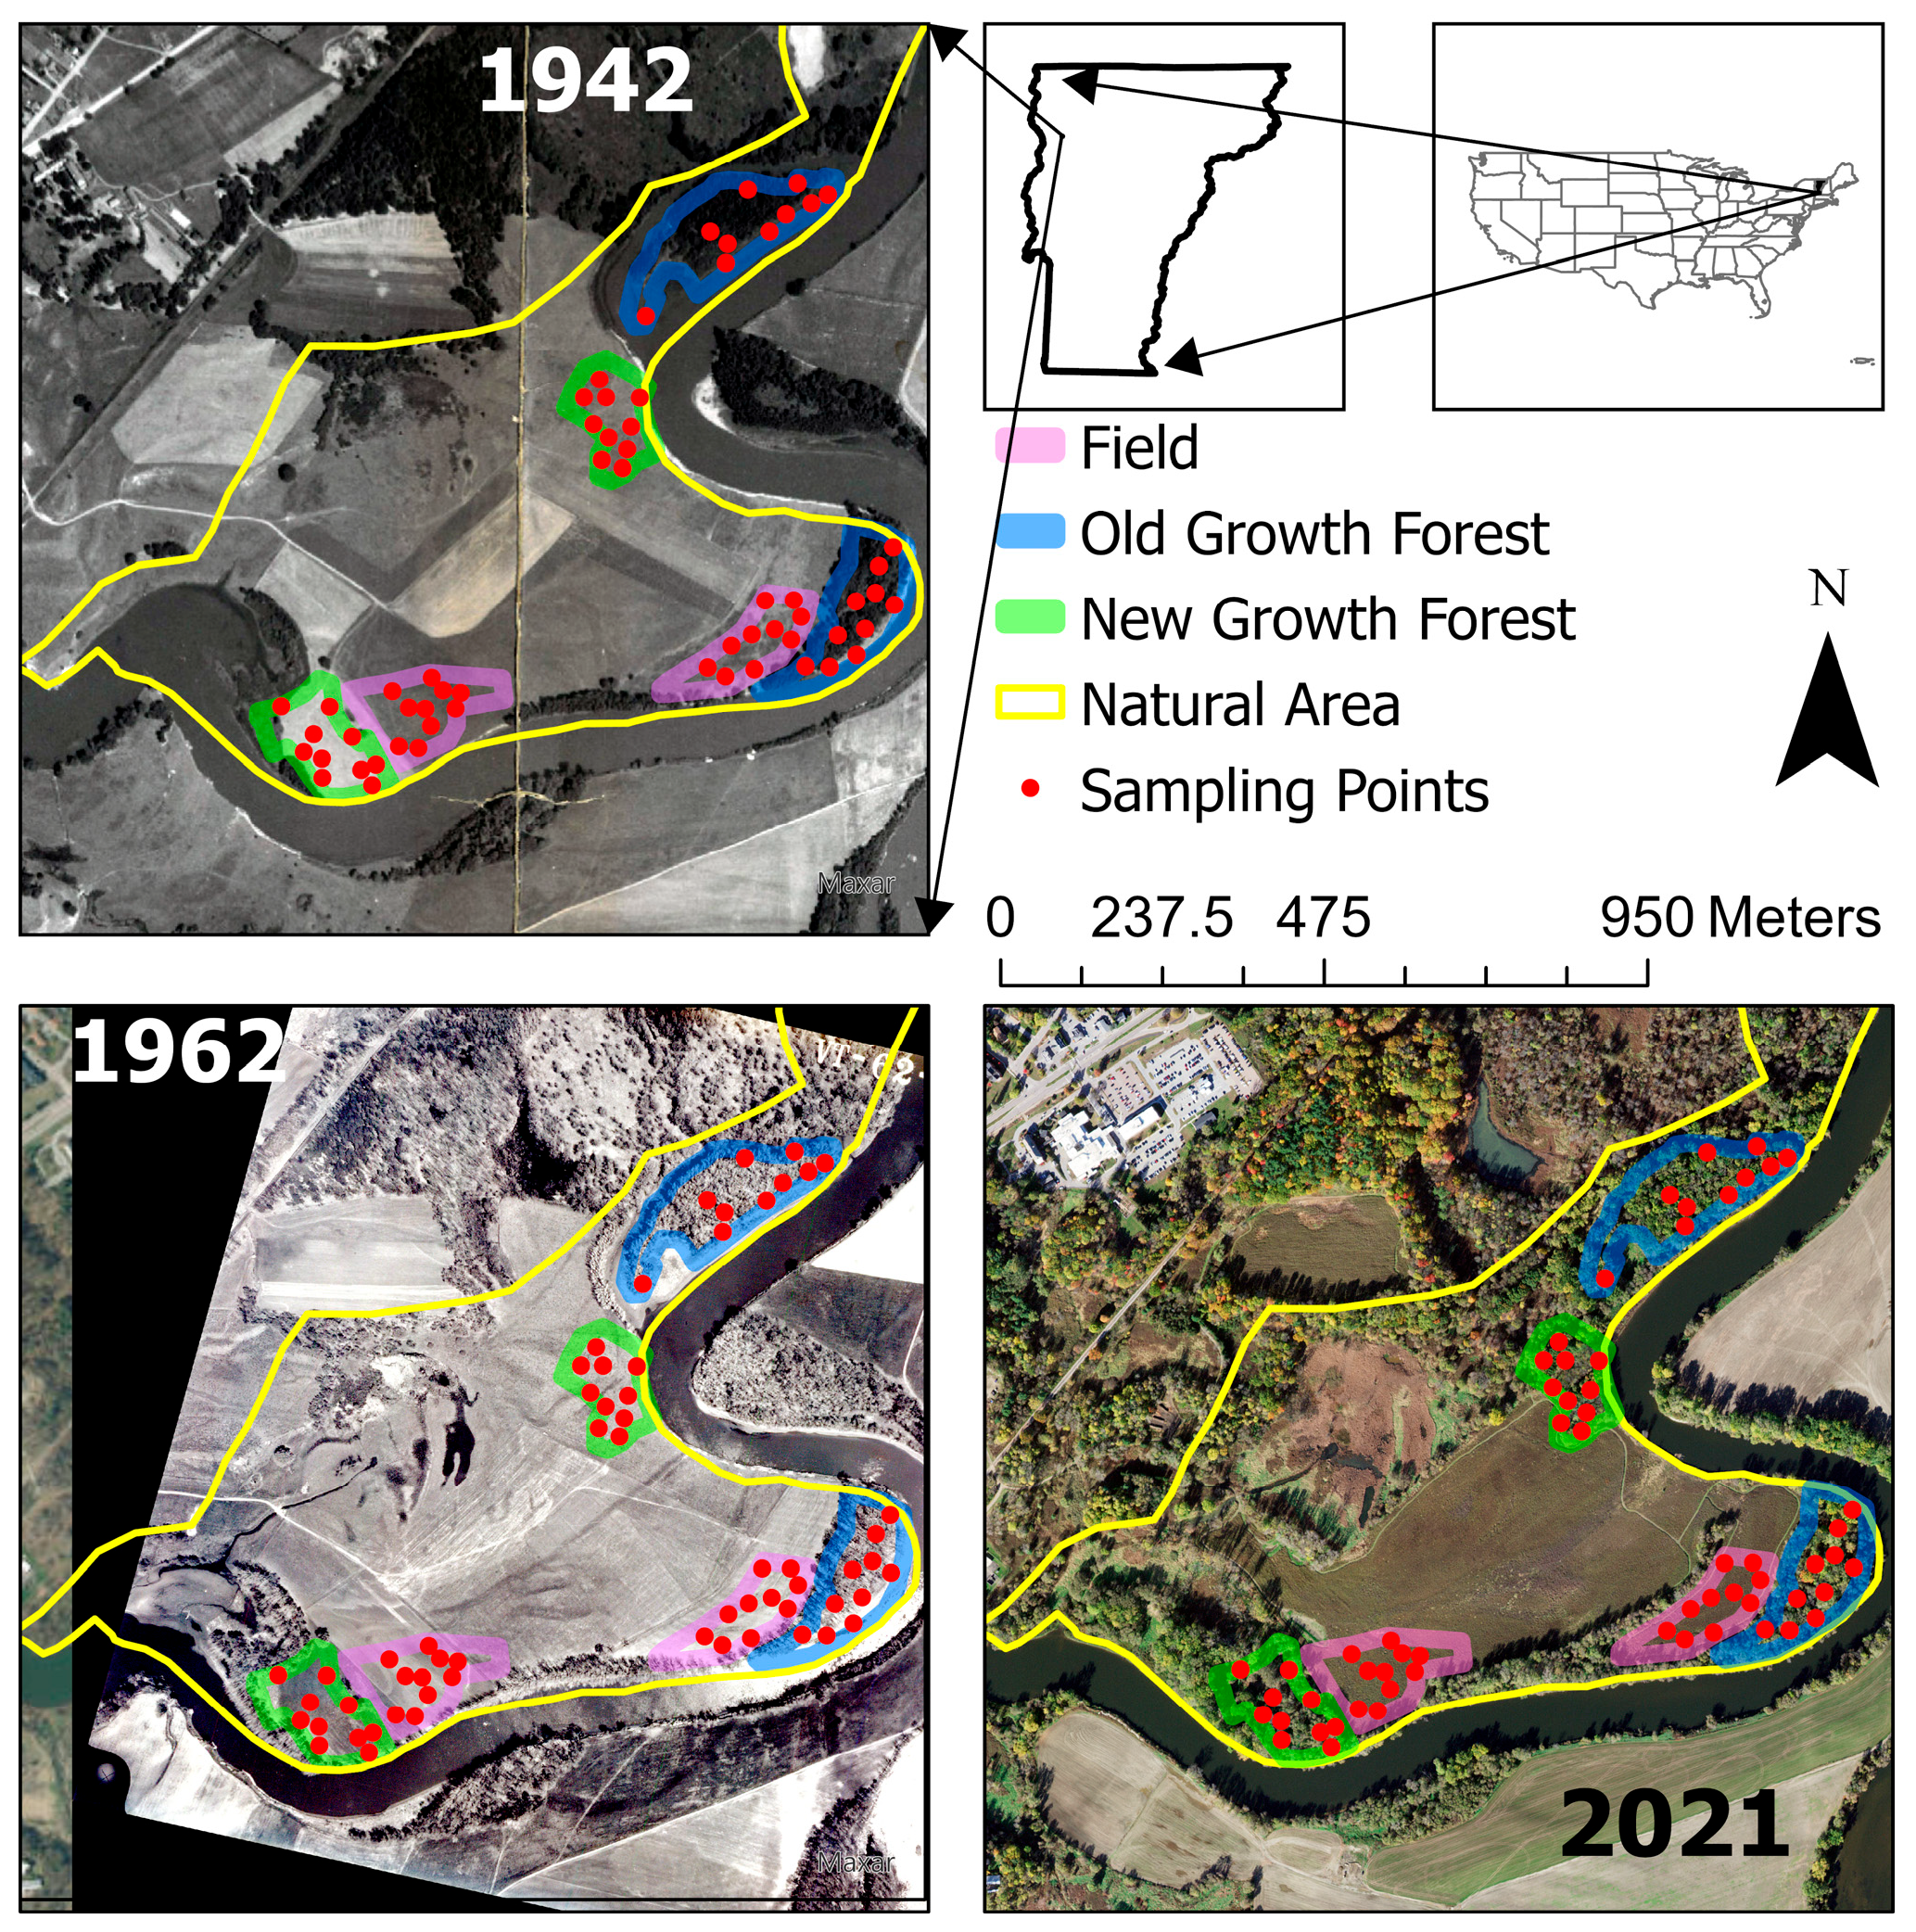
This study was conducted in the Saint Michael’s College Natural Area (73°9′1″ W 44°29′33″ N), a 350-acre area of floodplain grasslands, wetlands, and woodlands located along the banks of the Winooski River (Colchester, VT, USA; Figure 1). The Natural Area has an interesting land-use history (Table 1). Starting in the early 1900s to about 1960, the land was used for sheep, cattle, and potato farming. With the collapse of milk prices in the 1960s, the college stopped farming the land and began to lease the floodplain for industrial and agricultural use. After 1960, most of the land was converted to conventional row-crop, corn agriculture. In 2018, Saint Michael’s College decided to stop leasing the land and placed 163 acres of the Natural Area under conservation easement [24]. A few zones within the Natural Area nearest to the river have not been logged within the past century, while other forest patches have emerged since 1962 (Figure 1). Tree coring as part of a community ecology course in the old growth zone determined the oldest tree was around 165 years old (Dr. Declan McCabe Personal Communication), but we do not know the land-use history of the natural area prior to the College’s founding (circa 1904). In the early 1900s, these old-growth-forest patches were used for grazing and shaded areas for livestock. At present, the Natural Area is considered a birding hot spot with over 160 species recorded. The Natural Area also features rare habitats in Vermont (clay plain forest, silver maple forest, among others). New wetlands have been established in the area, and the former agricultural land is naturally shifting to a grassland with planted and pioneer tree species filling in. With this land-use history and its connection to the floodplain in mind, the Saint Michael’s College Natural Area presents a great case study to explore the impact of flooding, land cover, land-use history, and restoration on soil quality.
The study design and site selection were based on visual analysis of 2022, 1962, and 1942 aerial imagery (Figure 1) [25]. Orthoimagery tiles were obtained from the Vermont Aerial Imagery Program. The 1942 and 1962 images were digitized and rectified by the Vermont Center of Geospatial Information and georeferenced using the imagery-georeference ribbon tool options in ArcGIS Pro 3.0. The 2022 orthoimage was obtained fully georeferenced and rectified. Two old-growth forest zones (5.4 and 6.6 acres) were selected; these were well-developed forest patches as of 1942. Two new-growth forest zones (3.2 and 4.1 acres) were selected; these were agricultural land in 1962 but had developed into forest patches by 2022. Two recently abandoned farm field sites (3.4 and 4.1 acres), now a mixture of young trees and prairie species, were selected near two forest sites and spatially bound to create zones of similar area as the forest zones. Soils in each zone, except for the northernmost old-growth forest, were characterized by the State of Vermont as Hadley very fine sandy loam. One old-growth zone was characterized as Limerick silt loam.
Within each zone, ten sample sites were randomly selected using ArcGIS Pro version 3.0 random points tool, with sites not being permitted within 100 m of each other or along the edge of each zone. These constraints helped distribute sampling points throughout each zone and worked better than stratified and clumped site selection approaches across each irregularly shaped zone. Prior to field collections, sampling sites were located using handheld GPS, flagged, and labeled. This allowed us to return to the same location without relying on the strength of the GPS signal. Pre-flood soil samples were collected between 12 June 2023 and 7 July 2023. At each site and pre-flood, a one-meter-by-one-meter quadrat was set down and four surface (0–5 cm) and four bottom (25–30 cm) soil samples (one from the center of each quadrant) were taken. Sample depths approximated the surface of the A-horizon (0–5 cm) and the bottom of the A-horizon to the start of the C or B horizons (25–30 cm), based on USGS soil classification for the region. The four samples from each quadrant were then pooled to produce one surface and bottom soil sample per site. In total, 120 pooled samples were taken (60 surface and 60 subsurface across the zones). In addition, soil moisture, pH, and temperature were taken using handheld meters (Kelway pH and Moisture tester, Kel Instruments Co. Inc., Teaneck, NJ, USA and Taylor soil thermometer, Oak Brook, IL, USA). Vegetation was also surveyed within a one-meter-by-one-meter quadrat at the site, but these data are not reported in this study. Soil samples were dried in the lab at 60 °C until constant weight. Then, roots and course woody debris were removed, and what the remaining material was sieved through a 250 µm mesh to break up soil aggregates, remove rocks, and homogenize the sample. Dried and homogenized samples were further processed for extractable phosphorus (Pext), SOM content, and water-extractable SOM characteristics.
After the initial soil samples were collected, a major flood event occurred 10 and 11 July 2023. Within the Winooski River watershed, 4 to 9 inches of rain fell over 48 h causing the river to exceed major flood stage for over 24 h and crest at an estimated 23.3 feet. A minor flood stage of 12 feet is generally required for large-scale flooding of Saint Michael’s Natural Area. Hence, the flood of July 2023 submerged the Natural Area under 15 feet of water, and it took 5 to 7 days for floodwaters to fully recede [26,27]. This was the first major flooding event since Hurricane Irene impacted the area in 2011. When the flood waters receded and the area was deemed safe (19–28 July 2023), we revisited sampling sites within each zone and collected surface soil samples to compare the impact of the flood on pre-flood soil quality. In total, 100% of our zones and pre-flood sampling sites were impacted by the flood; as such, this study does not have a control non-flood reference site. GPS (accuracy 15 feet) and flagging tape (if it survived the flood) were used to find sampling sites within each zone plot. Sites with standing water or those no longer accessible due to downed trees were skipped. This resulted in 50 of the 60 sites being resampled across the six zones. At each site, four surface soil subsamples were pooled for each site to make one composite sample. Post-flood samples were processed the same as pre-flood samples and analyzed for Pext, SOM content, and water-extractable SOM properties. Soil moisture, temperature, and pH were not measured post-flood.

2.2. Analytical Methods

SOM content (%) was determined by loss on ignition [28]. Five grams of dried and homogenized soil sample was weighed using an analytical balance into pre-weighted aluminum weighing dishes. Samples were combusted at 550 °C for one hour. Samples remained in the combustion oven while the temperature cooled down. Samples were again weighed post-combustion, and SOM was calculated as the percent of mass loss from the soil after combustion.
Extractable phosphorus (Pext) was determined by weighing 50 mg of soil into 15 mL glass test tubes in duplicate for each sample. Samples were hydrated with 10 mL of nanopure water and then digested in the presence of potassium persulfate in the autoclave at 121 °C for 1 h [29]. Samples were then diluted 1 to 10 and measured using the molybdate-blue colorimetric approach using a Seal AQ300 Discrete Analyzer (Seal Analytical, Mequon, WI, USA) [30]. Concentrations were determined using calibration curve produced by auto-dilution of a commercial standard (1 mg-P/L). Calibration curves were run daily. Blank and mid-level (0.5 mg-P/L) quality control standards were run at the start and end of the sample tray as well as every 10 samples. Sample duplicates were accepted if within 20% relative standard deviation of each other; samples exceeding 20% were re-run. To pass quality control, calibration curves had R-squared ≥ 0.99, blanks were below the instrument’s detection limit (0.01 mg-P/L), and the mid-level control was within 10% of the target concentration. If quality controls failed, samples and quality controls were re-run. The average of duplicate samples was used for statistical analysis, and individual analytical duplicate results are not reported.
SOM quality was accessed in surface soils only by extracting 1.0 g of soil in 40.0 mL of nanopure water in a 45 mL centrifuge tube. A single-direction soil shaker was used to agitate samples to promote extraction. Pre-flood samples were shaken for 24 h, then centrifuged at 1500 RPM for 3 min to remove sediment, and the supernatant was filtered using a 0.45 µm membrane attached to a syringe to remove fine particles. Post-flood, the same approach was used, but samples were shaken for 30 min rather than 24 h. In order to allow comparability, the matching pre-flood sites were extracted anew for 30 min. The 24 h and 30 min extractions were not directly compared to each other. SOM extracts were then measured for organic matter characteristics using optical chemistry methods. A Horiba Aqualog (HORIBA Instruments Inc., Piscataway, NJ, USA) was used to make light absorbance and fluorescence excitation and emission scans of each sample. Samples were diluted to have light absorbance at 254 nm below 40, which helps eliminate matrix effects on scans. Sample scans were corrected for instrument bias, inner-filter effects, blank-subtracted, and normalized to Raman Units. Blank scans were conducted at the start and end of each day of scanning using nanopure water [31]. The spectral slope ratio (SR; [32]), freshness index (BA; [33]), modified humification index (HIX; [34]), and fluoresce peaks A (terrestrial, humic-like), C (humic-like), D (soil, fulvic-like), E (soil, fulvic-like), M (microbial, humic-like), N (microbial, humic-like), and T (protein-like) were used as indicators of SOM quality [31]. SR is inversely related to the size of the extracted organic matter. BA provides an indication of the level of organic matter degradation. HIX indicates the fraction of humic matter compared to protein-like or aliphatic organic compounds, where a value of >0.95 indicates fully humified organic matter.

2.3. Statistical Analysis

Repeated sampling, permutation analysis of variance (ANOVA), and multivariate analysis of variance (MANOVA) were used to determine univariate (pH, soil moisture, temperature, SOM content, and Pext) and multivariate (SOM quality) differences between land-use zones, flood period, and soil depth. Thirty-minute and 24 h extracted SOM quality indicators were not used together or compared in the same analysis because extraction time impacted the quality and concentration of extracted material. All analyses were carried out in R using R-Studio using custom functions and the tidyverse version 2.0.0 and vegan version 2.6-10 packages [35,36,37,38]. Repeated measures were selected over data transformation because the assumptions of multivariate normality are challenging to meet, and the resampling approach sets the test population to that of the data. Pre-flood, a full-model linear ANOVA with two factors (soil depth and zone) was used for univariate tests (dependent variable ~ zone * soil depth). Post-flood, only surface soil samples were analyzed using a two-factor linear model with zone and flood period (pre or post) as the factors (dependent variable ~ zone * flood period). For MANOVA, a Euclidean distance matrix was produced using the dist function after data were scaled. Pre-flood, 24 h extracted SOM properties were compared across zone (single-factor design). Post-flood, 30 min extracted SOM properties were compared using a two-factor model with zone and flood period as factors. For each test, 9999 permutations plus the observed condition were conducted to generate the underlying test distribution for each comparison. When a significant test was determined, a least squares comparison approach was used to complete a resampling pairwise comparison for univariate tests and pairwise.adonis2 for multivariate tests. Multivariate comparisons were visualized using principal components analysis (PCA) ordination of the first two components. The prcomp function was used to conduct the PCA, and DOM data were scaled and centered prior to analysis.

3. Results

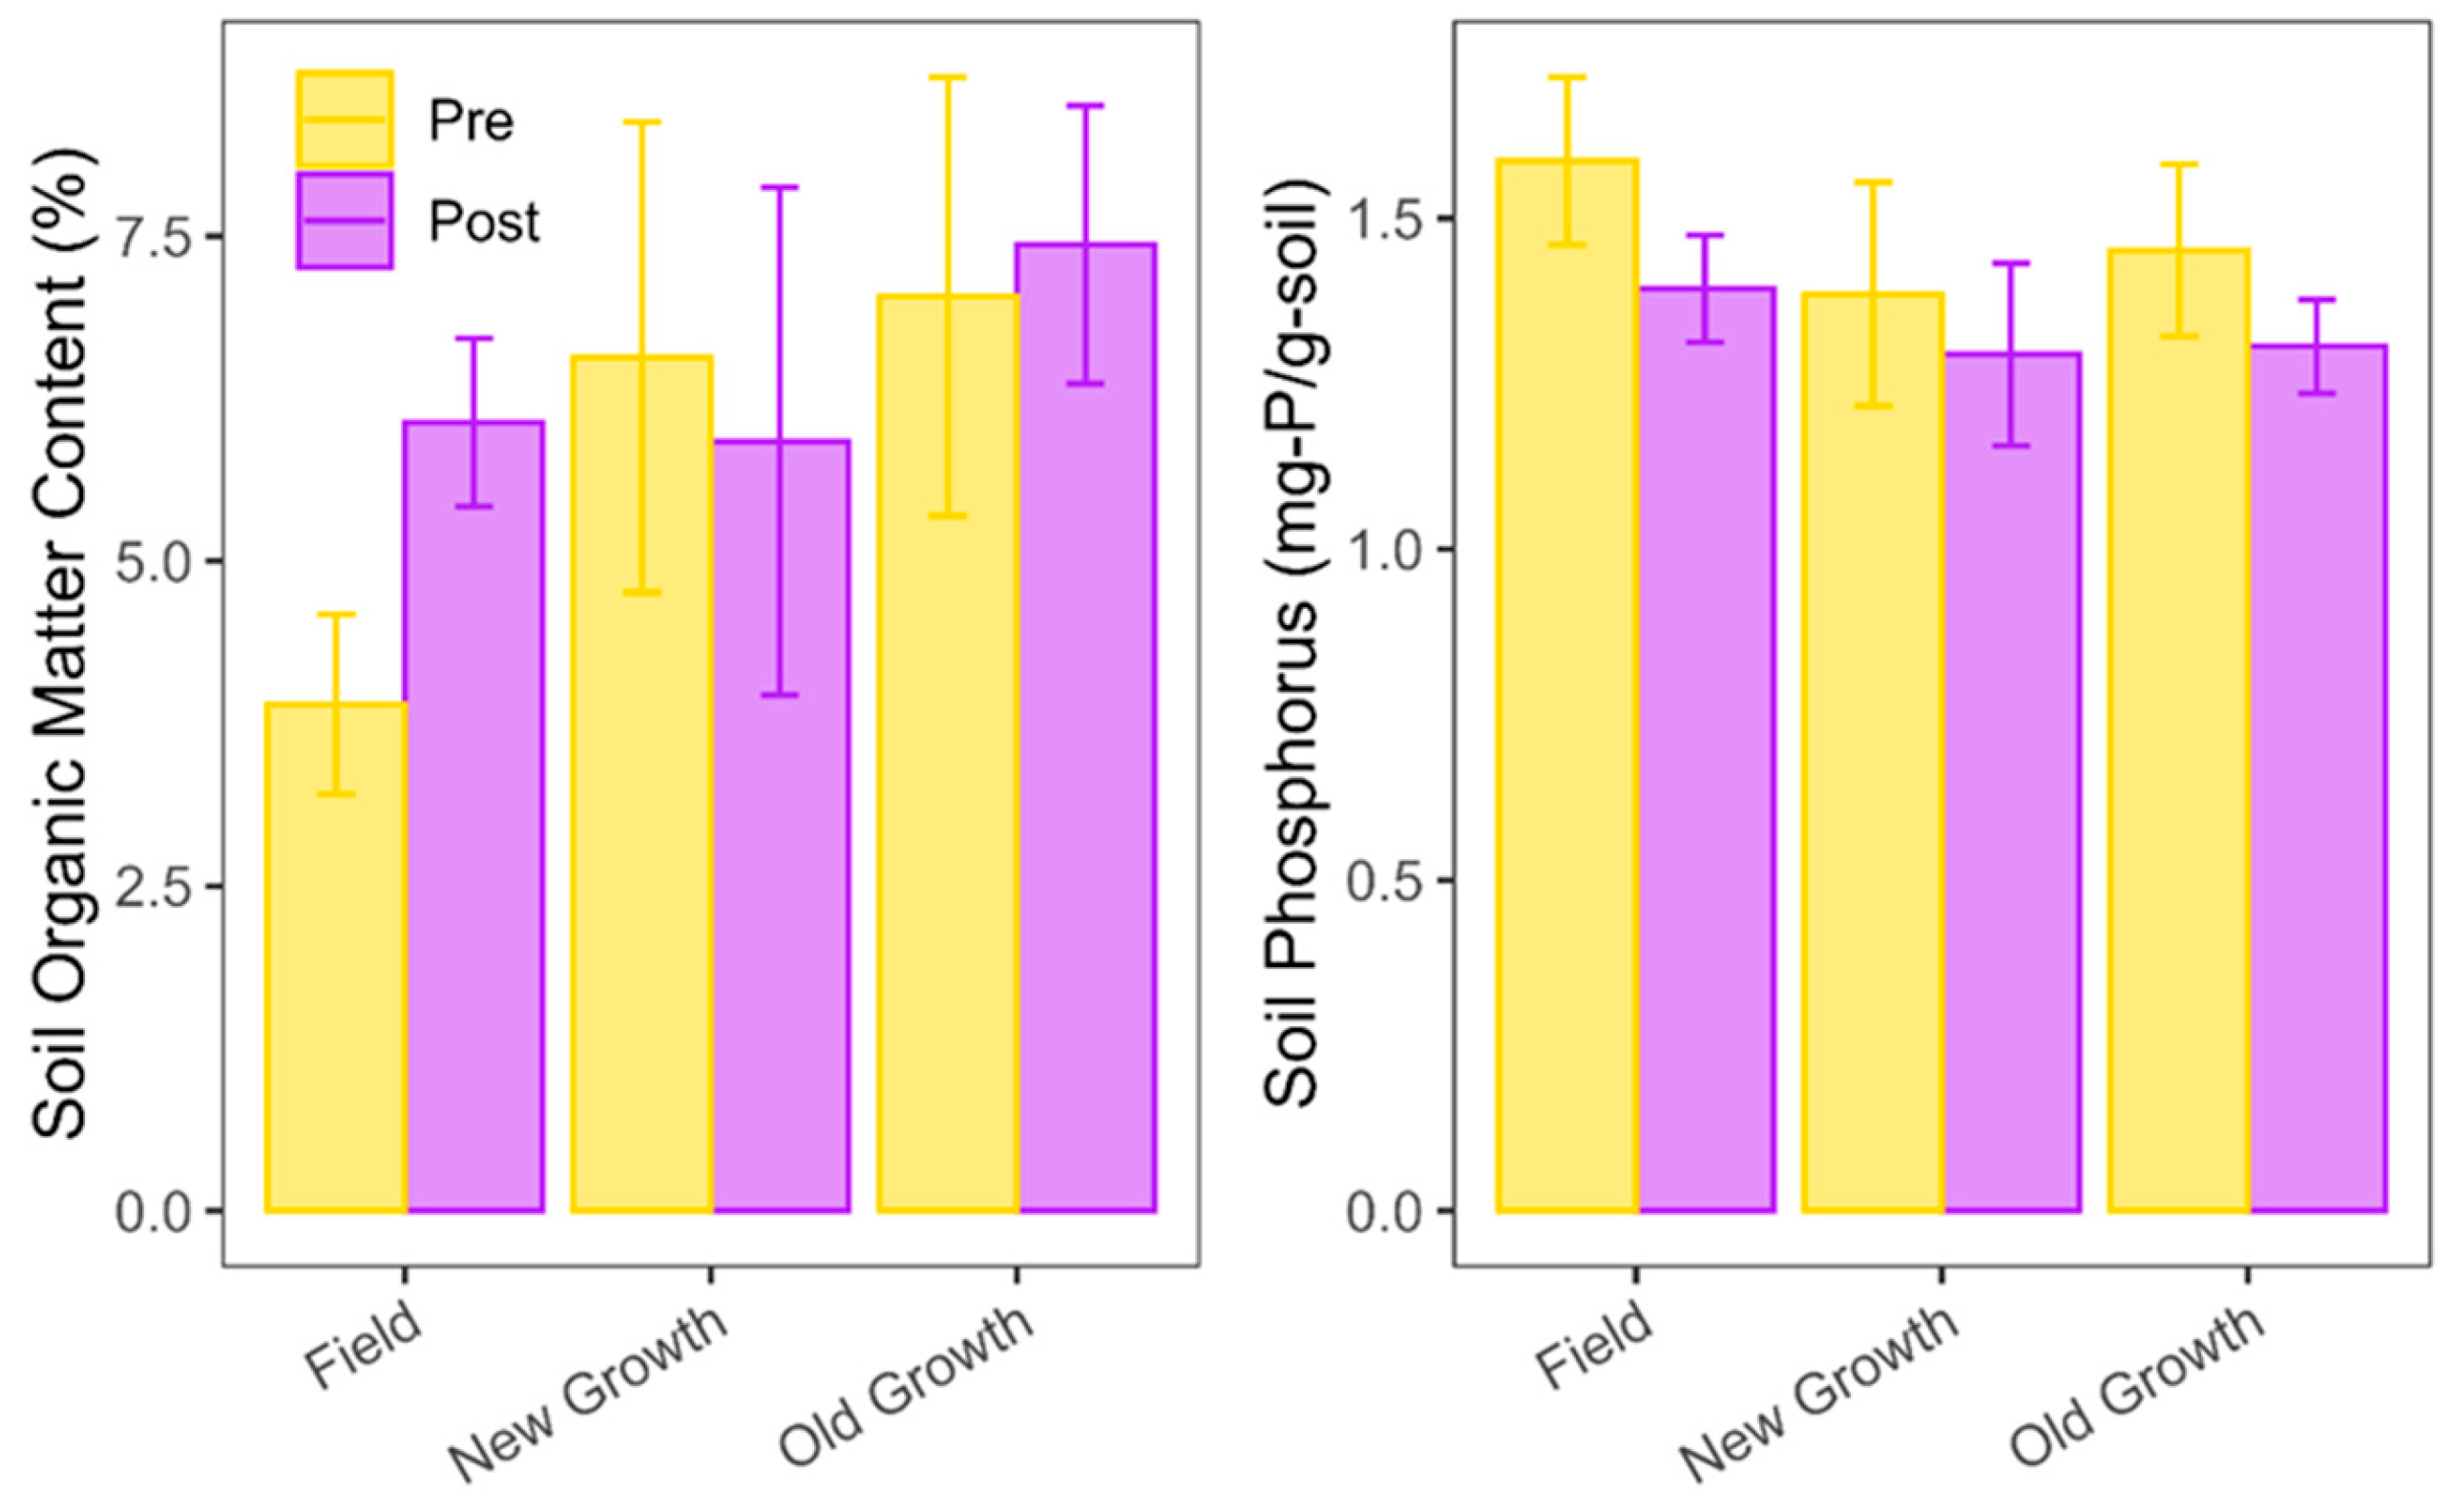
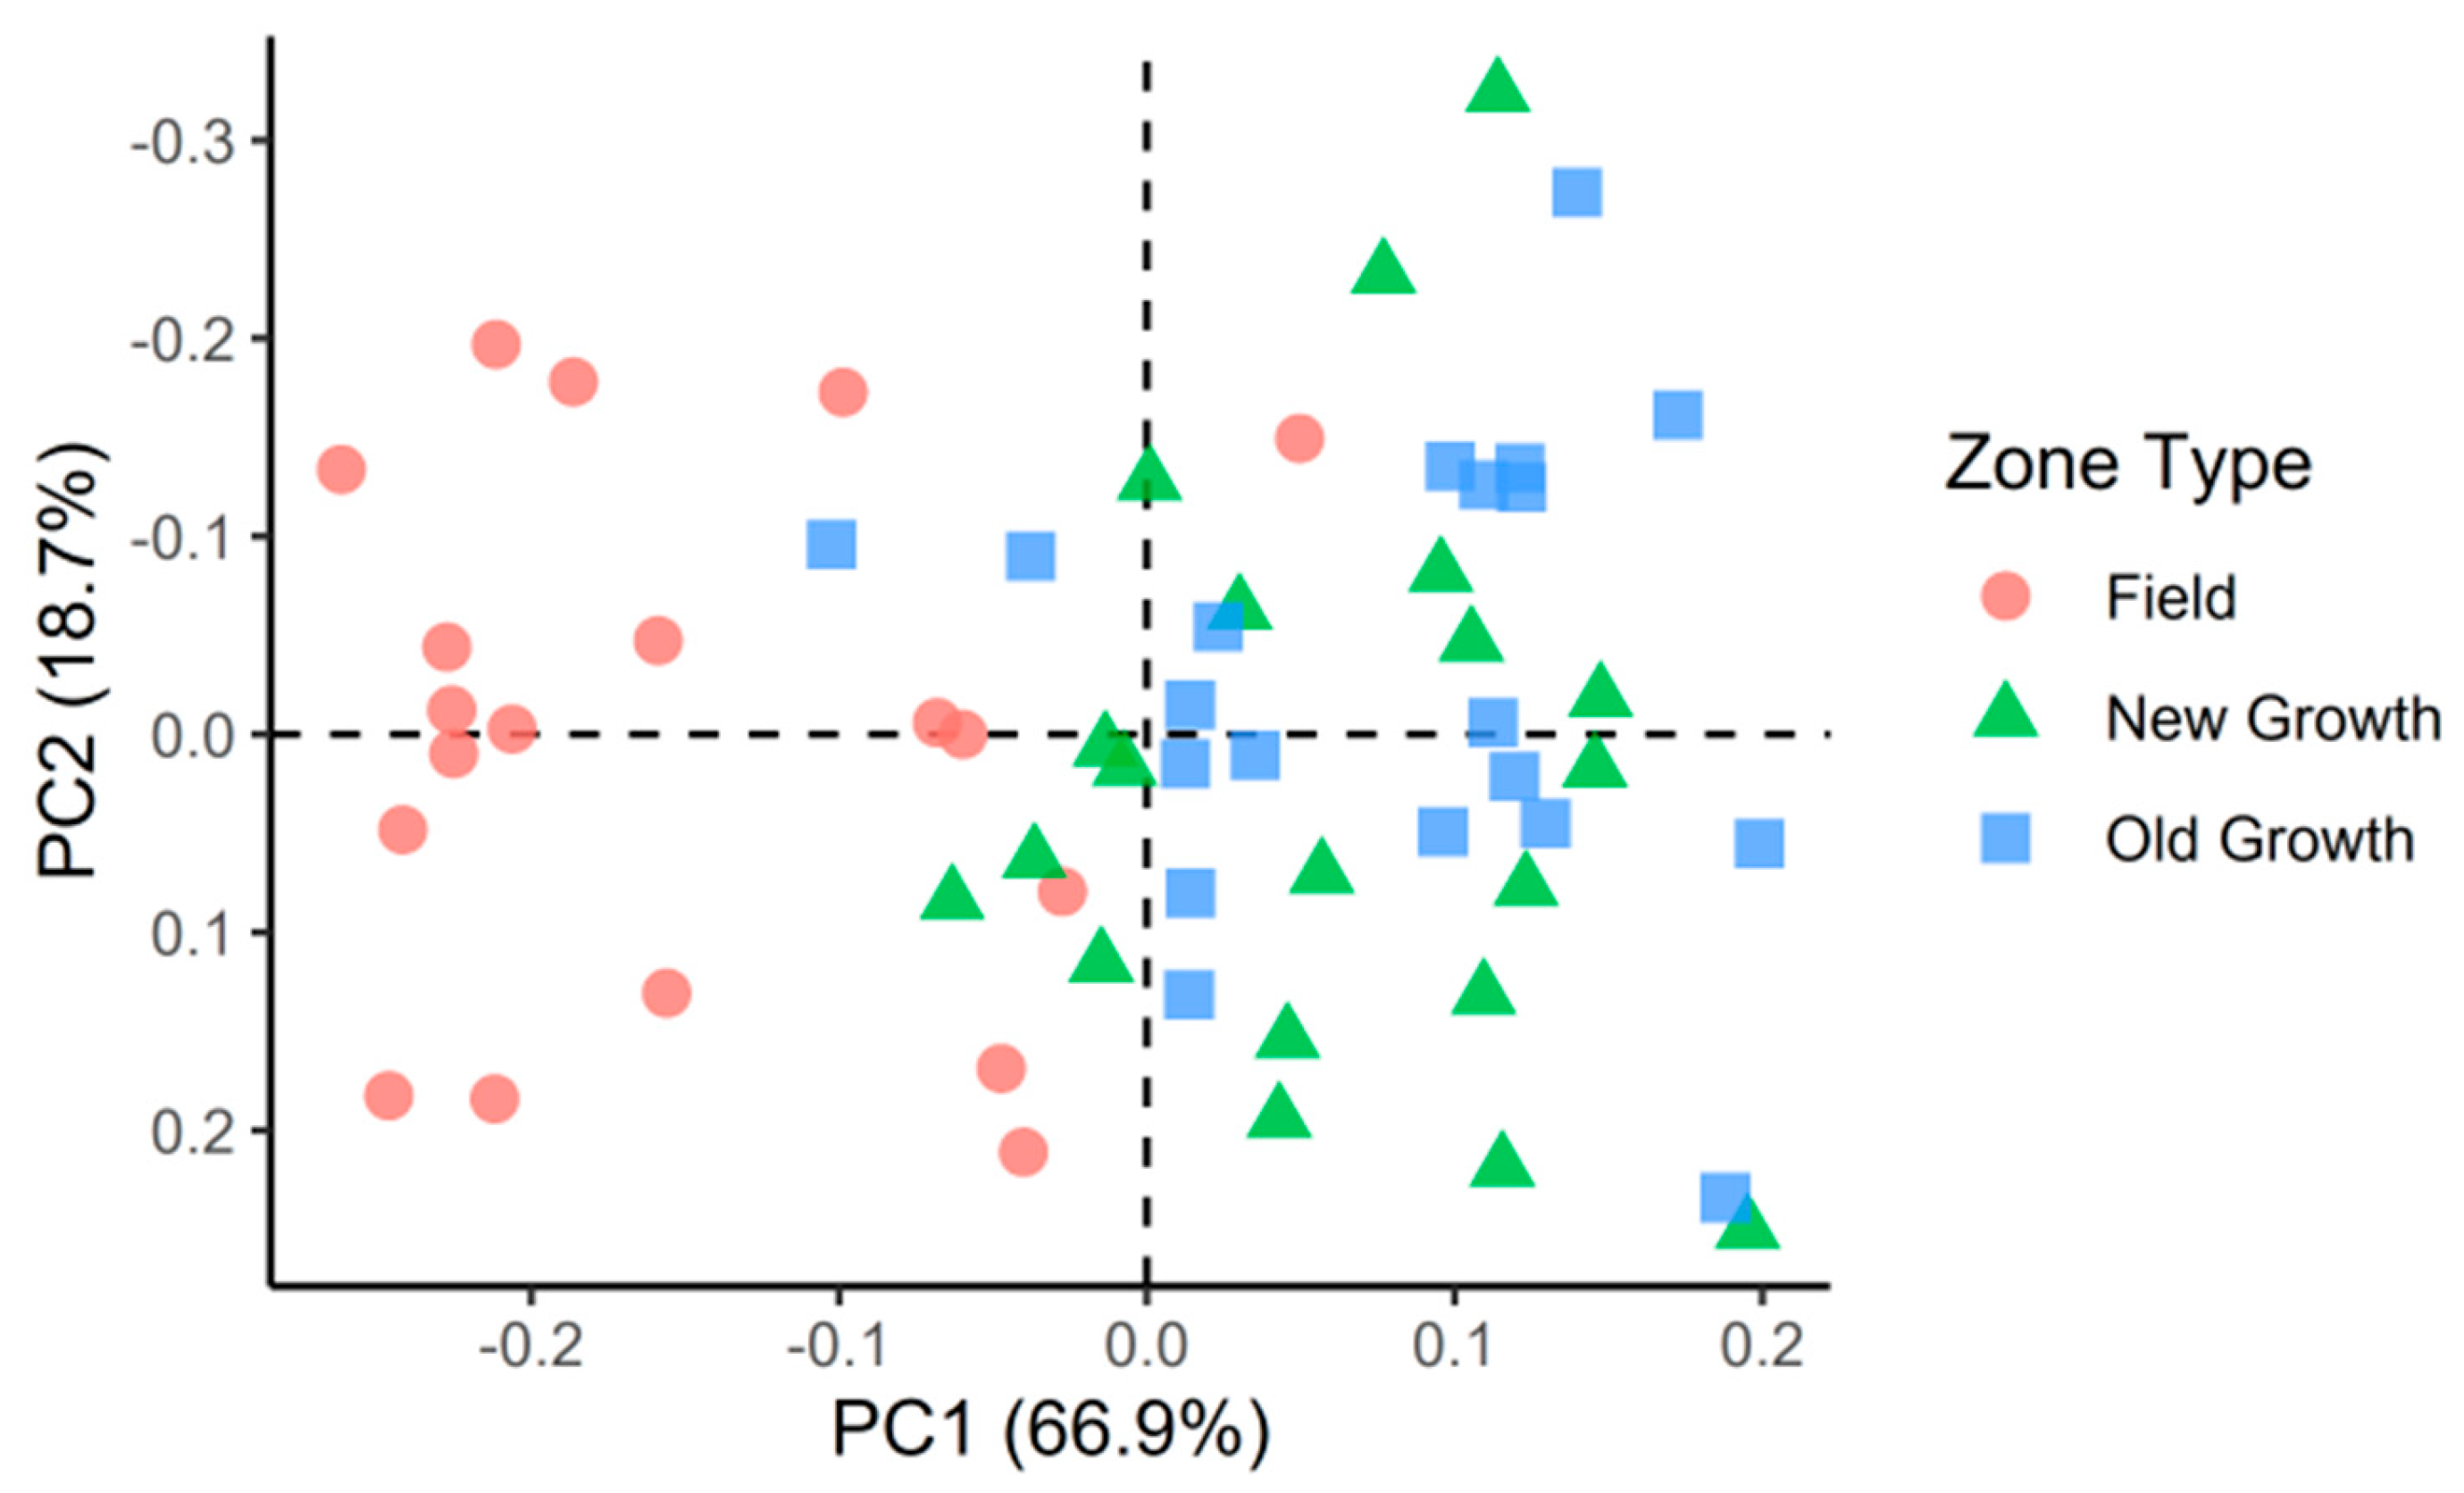
Surface soil quality before flooding was often similar among the new and old-growth forested areas but differed from that found in the abandoned farm field areas (Figure 2 and Figure 3). The field zone had the highest average soil Pext (1.59 ± 0.13 mg-P/g-soil), followed by old growth (1.45 ± 0.13 mg-P/g-soil) and new growth (1.41 ± 0.10 mg-P/g-soil) forests (ANOVA F = 9.9, p = 0.003; Figure 2). The abandoned farm field zone had the lowest average SOM (3.9 ± 0.7%) followed by new growth (6.6 ± 1.4%) and old growth (7.0 ± 1.2%) forests (ANOVA F = 26.1, p = 0.0001; Figure 2). Surface soil temperature differed significantly among the zones (ANOVA F = 53.4, p = 0.0406) with the lowest average temperature in the abandoned farm fields (15.9 ± 2.8 °C) followed by new growth (16.7 ± 0.8 °C) and old growth (16.9 ± 1.2 °C; Table 2). Soil moisture and pH significantly differed among zones (ANOVA F = 57.7 p = 0.0001 and ANOVA F = 3.4 p = 0.0001, respectively). Average moisture was lowest in the abandoned farm field (43.2 ± 8.9%) followed by the new growth (73.4 ± 8.2%) and old growth (86.2 ± 11.7%). pH was lowest in the old-growth forest (5.8 ± 0.2) followed by the new-growth forest (6.0 ± 0.1) and highest in abandoned farm field zone (6.4 ± 0.1; Table 2). Water-extractable SOM characteristics were more humic-like, more degraded, and less protein-like in new and old-growth forest zones compared to field zones, which had less degraded and more microbial-like characteristics (MANOVA F = 23.3, p = 0.0001; Table 3, Figure 3). Overall, pre-flood surface soil properties displayed significant differences amongst each zone type, with the abandoned farm field zone being more distinct from the forested zones.
Bottom and surface soil core samples were analyzed to determine if there was a difference between soil depth or an interaction between zone type and soil depth. Across all zones, there was a significant difference in SOM between surface and bottom (ANOVA F = 25.9, p = 0.0001). Surface samples had more organic matter content, with the average difference in SOM between surface and bottom samples being just over two percent. Phosphorus did not differ by depth (ANOVA F = 6.6, p = 0.5377). The average difference between surface and bottom samples for Pext was 0.0214 g-P/g-soil. Because bottom samples were not recorded for temperature, pH, moisture or organic matter quality indicators, comparing statistics between sites by depth is not possible. These findings suggest that the zone type (i.e., land-use history) effect on soil health was confined to the surface soils.
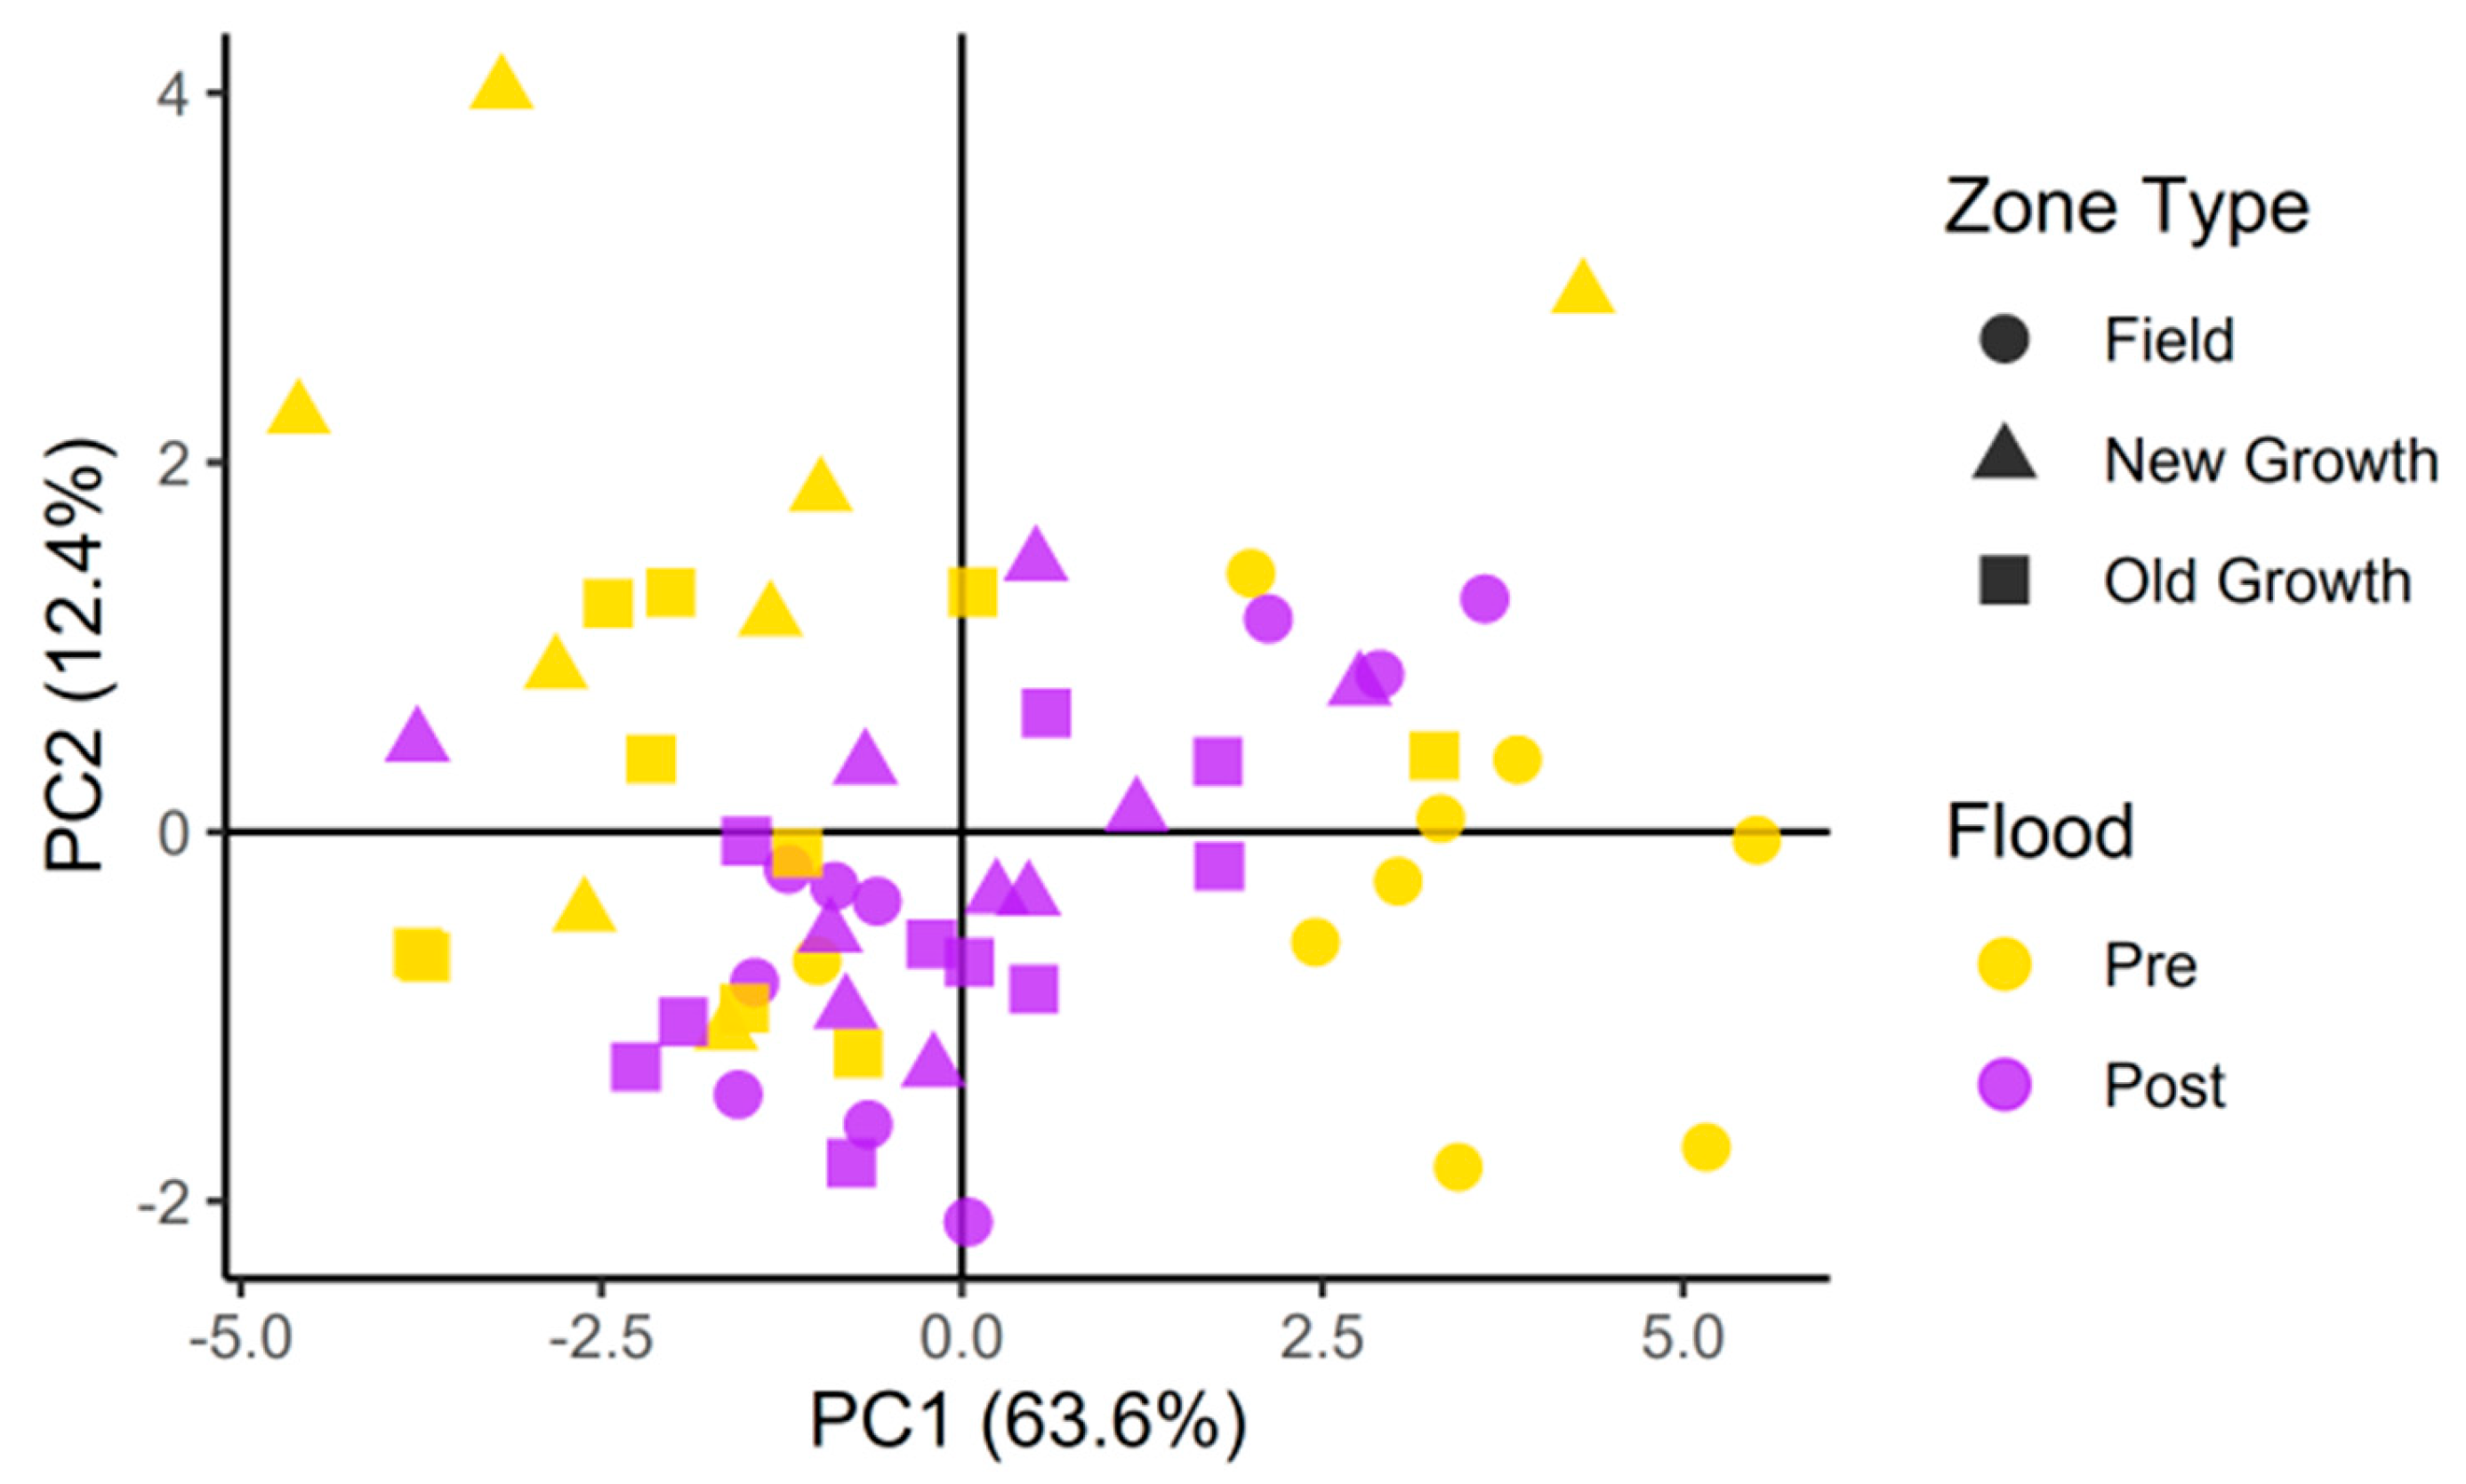
Flooding of the study area caused a significant change in soil characteristics, with the most pronounced shift in the abandoned farm field zone. Post-flood soils no longer had a zonal trend in Pext with all sites now having similar phosphorus levels. Post-flood phosphorus levels were lower on average after flooding (ANOVA F = 24.3, p = 0.0001) and shifted from 1.48 ± 0.16 mg-P/g-soil pre-flood to 1.33 ± 0.11 mg-P/g-soil post-flood (Figure 2). For SOM, there was a significant interaction between zone type and flood period (ANOVA F = 6.5, p = 0.0022). Flooding did not impact SOM in forested zones but significantly increased organic matter content in the field zone (Figure 2). Water-extractable SOM characteristics also shifted post-flood from their pre-flood composition (MANOVA F = 4.8, p = 0.0008). Similarly to SOM content patterns, water extractable SOM characteristics shifted most in the field zone, causing the pre-flood microbial-like and protein-like characteristics of the field zone soils to shift towards more terrestrial and humic-like end members (Table 3, Figure 4). Overall, these results suggest that flooding might have caused some leaching of legacy phosphorus from the study area into the river and that the organic characteristics of the materials delivered to the floodplain soils were similar to that already present within the soils of the new and old-growth forest zones of the study area.

4. Discussion

Land-use history significantly impacted surface soil conditions in our study area. Soil was in better condition in zones that had old and new forests compared to field zones that were intensively farmed for corn until 2018. Although the field zones are presently a mixture of short-grass prairie plant and juvenile pioneering softwood species, the surface soil characteristics still showed signs of degradation and agricultural impact. Deeper soil conditions were similar across zones, possibly because all locations, even the old-growth forest, had been historically used for agriculture. Post-flood, surface soil quality indicators in the field zone shifted towards those observed at the forested site and were associated with a decrease in phosphorus levels. This suggests that surface soil restoration could occur more quickly if the floodplain is more connected to the river system than through forest restoration alone. Flooding may also help the ecosystem reestablish as a community more indicative of its pre-1900 condition (i.e., a silver maple floodplain forest).
Across the study area, soil conditions showed signs of past anthropogenic disturbances. Surface and subsurface phosphorus levels were on the higher end of the range reported for other restored ecosystems (Table 3; Figure 2). For example, total phosphorus levels across restored grasslands in Europe ranged from 0.1 to 4.0 mg-P/g-soil [18], and Pext levels in our study ranged narrowly between 1.3 and 1.6 mg-P/g-soil, suggesting strong phosphorus legacies from past agricultural activities. In Vermont soils, phosphorus levels reported in our study were consistent with those found in agricultural fields (>1 mg-P/g-soil) and much higher than those found in forested areas [39]. In general, soils in older forests or restored forests tended to have lower P levels than those observed at recently restored sites or areas currently under agriculture. For example, in a global meta-analysis of afforestation, total and available phosphorous decreased by 11–12% from prior land-use conditions, with the greatest effect being observed in afforested cropland and agricultural sites [40]. In Dashanchong Forest Park, China, forest restoration soiled to a decrease in phosphorus content in both surface and deep soils [41]. Late-stage forest restoration soils had the lowest phosphorus content and exhibited similar phosphorus levels across soil depths [41]. In contrast, our study found no impact of land-use history on deep soil phosphorus content. It is possible that focusing our sampling around the A-horizon limited this study’s ability to discern soil depth patterns. Moreover, this study used acid-persulfate phosphorus extraction methods and did not determine reactive or exchangeable phosphorus patterns. This limits our ability to determine mechanisms underlying the observed patterns or to identify changes in phosphorus fractionation. Still, our findings align with the idea that restored agricultural lands consistently retain more phosphorus then their reference forest counterparts [17,39].
Post-flooded surface soils had similar Pext concentrations across zones and significantly lower concentrations than those measured pre-flood. Flooding alters redox conditions and biogeochemical interactions in surface soils by saturating them, limiting oxygen exchange, shifting pH, and affecting decomposition pathways. Collectively, these shifts mobilize and release phosphorus into floodwaters. [42,43,44]. The amount of phosphorus released from high-P soils during summer flood periods is often proportional to the concentration of phosphorus [45]. In Poland’s Vistula River watershed, during short-term flooding, the quality of the floodwater had a lesser impact on phosphorus flux from inundated soils than did soil phosphorus concentration [42]. The mechanism behind flood-induced changes in phosphorus levels is linked to water content, decomposition rates, phosphorus-binding capacity of iron and SOM, and the redox state of the soil. Soils that are relatively dry at the time of flooding tend to leach more phosphorus than more saturated soils [46]. Flooding causes increased decomposition of reactive forms of SOM and the subsequent release of phosphorus [43]. With increased decomposition and limited exchange of oxygen in saturated soils, redox conditions favor anaerobic metabolisms, which promote the release of phosphorus from soils. In this study, soils contained high phosphorus levels and abundant reactive SOM (Table 2 and Table 3; Figure 2). These factors likely contributed to phosphorus being released from surface soils into the overlying floodwater. The magnitude of change was similar across zones, which suggests that biogeochemical cycles and the land-use history of the Natural Area had a stronger impact of flood–phosphorus dynamics than current land use and cover. However, the exact mechanistic details of the observed response could not be resolved.
Agricultural soils tend to be more compacted and have lower SOM content than more natural grassland and forest soils [3,4,10]. Across the Natural Area in this study, soil moisture and SOM content (~4%) were lowest in the formerly agricultural zones compared to the forested zones (SOM ~6–8%; Table 2, Figure 2). When comparing SOM across depths, this land-use effect disappeared—deep SOM was consistently lower than surface SOM across all zones. SOM levels in the Natural Area were high compared to other studies, but differed as expected across zones [47,48]. The higher SOM levels observed here are likely due to the hydric nature and mineral composition the soil [23]. With respect to quality, SOM in recently abandoned fields and agricultural lands is more aliphatic, smaller in size, and more microbial-like than that found at forested sites (Table 3, Figure 3) [1,33,47].
Across restored prairie and forest systems, similar patterns of SOM change have been observed in multiple studies. The longer the time since restoration—or the more natural the ecosystem—the higher the SOM content and the more humic the SOM quality [4,10,41,49]. Agricultural sites or newly restored areas tend to have low levels of SOM [4,10,41,49]. For example, SOM stocks were highest in ancient forests (>400 years old), followed by established forests (50–120 year old), and lowest in agricultural land [4]. This trend was observed in surface (0–20 cm) soils but not significant at depth of 20–40 cm [4]. Likewise, in our study and others, SOM enhancements associated with restoration were more prominent in surface soils than in deeper soils (Figure 2; [49]). Moreover, in restored grasslands, the restoration effects in SOM and water-holding capacity were not observed until at least seven years after restoration efforts began [10,49]. In our study, farming ceased in 2018, making the area five years post-recolonization; this relatively short timespan may have been insufficient to detect a clear restoration effect solely attributable to land -se change. Still, SOM content in the recently abandoned farm field exceeded the 2–3% threshold generally considered necessary for successful soil restoration [15], although it remained indicative of impaired conditions [50]. Taken together, these results and comparisons while some progress has been made, the recent restoration of the agricultural area has not yet fully restored soil quality and health.
Restoration of SOM content and shifts toward more slowly degraded forms of SOM in formerly agricultural lands can increase soil water-holding capacity. Improved water holding capacity helps soils absorb floodwaters and protect downstream ecosystems [10,51]. In addition, shifting soil characteristics toward more humic and aromatic forms can decease soil decomposition rates and increase phosphorus retention [43]. Healthy surface layer carbon stocks might be key to phosphorus processing success of floodplains, and restoration needs to allow for soils to accumulate and not be eroded away during flooding [5,51]. Likewise, course woody debris and organic matter additions as part of restoration activities have been shown to more rapidly increase soil health, which in turn can better set up the habitat for successful vegetation reestablishment [3].
In terrestrial ecosystems that experience flooding, the impact of flooding on SOM patterns has produced mixed results. Along the Saint-François and Massawippi Rivers in Southern Quebec, Canada, SOM content decreases with increases in flood frequency [21,48,52]. Areas with a flood frequency of 0 to 20 years have less SOM than those with a flood frequency of 20 to 100 years. Sites with more frequent flooding have a reduced or absent litter layer compared to those flooded less frequently. In contrast, frequently flooded riparian areas of the Lijiang River (southwest China) had three times higher SOM levels than nearby, seldomly flooded uplands [22]. This study also found litter amounts were higher in less frequently flooded areas but attributed the observed pattern of more SOM-rich soils in frequently flooded areas to sedimentation rates exceeding soil erosion rates, differences in geology, and land use in the riparian zone [22]. In this study, the flooding impact was dependent on the land use of the zone rather than flood frequency. All zones within the study were frequently flooded (0 to 20 years between floods) and shared a similar underlying soil formation. One notable difference is that the zones selected for this study all have a dense understory and lack an abundant litter layer. The flood pushed down vegetation and coated everything in a layer of sediment. Visual evidence of erosion was not observed. Hence, the flood-associated increase and preservation of SOM across study zones is likely a product of how the flood occurred, vegetation patterns, and the land-use history of the area. As a one-time event and a single point-in-time study, the interpretation of these results are limited, and an exact mechanism to explain these results cannot be determined. Comparison with other studies suggests there might not be a uniform response of SOM to flooding, and more cases need to be studied to understand what drives SOM retention in degraded floodplain landscapes.

5. Conclusions

The results of our study lead to the hypotheses that (1) flooding events help accelerate the restoration of surface organic matter conditions and (2) episodic flooding and floodplain connection help precondition degraded soils prior to restoration. Flooding caused surface SOM content and quality to better match that of a forested system, with more complex forms of organic matter and enhanced levels of SOM in the recently abandoned agricultural zone (Figure 2 and Figure 4). Flooding also homogenized surface soil phosphorus levels across zones, which suggests that phosphorus might have been released into the water column and that the suspended sediments in the river contained less phosphorus than Natural Area soils. Combined with the spatial patterns observed pre-flood, the results of this study suggest organic matter restoration of soils is relatively fast compared to phosphorus pollution remediation. Spontaneous colonization of vegetation in the Natural Area has significantly improved organic matter levels but has not yet removed the agricultural legacy of phosphorus. Episodic flooding might help accelerate both organic matter and phosphorus recovery in restored soil. However, this might come at the expense of downstream waters, which would receive the leached phosphorus pollution. Repeated investigation of the Natural Area is needed to determine how lasting the flood impacts are on ecosystem restoration and soil health. Still, controlled flooding of floodplain restoration areas could be a useful tool to accelerate soil recovery and enhance the recovery of floodplain ecosystems.

Author Contributions

Conceptualization, A.W. and C.J.W.; methodology, A.W. and C.J.W.; formal analysis, A.W., A.J., and C.J.W.; data curation, C.J.W.; writing—original draft preparation, A.W., A.J., and C.J.W.; writing—review and editing, A.W., A.J., and C.J.W.; visualization, C.J.W.; funding acquisition, A.J. and A.W. All authors have read and agreed to the published version of the manuscript.

Funding

This research was funded Saint Michael’s College and the Vice President of Academic Affairs Undergraduate Scholars Program in 2023. A.W. and A.J. received the awards.

Institutional Review Board Statement

Not applicable.

Informed Consent Statement

Not applicable.

Data Availability Statement

Data are available through FigShare [53] https://doi.org/10.6084/m9.figshare.29803547.v1. (accessed on 2 August 2025).

Acknowledgments

We thank Grace Sounders for her help in collecting soil samples, conducting vegetation surveys, and for keeping everyone smiling. We thank the Vermont Limnology Lab and Ana Morales at the University of Vermont for use of their Seal AQ300 Discrete Analyzer and Julia Perdrial at the University of Vermont for access to their Horiba Aqualog. We also thank two anonymous reviewers for their helpful insights, which strengthened this manuscript.

Conflicts of Interest

The authors declare no conflicts of interest. The funders had no role in the design of the study; in the collection, analyses, or interpretation of data; in the writing of the manuscript; or in the decision to publish the results.

References

  1. Xenopoulos, M.A.; Barnes, R.T.; Boodoo, K.S.; Butman, D.; Catalán, N.; D’Amario, S.C.; Fasching, C.; Kothawala, D.N.; Pisani, O.; Solomon, C.T.; et al. How Humans Alter Dissolved Organic Matter Composition in Freshwater: Relevance for the Earth’s Biogeochemistry. Biogeochemistry 2021, 154, 323–348. [Google Scholar] [CrossRef]
  2. Bhaduri, D.; Sihi, D.; Bhowmik, A.; Verma, B.C.; Munda, S.; Dari, B. A Review on Effective Soil Health Bio-Indicators for Ecosystem Restoration and Sustainability. Front. Microbiol. 2022, 13, 938481. [Google Scholar] [CrossRef] [PubMed]
  3. Raupp, P.; Carrillo, Y.; Nielsen, U.N. Soil Health to Enhance Ecological Restoration and Conservation. J. Sustain. Agric. Environ. 2024, 3, e70022. [Google Scholar] [CrossRef]
  4. Ashwood, F.; Watts, K.; Park, K.; Fuentes-Montemayor, E.; Benham, S.; Vanguelova, E.I. Woodland Restoration on Agricultural Land: Long-term Impacts on Soil Quality. Restor. Ecol. 2019, 27, 1381–1392. [Google Scholar] [CrossRef]
  5. Inamdar, S.P.; Kaushal, S.S.; Tetrick, R.B.; Trout, L.; Rowland, R.; Genito, D.; Bais, H. More Than Dirt: Soil Health Needs to Be Emphasized in Stream and Floodplain Restorations. Soil Syst. 2023, 7, 36. [Google Scholar] [CrossRef]
  6. Foley, J.A.; DeFries, R.; Asner, G.P.; Barford, C.; Bonan, G.; Carpenter, S.R.; Chapin, F.S.; Coe, M.T.; Daily, G.C.; Gibbs, H.K.; et al. Global Consequences of Land Use. Science 2005, 309, 570–574. [Google Scholar] [CrossRef]
  7. Steffen, W.; Richardson, K.; Rockström, J.; Cornell, S.E.; Fetzer, I.; Bennett, E.M.; Biggs, R.; Carpenter, S.R.; De Vries, W.; De Wit, C.A.; et al. Planetary Boundaries: Guiding Human Development on a Changing Planet. Science 2015, 347, 1259855. [Google Scholar] [CrossRef]
  8. Perry, L.G.; Reynolds, L.V.; Beechie, T.J.; Collins, M.J.; Shafroth, P.B. Incorporating Climate Change Projections into Riparian Restoration Planning and Design. Ecohydrology 2015, 8, 863–879. [Google Scholar] [CrossRef]
  9. Lemke, M.J.; Hagy, H.M.; Dungey, K.; Casper, A.F.; Lemke, A.M.; VanMiddlesworth, T.D.; Kent, A. Echoes of a Flood Pulse: Short-Term Effects of Record Flooding of the Illinois River on Floodplain Lakes under Ecological Restoration. Hydrobiologia 2017, 804, 151–175. [Google Scholar] [CrossRef]
  10. De, M.; Riopel, J.A.; Cihacek, L.J.; Lawrinenko, M.; Baldwin-Kordick, R.; Hall, S.J.; McDaniel, M.D. Soil Health Recovery after Grassland Reestablishment on Cropland: The Effects of Time and Topographic Position. Soil Sci. Soc. Am. J. 2020, 84, 568–586. [Google Scholar] [CrossRef]
  11. Steiner, M.; Pingel, M.; Falquet, L.; Giffard, B.; Griesser, M.; Leyer, I.; Preda, C.; Uzman, D.; Bacher, S.; Reineke, A. Local Conditions Matter: Minimal and Variable Effects of Soil Disturbance on Microbial Communities and Functions in European Vineyards. PLoS ONE 2023, 18, e0280516. [Google Scholar] [CrossRef] [PubMed]
  12. Schoonover, J.E.; Crim, J.F. An Introduction to Soil Concepts and the Role of Soils in Watershed Management. J. Contemp. Water Res. Educ. 2015, 154, 21–47. [Google Scholar] [CrossRef]
  13. De Deyn, G.B.; Kooistra, L. The Role of Soils in Habitat Creation, Maintenance and Restoration. Philos. Trans. R. Soc. B Biol. Sci. 2021, 376, 20200170. [Google Scholar] [CrossRef]
  14. Kooch, Y.; Ghorbanzadeh, N.; Haghverdi, K.; Francaviglia, R. Soil Quality Cannot Be Improved after Thirty Years of Land Use Change from Forest to Rangeland. Sci. Total Environ. 2023, 856, 159132. [Google Scholar] [CrossRef]
  15. Lal, R. Restoring Soil Quality to Mitigate Soil Degradation. Sustainability 2015, 7, 5875–5895. [Google Scholar] [CrossRef]
  16. Wohl, E. An Integrative Conceptualization of Floodplain Storage. Rev. Geophys. 2021, 59, e2020RG000724. [Google Scholar] [CrossRef]
  17. Parkhurst, T.; Standish, R.J.; Prober, S.M. P Is for Persistence: Soil Phosphorus Remains Elevated for More than a Decade after Old Field Restoration. Ecol. Appl. 2022, 32, e2547. [Google Scholar] [CrossRef]
  18. Goossens, E.P.; De Schrijver, A.; Schelfhout, S.; Vanhellemont, M.; Verheyen, K.; Mertens, J. Phosphorus Puts a Mortgage on Restoration of Species-rich Grasslands on Former Agricultural Land. Restor. Ecol. 2022, 30, e13523. [Google Scholar] [CrossRef]
  19. Maloney, K.O.; Feminella, J.W.; Mitchell, R.M.; Miller, S.A.; Mulholland, P.J.; Houser, J.N. Landuse Legacies and Small Streams: Identifying Relationships between Historical Land Use and Contemporary Stream Conditions. J. N. Am. Benthol. Soc. 2008, 27, 280–294. [Google Scholar] [CrossRef]
  20. Bieluczyk, W.; Merloti, L.F.; Cherubin, M.R.; Mendes, L.W.; Bendassolli, J.A.; Rodrigues, R.R.; Camargo, P.B.D.; Van Der Putten, W.H.; Tsai, S.M. Forest Restoration Rehabilitates Soil Multifunctionality in Riparian Zones of Sugarcane Production Landscapes. Sci. Total Environ. 2023, 888, 164175. [Google Scholar] [CrossRef] [PubMed]
  21. Saint-Laurent, D.; Gervais-Beaulac, V.; Paradis, R.; Arsenault-Boucher, L.; Demers, S. Distribution of Soil Organic Carbon in Riparian Forest Soils Affected by Frequent Floods (Southern Québec, Canada). Forests 2017, 8, 124. [Google Scholar] [CrossRef]
  22. Qin, Y.; Xin, Z.; Wang, D. Comparison of Topsoil Organic Carbon and Total Nitrogen in Different Flood-Risk Riparian Zones in a Chinese Karst Area. Environ. Earth Sci. 2016, 75, 1038. [Google Scholar] [CrossRef]
  23. Wu, Z.; Chen, Y.; Zhu, Y.; Feng, X.; Ou, J.; Li, G.; Tong, Z.; Yan, Q. Mapping Soil Organic Carbon in Floodplain Farmland: Implications of Effective Range of Environmental Variables. Land 2023, 12, 1198. [Google Scholar] [CrossRef]
  24. Tarnacki, M. Easement Boosts Vibrant Natural Area and Its Ecology. Saint Michael’s College, 14 January 2021. Available online: https://www.smcvt.edu/about-smc/news/2021/january/easement-boosts-vibrant-natural-area-and-its-ecology/ (accessed on 29 July 2025).
  25. VCGI. Vermont Imagery Finder. Available online: https://vcgi.vermont.gov/ (accessed on 15 May 2025).
  26. NOAA. The Great Vermont Flood of 10–11 July 2023: Preliminary Meteorological Summary. Available online: https://www.weather.gov/btv/The-Great-Vermont-Flood-of-10-11-July-2023-Preliminary-Meteorological-Summary (accessed on 10 May 2025).
  27. Tarnacki, M. Natural Area Plays Predictable, Useful Role during Epic Vermont Flooding. Saint Michael’s College, 11 July 2023. Available online: https://www.smcvt.edu/about-smc/news/2023/july/natural-area-plays-predictable-useful-role-during-epic-vermont-flooding/ (accessed on 29 July 2025).
  28. Post, W.M.; Izaurralde, R.C.; Mann, L.K.; Bliss, N. Monitoring and Verifying Changes of Organic Carbon in Soil. In Storing Carbon in Agricultural Soils: A Multi-Purpose Environmental Strategy; Rosenberg, N.J., Izaurralde, R.C., Eds.; Springer: Dordrecht, The Netherlands, 2001; pp. 73–99. ISBN 978-90-481-5759-4. [Google Scholar]
  29. Nelson, N.S. An Acid-persulfate Digestion Procedure for Determination of Phosphorus in Sediments. Commun. Soil. Sci. Plant Anal. 1987, 18, 359–369. [Google Scholar] [CrossRef]
  30. Seal Analytical Phosphorus-P, Total, in Surface and Saline Waters, Domestic and Industrial Wastes. 2020. Available online: https://seal-analytical.com/en/methods/phosphate/ (accessed on 29 July 2025).
  31. Hansen, A.; Fleck, J.; Kraus, T.; Downing, B.; von Dessonneck, T.; Bergamaschi, B. Procedures for Using the Horiba Scientific Aqualog® Fluorometer to Measure Absorbance and Fluorescence from Dissolved Organic Matter; Open-File Report; U.S. Geological Survey: Reston, VA, USA, 2018; p. 42. [Google Scholar]
  32. Helms, J.R.; Stubbins, A.; Ritchie, J.D.; Minor, E.C.; Kieber, D.J.; Mopper, K. Absorption Spectral Slopes and Slope Ratios as Indicators of Molecular Weight, Source, and Photobleaching of Chromophoric Dissolved Organic Matter. Limnol. Oceanogr. 2008, 53, 955–969. [Google Scholar] [CrossRef]
  33. Wilson, H.F.; Xenopoulos, M.A. Effects of Agricultural Land Use on the Composition of Fluvial Dissolved Organic Matter. Nat. Geosci. 2009, 2, 37–41. [Google Scholar] [CrossRef]
  34. Ohno, T. Fluorescence Inner-Filtering Correction for Determining the Humification Index of Dissolved Organic Matter. Environ. Sci. Technol. 2002, 36, 742–746. [Google Scholar] [CrossRef]
  35. Posit team. RStudio: Integrated Development Environment for R, Posit Software, PBC, Boston, MA, USA. 2023. Available online: http://www.posit.co/ (accessed on 29 July 2025).
  36. Wickham, H.; Averick, M.; Bryan, J.; Chang, W.; McGowan, L.D.; François, R.; Grolemund, G.; Hayes, A.; Henry, L.; Hester, J.; et al. Welcome to the tidyverse. J. Open Source Softw. 2019, 4, 1686. [Google Scholar] [CrossRef]
  37. Oksanen, J.; Simpson, G.L.; Blanchet, F.G.; Kindt, R.; Legendre, P.; Minchin, P.R.; O’Hara, R.B.; Solymos, P.; Stevens, M.H.H.; Szoecs, E.; et al. Vegan: Community Ecology Package. R Package Version 2.6-10. 2025. Available online: https://CRAN.R-project.org/package=vegan (accessed on 29 July 2025).
  38. R: The R Project for Statistical Computing. Available online: https://www.r-project.org/ (accessed on 30 May 2025).
  39. Perillo, V.L.; Ross, D.S.; Wemple, B.C.; Balling, C.; Lemieux, L.E. Stream Corridor Soil Phosphorus Availability in a Forested–Agricultural Mixed Land Use Watershed. J. Environ. Qual. 2019, 48, 185–192. [Google Scholar] [CrossRef]
  40. Deng, Q.; McMahon, D.E.; Xiang, Y.; Yu, C.; Jackson, R.B.; Hui, D. A Global Meta-analysis of Soil Phosphorus Dynamics after Afforestation. New Phytol. 2017, 213, 181–192. [Google Scholar] [CrossRef]
  41. Xu, C.; Xiang, W.; Gou, M.; Chen, L.; Lei, P.; Fang, X.; Deng, X.; Ouyang, S. Effects of Forest Restoration on Soil Carbon, Nitrogen, Phosphorus, and Their Stoichiometry in Hunan, Southern China. Sustainability 2018, 10, 1874. [Google Scholar] [CrossRef]
  42. Banach, A.M.; Banach, K.; Visser, E.J.W.; Stępniewska, Z.; Smits, A.J.M.; Roelofs, J.G.M.; Lamers, L.P.M. Effects of Summer Flooding on Floodplain Biogeochemistry in Poland; Implications for Increased Flooding Frequency. Biogeochemistry 2009, 92, 247–262. [Google Scholar] [CrossRef]
  43. De-Campos, A.B.; Huang, C.; Johnston, C.T. Biogeochemistry of Terrestrial Soils as Influenced by Short-Term Flooding. Biogeochemistry 2012, 111, 239–252. [Google Scholar] [CrossRef]
  44. Akpoveta, V.O.; Osakwe, S.A.; Ize-Iyamu, O.K.; Medjor, W.O.; Egharevba, F. Post Flooding Effect on Soil Quality in Nigeria: The Asaba, Onitsha Experience. Open J. Soil. Sci. 2014, 4, 72–80. [Google Scholar] [CrossRef]
  45. Kumaragamage, D.; Amarawansha, G.S.; Indraratne, S.P.; Jayarathne, K.; Flaten, D.N.; Zvomuya, F.; Akinremi, O.O. Degree of Phosphorus Saturation as a Predictor of Redox-Induced Phosphorus Release from Flooded Soils to Floodwater. J. Environ. Qual. 2019, 48, 1817–1825. [Google Scholar] [CrossRef]
  46. Khan, S.U.; Hooda, P.S.; Blackwell, M.S.A.; Busquets, R. Effects of Drying and Simulated Flooding on Soil Phosphorus Dynamics from Two Contrasting UK Grassland Soils. Eur. J. Soil. Sci. 2022, 73, e13196. [Google Scholar] [CrossRef]
  47. Tang, J.; Liu, E.; Li, Y.; Tang, Y.; Tian, Y.; Du, S.; Li, H.; Wan, L.; Zhang, Q. Afforestation Promotes Soil Organic Carbon and Soil Microbial Residual Carbon Accrual in a Seasonally Flooded Marshland. Forests 2024, 15, 1542. [Google Scholar] [CrossRef]
  48. Gervais-Beaulac, V. Organic Carbon Distribution in Alluvial Soils According to Different Flood Risk Zones. J. Soil. Sci. Environ. Manag. 2013, 4, 169–177. [Google Scholar] [CrossRef]
  49. Jelinski, N.A.; Kucharik, C.J. Land-use Effects on Soil Carbon and Nitrogen on a U.S. Midwestern Floodplain. Soil. Sci. Soc. Am. J. 2009, 73, 217–225. [Google Scholar] [CrossRef]
  50. Schoenholtz, S.H.; Miegroet, H.V.; Burger, J.A. A Review of Chemical and Physical Properties as Indicators of Forest Soil Quality: Challenges and Opportunities. For. Ecol. Manag. 2000, 138, 335–356. [Google Scholar] [CrossRef]
  51. Kiedrzyńska, E.; Kiedrzyński, M.; Zalewski, M. Sustainable Floodplain Management for Flood Prevention and Water Quality Improvement. Nat. Hazards 2015, 76, 955–977. [Google Scholar] [CrossRef]
  52. Paradis, R.; Saint-Laurent, D. Spatial Distribution of Organic Carbon and Nitrogen in Soils Related to Flood Recurrence Intervals and Land Use Changes in Southern Qubec, Canada. J. Soil. Sci. Environ. Manag. 2017, 8, 25–36. [Google Scholar] [CrossRef]
  53. Williams, C. Assessing the Effect of Undirected Forest Restoration and Flooding on the Soil Quality in an Agricultural Floodplain. Figshare. 2025. Dataset. Available online: https://figshare.com/articles/dataset/Assessing_the_Effect_of_Undirected_Forest_Restoration_and_Flooding_on_the_Soil_Quality_in_an_Agricultural_Floodplain/29803547/1 (accessed on 29 July 2025).
Figure 1. Map of study area (Saint Michael’s College Natural Area, Colchester, VT, USA; 73°9′1″ W 44°29′33″ N) and land-use change demonstrated by Vermont Aerial Imagery for 1942, 1962, and 2021, with three zone types (recently abandoned farm field, new-growth forest, and old-growth forest) and plot replicates indicated.
Soilsystems 09 00088 g001
Figure 2. Comparison of extractable soil phosphorus levels and soil organic matter content (SOM) across zones and pre- and post-flooding.
Soilsystems 09 00088 g002
Figure 3. Principal components (pc) analysis axis 1 and 2 of 24 h water extractable soil organic matter characteristics. Figure visualizes the significant MANOVA result that field soils had more protein-like, fresher, and microbial-like organic matter signatures than forested soils in the study area.
Soilsystems 09 00088 g003
Figure 4. Principal components (PC) analysis axis 1 and 2 with percentage variance explained of 30 min water extractable soil organic matter characteristics. Figure visualizes the significant MANOVA result that soil organic matter properties shifted to a more consistent mixture of multiple sources and degradation states of organic matter across zones with the greatest effect at field plots. Note, Figure 4 PC 1 is set at an inverse orientation to what is visualized in Figure 3.
Soilsystems 09 00088 g004
Table 1. Timeline of land use and cover history for abandoned farm field, new-growth forest, and old-growth forest zones.
ZonePre 19001900 to 19421942 to 19621962 to 20182018 to Present
Field Plot A and BUnknownUsed for sheep, cattle, and potato farmingUsed for sheep, cattle, and potato farmingConventional row crop, corn agricultureNaturally recolonizing with grasses and trees
New-growth Plot A and BUnknownUsed for sheep, cattle, and potato farmingUsed for sheep, cattle, and potato farmingReforestedForested
Old-growth Plot AUnknownForested riparianForested riparianForested riparianForested riparian
Old-growth Plot BRiver island presumed forestedForested river islandForested part of Natural AreaForested riparianForested riparian
Table 2. Surface soil characteristics pre-flood across three zone types and two replicate plots within zone. Letters indicate homogonous subsets using repeated measures pairwise comparison of zonal mean levels for each variable. Like letters indicate no difference between zones.
ZoneTemp
(°C)
Moisture (%)pHLOI (%)Extractable Phosphorus (mg-P/g soil)
Field Plot A17.2 ± 3.3 a39.6 ± 12.7 a6.4 ± 0.2 a4.1 ± 0.7 a1.59 ± 0.14 a
Field Plot B14.7 ± 2.7 a46.7 ± 5.2 a6.3 ± 0.1 a3.7 ± 0.7 a1.58 ± 0.12 a
New-growth Plot A15.4 ± 0.7 b86.6 ± 8.6 b5.9 ± 0.2 b7.7 ± 1.8 b1.55 ± 0.07 b
New-growth Plot B18.1 ± 1.0 b60.3 ± 7.7 b6.1 ± 0.1 b5.4 ± 0.9 b1.27 ± 0.12 b
Old-growth Plot A17.9 ± 1.3 b89.0 ± 16.8 c5.7 ± 0.2 c6.1 ± 0.4 b1.41 ± 0.11 b
Old-growth Plot B15.9 ± 1.0 b83.5 ± 6.6 c5.9 ± 0.2 c8.0 ± 2.0 b1.49 ± 0.14 b
Table 3. Water extractable soil organic matter characteristics across three zones using a 24 h extraction for surface soil samples collected pre-flood and a 30 min extraction for surface soil samples collected pre- and post-flood. The 24 h extraction was used to compare zones (Figure 3), while the 30 min extraction was used to access the effect of flooding (Figure 4). SR = spectral slope ratio, BA = freshness index, HIX = humification index. Peaks are provided as relative abundance (%). A and C are terrestrial humic-like. D and E are soil humic/fulvic-like. M and N are microbial humic-like. T is protein-like.
ZoneFlood PeriodSRBAHIXPeak APeak CPeak DPeak EPeak MPeak NPeak T
24 h water extraction
FieldPre0.72 ± 0.020.65 ± 0.050.67 ± 0.0526.7 ± 1.517.2 ± 0.86.2 ± 0.42 ± 0.217.6 ± 1.413.3 ± 1.117.2 ± 2
New-growthPre0.81 ± 0.050.56 ± 0.020.79 ± 0.0328.9 ± 0.918.3 ± 0.87.1 ± 0.72.1 ± 0.219.1 ± 1.111.3 ± 0.613.4 ± 1.8
Old-growthPre0.81 ± 0.040.54 ± 0.050.79 ± 0.0428.7 ± 1.118.8 ± 0.87 ± 0.62 ± 0.119.3 ± 0.911.1 ± 0.713.1 ± 1.7
30 min water extraction
Field
Pre0.97 ± 0.080.53 ± 0.070.68 ± 0.0425.7 ± 1.519 ± 0.95.9 ± 0.42.1 ± 0.219.8 ± 0.812.9 ± 1.514.7 ± 2.3
Post1.03 ± 0.090.5 ± 0.020.77 ± 0.0429.1 ± 1.818.9 ± 0.86.8 ± 0.42 ± 0.120.5 ± 110.8 ± 1.611.8 ± 2.3
New-growth
Pre1.11 ± 0.130.49 ± 0.050.82 ± 0.0429.6 ± 2.419.2 ± 17.3 ± 0.82.7 ± 0.420.4 ± 0.810.0 ± 1.410.8 ± 3.4
Post0.98 ± 0.070.51 ± 0.020.79 ± 0.0329.3 ± 1.318.4 ± 1.17.4 ± 0.42.2 ± 0.219.8 ± 0.810.5 ± 1.312.3 ± 2
Old-growth
Pre1.03 ± 0.080.47 ± 0.030.82 ± 0.0329 ± 2.119.1 ± 1.47 ± 0.72.5 ± 0.222 ± 2.39.9 ± 1.410.5 ± 2.5
Post0.96 ± 0.070.5 ± 0.020.79 ± 0.0228.7 ± 1.518.4 ± 1.17.1 ± 0.42.2 ± 0.121.2 ± 1.110.4 ± 111.9 ± 1.7
Disclaimer/Publisher’s Note: The statements, opinions and data contained in all publications are solely those of the individual author(s) and contributor(s) and not of MDPI and/or the editor(s). MDPI and/or the editor(s) disclaim responsibility for any injury to people or property resulting from any ideas, methods, instructions or products referred to in the content.