Article

Spatial and Temporal Variability of C Stocks and Fertility Levels After Repeated Compost Additions: A Case Study in a Converted Mediterranean Perennial Cropland

by
Arleen Rodríguez-Declet
1,
Maria Teresa Rodinò
2,
Salvatore Praticò
2,
Antonio Gelsomino
2,*,
Adamo Domenico Rombolà
1,
Giuseppe Modica
3 and
Gaetano Messina
2
1
Department of Agricultural and Food Sciences, Alma Mater Studiorum, University of Bologna, Viale G. Fanin, 44, 40127 Bologna, Italy
2
Department of Agricultural Sciences, Mediterranean University of Reggio Calabria, Feo di Vito, 89122 Reggio Calabria, Italy
3
Department of Veterinary Sciences, University of Messina, Viale G. Palatucci s.n.c., 98168 Messina, Italy
*
Author to whom correspondence should be addressed.
Soil Syst. 2025, 9(3), 86; https://doi.org/10.3390/soilsystems9030086 (registering DOI)
Submission received: 4 May 2025 / Revised: 28 July 2025 / Accepted: 30 July 2025 / Published: 4 August 2025

Abstract

Land use conversion to perennial cropland often degrades the soil structure and fertility, particularly under Mediterranean climatic conditions. This study assessed spatial and temporal dynamics of soil properties and tree responses to 3-year repeated mature compost additions in a citrus orchard. Digital soil mapping revealed strong baseline heterogeneity in texture, CEC, and Si pools. Compost application markedly increased total organic C and N levels, aggregate stability, and pH with noticeable changes after the first amendment, whereas a limited C storage potential was found following further additions. NDVI values of tree canopies monitored over a 3-year period showed significant time-dependent changes not correlated with the soil fertility variables, thus suggesting that multiple interrelated factors affect plant responses. The non-crystalline amorphous Si/total amorphous Si (iSi:Siamor) ratio is here proposed as a novel indicator of pedogenic alteration in disturbed agroecosystems. These findings highlight the importance of tailoring organic farming strategies to site-specific conditions and reinforce the value to combine C and Si pool analysis for long-term soil fertility assessment.

1. Introduction

Land use conversion of natural ecosystems into permanent cropland, including tree-based systems in sloped and marginal lands, is a highly impactful process that can promote soil degradation [1]. Mediterranean drylands are particularly vulnerable to climatic stressors and prone to long-term fertility loss [2,3,4]. Conversion practices such as vegetation clearing and deep tillage can accelerate the decline of soil organic carbon (C) and nitrogen (N), reduce structural stability, and impair nutrient retention. All these processes negatively impact on crop yields [5,6] and therefore make the adoption of resilient management strategies an urgent need.
Soil organic matter (SOM) plays a fundamental role in ecosystem functioning, since it supports structural stability, water retention, nutrient cycling, and biological activity and diversity [7,8,9]. However, while SOM decline can proceed rapidly under intensive land use, its recovery is a slow process, necessitating sustained and strategic measures. These strategies include the adoption of conservation agriculture, with the retention of cover crops, combined with the continuous application of organic fertilizers (e.g., compost, digestates, biochar, etc.) [10,11,12], which can potentially enhance SOM retention, soil fertility, and consequently crop productivity.
In Mediterranean systems, conservative strategies are increasingly recognized as essential measures to restore soil productivity and prevent further degradation [13,14]. However, soil management strategies are highly context-dependent, and their effectiveness varies depending on crop type, management regime, baseline soil condition, and climatic context; hence, in situ, system-specific research is essential to design tailored sustainability practices.
Monitoring plant responses is critical to evaluating the effectiveness of soil fertility restoration strategies. Remote sensing (RS) technologies, particularly those based on uncrewed aerial vehicles (UAVs), offer a cost-effective means to assess vegetation health and vigor at a high spatial resolution [15,16,17]. Among these, vegetation indices such as the Normalized Difference Vegetation Index (NDVI) are widely used in agriculture as a proxy for chlorophyll content and biomass, allowing the detection of both biotic and abiotic stressors [18,19,20,21,22].
Organic amendments and tillage practices, particularly on sloped terrains, often induce spatial heterogeneity in soil properties [23,24,25]. Spatial variability affects microbial processes [24,25], nutrient cycling [26], plant productivity [27], and ecosystem functioning [28] and makes spatial analysis a valuable tool for understanding soil–crop interactions. Geostatistical techniques such as kriging offer robust approaches to quantify and map the spatial distribution of key soil variables by accounting for their underlying spatial structure [29,30,31,32,33,34].
The roles of organic matter and nutrient cycling in soil restoration and fertility are well established, yet soil ecosystem functioning depends on multiple interacting biogeochemical processes. Among these is the contribution of silicon (Si). Silicon, the second-most abundant element in the Earth’s crust [35], participates in key soil processes such as mineral weathering, nutrient solubilization, and biogenic cycling [36,37,38] and has significant implications for soil resilience and crop productivity [39,40,41]. Additionally, the depletion of certain soil Si pools (dissolved and amorphous Si) has been suggested as an early indicator of soil degradation, often preceding measurable declines in organic matter turnover [42]. Soil Si pools’ dynamics have been examined in temperate and tropical environments [43,44,45,46,47]. However, few studies have examined Si dynamics in Mediterranean orchard soils.
Therefore, critical gaps remain in research regarding (i) the in situ assessment of long-term compost application effects on soil fertility in Mediterranean perennial systems; (ii) the integration of high-resolution UAV-derived vegetation indices with soil nutrient dynamics; (iii) the spatial characterization of soil heterogeneity in organic amendment regimes; and (iv) the distribution of soil Si pools in Mediterranean orchard soils.
To address these gaps, we conducted a long-term case study in a recently converted Mediterranean citrus orchard subjected to repeated additions of mature municipal solid waste compost. The study integrated UAV-based assessment of citrus spectral responses through NDVI analysis with selected soil fertility measurements (i.e., soil aggregate stability index, pHCaCl2, total organic C, total N, cation exchange capacity). At the same time, we analyzed the spatial distribution and interactions of four soil Si pools at the pre-treatment stage (T0) as potential indicators of pedogenetic processes and anthropogenic impacts. Two hypotheses were assumed: (H1) repeated mature compost amendments contribute to soil fertility through a steady-state increase in C and N stocks; and (H2) plant spectral responses correlate strongly with soil fertility levels.

2. Materials and Methods

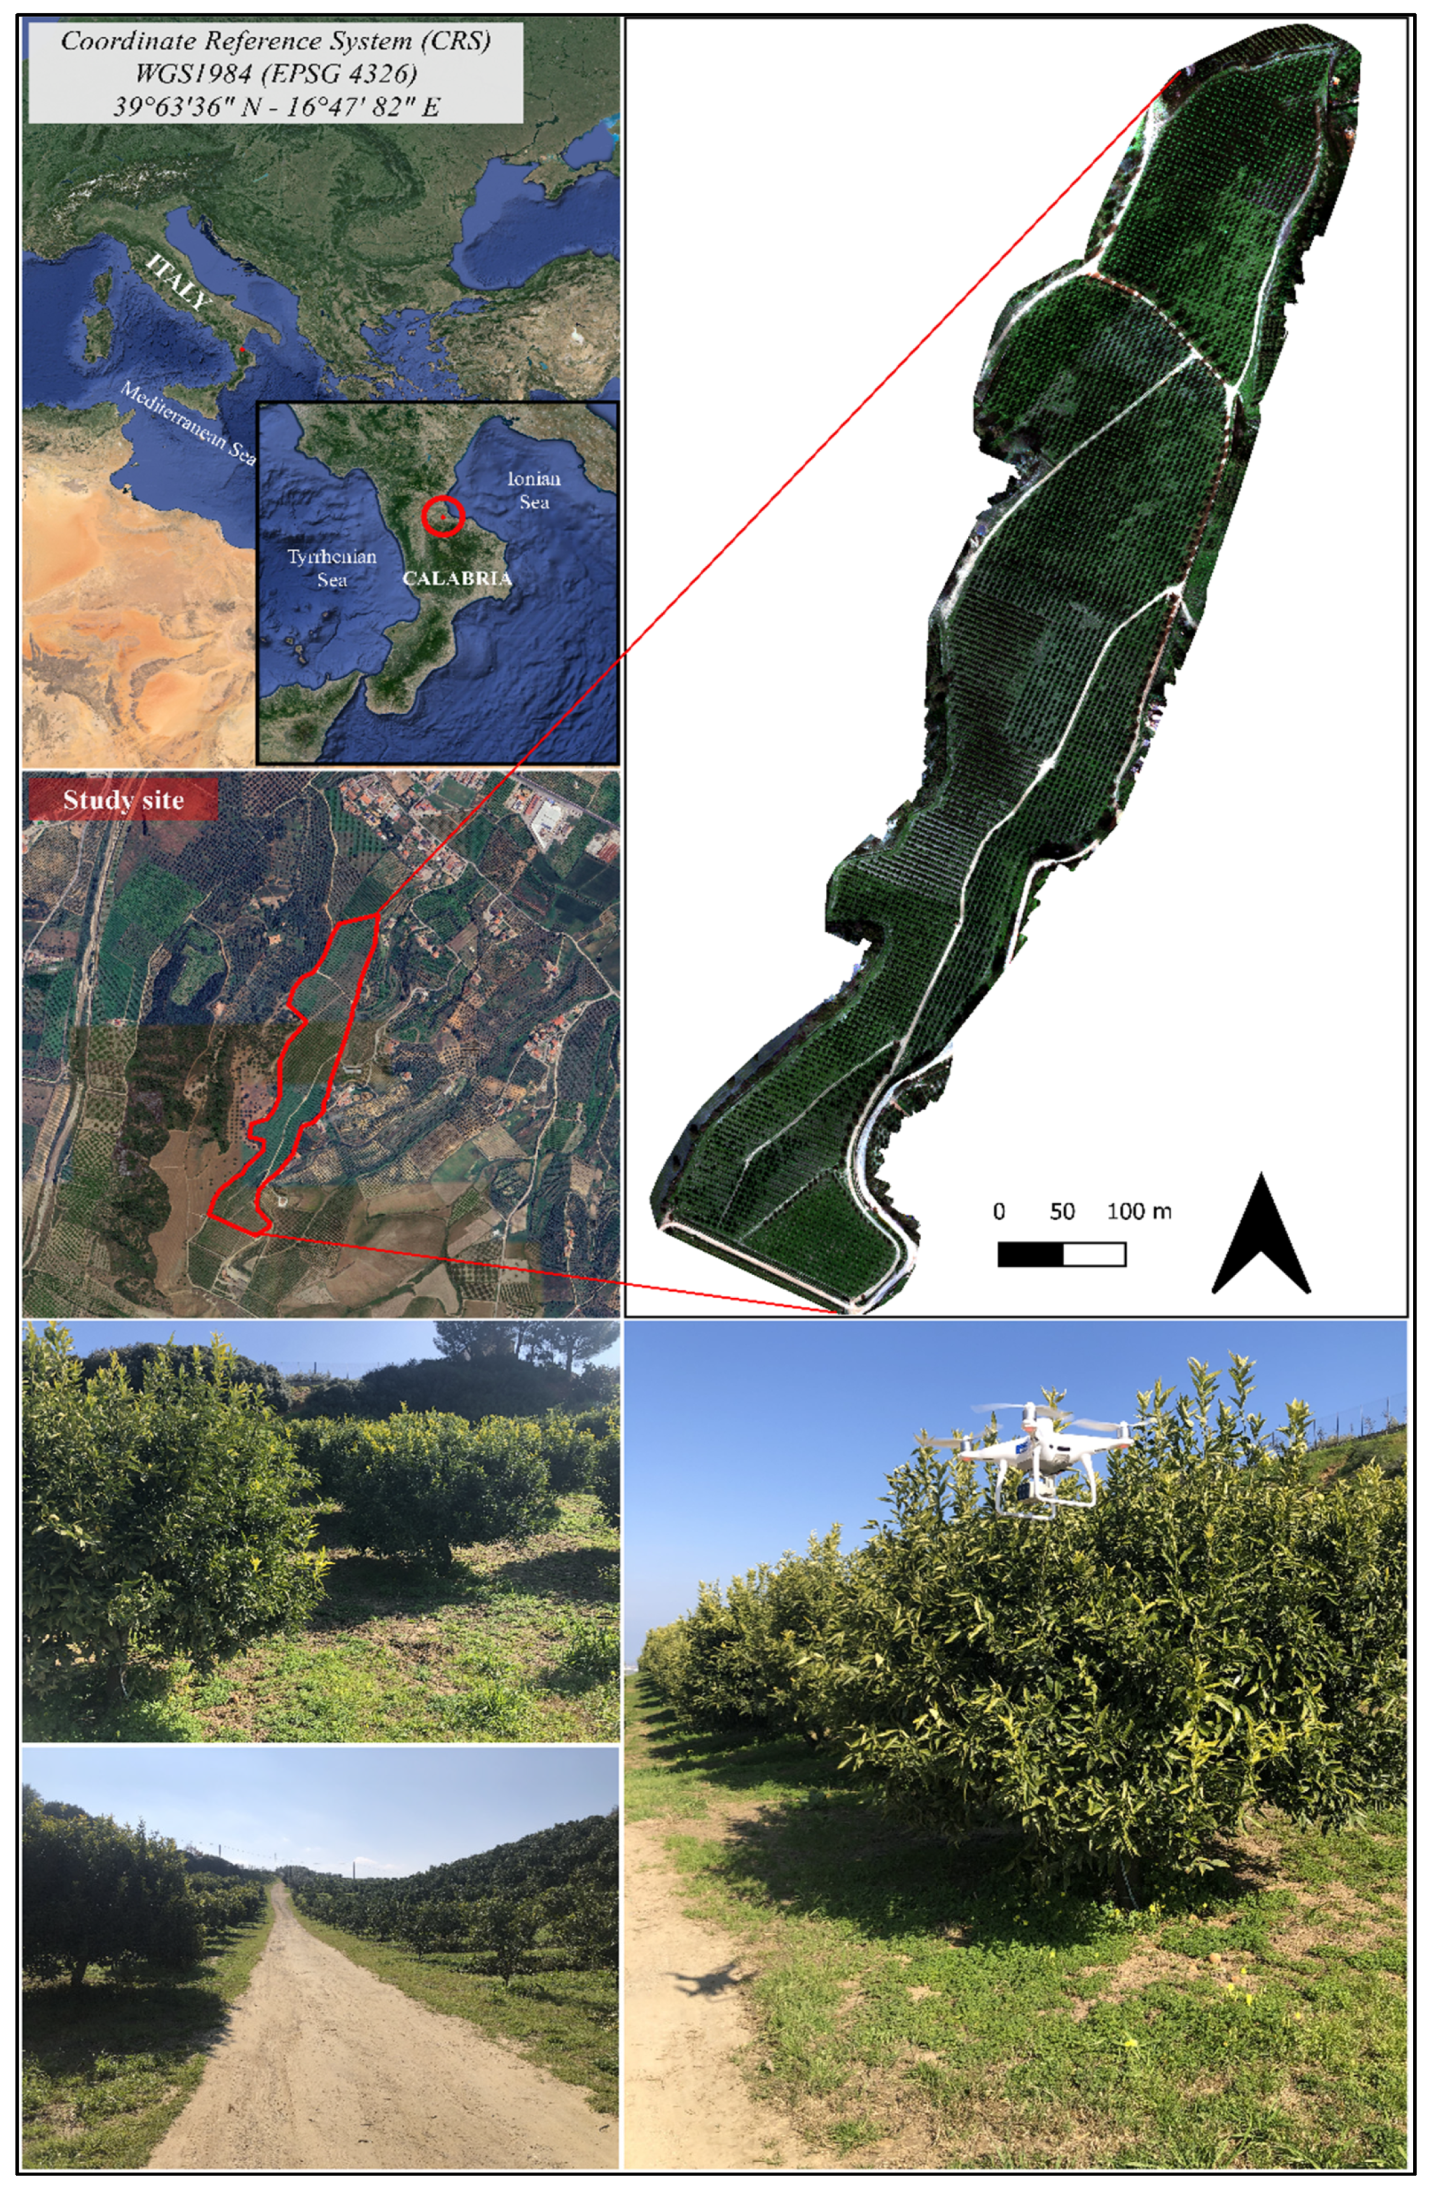
2.1. Site Description and Citrus Crop Management

The survey site, located in Southern Italy (Chiodo Farm, Corigliano-Rossano, 39°63′36″ N, 16°47′82″ E, Calabrian Region, Italy) (Figure 1), covers an area of ~16 ha (1100 m × 144 m) and extends at an altitude ranging from 206 to 350 m a.s.l. The site is characterized by a central natural drainage line, whose slope is about 20% facing a N-NE exposure and two sides with a similar slope but facing an opposite N-NW and S-SE exposure. The area is characterized by mild and rainy winters and relatively warm and dry summers. Mean annual rainfall and air temperature are 540.3 mm and +17.5 °C (averages over the 2002–2022 period) [48]. The coldest month is January (lowest mean monthly temperature +8.5 °C) and the hottest one is July (highest mean monthly temperature +27.2 °C). Most rainfall occurs in November (82.5 mm), whereas July (11.8 mm) is the driest month. Soil thermal and moisture regimes are thermic and xeric (first 150 cm). Soil depth is >150 cm, and the total available water-holding capacity (AWC, available moisture between field capacity and wilting point) equals 127 mm. Both aeration and drainage rates are good, with frequent minute and middle skeletons. The soil is classified as Typic Xerorthent, coarse, loamy, mixed, thermic [49], and Hapli-Eutric Regosol [50]. The soil evolves over eroded, ancient, terraced planes of Pleistocene sands and brown-reddish conglomerates of metamorphic origin. The geological formation in the whole study area is uniform, and one geological formation was identified. The major soil properties are shown in Table 1.
In 2000, the site was subjected to land use conversion from spontaneous vegetation (mainly represented by shrubs) to globe-trained citrus tree (Citrus clementina Hort. ex Tan) cultivation, with a planting distance of 5 m × 5 m, leaving a spontaneous vegetation cover in the alleys. Before planting, the soil in the entire area was deeply plowed (up to 300 cm depending on morphological heterogeneity). Since then, management practices, mechanical weed control, irrigation, and organic fertilizer application have been similar throughout the whole study area. Since 2020, the citrus tree orchard has been managed using organic farming [51], and green mulching has been performed up to five times per year to manage spontaneous vegetation and pruning residues, whose nutrient supply was not accounted for in this study, with the study area here considered an internally recycled nutrient pool. Field application of a mature municipal solid waste compost (Table 2, analyzed according to the official methods reported by UNI [52] and ANPA [53]) at a rate of 18 t ha−1 (corresponding to 15 t dw ha−1) was started in the winter of 2021 and was repeated every autumn in the following years. A compost nutrient supply efficiency of 0.3 was considered, able to supply 85.5 kg N ha−1, 28.6 kg P ha−1, and 94.1 kg K ha−1 each year. After estimating an average fruit yield of 28 t ha−1, it was determined that an integrative nutrient supply (using organic farming products) was needed to provide the remaining 70 kg N ha−1, 20 kg P ha−1, and 10 kg K ha−1. These amounts take into account potential nutrient losses due to K leaching (~23 kg K ha−1 year−1) and N leaching and volatilization processes (15 kg N ha−1 year−1). Moreover, the citrus orchard was drip irrigated to supply 450 mm of water during the dry summer period to avoid water stress and maintain the size, quality, and yield of fruit. The drip tube was located along the row under the tree skirt to provide a wetted band of approximately 0.5 m along each side of the trees, which did not overlay with the sampling area. Disease and pest control measures were in accordance with organic farming guidelines.

2.2. Soil Sampling and Analysis

Thirty composite soil samples (each consisting of three accurately pooled 200 g individual, non-rhizosphere, inter-row soil cores taken from the 0–20 cm soil layer) were carefully collected following the Global Navigation Satellite System (GNSS) reference from representative locations within the study site. Since the studied area had not been investigated in depth before our survey, nor had it been accurately described on a detailed scale in terms of soil types and gradients of physico-chemical properties, this prevented us from pre-selecting homogeneous areas where the sampling sites were to be located. Therefore, a systematic sampling method was adopted (based on a regular geometric grid) to evenly cover the entire 16 ha studied area. This method allowed an equal number of points to be sampled while guaranteeing an equal distance from the field’s outer boundary and avoiding any border effect. The grid constituted a main central line crossing the maximum field length and regularly intersected (every 100 m) by 10 parallel lines. Three sampling points were identified along each intersection line: one in the line center and the other two equally distant on both the left and right sides (Figure 2). The sampling grid was digitalized in a Geographic Information System (GIS) environment and the coordinates of each sampling point sent to a GNSS. Soil sampling was repeated every year before (T0, 25 March 2021) and after the amendment events: T1 (28 April 2022), T2 (17 February 2023), and T3 (22 May 2023). On return to the laboratory, field-moist samples were air-dried, sieved to a 2 mm particle size, and then stored at room temperature before physical and chemical analysis.
The physical and chemical properties of the soil were determined according to the standard methods recommended by the Soil Science Society of America [55,56]. In short, soil texture was determined by using the Bouyoucos hydrometer method after the chemical dispersion of soil particles; the stability of soil aggregates was determined by measuring the soil aggregate stability index (ISS) on dry soil using the wet sieving apparatus (Eijkelkamp Agrisearch Equipment, Giesbeek, The Netherlands); soil acidity was potentiometrically measured either in a 1:2.5 (w/v) soil-to-water (pHw) or soil-to-0.01 M CaCl2 solution mixture (pHCaCl2), respectively; the electrical conductivity was determined in a 1:2 (w/v) soil-to-water ratio slurry (EC1:2 referred to 25 °C); the cation exchange capacity (CEC) was measured by using 0.1 M BaCl2 buffered to pH 8.2 with triethanolamine (2.25%, v/v); and total organic C (Corg) and N (Nt) were determined on a finely (ø < 0.5 mm) ground aliquot of soil by using the elemental analyzer LECO CN628 (LECO Corporation, St. Joseph, MI, USA).
In addition, this study focused on determining the spatial distribution of different silicon pools within the soil matrix (see Figure S1 for a graphical representation). Three Si extraction methods were used to characterize different soil Si pools. Soluble Si (Sisol), which is considered by Cornelis et al. [57] to represent the immediately plant-available Si (i.e., silicic acid in the aqueous phase), was extracted by CaCl2 [45]. Detection of the soil Si pool bound to poorly crystalline constituents (allophane and imogolite) and weakly ordered sesquioxides, which from here on will be referred to as oxalate-extractable Si (Sioxa) [38], was carried out using ammonium oxalate–oxalic acid (pH 3) extraction [58]. Finally, the extraction of amorphous Si sources, which include biogenic silica (i.e., plant phytoliths) (Sibio) and a pedogenic non-crystalline inorganic (iSi) fraction (i.e., Si in iron oxides/hydroxides and inorganic alumino-silica coatings) [59], but exclude crystalline mineral Si (e.g., quartz and olivine), was performed by the Na2CO3 methodology [60].
In short, to quantify the easily available Si pool (Sisol), an aliquot of 3 g dry soil was extracted with 30 mL of 0.01 M CaCl2 solution (1:10, w/v) under shaking at ambient temperature for 1 h [55]. The suspension was centrifuged (5000× g, 5 min), and the supernatant was stored at −20 °C before analysis. The oxalate-extractable Si pool (Sioxa) was determined according to Tamm [58]: 1 g dry soil was treated with 60 mL of an extraction solution (ammonium oxalate and oxalic acid at pH 3), shaken in the dark for 3 h, and then centrifuged (5000× g, 5 min). As above, an aliquot of 30 mL of the supernatant was added to 30 mL of a saturated NaCl solution and centrifuged again. We transferred 10 mL of the supernatant into a volumetric flask, brought it up to 50 mL volume with distilled water, and stored before analytical reading. For the biogenic (Sibio) and pedogenic (iSi) amorphous Si detection, 30 mg of dry soil was extracted with 30 mL of 0.1 M Na2CO3 solution (1:1000, w/v) at 85 °C in a shaking water bath (90 strokes per minute) for 2, 3, and 5 h. After each period, the soil slurry was centrifuged (5000× g, 2 min), 1 mL of the supernatant was added to 4 mL of 2% HNO3, and it was stored before ICP analysis.
All soil Si extracts were analyzed by inductively coupled plasma optical emission spectrometry (ICP-OES, Optima 8000 PerkinElmer, Waltham, MA, USA). The biogenic Si pool (Sibio), which is part of the amorphous Si, was calculated as the intercept of the linear relationship between extraction time and Na2CO3-extracted Si [60]. Subsequently, the non-crystalline inorganic Si pool (iSi) was calculated as the difference between total extracted amorphous Si and Sibio.

2.3. UAV Surveys and Image Processing

UAV surveys were carried out on 3 May 2022, 22 February 2023, and 23 June 2023 by using the multirotor DJI Phantom 4 Multispectral (DJI Ltd., Shenzhen, China) equipped with a camera providing 1600 × 1300-pixel images at a 2.08-megapixel resolution in Blue (ρ450 nm ± 16 nm), Green (ρ560 nm ± 16 nm), Red (ρ650 nm ± 16 nm), Red Edge (ρ730 nm ± 16 nm), and Near-Infrared (ρ840 nm ± 25 nm) bands. UAV surveys were performed in a cloud-free condition at an altitude of 50 m a.g.l. (speed of 2 m s−1) with an image overlap and sidelap of 80% for both. The DJI D-RTK 2 Mobile Station was used to obtain the correct data georeferencing. Flight planning was performed using the DJI Ground Station Mobile App v2.0.17 (DJI GS Pro). The digital photogrammetry processes (image alignment, stacking, and orthorectification) were performed using the software Agisoft Metashape (Agisoft LCC, version 2.1.0, St. Petersburg, Russia), generating an orthomosaic with a geometric resolution of 2.5 cm, a digital surface model (DSM) with the same resolution as the orthomosaic, and a digital terrain model (DTM) with 10 cm resolution. Digital elevation models were used to obtain a highly detailed slope map of the study site, which was used as a variable in the kriging process described in the following subsection (Section 2.4).
In addition to a UAV, PlanetScope’s imagery was also used. PlanetScope satellites 3U CubeSats, also called “Doves”, are small in size (10 cm × 10 cm × 30 cm and weigh 4 kg) and provide daily sun-synchronous-coverage images of the whole Earth landmass [61]. Satellite sensors provide imagery in Blue, Green, Red, and NIR bands with a scene footprint of about 24.4 km × 8.1 km and a ground sample distance of 3.7 m.
In order to monitor the effect of the spatial variability of physical and chemical properties of soil on citrus vegetation, the NDVI was calculated using the following equation:
NDVI = (ρNIR − ρRed)/(ρNIR + ρRed),
where ρ is the reflectance at the given wavelength.
The NDVI can assume values ranging between −1 and +1 exploiting the highest chlorophyll absorption and reflectance regions. It was used for monitoring vegetation vigor in the period considered and analyzing the NDVI values of the four canopies closest to each soil sampling point. Three areas of interest (AOIs) were chosen to monitor the effect of the changes in the soil’s physical and chemical properties on canopy vegetation, using NDVI values derived from UAV imagery.

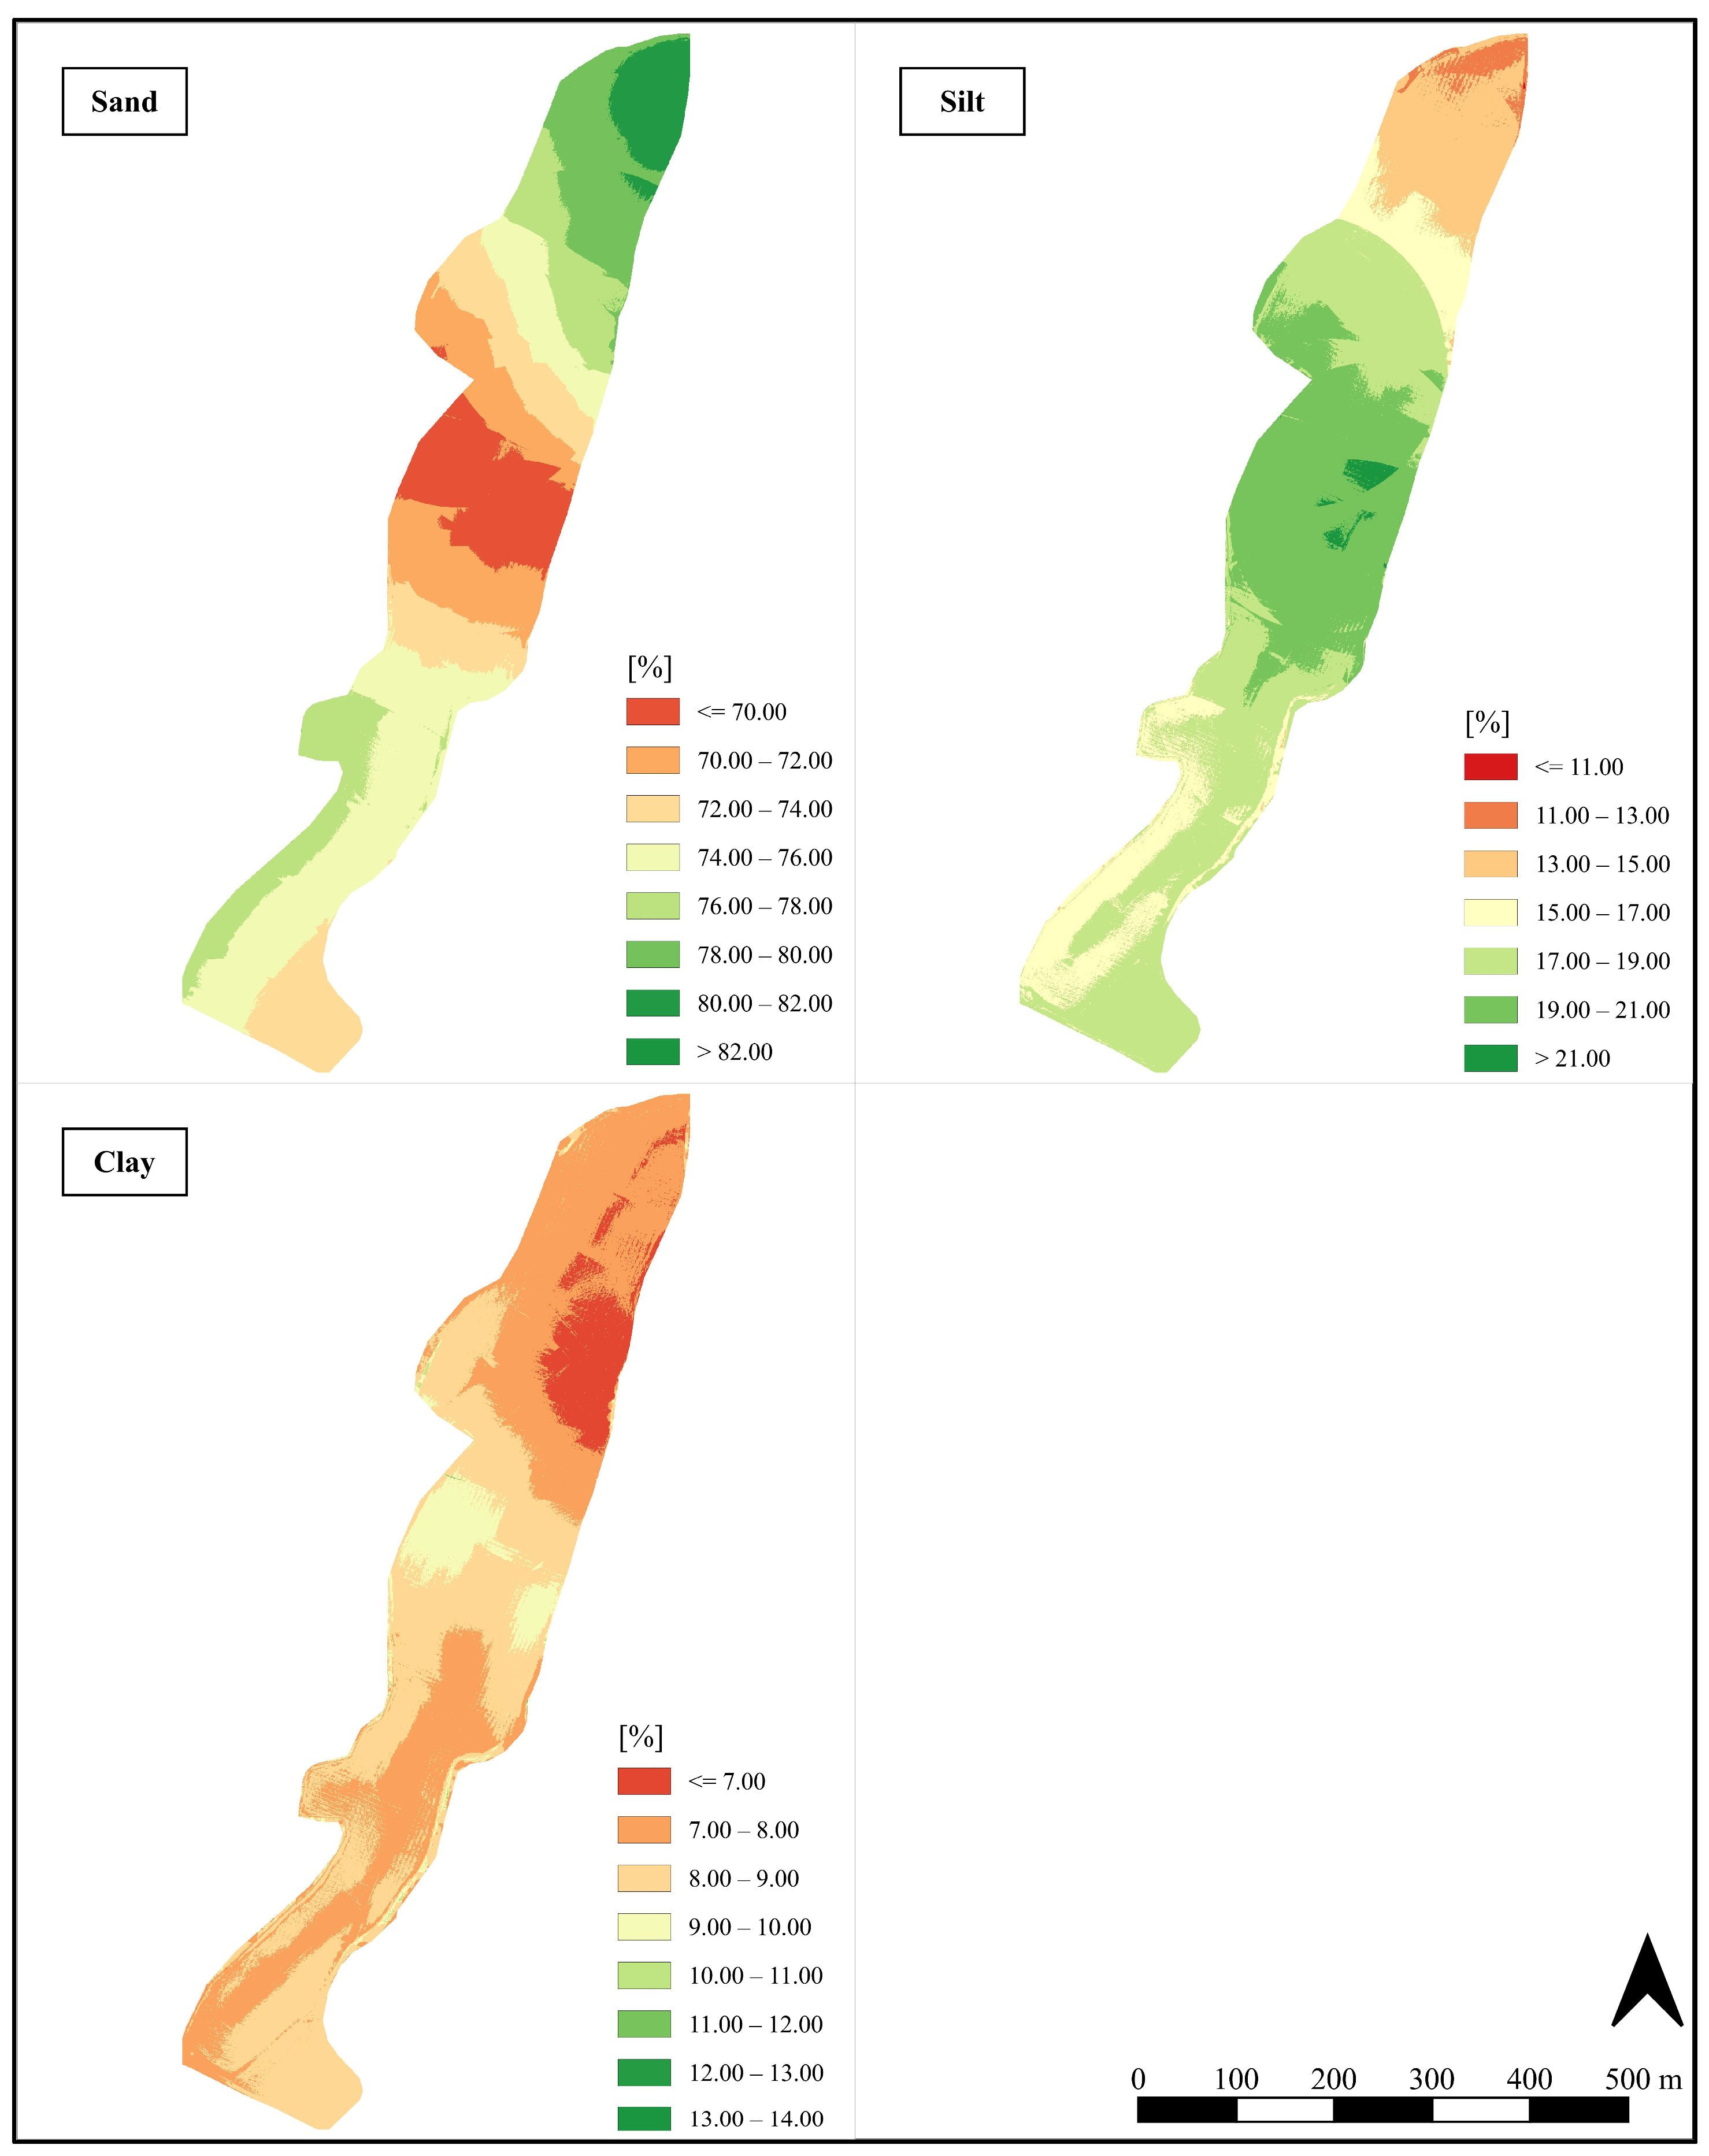
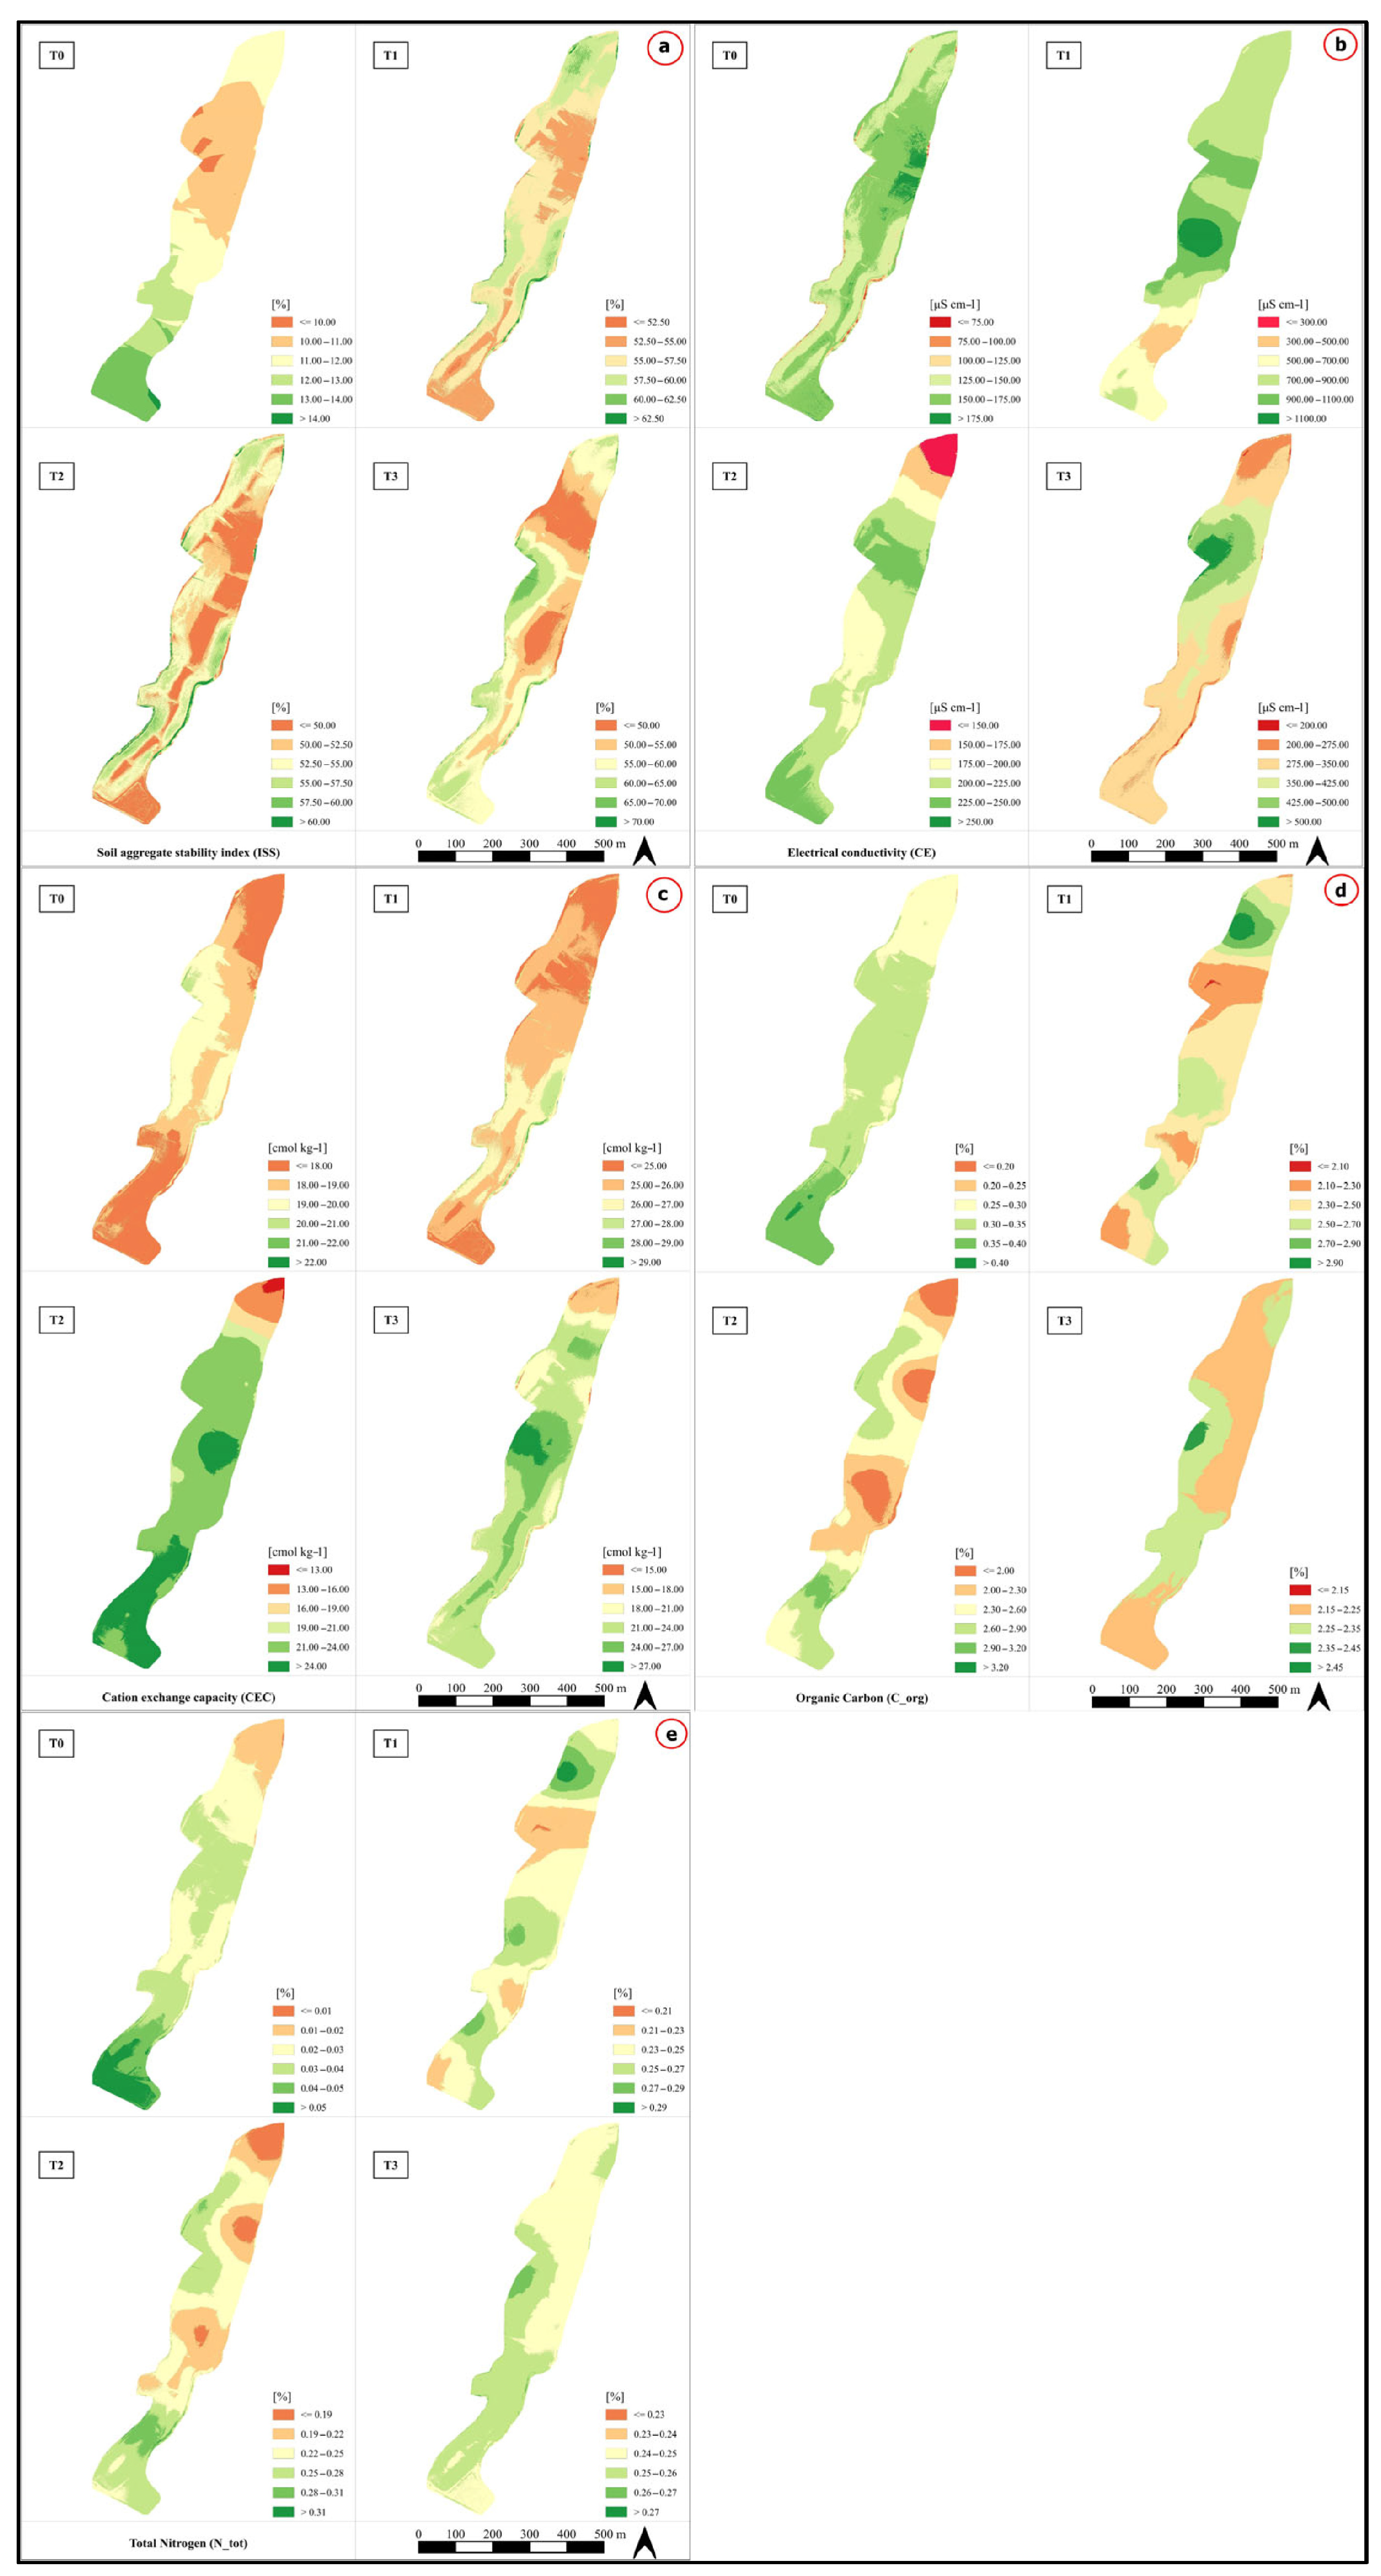
2.4. Spatialization of Soil Data (Kriging)

One raster map for each physical and chemical soil variable considered was obtained to spatialize the soil analysis results. Empirical Bayesian kriging (EBK) [62] was used as a geostatistical interpolation method. This step was performed in a GIS environment using the commercial software ArcGIS Pro (ArcGIS Pro v. 3.2, Esri Inc., Redlands, CA, USA). More specifically, the EBK regression prediction model was used because it can combine the EBK method with an explanatory variable raster known to affect the value of the interpolated data [63]. Each investigated soil variable was spatialized, adding the high-resolution slope raster obtained by the UAV surveys as an explanatory variable. The approach, which combines regression analysis (i.e., ordinary least-square regression—OLS) with the kriging method (i.e., simple kriging), is able to provide more accurate predictions about the spatial variability of investigated data. To perform the EBK regression prediction, the following parameters were taken into account: (i) the minimum cumulative percent of variance, which indicates how much variation the principal components of the explanatory variable raster must account for, was set at 95 (i.e., 95% was the minimum percent of variance which must be captured); (ii) the number of simulations, representing the number of semivariograms to be simulated, was set at 2500 after a trial-and-error approach; (iii) the chosen semivariogram was the K-Bessel, which gives the most accurate predictions; (iv) the neighborhood type was set to circular, with a radius of 150 m; and (v) the number of features included in each circular neighborhood was set at a maximum of 9 points and a minimum of 6.

2.5. Statistics

Data were analyzed using different statistical procedures. Correlation analysis was applied to data from the initial sampling time point (T0, prior to any compost amendment) to characterize baseline associations among the physical and chemical properties of the soil and Si pools. Random Forest (RF) [64] was applied to rank the relative importance of soil parameter factors (i.e., sand, silt, clay, ISS, pHCaCl2, pHw, EC, C/N, Corg, Nt, CEC, sampling point location, Sioxa, Sibio, Sisol, iSi, NDVI) on Sisol and Corg values from the initial sampling point (T0). Soil chemical variables (pHCaCl2, Corg, Nt) and NDVI values were statistically processed by a one-way analysis of variance (ANOVA) with repeated measures followed by a pairwise comparison of the means using Bonferroni correction. All statistical analyses were conducted with R statistical software (version 4.3.1) [65] with a significance level of α at p < 0.05.

3. Results and Discussion

3.1. Spatial Heterogeneity of Physico-Chemical Soil Properties and Si Pools After Land Use Change in the Soil of a Citrus Orchard

To investigate soil heterogeneity at the field scale before the periodical compost addition practice, spatial distribution maps were generated through EBK regression prediction to illustrate the spatial variability at the surface level of different soil properties within the Mediterranean orchard soil. Overall, the soil’s physical and chemical properties showed a noticeable spatial heterogeneity throughout the study area, with specific trends in relation to the variable considered (Figure 3, Figure 4 and Figures S2–S6). As for the textural features, the citrus orchard soil was dominated by silt and coarse-textured particles throughout the entire area, whereas the finest clay particle never exceeded the 15% value (Table 1; Figure 3).
The most represented textural class was sandy loam (USDA classification). Not surprisingly, this finding is in line with the geological features of the area [66], and when estimating an internal drainage (Ksat) as high as 311 mm h−1, low values of electrical conductivity (on average, well below the threshold value of 0.5 dS m−1) (Figure 4 and Figure S3)found over the whole area cannot be considered unexpected. This also suggests that soluble salt leaching is a dominant process in the citrus orchard soil.
Nevertheless, this physical feature is likely to promote massive nutrient removal and hence expose the rooting zone to nutrient loss and groundwater resources to eutrophication. Under these circumstances, the soil is expected to show nutrient deficiencies and a general low fertility status. Moreover, even though soil pH falls within an ideal range (i.e., 6.5–7.5) for nutrient availability, plant growth, and soil biota [7], the very poor content of either the soil organic C (<0.45%) or the total N (<0.1%) (Table 1; Figure 4, Figures S5 and S6) represents a critical feature which severely limits plant growth and soil functions [67]. Needless to say, large losses of soil organic matter (generally ranging between 20 and 50% during the first 50 years of cultivation) are to be expected when a native ecosystem is converted into arable agriculture [9]. Furthermore, soil properties such as ISS and CEC, which are interconnected with the organic matter and the clay content (representing key indicators of the soil’s physical and chemical fertility) [68], showed low values (12% and 18.4 cmol kg−1, respectively), thus confirming the low fertility status of the citrus orchard soil before the repeated amendment started. It is worth noting that these soil features were still clearly substantial 20 years after the deep soil ploughing intervention, followed by the conventional management of the citrus orchard soil using chemical fertilizers.
It must also be observed that soil texture markedly changed throughout the whole field area, following a slope gradient from upper-slope and middle-slope portions to the toeslope area, where an increase in the coarse sand fractions was found (Figure 3). Other tested soil variables with the same texture showed surface heterogeneity, albeit to a lower degree, across the field (Figure 4, Figures S2–S6). Nonetheless, this finding can be considered a consequence of the landscape hillslope heterogeneity with excessive differences arising during deep moldboard plowing and, following the intervention, in the hydrology and microclimate. This resulted in soils within a few meters of each other possessing widely different properties.
As stated above, the spatialization of the four different soil Si pools, each determined by a different extraction methodology, revealed a heterogeneous distribution pattern throughout the citrus orchard (Figure 5). Soluble silicon (Sisol), biogenic amorphous Si (Sibio), and non-crystalline amorphous Si (iSi) exhibited variable spatial patterns to an extent smaller than that of the Si bound to poorly crystalline constituents (allophane and imogolite) and weakly ordered sesquioxides (Sioxa), which displayed a higher variability (Figure 5). Moreover, Sioxa followed a slope-dependent trend: lower values were observed in the upper part of the cultivated area (<0.09 mg g−1), with continuously increasing readings (from 0.12 to >0.18 mg g−1) across the field down to the lower slope area (Figure 5).
The iSi pool represented the largest fraction of all described Si pools throughout the whole field (Table 1). Presumably, iSi includes (Figure S1) non-amorphous Si fractions such as the water-soluble plant-available Si (Sisol), other Si pools such as those adsorbed onto pedogenic oxides, and the Si pools included in short-range ordered alumino-silicates [57], thus explaining why the iSi pool made up the largest Si fraction. It must also be observed that the Sisol pool represented a negligible fraction (that is, 2.05 × 10⁻⁴%) of the amorphous Si pool (Table 1), a finding in agreement with a previous study [57].
However, unlike Cornelis et al. [57], who focused on Si turnover in forest soils and found that the litter-derived phytoliths primarily accounted for the biogenic Si pool, our data suggest that the extractable Si of the overall field primarily constitutes amorphous Si bounded to iron oxides/hydroxides and inorganic alumino-silica coatings (iSi), followed by the amorphous biogenic Si fraction, and then by poorly crystalline constituents (allophane and imogolite) and weakly ordered sesquioxides (Sioxa). It is worth noting that low passive Si uptake (<5 g kg−1 dry weight) was found to occur in citrus species with poor translocation within the plant tissues [69]: this leads to the conclusion that in citrus orchards, leaf litter decay accounts for negligible Si input and turnover [70]. Even though the citrus plant activity does not seem here to contribute to the biogenic Si pool (Sibio) through leaf deposition, a possible role of belowground release of phytoliths through rhizosphere interactions or due to grass (graminaceous) plants spontaneously growing in the alleys could not be entirely excluded. In fact, the citrus species employ several strategies to counteract soil nutrient deficiencies via mechanisms such as root exudation [71], which may exert an influence on Si forms as root exudates have been shown to promote chemical weathering and increase Si mobility [41].
Silicon pools not only reflect natural soil-forming processes but are also an agent of anthropogenic impacts (i.e., land use changes) [36,43]. The dynamics of the element have been studied in the context of land use change across different time spans [44,72], agricultural ecosystems [73,74,75] (predominantly focused on cereals and pasture), and forest ecosystems [44,57], both in temperate [43,44,47] and tropical [45,46] environments, but with little information concerning Mediterranean environmental conditions [76]. Needless to say, the whole Mediterranean area is being increasingly impacted by climate change and soil erosion processes, and changes in the Si pools are therefore not unexpected.
Si dynamics are impacted by pedogenesis, reflecting soil development stages [37,76]. In the early stages, as seen in a Mediterranean dune chronosequence, soluble and amorphous Si concentrations are low, due to limited silicate weathering and high Si adsorption by secondary minerals [76]. As soil development advances, Si availability increases, influenced by vegetation, climate, and lithogenic and pedogenic minerals [37]. Moreover, anthropogenic activities have been shown to directly affect amorphous Si pools [43,72]. However, plant-available Si remains low due to significant Si adsorption by soil components [76]. In more advanced stages, the depletion of these minerals shifts Si mobilization towards control by biological feedback mechanisms [37]. Si desorption from Fe oxides and dissolution of kaolinite becomes a key driver of plant-available Si, while increased biogenic silica indicates greater soil–plant Si cycling [37,76].
The predominance of iSi within the amorphous Si pool (accounting for 62% of Siamor on average) suggests the occurrence of an intermediate pedogenic stage, where ongoing weathering processes favor the accumulation of non-crystalline Si phases. This finding aligns with observations from Mediterranean dune chronosequences, where early-stage soils exhibit low concentrations of soluble and amorphous Si due to limited silicate weathering and strong retention by secondary Fe and Al oxides [76]. As pedogenesis advances, Si availability increases through mineral transformation and vegetation-mediated cycling [37], although plant-available Si often remains constrained due to continued sorption by mineral surfaces [76].
In our Mediterranean orchard system at T0, characterized by limited organic inputs, passive Si uptake by citrus species [69], and past physical disturbance (i.e., deep soil ploughing), the dominance of iSi indicates that chemical weathering governs amorphous Si dynamics rather than biological cycling [38]. Spontaneous vegetation, occurring as alternating winter/summer weeds in the alleys, may also have contributed to Si uptake and cycling. Amorphous Si phases, including iSi, influence aggregation, water dynamics, and nutrient retention through interactions with mineral colloids and organic matter [42]. The increase in the iSi/Siamor ratio, therefore, may serve as an integrative agent for both pedogenic progression and land use intensity, reflecting altered functional capacity under anthropogenic pressures. This partitioning of Si pools provides critical insights into how prolonged disturbance affects soil development trajectories and functional resilience.

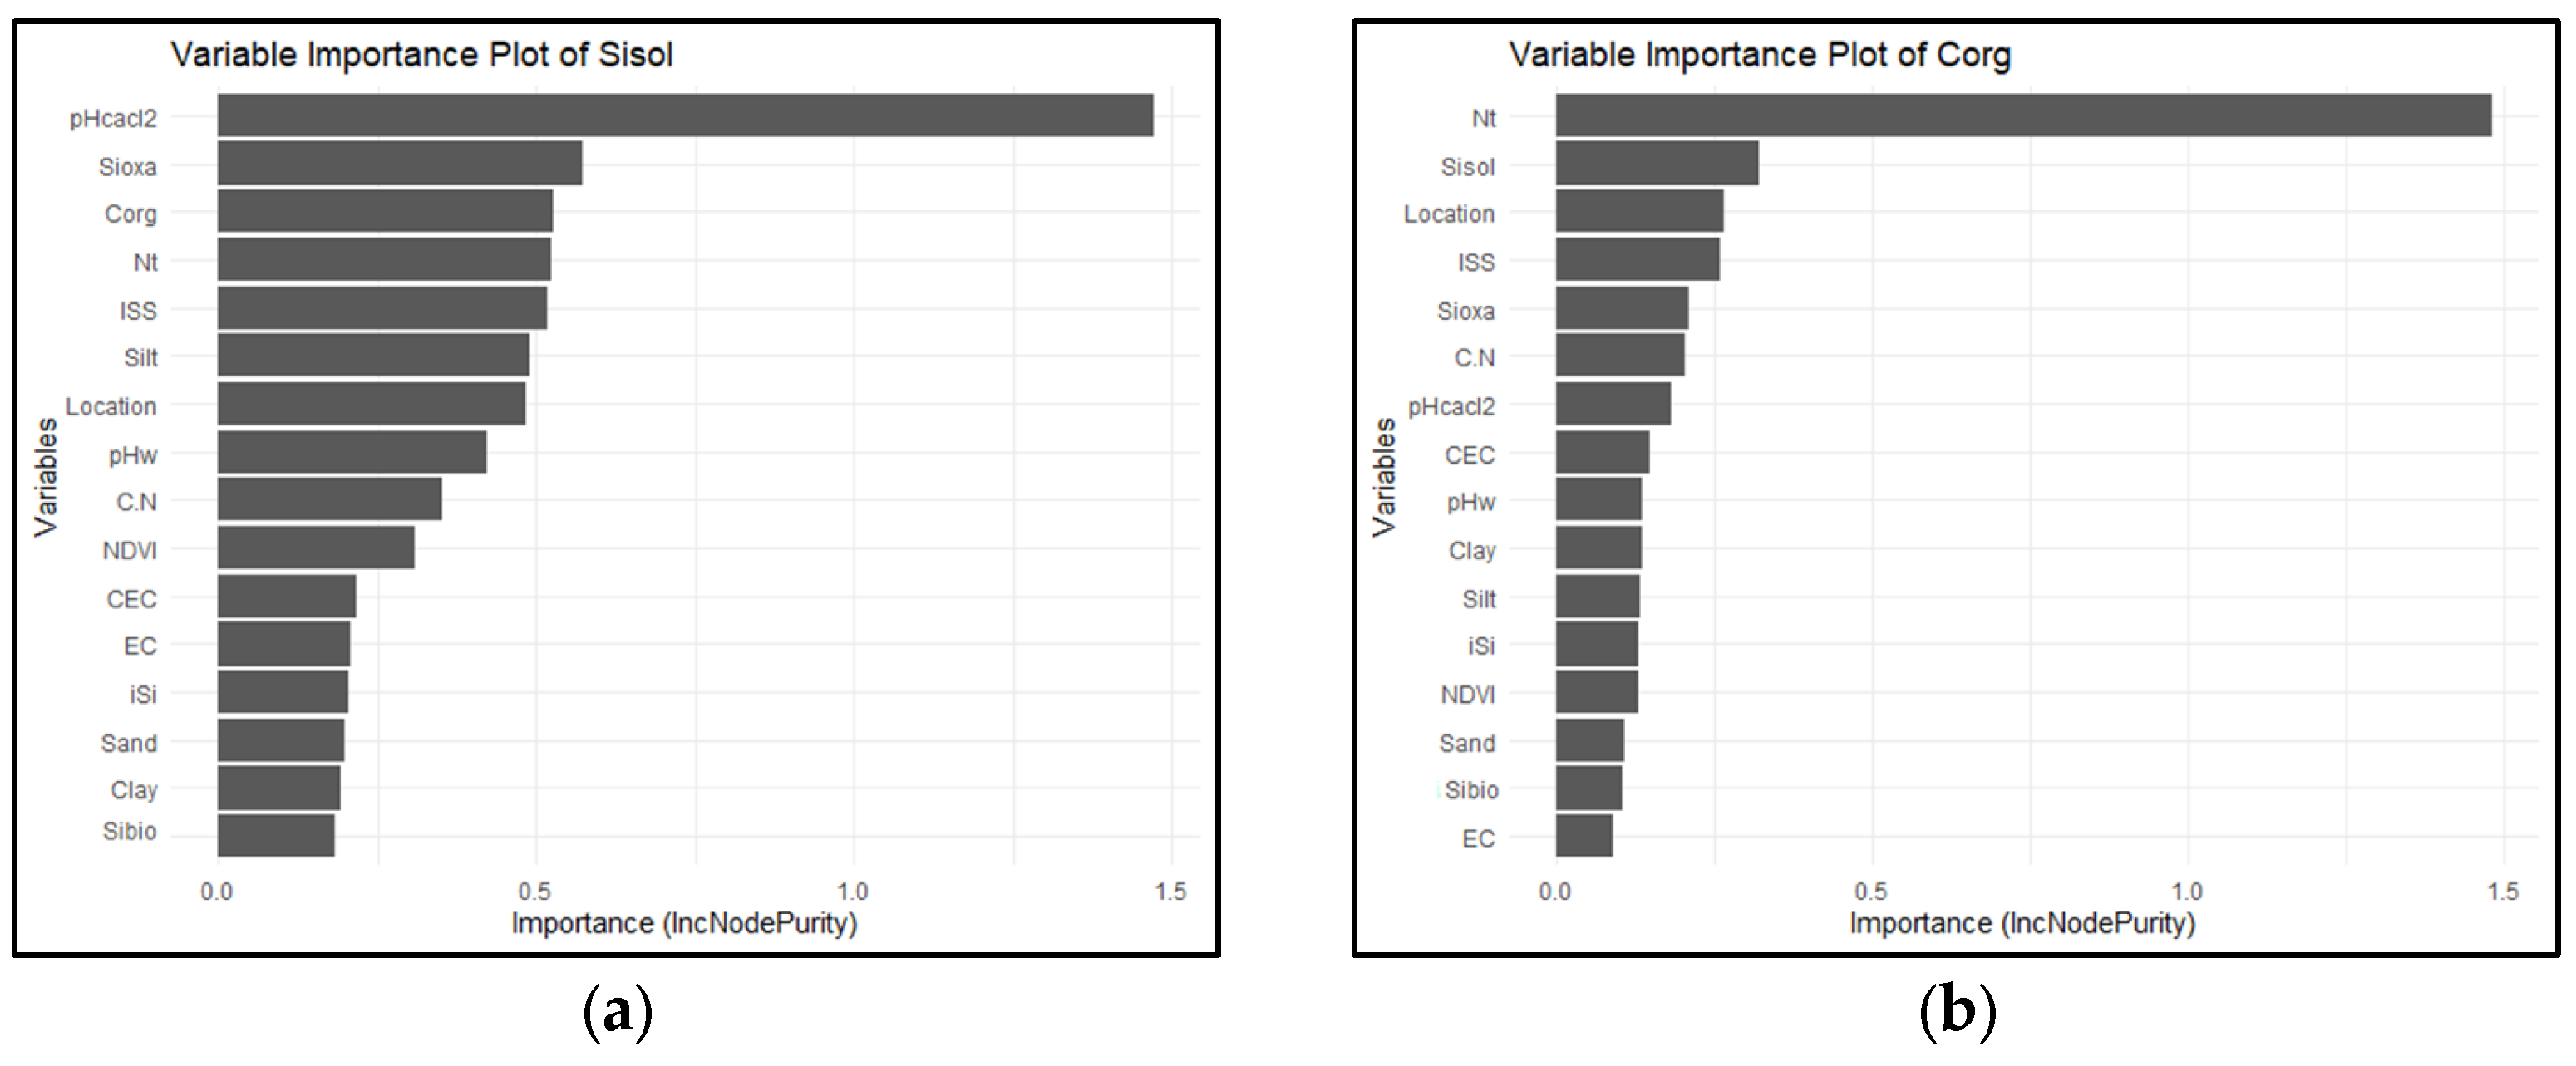
3.2. Relationships Between Si Pools and Physico-Chemical Soil Properties

The Pearson correlation analysis highlighted negative correlations (r = −0.56**) between Sibio and iSi (Figure 6), as also graphically represented in the spatial map (Figure 5). Although a relationship between Sisol and Sibio is likely, as amorphous Si sources represent significant pools of plant-available Si [42,74], the absence of a positive relationship may be attributed to indirect connections or potential influences by microbiota and environmental conditions [45].
Silicon pools were correlated with various soil variables (Figure 6). Above all, significant positive correlations were observed between Sisol, the silt content (r = 0.36*), and pHCaCl2 (r = 0.4*), and between Sioxa and the Nt content (r = 0.46**). Conversely, negative correlations were found between Sisol and ISS (r = −0.44*) and between Sioxa and the carbon-to-nitrogen ratio (C/N) (r = −0.38*) (Figure 6).
Soil pH is widely considered a crucial factor affecting both Sisol levels and the chemical weathering of silicate minerals [77]. Moreover, positive relationships between soil acidity and Sisol have already been reported, thus corroborating the major role of chemical weathering processes and soil mineralogy in supplying plant-available Sisol [38,42,78].
In addition, the soil properties investigated within the citrus orchard revealed significant associations between them (Figure 6). Silt showed positive correlations with clay (r = 0.53*), pHCaCl2 (r = 0.51**), electrical conductivity (EC) (r = 0.47**), Nt content (r = 0.44*), and cation exchange capacity (CEC) (r = 0.69***). Furthermore, clay was positively correlated with CEC (r = 0.60***), pHCaCl2 with EC (r = 0.46*) and Nt (r = 0.45*), and Nt with carbon content (Corg) (r = 0.86***). As expected, sand exhibited negative correlations with silt (r = −0.87***), clay (r = −0.81***), EC (r = −0.39*), Nt (r = −0.42*), and CEC (r = −0.7***). Silt was negatively correlated with the C/N ratio (r = −0.42*), and pHCaCl2 with the C/N ratio (r = −0.37*). Finally, Nt was negatively correlated with the C/N ratio (r = −0.63**). In accordance with previous multivariate studies [79], soil pH was positively correlated with EC and negatively correlated with Corg, and similarly, the sand fraction throughout the field was negatively correlated with several of the studied chemical soil properties.
In addition to the physico-chemical correlations, soil Si pools—in particular, the dissolved Si and amorphous silica—play a pivotal role in ecosystem functioning by enhancing microbial biomass and structuring communities [42]. These reactive Si fractions improve nutrient and water availability, promote soil aggregation, and contribute to microhabitat stability, factors which are critical for Mediterranean soils frequently subjected to drought and nutrient limitations [37,42]. Notably, the iSi/Siamor ratio reflects the balance between pedogenic and biogenic Si contributions, with higher ratios indicating greater weathering or anthropogenic influence (e.g., deep ploughing). In our study, the dominance of iSi (62% of Siamor) aligns with an intermediate stage of soil development, where pedogenic alteration drives non-crystalline Si precipitation [37,76]. Moreover, the dissolution of these pools facilitates nutrient mobilization, partly through stimulated rhizosphere activity [38], positioning Si, especially when dissolved, and amorphous Si as a key driver of biogeochemical cycling and soil functional resilience under intensified land use.
The RF model analysis was used to evaluate which of the studied soil properties were the main factors controlling Sisol concentrations and soil organic C (Figure 7). The RF analysis revealed that the most critical factors influencing Sisol are pHCaCl2, Sioxa, and Corg (Figure 7a). As previously highlighted, plant-available Si (Sisol) is influenced by soil processes involving pH and the chemical weathering of Si associated with oxides (Sioxa) [77]. Managing soil pH (i.e., by lime addition) can enhance soil Si availability over the long term [77], potentially leading to an increased Sisol, as shown by the positive correlations (Figure 6). Even though plants from the genus Citrus, and specifically Citrus clementina grafted on Carrizo citrange rootstock, are considered passive Si accumulators [69], Si has also been shown to be beneficial in overcoming abiotic and biotic stresses, in mitigating physiological disorders, and in enhancing water regulation [40,80]. Therefore, a slight increase in plant-available Si can have beneficial implications for citrus production. It is also worth saying that current research is highlighting the biochemical mechanisms of Si in regulating plant stress responses and enhancing defense to fungal, bacterial, and pest attacks through, for instance, physical barrier formations, reactive oxygen species scavenging, activation of antioxidative defense responses, and phytohormonal signaling [81,82,83].
The main covariates for predicting the spatial pattern of the Corg content were Nt and Sisol (Figure 7b). Carbon occluded within plant phytoliths can substantially contribute to the total soil organic Corg [84]. Moreover, phytoliths represent a major and easily accessible reservoir of Si readily available for plants [42,74], alluding to the effect of Sisol in the C model.
While this study did not assess microbial or enzymatic parameters directly, the observed associations suggest that quantitative shifts in Si pools may influence microbial-mediated processes and other processes that improve soil health [42]. Future research integrating microbial biomass indicators, community structure, or enzymatic activity would help clarify the role of Si in regulating soil ecosystem functions, particularly in Mediterranean conditions characterized by high pedoclimatic variability and nutrient limitations.
To summarize, it was found that soil Si pools are strongly correlated not only with major soil chemical properties and hence play a role in soil functioning. Moreover, they also impact soil–plant systems, in agreement with Schaller and coworkers [36].

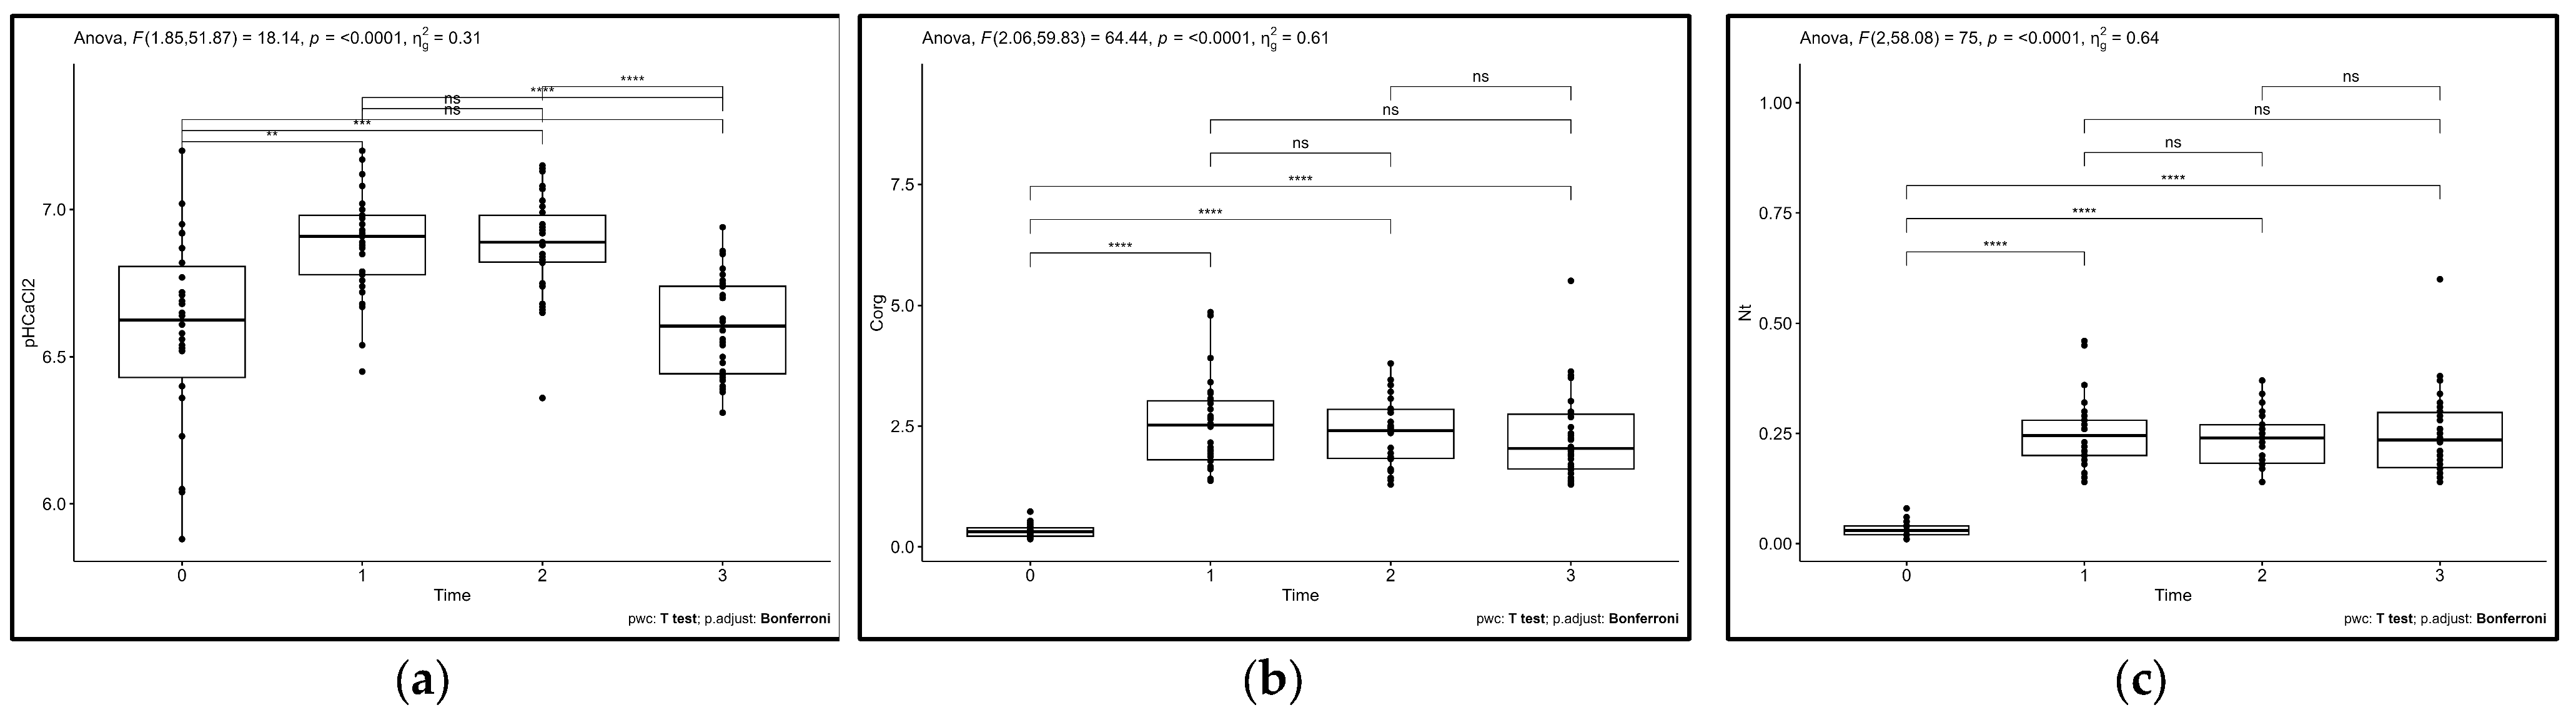
3.3. Temporal and Spatial Variations in Soil Properties and C Stocks to Repeated Compost Addition

Repeated compost addition greatly improved the physical properties of soil, as evidenced by the increase in the index of soil aggregate stability, which changed from an initial 12 to 57% (corresponding to a 5.7-fold increase) after the first amendment, and then slightly varied from 52 to 57% at the two following sampling times (Figure 4a). As expected, the result corroborates Al-Omran et al.’s [85], who went on to show that the coarser the particle fraction of the recipient soil, the larger the improvement in the physical quality of the soil.
The studied soil chemical properties showed significant changes following annual compost amendments during the 3-year observation period (Figure 4). As for soil pH, a significant increase (on average from 6.6 to 6.9) was observed from T0 to T2 (that is, after a 2-year period), and then (over the following 12 months) it decreased to final values similar to the initial ones, but with less overall field variability (Figure 8a). This latter finding is in line with that observed by Steel et al. [86], who reported a short-term increase in soil pH. Similarly, the CEC suddenly increased soon after the initial compost addition, rising from 18.4 to 25.8 cmol kg−1 at T0 and T1, respectively (Figure 4c). No significant variations were noticed at the following T2 and T3 sampling. Unlike the above-mentioned variables, the EC markedly fluctuated across sampling times. In short, first it showed a 5.9-fold increase soon after the initial municipal solid waste compost addition (from an average 0.154 to 0.800 dS m−1), and then it decreased significantly to 0.202 dS m−1 at T2, before rising again to 0.347 dS m−1 at the final sampling time (T3) (Figure 4b). The latter finding is not unexpected since soil incorporation of a salt-rich material such as the composted municipal solid waste used, whose EC reached a value as high as 2.4 dS m−1, is known to bring about short-term but still noticeable increases in soil salinity [87,88]. Even though compost salinity can represent a limiting factor for both soil microbiota activity and crop productivity, this was not the case. In fact, due to the compost dilution effect after soil incorporation and several concurrently acting processes (microbial activity, plant uptake, particle sorption dynamics, ion leaching), EC values were always maintained below the threshold of 1.3 dS m−1, which is considered a critical value for most perennial crops, especially Citrus spp., above which increasing yield reduction occurs [89].
One-way ANOVA evidenced significant changes in the initial total N content after just the first soil compost addition (T1) (Figure 8c): an average tenfold increase from 1.4 to 4.6 g N kg−1 was found, the highest values being observed in the toeslope area (Figure 4e), which was dominated by coarse-textured particles (Figure 3). Moreover, no further significant increase in Nt was detected during the following 2 years irrespective of the additional amendment events (Figure 8c).
Not unexpectedly, the organic C content followed a trend similar to total N content, with the largest increase (~9.2-fold) once again observed after the first amendment event (at T1) (Figure 8b). However, Corg remained substantially unchanged thereafter. In addition, when considering two consecutive sampling points (i.e., T1 vs. T0, T2 vs. T1, and T3 vs. T2), significant positive correlations were found in the absolute differences between Corg and ISS (r > 0.402*), Nt (r > 0.977*), and CEC (r > 0.320*) whatever the interval considered (Table S1).
Nevertheless, enhanced soil Corg and Nt stocks have multiple beneficial effects, which include a general improvement of the soil’s physical, chemical, and biological properties, such as, for instance, increased soil aggregate stability, reduced erosion and improved tilth, enhanced water retention, supported biological diversity, and promoted microbial processes [90,91,92]. Needless to say, improving these features is expected to be beneficial to soil fertility and health, with the potential to positively affect soil functioning, nutrient cycling, and crop productivity [93,94,95].
The repeated addition of mature compost was here confirmed as a suitable and feasible measure to build up soil C resources, in line with previous authors’ reports [96,97], although findings from long-term observation provide critical insights on potential soil C storage. When considering the shallow soil layer (0–10 cm) and using Manrique and Jones’s pedotransfer function to calculate the bulk density, it was possible to estimate the average C stock in the citrus grove soil at the different sampling stages: 4.7 ± 1.8 t C ha−1 (T0), 28.5 ± 7.9 t C ha−1 (T1, corresponding to a 5-fold increase), 27.5 ± 6.1 t C ha−1 (T2, −3.4%), and 26.2 ± 7.9 t C ha−1 (T3, −4.7%). In other words, despite repeated compost addition and the adoption of conservative management practices, soil C storage was found to be limited, not linearly related to organic amendment applications, and mostly concentrated after the first addition. Thus, H1 cannot be confirmed. This finding also corroborates what has recently been observed by certain authors (see, for instance, Mondini et al. [98] and Rumpel et al. [99]), who found that soil organic C stocks are expected to reach an equilibrium level depending on C inputs (and outputs) determined by pedoclimatic conditions, the nature and properties of the exogenous organic matter, land use, and management practices.
To sum up, in agreement with previous research, the repeated addition of mature compost promoted changes in physical, chemical, and biological soil properties, which, in turn, resulted in time-dependent improvements that can contribute to reclaiming degraded land [100] and restoring soil fertility, especially in low-productivity soils or under severe climatic conditions [101,102,103]. However, whatever the nature of the feedstock material used in the composting process, the expected results cannot be generalized. The extent and persistence of compost-induced changes in soil recipient properties are greatly influenced by several factors, such as the experimental conditions in the field, soil type, crop characteristics, climate zones, and agricultural management strategies, which all lead to a huge number of possible conditions in the soil [92]. Moreover, an additional factor to be considered is the large compost variability either from batch to batch, or to a greater extent, among compost processing plants. This leads to the conclusion that short-term soil responses should be cautiously considered, and long-term field observation, possibly using composted materials provided from a unique biowaste processing plant, is needed to collect realistic findings in field studies.

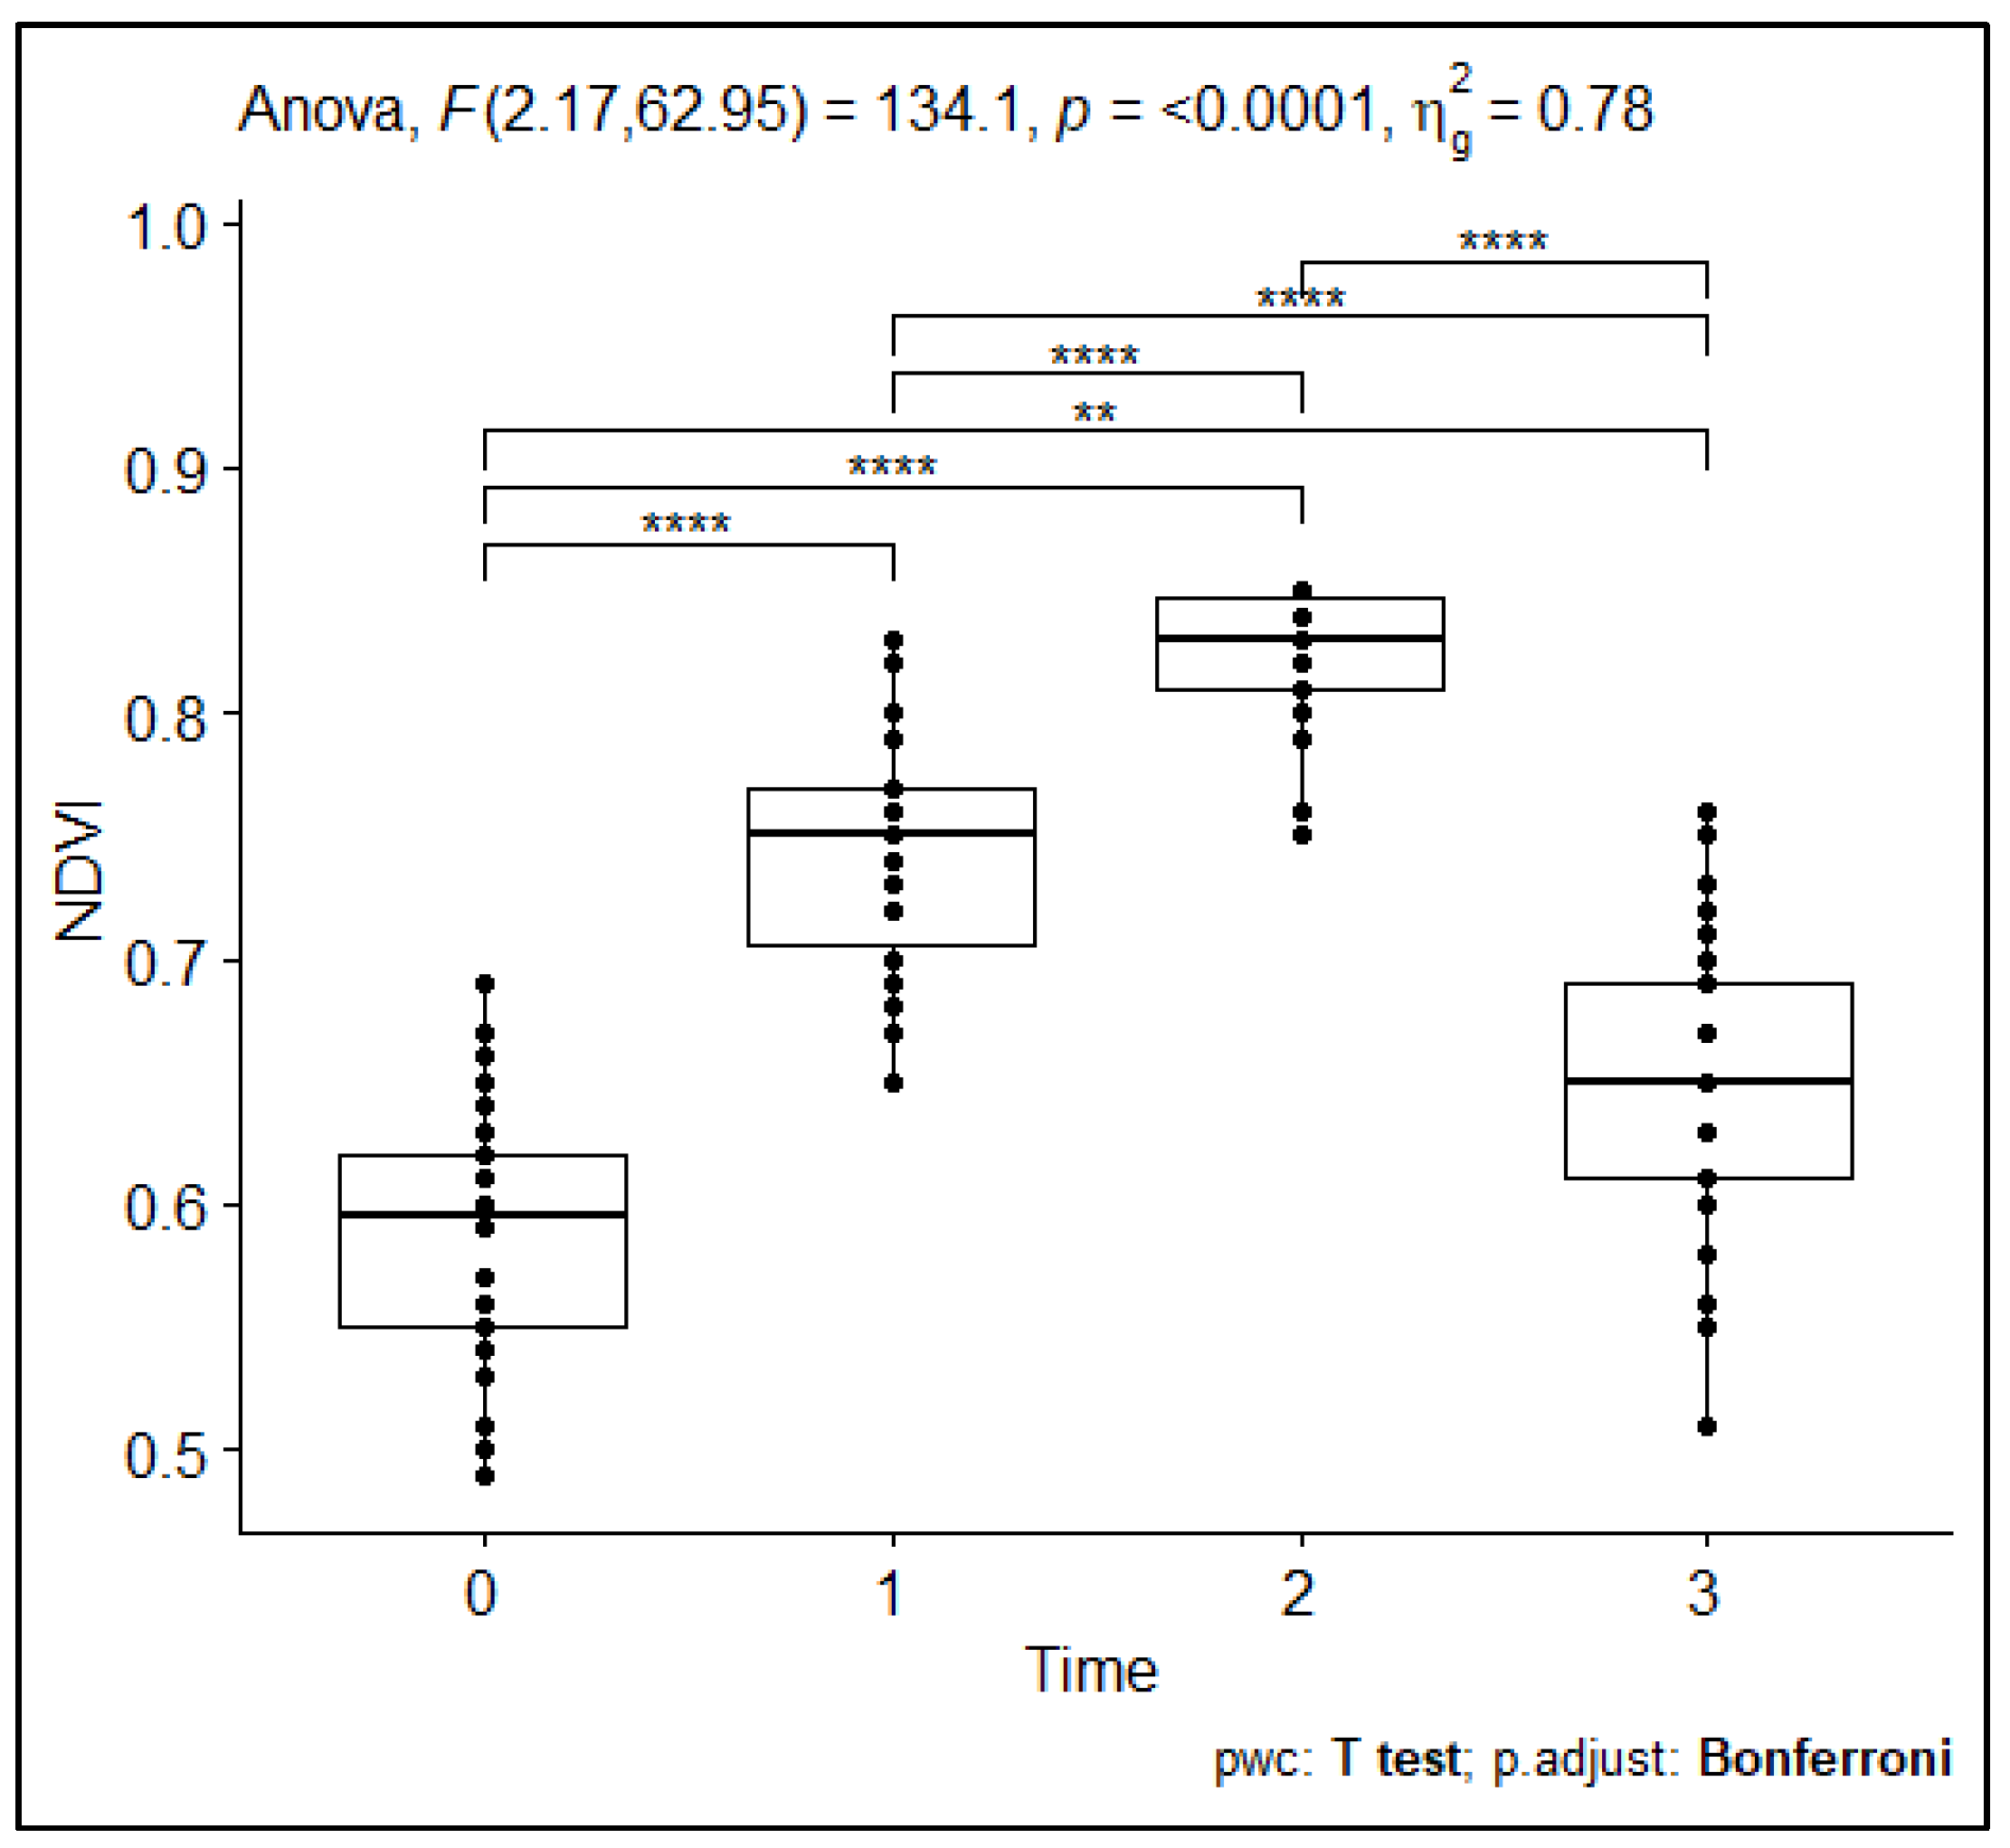
3.4. Temporal and Spatial Variations in Plant Responses to Repeated Compost Addition

Despite the wide range of spatial variability in the chemical and physical soil characteristics, NDVI values showed highly significant differences across the four time points (T0–T3), as confirmed by one-way ANOVA (Figure 9). In brief, the NDVI increased sharply from T0 to T2, peaking at T2, followed by a decline at T3, though values at T3 remained significantly higher than those at T0.
Moreover, when considering two consecutive sampling points (i.e., T1 vs. T0, T2 vs. T1, and T3 vs. T2), no significant linear correlation was found between the absolute variation in NDVI and that of physical and chemical soil properties (Table S1). As surprising as this finding may appear, one needs to bear in mind that perennial tree crops such as clementine trees behave differently from annual herbaceous crops, which have been shown to be more rapidly responsive, in terms of the NDVI, to changed soil conditions [17]. In other words, the time span required for changes in the soil parameters, which the index could represent better, is probably longer than the observation period considered here, and multiple interrelated factors should be comprehensively accounted for [104]. It is also true that, even though statistical evidence was not found here, the rapid increase in NDVI is probably linked to the addition of composted materials that not only increased the pool of total organic C but also promoted soil biological functions, nutrient release, and rhizosphere interactions which in turn provided a real benefit to citrus tree vegetation [94]. Needless to say, several perennial tree crops profit from mycorrhizal belowground networks, which help them reallocate C-substrates, plant essential nutrient elements, and water throughout the soil [105]. In addition to the soil’s properties and management practices, other factors such as climatic and disease factors can be responsible for NDVI responses [106]. This may become particularly true in Mediterranean countries, which, under changing climate conditions, are characterized by increasingly extended hot and dry periods. However, we assume that the climate effect on the NDVI was limited. In fact, drip irrigation at the base of each tree, applied in the early morning hours during the dry season, helped the citrus plants maintain adequate transpiration rates and photosynthetic activity, avoiding stressful conditions in terms of high temperature and water deficit. This was confirmed by the constant and homogeneous crop production rate. Moreover, deleterious effects on citrus trees due to plant pathogens or pest attacks, which could have negatively influenced NDVI responses, were not observed during the surveying period. While this does not necessarily exclude the occurrence of infectious agents or pests, we hypothesize that the adoption of organic farming practices, which included pest control measures, together with the incorporation of composted material, may have prevented them from causing disease symptoms and stressful conditions [107].
To sum up, the unique ecological characteristics of perennial tree species on degraded sites highlight their ability to alter ecosystem dynamics by promoting resource turnover, nutrient distribution, and carbon sequestration, while impacting soil development properties [108,109,110,111]. Within this context, our findings corroborate the inherent ability of perennial tree crops to overcome inherent soil spatial variability and maintain consistent vegetation indices in the short term, thereby supporting overall agroecosystem stability and productivity.
Furthermore, H2 cannot be fully confirmed since the vegetation vigor of citrus trees did not appear strongly correlated with the soil fertility status, at least during the experimental period. Thus, under these circumstances, realistic findings can only be observed under repeated treatments in the long term. To sum up, a wide range of information needs to be acquired in order to develop site-appropriate strategies. These strategies would allow for the implementation of rangeland management practices such as organic amendment while minimizing the risks.

4. Conclusions

This study evaluated the effects of repeated mature compost applications on soil fertility and crop response in a converted Mediterranean citrus orchard, particularly focusing on soil C and N dynamics, vegetative vigor, and the spatial distribution of Si pools.
Our findings showed that compost addition led to an initial increase in soil organic C and N stocks, but subsequent applications did not result in a linear accumulation. Instead, C stocks appeared to plateau after the first year of addition, suggesting that a saturation threshold potentially governed by site-specific soil and climatic conditions was reached irrespective of repeated compost addition. Yet, even though UAV-based NDVI values monitored over a 3-year period of repeated mature compost additions showed significant changes, they were found to be time-dependent and not correlated with the here-measured soil fertility variables (i.e., ISS, pH, Corg, Nt, EC, CEC). Overall, this study demonstrates that while compost application combined with organic farming measures was able to enhance the soil organic matter level at least in the short term, in the long term, variations in soil fertility and tree crop responses are influenced by multiple interacting factors, which create a need to enlarge the number of monitored soil variables (i.e., including biological properties) and to extend the experimental period.
This study also evidenced a rather high and persistent spatial heterogeneity, which was maintained, if not magnified, by the deep soil ploughing, and neither the continuous cultivation nor the organic farming mitigated. However, spatial patterns in Si pools (especially the iSi/Siamor ratio) emerged as particularly responsive to land use conversion, offering potential as indicators of anthropogenic influence and underlying soil processes. Assessing changes in soil Si pools, especially less insoluble forms, calls for a major effort to further study the multifaceted role of this element commonly considered non-essential, whose importance is, however, increasing as a regulating factor of physiological and biochemical responses of the plants.
To conclude, seeking out correlations between C and Si pools can identify unexplored scenarios for future research, with the aim of enlightening their role in sustaining crop productivity and preserving soil health.

Supplementary Materials

The following supporting information can be downloaded at https://www.mdpi.com/article/10.3390/soilsystems9030086/s1. Table S1: Pearson correlation coefficients between absolute differences in NDVI, ISS, pH, Corg, Nt, C/N, EC, and CEC calculated from two consecutive sampling points (i.e., T1 vs. T0, T2 vs. T1, and T3 vs. T2). Figure S1: Graphical representation of Si forms extracted by the different extraction methodologies applied; Figure S2: Spatialization of soil data (kriging) showing the surface variability of the soil aggregate stability index (ISS) in the citrus grove soil at different sampling times: T0 (25 March 2021), T1 (28 April 2022), T2 (17 February 2023), and T3 (22 May 2023); Figure S3: Spatialization of soil data (kriging) showing the surface variability of the electrical conductivity (EC) in the citrus grove soil at different sampling times: T0 (25 March 2021), T1 (28 April 2022), T2 (17 February 2023), and T3 (22 May 2023); Figure S4: Spatialization of soil data (kriging) showing the surface variability of the cation exchange capacity (CEC) in the citrus grove soil at different sampling times: T0 (25 March 2021), T1 (28 April 2022), T2 (17 February 2023), and T3 (22 May 2023); Figure S5: Spatialization of soil data (kriging) showing the surface variability of the organic C content (Corg) in the citrus grove soil at different sampling times: T0 (25 March 2021), T1 (28 April 2022), T2 (17 February 2023), and T3 (22 May 2023); Figure S6: Spatialization of soil data (kriging) showing the surface variability of total N content (Nt) in the citrus grove soil at different sampling times: T0 (25 March 2021), T1 (28 April 2022), T2 (17 February 2023), and T3 (22 May 2023).

Author Contributions

Conceptualization, A.G. and G.M. (Giuseppe Modica); methodology, A.G., A.R.-D., S.P., A.D.R. and G.M. (Giuseppe Modica); formal analysis, A.R.-D. and M.T.R.; investigation, A.G., A.R.-D., M.T.R., S.P., A.D.R. and G.M. (Gaetano Messina); resources, A.G.; data curation, A.G.; writing—original draft preparation, A.R.-D.; writing—review and editing, A.G.; visualization, A.R.-D., S.P. and G.M. (Gaetano Messina); supervision, A.G. All authors have read and agreed to the published version of the manuscript.

Funding

The Next Generation EU funded the work of Gaetano Messina and Salvatore Praticò)—project Tech4You—“Technologies for climate change adaptation and quality of life improvement—Tech4You”, Goal 3.1 “Agriculture and livestock smart farming”, CUP C33C22000290006”.

Institutional Review Board Statement

Not applicable.

Informed Consent Statement

Not applicable.

Data Availability Statement

Data that support the findings of this study are available from the corresponding author upon reasonable request.

Acknowledgments

The authors are very grateful to Enrica Chiodo (Chiodo Farm, Corigliano-Rossano, CS, Italy) for farm access and having generously hosted the field trial. Municipal solid waste compost was produced and provided by Calabra Maceri & Servizi S.p.a. (Rende, Italy). Miroslav Nikolic from the Institute for Multidisciplinary Research, University of Belgrade (Serbia) is warmly acknowledged for analytical support with Si determination. The authors have reviewed and edited the output and take full responsibility for the content of this publication.

Conflicts of Interest

The authors declare no conflicts of interest.

Abbreviations

The following abbreviations are used in this manuscript:
AOIsAreas of interest
GNSSGlobal navigation satellite system
NDVINormalized difference vegetation index
SisolCaCl2-extractable Si
SioxaOxalate-extractable Si
iSiNon-crystalline Na2CO3-extractable amorphous Si
SibioBiogenic Si
UAVUncrewed aerial vehicle

References

  1. Molnar, T.J.; Kahn, P.C.; Ford, T.M.; Funk, C.J.; Funk, C.R. Tree crops, a permanent agriculture: Concepts from the past for a sustainable future. Resources 2013, 2, 457–488. [Google Scholar] [CrossRef]
  2. Lal, R.; Stewart, B.A. Soil Management for Sustaining Ecosystem Services. In Principles of Sustainable Soil Management in Agroecosystems, A Series in Advances in Soil Science; Lal, R., Stewart, B.A., Eds.; CRC Press; Taylor & Francis Group: Boca Raton, FL, USA, 2013; pp. 521–536. ISBN 978-1-4665-1347-1. [Google Scholar]
  3. Lozano-García, B.; Muñoz-Rojas, M.; Parras-Alcántara, L. Climate and land use changes effects on soil organic carbon stocks in a Mediterranean seminatural area. Sci. Total Environ. 2016, 579, 1249–1259. [Google Scholar] [CrossRef]
  4. Francaviglia, R.; Renzi, G.; Ledda, L.; Benedetti, A. Organic carbon pools and soil biological fertility are affected by land use intensity in Mediterranean ecosystems of Sardinia, Italy. Sci. Total Environ. 2017, 599–600, 789–796. [Google Scholar] [CrossRef]
  5. Li, H.; Zhu, H.; Qiu, L.; Wei, X.; Liu, B.; Shao, M. Response of soil OC, N and P to land-use change and erosion in the black soil region of the Northeast China. Agric. Ecosys. Environ. 2020, 302, 107081. [Google Scholar] [CrossRef]
  6. Kim, D.-G.; Kirschbaum, M.U.F.; Eichler-Löbermann, B.; Giffort, R.M.; Liáng, L.L. The effect of land-use change on soil C, N, P, and their stoichiometries: A global synthesis. Agric. Ecosys. Environ. 2023, 348, 108402. [Google Scholar] [CrossRef]
  7. Weil, R.R.; Brady, N.C. The Nature and Properties of Soils, 15th ed. (global edition); Pearson Education: Harlow, UK, 2017; ISBN 978-1-292-16223-2. [Google Scholar]
  8. Baldock, J.A.; Nelson, P.N. Soil organic matter. In Handbook of Soil Science; Sumner, M.E., Ed.; CRC Press: Boca Raton, FL, USA, 2000; pp. 25–84. ISBN 0-8493-3136-6. [Google Scholar]
  9. Dick, W.A.; Gregorich, E.G. Developing and maintaining soil organic matter levels. In Managing Soil Quality: Challenges in Modern Agriculture; Schjønning, P., Elmholt, S., Christensen, B.T., Eds.; CABI Publishing: Oxon, UK, 2004; pp. 103–120. ISBN 0-85199-671-X. [Google Scholar]
  10. Naidu, R.; Megharaj, M.; Owens, G. Recyclable urban and industrial waste—Benefits and problems in agricultural use. In Managing Soil Quality: Challenges in Modern Agriculture; Schjønning, P., Elmholt, S., Christensen, B.T., Eds.; CABI Publishing: Oxon, UK, 2004; pp. 219–237. ISBN 0-85199-671-X. [Google Scholar]
  11. Panettieri, M.; Moreno, B.; de Sosa, L.L.; Benítez, E.; Madejón, E. Soil management and compost amendment are the main drivers of carbon sequestration in rainfed olive trees agroecosystems: An evaluation of chemical and biological markers. Catena 2022, 214, 106258. [Google Scholar] [CrossRef]
  12. Badagliacca, G.; Testa, G.; La Malfa, S.G.; Cafaro, V.; Lo Presti, E.; Monti, M. Organic fertilizers and bio-waste for sustainable soil management to support crops and control greenhouse gas emissions in Mediterranean agroecosystems: A review. Horticulturae 2024, 10, 427. [Google Scholar] [CrossRef]
  13. Fernández-Soler, C.; Garcia-Franco, N.; Almagro, M.; Díaz-Pereira, E.; Luján, R.; García, E.; Martínez-Mena, M. Cover crops improve the long-term stabilization of soil organic carbon and total nitrogen through physico-chemical protection in rainfed semiarid Mediterranean woody crop systems. Soil Use Manag. 2024, 40, e13066. [Google Scholar] [CrossRef]
  14. Gioacchini, P.; Baldi, E.; Montecchio, D.; Mazzon, M.; Quartieri, M.; Toselli, M.; Marzadori, C. Effect of long-term compost fertilization on the distribution of organic carbon and nitrogen in soil aggregates. Catena 2024, 240, 107968. [Google Scholar] [CrossRef]
  15. Khanal, S.; Fulton, J.; Shearer, S. An overview of current and potential applications of thermal remote sensing in precision agriculture. Comput. Electron. Agric. 2017, 139, 22–32. [Google Scholar] [CrossRef]
  16. Messina, G.; Fiozzo, V.; Praticò, S.; Siciliani, B.; Curcio, A.; Di Fazio, S.; Modica, G. Monitoring onion crops using multispectral imagery from unmanned aerial vehicle (UAV). In Smart Innovation, Systems and Technologies; Bevilacqua, C., Calabrò, F., Della Spina, L., Eds.; New Metropolitan Perspectives (NMP 2020); Springer: Cham, Switzerland, 2020; Volume 178. [Google Scholar] [CrossRef]
  17. Badagliacca, G.; Messina, G.; Praticò, S.; Lo Presti, E.; Preiti, G.; Monti, M.; Modica, G. Multispectral vegetation indices and machine learning approaches for durum wheat (Triticum durum Desf.) yield prediction across different varieties. AgriEngineering 2023, 5, 2032–2048. [Google Scholar] [CrossRef]
  18. Rouse, W.; Haas, R.H.; Deering, D.W. Monitoring vegetation systems in the Great Plains with ERTS, NASA SP-351. In Third Earth Resources Technology Satellite-l Symposium, Goddard Space Flight Center, Washington, DC, USA, 10–14 December 1973; National Aeronautics and Space Administration: Washington, DC, USA, 1974; Volume I: Technical Presentations Section A, Paper A-20; pp. 309–317. [Google Scholar]
  19. Yao, H.; Qin, R.; Chen, X. Unmanned aerial vehicle for remote sensing applications—A review. Remote Sens. 2019, 11, 1443. [Google Scholar] [CrossRef]
  20. Gago, J.; Douthe, C.; Coopman, R.E.; Gallego, P.P.; Ribas-Carbo, M.; Flexas, J.; Escalona, J.; Medrano, H. UAVs challenge to assess water stress for sustainable agriculture. Agric. Water Manag. 2015, 153, 9–19. [Google Scholar] [CrossRef]
  21. Messina, G.; Peña, J.M.; Vizzari, M.; Modica, G. A comparison of UAV and satellites multispectral imagery in monitoring onion crop. An application in the ‘cipolla rossa di Tropea’ (Italy). Remote Sens. 2020, 12, 3424. [Google Scholar] [CrossRef]
  22. Farias, G.D.; Bremm, C.; Bredemeier, C.; De Lima Menezes, J.; Alves, L.A.; Tiecher, T.; Martins, A.P.; Fioravanço, G.P.; Da Silva, G.P.; De Faccio Carvalho, P.C. Normalized Difference Vegetation Index (NDVI) for soybean biomass and nutrient uptake estimation in response to production systems and fertilization strategies. Front. Sustain. Food Syst. 2023, 6, 959681. [Google Scholar] [CrossRef]
  23. Ibrahim, M.M.; Lin, Y.; Guo, Z.; Guo, C.; Rao, X.; Liu, S.; Fu, S.; Ye, Q.; Hou, E. Increasing tree diversity reduces spatial heterogeneity of soil organic carbon and promotes carbon storage in subtropical forests. Agric. Ecosys. Environ. 2024, 371, 109077. [Google Scholar] [CrossRef]
  24. Kuzyakov, Y.; Blagodatskaya, E. Microbial hotspots and hot moments in soil: Concept & review. Soil Biol. Biochem. 2015, 83, 184–199. [Google Scholar] [CrossRef]
  25. Nunan, N.; Schmidt, H.; Raynaud, X. The ecology of heterogeneity: Soil bacterial communities and C dynamics. Phil. Trans. R. Soc. B. 2020, 375, 20190249. [Google Scholar] [CrossRef] [PubMed]
  26. Bloor, J.M.G.; Tardif, A.; Pottier, J. Spatial heterogeneity of vegetation structure, plant N pools and soil N content in relation to grassland management. Agronomy 2020, 10, 716. [Google Scholar] [CrossRef]
  27. Patzold, S.; Mertens, F.M.; Bornemann, L.; Koleczek, B.; Franke, J.; Feilhauer, H.; Welp, G. Soil heterogeneity at the field scale: A challenge for precision crop protection. Precision Agric. 2008, 9, 367–390. [Google Scholar] [CrossRef]
  28. García-Palacios, P.; Maestre, F.T.; Bardgett, R.D.; de Kroon, H. Plant responses to soil heterogeneity and global environmental change. J. Ecol. 2012, 100, 1303–1314. [Google Scholar] [CrossRef]
  29. Lin, H.; Wheeler, D.; Bell, J.; Wilding, L. Assessment of soil spatial variability at multiple scales. Ecol. Model. 2005, 182, 271–290. [Google Scholar] [CrossRef]
  30. Nyengere, J.; Okamoto, Y.; Funakawa, S.; Shinjo, H. Analysis of spatial heterogeneity of soil physicochemical properties in Northern Malawi. Geoderma Reg. 2023, 35, e00733. [Google Scholar] [CrossRef]
  31. Tittonell, P. Spatial heterogeneity in agroecosystems. In A Systems Approach to Agroecology; Tittonell, P., Ed.; Springer Nature: Cham, Switzerland, 2023; pp. 241–280. [Google Scholar] [CrossRef]
  32. Shit, P.K.; Bhunia, G.S.; Maiti, R. Spatial analysis of soil properties using GIS based geostatistics models. Model Earth Syst. Environ. 2016, 2, 107. [Google Scholar] [CrossRef]
  33. Oliver, M.A. Geostatistical Applications for Precision Agriculture; Springer: Dordrecht, The Netherlands, 2010. [Google Scholar] [CrossRef]
  34. Liu, T.-L.; Juang, K.-W.; Lee, D.-Y. Interpolating soil properties using kriging combined with categorical information of soil maps. Soil Sci. Soc. Am. J. 2006, 70, 1200–1209. [Google Scholar] [CrossRef]
  35. Wedepohl, K.H. The composition of the continental crust. Geochim. Cosmochim. Acta 1995, 59, 1217–1232. [Google Scholar] [CrossRef]
  36. Schaller, J.; Puppe, D.; Kaczorek, D.; Ellerbrock, R.; Sommer, M. Silicon cycling in soils revisited. Plants 2021, 10, 295. [Google Scholar] [CrossRef]
  37. Cornelis, J.T.; Delvaux, B. Soil processes drive the biological silicon feedback loop. Funct. Ecol. 2016, 30, 1298–1310. [Google Scholar] [CrossRef]
  38. de Tombeur, F.; Cornelis, J.-T.; Laliberté, E.; Lambers, H.; Mahy, G.; Faucon, M.-P.; Turner, B.L. Impact of ecosystem water balance and soil parent material on silicon dynamics: Insights from three long-term chronosequences. Biogeochemistry 2021, 156, 335–350. [Google Scholar] [CrossRef]
  39. Ma, J.F.; Miyake, Y.; Takahashi, E. Silicon as a beneficial element for crop plants. In Silicon in Agriculture; Datnoff, L.E., Snyder, G.H., Korndörfer, G.H., Eds.; 2001; pp. 17–39. [Google Scholar] [CrossRef]
  40. Mvondo-She, M.A.; Gatabazi, A.; Delmege Laing, M.; Rungano Ndhlala, A. A review on the role of silicon treatment in biotic stress mitigation and citrus production. Agronomy 2021, 11, 2198. [Google Scholar] [CrossRef]
  41. de Tombeur, F.; Roux, P.; Cornelis, J.-T. Silicon dynamics through the lens of soil-plant-animal interactions: Perspectives for agricultural practices. Plant Soil 2021, 467, 1–28. [Google Scholar] [CrossRef]
  42. Schaller, J.; Kleber, M.; Puppe, D.; Stein, M.; Sommer, M.; Rillig, M.C. The importance of reactive silica for maintaining soil health. Plant Soil 2025, 1–12. [Google Scholar] [CrossRef]
  43. Clymans, W.; Struyf, E.; Govers, G.; Vandevenne, F.; Conley, D.J. Anthropogenic impact on amorphous silica pools in temperate soils. Biogeosciences 2011, 8, 2281–2293. [Google Scholar] [CrossRef]
  44. Vandevenne, F.I.; Barão, L.; Ronchi, B.; Govers, G.; Meire, P.; Kelly, E.F.; Struyf, E. Silicon pools in human impacted soils of temperate zones. Glob. Biogeochem. Cycles 2015, 29, 1439–1450. [Google Scholar] [CrossRef]
  45. Schaller, J.; Turner, B.L.; Weissflog, A.; Pino, D.; Bielnicka, A.W.; Engelbrecht, B.M.J. Silicon in tropical forests: Large variation across soils and leaves suggests ecological significance. Biogeochemistry 2018, 140, 161–174. [Google Scholar] [CrossRef]
  46. Ishizawa, H.; Niiyama, K.; Iida, Y.; Shari, N.H.Z.; Ripin, A.; Kitajima, K. Spatial variations of soil silicon availability and biogenic silicon flux in a lowland tropical forest in Malaysia. Ecol. Res. 2019, 34, 548–559. [Google Scholar] [CrossRef]
  47. Cornu, S.; Meunier, J.-D.; Ratie, C.; Ouedraogo, F.; Lucas, Y.; Merdy, P.; Barboni, D.; Delvigne, C.; Borschneck, D.; Grauby, O.; et al. Allophanes, a significant soil pool of silicon for plants. Geoderma 2022, 412, 115722. [Google Scholar] [CrossRef]
  48. ARPACAL. Climatic Database of Calabrian Region. Available online: http://www.cfd.calabria.it (accessed on 18 February 2025).
  49. Soil Survey Staff. Keys to Soil Taxonomy; USDA-NRCS: Washington, DC, USA, 2010. [Google Scholar]
  50. IUSS Working Group. WRB World Reference Base for Soil Resources, 2nd ed.; World Soil Resources Reports No. 103; FAO: Rome, Italy, 2006; 145p. [Google Scholar]
  51. Regulation (EU) No 2018/848 of the European Parliament and of the Council of 30 May 2018 on organic production and labelling of organic products and repealing Council Regulation (EC) No 834/2007. Off. J. Eur. Comm. 2018, L150/1, 1–92.
  52. UNI—Ente Nazionale di Unificazione. Compost: Classificazione, Requisiti e Modalità di Impiego; Norma UNI 10780, UNI: Milan, Italy, 1998. (In Italian) [Google Scholar]
  53. ANPA. Metodi di analisi del compost. In ANPA (Agenzia Nazionale per la Protezione dell’Ambiente)—Manuali e Linee Guida 3/2001; ANPA: Roma, Italy, 2001. (In Italian) [Google Scholar]
  54. Legislative decree n. 75/2010. Riordino e revisione della disciplina in materia di fertilizzanti, a norma dell’articolo 13 della legge 7 luglio 2009, n. 88. Gazz. Uff. Della Repubb. Ital. 2010, 121. Suppl. Ord. n. 106/L. (In Italian)
  55. Klute, A. Methods of Soil Analysis. Part 1. Physical and Mineralogical Methods, 2nd ed.; SSSA and ASA: Madison, WI, USA, 1986. [Google Scholar]
  56. Sparks, D.L.; Page, A.L.; Helmke, P.A.; Loeppert, R.H.; Soltanpour, P.N.; Tabatabai, M.A.; Johnston, C.T.; Sumner, M.E. Methods of Soil Analysis. Part 3. Chemical Methods; No. 5 in the SSSA Book Series; SSSA and ASA: Madison, WI, USA, 1996. [Google Scholar]
  57. Cornelis, J.-T.; Titeux, H.; Ranger, J.; Delvaux, B. Identification and distribution of the readily soluble silicon pool in a temperate forest soil below three distinct tree species. Plant Soil 2011, 342, 369–378. [Google Scholar] [CrossRef]
  58. Tamm, O. Eine Metode zur Bestimmung der anorganischen Komponenten des Gelkomplexes im Boden. Mddr. St. Skogsfor. 1922, 19, 387–404. (In German) [Google Scholar]
  59. Saccone, L.; Conley, D.J.; Koning, E.; Sauer, D.; Sommer, M.; Kaczorek, D.; Blecker, S.W.; Kelly, E.F. Assessing the extraction and quantification of amorphous silica in soils of forest and grassland ecosystems. Eur. J. Soil Sci. 2007, 58, 1446–1459. [Google Scholar] [CrossRef]
  60. DeMaster, D.J. The supply and accumulation of silica in the marine environment. Geochim. Cosmochim. Acta 1981, 45, 1715–1732. [Google Scholar] [CrossRef]
  61. Ghuffar, S. DEM generation from multi satellite Planetscope imagery. Remote Sens. 1922, 10, 1462. [Google Scholar] [CrossRef]
  62. Gribov, A.; Krivoruchko, K. Empirical Bayesian kriging implementation and usage. Sci. Total Environ. 2020, 722, 137290. [Google Scholar] [CrossRef]
  63. Pellicone, G.; Caloiero, T.; Modica, G.; Guagliardi, I. Application of several spatial interpolation techniques to monthly rainfall data in the Calabria region (southern Italy). Int. J. Climatol. 2018, 38, 3651–3666. [Google Scholar] [CrossRef]
  64. Breiman, L. Random Forests. Mach. Learn. 2001, 45, 5–32. [Google Scholar] [CrossRef]
  65. R Core Team. R: A Language and Environment for Statistical Computing; Version 4.3.1. RStudio Desktop. 2024. Available online: https://posit.co/download/rstudio-desktop/ (accessed on 18 July 2025).
  66. ARSSA. I Suoli della Calabria—Carta dei Suoli in Scala 1:250.000; Monografia Divulgativa; ARSSA: Soveria Mannelli, Italy, 2003. [Google Scholar]
  67. Zdruli, P. Land resources of the Mediterranean: Status, pressures, trends and impacts on future regional development. Land Degrad. Develop. 2012, 25, 373–384. [Google Scholar] [CrossRef]
  68. Sims, J.T. Soil fertility evaluation. In Handbook of Soil Science; Sumner, M.E., Ed.; CRC Press: Boca Raton, FL, USA, 2000; pp. D113–D154. ISBN 0-8493-3136-6. [Google Scholar]
  69. Mvondo-She, M.A.; Marais, D. The investigation of silicon localization and accumulation in citrus. Plants 2019, 8, 200. [Google Scholar] [CrossRef]
  70. Nakamura, R.; Watanabe, T.; Onoda, Y. Contrasting silicon dynamics between aboveground vegetation and soil along a secondary successional gradient in a cool-temperate deciduous forest. Ecosystems 2023, 26, 1061–1076. [Google Scholar] [CrossRef]
  71. Tang, Y.; Lou, W.; Yan, X.; Li, S.; Wang, P.; Zhou, Y.; Zhan, T.; Zhang, S.; Hu, H.; Wang, X.; et al. The pivotal role of secondary nutrients and micronutrients in regulating fruit quality and root exudates metabolism profile of citrus. Plant Soil 2024, 500, 461–479. [Google Scholar] [CrossRef]
  72. Barão, L.; Teixeira, R.; Vandevenne, F.; Ronchi, B.; Unzué-Belmonte, D.; Struyf, E. Silicon mobilization in soils: The broader impact of land use. Silicon 2020, 12, 1529–1538. [Google Scholar] [CrossRef]
  73. Song, Z.; Müller, K.; Wang, H. Biogeochemical silicon cycle and carbon sequestration in agricultural ecosystems. Earth Sci. Rev. 2014, 139, 268–278. [Google Scholar] [CrossRef]
  74. Haynes, R.J. The nature of biogenic Si and its potential role in Si supply in agricultural soils. Agric. Ecosys. Environ. 2017, 245, 100–111. [Google Scholar] [CrossRef]
  75. Caubet, M.; Cornu, S.; Saby, N.P.A.; Meunier, J.-D. Agriculture increases the bioavailability of silicon, a beneficial element for crop, in temperate soils. Sci. Rep. 2020, 10, 19999. [Google Scholar] [CrossRef]
  76. de Tombeur, F.; Turner, B.L.; Laliberté, E.; Lambers, H.; Cornelis, J.-T. Silicon dynamics during 2 million years of soil development in a coastal dune chronosequence under a Mediterranean climate. Ecosystems 2020, 23, 1614–1630. [Google Scholar] [CrossRef]
  77. Yang, X.; Song, Z.; Van Zwieten, L.; Sun, X.; Yu, C.; Wang, W.; Liu, C.; Wang, H. Spatial distribution of plant-available silicon and its controlling factors in paddy fields of China. Geoderma 2021, 401, 115215. [Google Scholar] [CrossRef]
  78. Meunier, J.D.; Sandhya, K.; Prakash, N.B.; Borschnet, D.; Dussouillez, P. pH as a proxy for estimating plant-available Si? A case study in rice fields in Karnataka (South India). Plant Soil 2018, 432, 143–155. [Google Scholar] [CrossRef]
  79. Gelsomino, A.; Azzellino, A. Multivariate analysis of soils: Microbial biomass, metabolic activity and bacterial community structure and their relationships with soil depth and type. J. Plant Nutr. Soil Sci. 2011, 174, 381–394. [Google Scholar] [CrossRef]
  80. De Souza Junior, J.P.; Kadyampakeni, D.M.; Shahid, M.; Prado, R.; Fajardo, J.L.P. Mitigating abiotic stress in citrus: The role of silicon for enhanced productivity and quality. Plant Stress 2025, 16, 100837. [Google Scholar] [CrossRef]
  81. Kumar, A.; Choudhary, A.; Kaur, H.; Singh, K.; Guha, S.; Choudhary, D.R.; Sonkar, A.; Mehta, S.; Husen, A. Exploring the role of silicon in enhancing sustainable plant growth, defense system, environmental stress mitigation and management. Disc. Appl. Sci. 2025, 7, 406. [Google Scholar] [CrossRef]
  82. Souri, Z.; Khanna, K.; Karimi, N.; Ahmad, P. Silicon and plants: Current knowledge and future prospects. J. Plant Growth Regul. 2021, 40, 906–925. [Google Scholar] [CrossRef]
  83. Saad Ullah, M.; Mahmood, A.; Ameen, M.; Nayab, A.; Ayub, A. Multidimensional role of silicon to mitigate biotic and abiotic stresses in plants: A comprehensive review. Silicon 2024, 16, 5471–5500. [Google Scholar] [CrossRef]
  84. Parr, J.F.; Sullivan, L.A. Soil carbon sequestration in phytoliths. Soil Biol. Biochem. 2005, 37, 117–124. [Google Scholar] [CrossRef]
  85. Al-Omran, A.; Ibrahim, A.; Alharbi, A. Effects of biochar and compost on soil physical quality indices. Commun. Soil Sci. Plant Anal. 2021, 52, 2482–2499. [Google Scholar] [CrossRef]
  86. Steel, H.; Vandecasteele, B.; Willekens, K.; Sabbe, K.; Moens, T.; Bert, W. Nematode communities and macronutrients in composts and compost-amended soils as affected by feedstock composition. Appl. Soil Ecol. 2012, 61, 100–112. [Google Scholar] [CrossRef]
  87. Raviv, M. Composts in growing media: What’s new and what’s next? Acta Hort. 2013, 982, 39–52. [Google Scholar] [CrossRef]
  88. Hargreaves, J.C.; Adl, M.S.; Warman, P.R. A review of the use of composted municipal solid waste in agriculture. Agric. Ecosys. Environ. 2008, 123, 1–14. [Google Scholar] [CrossRef]
  89. Grattan, S.R.; Díaz, F.J.; Pedrero, F.; Vivaldi, G.A. Assessing the suitability of saline wastewaters for irrigation of Citrus spp.: Emphasis on boron and specific-ion interactions. Agric. Water Manag. 2015, 157, 48–58. [Google Scholar] [CrossRef]
  90. Quilty, J.R.; Cattle, S.R. Use and understanding of organic amendments in Australian agriculture: A review. Soil Res. 2011, 49, 1–16. [Google Scholar] [CrossRef]
  91. Gravuer, K.; Gennet, S.; Throop, H.L. Organic amendment additions to rangelands: A meta-analysis of multiple ecosystem outcomes. Glob. Change Biol. 2019, 25, 1152–1170. [Google Scholar] [CrossRef] [PubMed]
  92. Siedt, M.; Schäffer, A.; Smith, K.E.C.; Nabel, M.; Roß-Nickoll, M.; van Dongen, J.T. Comparing straw, compost, and biochar regarding their suitability as agricultural soil amendments to affect soil structure, nutrient leaching, microbial communities, and the fate of pesticides. Sci. Total Environ. 2021, 751, 141607. [Google Scholar] [CrossRef]
  93. Scotti, R.; Bonanomi, G.; Scelza, R.; Zoina, A.; Rao, M.A. Organic amendments as sustainable tool to recovery fertility in intensive agricultural systems. J. Soil Sci. Plant Nutr. 2015, 15, 333–352. [Google Scholar] [CrossRef]
  94. Bonanomi, G.; De Filippis, F.; Zotti, M.; Idbella, M.; Cesarano, G.; Al-Rowaily, S.; Abd-ElGawad, A. Repeated applications of organic amendments promote beneficial microbiota, improve soil fertility and increase crop yield. Appl. Soil Ecol. 2020, 156, 103714. [Google Scholar] [CrossRef]
  95. Piccolo, A.; Drosos, M. The essential role of humified organic matter in preserving soil health. Chem. Biol. Technol. Agric. 2025, 12, 21. [Google Scholar] [CrossRef]
  96. Chen, Y.; Camps-Arbestain, M.; Shen, Q.; Singh, B.; Cayuela, M.L. The long-term role of organic amendments in building soil nutrient fertility: A meta analysis and review. Nutr. Cycl. Agroecosyst. 2018, 111, 103–125. [Google Scholar] [CrossRef]
  97. Zhao, S.; Schmidt, S.; Qin, W.; Li, J.; Li, G.; Zhang, W. Towards the circular nitrogen economy—A global meta-analysis of composting technologies reveals much potential for mitigating nitrogen losses. Sci. Total Environ. 2020, 704, 135401. [Google Scholar] [CrossRef]
  98. Mondini, C.; Cayuela, M.L.; Sinicco, T.; Fornasier, F.; Galvez, A.; Sánchez-Monedero, M.A. Modification of the RothC model to simulate soil C mineralization of exogenous organic matter. Biogeosciences 2017, 14, 3253–3274. [Google Scholar] [CrossRef]
  99. Rumpel, C.; Amiraslani, F.; Chenu, C.; Garcia Cardenas, M.; Kaonga, M.; Koutika, L.-S.; Ladha, J.; Madari, B.; Shirato, Y.; Smith, P.; et al. The 4p1000 initiative: Opportunities, limitations and challenges for implementing soil organic carbon sequestration as a sustainable development strategy. Ambio 2020, 49, 350–360. [Google Scholar] [CrossRef]
  100. Srivastava, V.; de Araujo, A.S.F.; Vaish, B.; Bartelt-Hunt, S.; Singh, P.; Singh, R.P. Biological response of using municipal solid waste compost in agriculture as fertilizer supplement. Rev. Environ. Sci. Biotechnol. 2016, 15, 677–696. [Google Scholar] [CrossRef]
  101. Ros, M.; Klammer, S.; Knapp, B.; Aichberger, K.; Insam, H. Long-term effects of compost amendment of soil on functional and structural diversity and microbial activity. Soil Use Manag. 2006, 22, 209–218. [Google Scholar] [CrossRef]
  102. Diacono, M.; Montemurro, F. Long-term effects of organic amendments on soil fertility. A review. Agron. Sustain. Dev. 2010, 30, 401–422. [Google Scholar] [CrossRef]
  103. D’Hose, T.; Cougnon, M.; De Vliegher, A.; Vandecasteele, B.; Viaene, N.; Cornelis, W.; Van Bockstaele, E.; Reheul, D. The positive relationship between soil quality and crop production: A case study on the effect of farm compost application. Appl. Soil Ecol. 2014, 75, 189–198. [Google Scholar] [CrossRef]
  104. Whetton, R.; Zhao, Y.; Shaddad, S.; Mouazen, A.M. Nonlinear parametric modelling to study how soil properties affect crop yields and NDVI. Comput. Electron. Agric. 2017, 138, 127–136. [Google Scholar] [CrossRef]
  105. Cao, M.-A.; Wang, P.; Hashem, A.; Wirth, S.; Abd_Allah, E.F.; Wu, Q.-S. Field inoculation of arbuscular mycorrhizal fungi improves fruit quality and root physiological activity of citrus. Agriculture 2021, 11, 1297. [Google Scholar] [CrossRef]
  106. Verhulst, N.; Govaerts, B.; Sayre, K.D.; Deckers, J.; François, I.M.; Dendooven, L. Using NDVI and soil quality analysis to assess influence of agronomic management on within-plot spatial variability and factors limiting production. Plant Soil 2009, 317, 41–59. [Google Scholar] [CrossRef]
  107. Bonanomi, G.; Antignani, V.; Capodilupo, M.; Scala, F. Identifying the characteristics of organic soil amendments that suppress soilborne plant diseases. Soil Biol. Biochem. 2010, 42, 136–144. [Google Scholar] [CrossRef]
  108. Frouz, J.; Pižl, V.; Cienciala, E.; Kalčík, J. Carbon storage in post-mining forest soil, the role of tree biomass and soil bioturbation. Biogeochemistry 2009, 94, 111–121. [Google Scholar] [CrossRef]
  109. Melvin, A.M.; Goodale, C.L. Tree species and earthworm effects on soil nutrient distribution and turnover in a northeastern United States common garden. Can. J. For. Res. 2013, 43, 180–187. [Google Scholar] [CrossRef]
  110. Walmsley, A.; Vachová, P.; Hlava, J. Tree species identity governs the soil macrofauna community composition and soil development at reclaimed post-mining sites on calcium-rich clays. Eur. J. For. Res. 2019, 138, 753–761. [Google Scholar] [CrossRef]
  111. Woś, B.; Chodak, M.; Józefowska, A.; Pietrzykowski, M. Influence of tree species on carbon, nitrogen, and phosphorus stocks and stoichiometry under different soil regeneration scenarios on reclaimed and afforested mine and post-fire forest sites. Geoderma 2022, 415, 115782. [Google Scholar] [CrossRef]
Figure 1. Geographical localization and aerial and terrestrial views of the citrus orchard representing the study site.
Soilsystems 09 00086 g001
Figure 2. The sampling scheme constituted by a regular grid evenly covering the whole 16 ha study area. The geometric grid was made up of ten parallel 100 m spaced lines, each containing three GIS-referenced sampling points: one in the line center and the other two equally distant on both the left and right sides. The sampling scheme originated from 30 individually collected soil samples per sampling time.
Soilsystems 09 00086 g002
Figure 3. Spatialization of soil data (kriging) showing the surface variability of textural properties (i.e., sand, silt, and clay content) throughout the citrus grove soil at the first sampling time (T0: 25 March 2021).
Soilsystems 09 00086 g003
Figure 4. Spatialization of soil data (kriging) representing the surface variability of the soil aggregate stability index (ISS) (a), electrical conductivity (EC) (b), cation exchange capacity (CEC) (c), organic C content (Corg) (d), and total N content (Nt) (e) in the citrus grove soil at different sampling times: T0 (25 March 2021), T1 (28 April 2022), T2 (17 February 2023), and T3 (22 May 2023). Higher-quality images are available as single variable figures in the Supplementary Material (Figures S2–S6).
Soilsystems 09 00086 g004
Figure 5. Spatialization of soil data (kriging) showing the surface variability of the four studied soil Si pools (Sibio, iSi, Sioxa, and Sisol) in the citrus grove soil at the first sampling time (T0: 25 March 2021).
Soilsystems 09 00086 g005
Figure 6. Pearson linear correlation coefficients and significance levels (only values significant at p < 0.05 are shown) among Si pools and the physical and chemical properties of the soil.
Soilsystems 09 00086 g006
Figure 7. Relative importance of each investigated soil factor for Sisol (a) and Corg (b) based on Random Forest analysis.
Soilsystems 09 00086 g007
Figure 8. Box plots of pHCaCl2 (a), Corg (b), and Nt (c) over different sampling times (T0: 25 March 2021, T1: 28 April 2022, T2: 17 February 2023, T3: 22 May 2023). On the Y-axis, Corg and Nt contents are expressed in %. Data were statistically processed by one-way ANOVA with repeated measures followed by pairwise comparisons of means with Bonferroni correction (** p < 0.01, *** p < 0.001, **** p < 0.0001, ns = not significant). Generalized eta-squared (η2G) quantifies the proportion of total variance (the closer to 1, the greater explanatory power of the factor) that accounted for the factor (time).
Soilsystems 09 00086 g008
Figure 9. Box plots of NDVI values across different sampling times (T0: 25 March 2021, T1: 3 May 2022, T2: 22 February 2023, T3: 23 June 2023). Data were statistically processed by one-way ANOVA with repeated measures followed by pairwise comparisons of means with Bonferroni correction (** p < 0.01, **** p < 0.0001). Generalized eta-squared (η2G) quantifies the proportion of total variance (the closer to 1, the greater explanatory power of the factor) accounted for by the factor (time).
Soilsystems 09 00086 g009
Table 1. Major soil physical and chemical properties of the citrus grove soil at the beginning of the observation period. Values are means ± SD (n = 30).
ParameterValue
Sand (%)   72.9 ± 6.8
Silt (%)   18.9 ± 4.5
Clay (%)    8.2 ± 3.6
ISS (%) 1   11.9 ± 6.3
pHH2O 2    6.52 ± 0.43
pHCaCl2 3    6.60 ± 0.31
EC (dS m−1 at 25 °C) 4    0.154 ± 0.054
CEC (cmol kg−1)   18.43 ± 3.08
Ca (cmol kg−1)   11.92 ± 0.71
Mg (cmol kg−1)    3.71 ± 0.19
K (cmol kg−1)    1.14 ± 0.06
Na (cmol kg−1)    1.66 ± 0.08
Corg (%)    0.32 ± 0.13
Nt (%)    0.03 ± 0.02
C/N   11.47 ± 3.47
P-Olsen (mg kg−1)   53 ± 3
Sisol (mg g−1)   15.3 ± 8.4 (×10−3)
Sibio (mg g−1)    7.3 ± 3.0
iSi (mg g−1)   13.05 ± 5.57
Sioxa (mg g−1)    0.12 ± 0.06
1 Soil aggregate stability index; 2 in 1:2.5 (w/v) soil/H2O mixture; 3 in 1:2.5 (w/v) soil/0.01 M CaCl2 mixture; 4 in 1:2 (w/v) soil/H2O mixture.
Table 2. Chemical and microbiological properties of the municipal solid waste compost. Values are means ± SD (n = 3) expressed on a dry matter basis. Mandatory limits for the safe use of composted materials such as soil conditioner in agriculture all conform to Italian legislation [54].
ParameterValueMandatory Limit
Chemical analyses
 Moisture (% fresh weight)   18.6 ± 1.2   <50
 pH 1    8.5 ± 0.3    <6.0–8.8
 EC (dS m−1 at 25 °C) 2    2.4 ± 0.3    − 5
 Corg (%)   21.8 ± 2.0   ≥20
 Nt (%)    1.9 ± 0.2    -
 C/N   11.6 ± 1.9   <25
 Norg/Nt (%)   94.0 ± 5.4   ≥80
 CHA+FA (%) 3    7.2 ± 1.5    ≥7.0
 NH4+-N (%)   <0.20   -
 P2O5 (%)    1.46 ± 0.27    -
 K2O (%)    2.52 ± 0.25    -
 Cd (mg kg−1)    0.74 ± 0.15    <1.5
 CrVI (mg kg−1)   <0.1   <0.5
 Cu (mg kg−1)   84 ± 16   <230
 Hg (mg kg−1)    0.15 ± 0.08    <1.5
 Ni (mg kg−1)   16 ± 4   <100
 Pb (mg kg−1)   20 ± 4   <140
 Zn (mg kg−1)   227 ± 45   <500
 Na (mg kg−1)   8220 ± 1070   -
 Total Cr (mg kg−1)   30 ± 4   -
 Glass, metal, plastics (ø ≥ 2 mm; %)    0.2 ± 0.0    0.5
 GI 4 (%)   71 ± 7   ≥60
Microbiological analyses
Salmonella spp. (MPN 25 g−1)    Absent   Absent
Escherichia coli (CFU g−1)   <1 × 10²   1 × 10³
1 In 3:50 (w/v) biomass/H2O mixture; 2 in 1:10 (w/v) biomass/H2O mixture; 3 sum of humic and fulvic acid C; 4 germination index assessed on a 30% dilution of the 1:5.6 (w/v) soil/H2O extract; 5 not requested.
Disclaimer/Publisher’s Note: The statements, opinions and data contained in all publications are solely those of the individual author(s) and contributor(s) and not of MDPI and/or the editor(s). MDPI and/or the editor(s) disclaim responsibility for any injury to people or property resulting from any ideas, methods, instructions or products referred to in the content.

