Abstract
The analysis of soil nematode communities provides information on their impact on soil quality and the health of different agricultural cropping systems and soil management practices, which is necessary to evaluate their sustainability. Here, we evaluated the status of nematode communities and trophic groups’ abundance in fifteen fields hosting different cropping systems and managed according to organic or conventional practices. The nematode population densities differed significantly across cropping systems and management types covering various European climatic zones (spanning 121 to 799 individuals per sample). Population density was affected by the duration of the cropping system, with the lowest value in the vegetable cropping system (on average about 300 individuals) and the highest in the long-term fruiting system (on average more than 500 individuals). The occurrence and abundance of the different trophic groups was partly dependent on the cropping system or the management method, particularly for the bacteria, fungal and plant feeders. The taxonomical classification of a subset of samples allowed us to identify 22 genera and one family (Dorylaimidae) within the five trophic groups. Few taxa were observed in all fields and samples (i.e., Rhabditis and Cephalobus), while Aphelenchoides or Pratylenchus were present in the majority of samples. Phosphorus content was the only soil chemical parameter showing a positive correlation with total nematode population and bacterial feeders’ absolute abundance. Based on the nematological ecological indices, all three cropping systems were characterized by disturbed soil conditions, conductive and dominated by bacterivorous nematodes. This knowledge could lead to a choice of soil management practices that sustain a transition toward healthy soils.
1. Introduction
The use of nematodes as indicators of soil condition and health has been increasing in the last decades in response to demand for better knowledge about the impact of agricultural practices on soil biodiversity and functions suitable to assess the sustainability of new soil management practices [1]. Even though nematodes represent a relatively small amount of biomass in the soil [2], they are a dominant component of the soil community [3]. Their occurrence across the major trophic levels of the soil food web makes them an integral and sensitive component of the soil environment, particularly in relation to their role in bio-geo-cycles (e.g., decomposition of organic matter and the recycling of nutrients) [4].
The soil nematode community has been proven to be a suitable bioindicator to assess soil health [5,6], as well as an indicator of the extent of the nutrients’ cycling processes (e.g., nitrogen and carbon cycling) [7] or of the impact of different agricultural cropping management systems (e.g., integrated and organic farming) on soil health [8]. Moreover, their sensitivity to various agronomic practices involving soil disturbance (e.g., tillage), fertilization (both with organic or mineral fertilizers), crop protection and other soil management practices (e.g., cover crops or living mulches) makes them feasible bioindicators of agroecosystems [9,10]. Indeed, the analysis of the nematode community present in various cropping systems has highlighted the strong impact that the kind of crop and the various agronomic practices, particularly those used for soil management, have on the nematode population as a whole or to specific trophic groups. For example, a study on tomato plantations located in the horticultural area near Buenos Aires, characterized by diverse practices of soil management (e.g., fumigation or application of organic amendments) resulted in consistent effects on the occurrence of some genera belonging to various trophic groups (i.e., Helicotylenchus, Rotylenchus, Rhabditis or Mesorhabditis) [11]. On the other hand, medium or long-term horticultural cropping systems were also found to alter the nematode community due to changes in soil microbial community and its ecological functions on geochemical cycles [12,13,14]. In this respect, the application of microbial-based products as an alternative to reduce the input of mineral fertilizers and synthetic pesticides should be also appraised for its impact at higher trophic levels. Indeed, the nematode–prey and nematode–host interactions are considered to be critical determinants of the distribution of microbes in the soil [15], which could affect the efficacy of any microbial-based products applied to crops [16,17,18,19].
Ecological indexes, particularly those based on nematodes’ trophic level, are a proxy of the food web complexity: a greater diversity of trophic groups represents an improved functioning of the ecosystem [20,21]. Notwithstanding the availability of several ecological indexes that describe the status, complexity and maturity of the nematode communities in soil [22,23], their use in policies remains limited. This highlights the limited appraisal of nematode functions and their suitability for monitoring changes in the provision of soil ecosystem services, as also confirmed by the recent proposal of an EU legal provision to establish a system for monitoring soil health which is neglecting the role of the nematode communities [24].
The objective of the present work was thus to describe the status of the assemblages of soil nematodes associated with various cropping systems, which were managed according to organic or conventional practices and located in various European climatic zones. The aim was to increase the understanding of the impact of these factors (cropping system, management and pedo-climatic characteristics) and their interactions in shaping the nematode community, which can be useful to design sustainable methods of soil management in horticultural cropping systems.
2. Materials and Methods
2.1. Description of the Analyzed Sites
The study utilized data obtained from 15 locations situated in Austria, Denmark, France, Germany, Italy and Poland (Figure 1). The fields, selected for establishing trials planned in the Excalibur project, represented different climatic conditions, and were characterized by diverse field histories and management methods (detailed information about the fields’ localization, their characteristics and chemical properties can be found in Electronic Supplementary Material Table S1). Some of the fields were already hosting the target crop (e.g., existing apple orchards), while others were prepared for the establishment of trials. For this reason, three cropping systems were considered: a “seasonal vegetable” system (including tomato production in the rotation), a medium- and a long-term fruit system (for strawberry and apple crops, respectively). The fields were managed according to organic farming (“ORG”) or conventional methods applying integrated pest management (“IPM”).
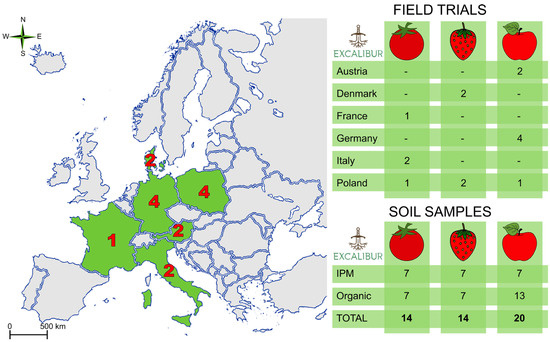
Figure 1.
Overview of the trials’ location with country distribution for the three cropping systems and number of soils samples analyzed. “IPM” stands for conventional management applying Integrated Pest Management practices, while “organic” stands for management according to the regulation of the European Parliament and of the Council on organic production and labelling of organic products (2018/848).
2.2. Soil Sample Collection
Soil samples were collected from the selected locations at the beginning of the growing season in 2021, which depended on the geographical location of the fields and climatic conditions (period (March–May). Sampling was performed using an Egner’s auger (2.5 cm diameter) collecting at least 10 subsamples at 0–20 cm depth, which were pooled to form the analytical sample. Three or four pooled samples (replicates) were collected from each field, leading to a total of 48 samples analyzed (Electronic Supplementary Material Table S2). Visible animals, organic parts (plant residues, roots) and small stones were removed at this stage. The samples were used for nematode extraction and chemical analysis, either immediately or after less than one week of storage at 4 °C.
2.3. Nematode Extraction and Classification
Nematodes were extracted from soil using the Baermann method with minor modifications [25]. Briefly, 100 mL of soil was uniformly spread on a 250 μm sieve, moistened with distilled water and left for 24 h at room temperature. The nematodes extracted from the soil were recovered from the water suspension using a 25 μm sieve. Afterwards they were inactivated by 2 min of heating at 65 °C in a thermostatic bath and preserved in TAF solution (2 mL triethanolamine, 10 mL 40% formalin, and distilled water added to a final volume of 100 mL). Individuals from each sample were counted and fifty randomly selected nematodes were chosen for permanent glycerine slide preparation and detailed classification into trophic group (all samples); samples from the Polish IPM fields were additionally assessed at the genus level. All identified nematodes were assigned, based on the morphological characterization of the main structures of the digestive system, to five trophic groups: bacterial feeders (BF), fungal feeders (FF), plant feeders (PF), omnivores (OM) or predators (PR), following Yeates et al. [26]. Taxonomic classification of the Polish IPM samples was carried out based on keys [27] and specimens assigned to colonizer-persister (c-p) classes [28,29]. The observations and photographic documentation were done using a Nikon Eclipse 80i microscope equipped with a Nikon DS-Fi1 camera under 400×–1000× magnification.
2.4. Soil Chemical Analysis
An aliquot of the same soil samples was used for chemical analysis. The content of the nutrient elements (P, K, Mg and Ca) was determined by inductively coupled plasma optical emission spectrometry as previously described [30]. The pH was determined in water suspension with a pH meter (Fisher Scientific Poland).
2.5. Nematode Community Analysis
Based on the genera abundance data of the three IPM managed Polish sites, the alpha diversity of the nematode communities was calculated using the Shannon index: , where is the proportion of each genus in the whole community. Additionally, eight nematode community-based ecological indices were calculated [31] using the NINJA online calculator [32]: maturity index (MI), maturity index 2–5 (MI2-5), sigma maturity index (ΣMI), plant-parasitic index (PPI), enrichment index (EI), structure index (SI), channel index (CI) and basal index (BI). For all samples, nematode channel ratio (NCR) based on the bacteria feeders and fungi feeders’ trophic groups abundance was calculated [33].
2.6. Data Analysis
Statistical analysis of the data was performed using the R software version 4.1.3 [34]. The Shapiro–Wilk test was used to verify if the data followed a normal distribution and the Levene’s test was used to verify the homogeneity of variances. The data were analyzed by ANOVA and means differences tested with Tukey’s test at ≤ 0.05 with the HSD test function from the “agricolae” package. In the case of non-normal distributions, the non-parametric Kruskal–Wallis analysis with Fisher’s least significant difference post hoc test with p ≤ 0.05, was utilized, introducing the Benjamini–Hochberg correction, using the Kruskal function from the “agricolae” package. Heatmaps were generated using the “heatmap.2” command from “gplots” package [35], and the ternary diagram was generated using “ggtern” [36]. Correlations were calculated and visualized using the “ggcorrplot” package [37].
3. Results
3.1. Analysis of the Nematode Communities at the Trophic Group Level
The total number of nematodes isolated from each soil sample ranged from 121 to 799 individuals (Electronic Supplementary Material Table S2) and showed significant differences (p-value = 0.0039) between fields (Table 1). Those of the seasonal vegetable cropping system (tomato trials) had the lowest amount (297 ± 31 individuals per 100 mL soil), long-term fruit cropping systems (apple trials) had the highest number (527 ± 39 individuals), and medium-term fruit cropping systems (strawberry trials) showed an intermediate number of nematodes (431 ± 57 individuals). No differences were observed between organic and conventional fields with IPM management (p-value = 0.9255). However, the cropping system and management method, considered together as a factor, showed significant differences (p-value = 0.0033) between trials: a lower number of nematodes was observed in fields of organic vegetable cropping systems (200 ± 21 individuals) than in any other field, which resulted in a similar nematode population size (393–546 individuals).

Table 1.
Total number of nematodes (TNN), and the relative and absolute abundance of trophic groups (BF—bacteria feeders, FF—fungi feeders, PF—plant feeders, OM—omnivorous, PR—predators) in 100 mL of soil, as affected by the cropping system and the field management method (mean ± SEM). Different letters show statistically significant differences in columns according to Kruskal–Wallis analysis with Fisher’s least significant difference post hoc test and the Benjamini–Hochberg correction, with significance set at p ≤ 0.05.
Considering the trophic groups’ prevalence (Table 1 and Electronic Supplementary Material Table S2), bacteria feeders (BF) were identified in all samples, while fungi feeders (FF) were always present only in samples from both long-term and medium-term fruit cropping systems. Plant feeders (PF) were consistently present in all long-term and vegetable cropping systems, unlike the mid-term fruit cropping systems. The samples from organically managed mid-term fruit cropping systems, contrary to other cases, were characterized by a total absence of omnivorous nematodes (OM). OM specimens were more often present in samples from conventional fields of mid-term fruit cropping systems. Predatory nematodes (PR) were the least numerous trophic groups identified in all samples.
Statistical analysis of relative and absolute trophic group abundance pointed out differences mainly for BF, FF and PF populations either when considering the cropping system factor, the management method alone or the cropping system in combination with the management method (Table 1). The relative abundance of BF was the highest in the medium-term fruit cropping system (67.2%), similar to the long-term cropping system (61.2%), and significantly higher (p-value = 0.0314) than in the vegetable cropping system (45.4%). Significant differences (p-value = 0.0483) in relative BF abundance were observed also when considering the management method, where significantly more BF (64.0%) were found in organic fields than in conventional fields with IPM management (51.1%). However, a similar effect was not observed (p-value = 0.2845) for the absolute abundance of BF. However, the highest absolute abundance of BF was observed in the long-term fruit cropping system (326 individuals per 100 mL of soil), still comparable with that of the medium-term fruit cropping system (290 individuals), but not with the vegetable cropping system having a significantly lower (p-value = 0.0002) absolute abundance (126 individuals). In case of the PF relative abundance, the medium-term fruit cropping system showed the significantly lowest (p-value = 0.0032) share of this trophic group (12.2%) compared to the other two groups (24.5–37.1%). However, the absolute abundance of PF populations in the vegetable cropping system was similar to both fruit cropping systems, though the number of PF individuals in the populations of the latter was significantly different (p-value = 0.0134). FF populations were affected only by the management method showing significantly lower relative (11.2% versus 19.6%, p-value = 0.0416) and absolute (68 ± 8 versus 47 ± 6 individuals, p-value = 0.0248) abundance in organically managed fields in comparison to the conventional ones. Interestingly, significant differences (p-value = 0.0443) of OM populations between the medium-term fruit (0.6%) and vegetable cropping systems (2.4%) were only found for the relative abundance, which was not evident for absolute abundance (Table 1).
Nevertheless, field management was the only factor that influenced NCR (the ratio between BF and the sum of BF and FF relative abundance), showing higher values for organic fields compared to conventional fields (details in Table 1). Such an effect was not observed for the crop factor alone or the combined effect of crop and management.
The relationship between cropping systems and management methods resulted in differently impacting various trophic groups (Table 1). The organic medium-term fruit cropping system favored the relative abundance of BF, while reducing that of PF compared to the other cropping systems and management methods. However, the same trend was not observed for the absolute abundance of these two trophic groups. BF absolute abundance of both fruit cropping systems was similar, irrespective of the management method, and higher compared to the organic vegetable cropping system. PF absolute abundance was, instead, different between long-term and medium-term organically managed fruit cropping systems. Both OM and PR relative and absolute abundances were not significantly influenced by the management method or the combined effect of cropping system and management method.
3.2. Analysis of the Polish Case Studies
3.2.1. Nematode Communities
Trials involved in the analysis of the nematode community at the genus level were located in Skierniewice (Central Poland) and encompassed all three cropping systems with conventional management using IPM practices. The average number of nematodes isolated from each field ranged between 204 and 373 per 100 mL of soil (Table 2). The total population of nematodes in the medium-term fruit cropping system was significantly lower (p-value = 0.0141) than that of the other two cropping systems.
Table 2.
Total number of nematodes isolated from each IPM Polish cropping system and the absolute (ind./100 mL of soil) and relative abundance of their trophic groups (TNN—total nematode number, BF—bacteria feeders, FF—fungi feeders, PF—plant feeders, OM—omnivorous, PR—predators). Means ± SEM, n = 4. Different letters show statistically significant differences (p < 0.05) between the columns according to ANOVA (*) or Kruskal–Wallis analysis with Fisher’s least significant difference post hoc test and the Benjamini–Hochberg correction.
Considering the abundance of the five trophic groups, three (PF, OM and PR) groups showed consistent trends for relative and absolute values: higher PF abundance in the long-term fruit cropping system compared to the others, with no significant differences for the OM and PR groups (p-values between 0.2634 to 0.9674, details in Table 2). For BF, no differences (p-value = 0.2450) resulted between cropping systems when relative abundance was concerned, while significantly lower (p-value = 0.0064) absolute abundance resulted for the medium-term fruit cropping system (100 versus 196–243 individuals per 100 mL of soil). For FF, no differences resulted for absolute abundance (p-value = 0.1560), while the medium-term fruit cropping system showed significantly highest (p-value = 0.0045) relative abundance (44.3%) compared to the other cropping systems (14.4–23.8%, for details see Table 2).
The taxonomical classification of the samples’ specimens allowed identification of 22 genera and one family (Dorylaimidae, without classification to specific genus) belonging to the five trophic groups (Figure 2 and Electronic Supplementary Material Table S3). The lowest average number of taxa—6.25 (5–7 range)—was identified in the medium-term fruit production field, while the highest number of taxa 10.25 (8–13 range), significantly different from the previous one, was identified for the vegetable production field; long-term fruit production was intermediate between the two. Few taxa were observed in all analyzed fields and samples, including common and popular genera (e.g., Rhabditis), which were present with a relative frequency around 43.5%. Common taxa like Aphelenchoides, Aphelenchus or Pratylenchus were present in the majority of samples (58–92%) but were less abundant (e.g., ranging from 5.9 to 18.9%), (Figure 2 and Electronic Supplementary Material Table S3). Interestingly, the genus Cephalobus was identified in 75% of the analyzed samples, but always in a very low number (less than 10% in individual samples and 3.9% average relative abundance). Other groups with taxa specific to the two fruit cropping systems were also identified, though not present in all samples: Prismatolaimus, Tylenchus and Heterocephalobus for the long-term cropping system and Paratylenchus, Tylenchorhynchys and Prionchulus for the medium-term cropping system (Figure 2).
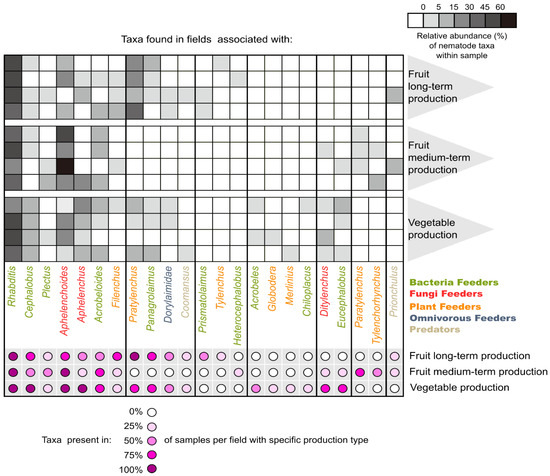
Figure 2.
Nematode taxa occurrence across the different Polish IPM cropping systems in the samples. Grey scale reflects relative abundance of specific taxa within a sample; purple scale reflects taxon prevalence within all samples representing the same cropping system. The vertical lines separate the nematode taxa, which could be found in all three/only two selected/one specific cropping system (see the purple dots assignment to specific cropping system on the right part of the lower part of the heatmap).
The nematode communities of the vegetable cropping system shared four genera (Rhabditis, Cephalobus, Aphelenchoides and Aphelenchus), which were always present in the soil samples. Five other genera were present in 75% of the samples (Acrobeloides, Pratylenchus, Panagrolaimus, Ditylenchus and Eucephalobus). The medium-term fruit cropping system shared only two common taxa (Rhabditis and Aphelenchoides) and two taxa present in 75% of the analyzed samples (Acrobeloides and Paratylenchus). Samples from the long-term fruit cropping system shared only two common genera (Rhabditis and Pratylenchus), and four genera were present in 75% of the samples (Cephalobus, Aphelenchoides, Filenchus and Panagrolaimus) (Figure 2). Four species showed significant differences in abundance between the fields of the three cropping systems: Cephalobus (BF), Aphelenchoides (FF), Paratylenchus and Pratylenchus (both PF) (Table 3). Interestingly, their relative and absolute abundance showed very similar trends, with the exception of Aphelenchoides, characterized by high variation in absolute abundance. However, the two PF genera showed contrasting abundance in relation to the two fruit cropping systems: Paratylenchus was the most abundant in the medium-term fruit cropping system, while Pratylenchus was the most abundant in the long-term fruit cropping system and was absent in the medium-term one. Cephalobus was significantly more frequently identified in the vegetable cropping system than in any other system.
Table 3.
Genera with significant differences in relative or absolute (ind./100 mL of soil) abundance between the three cropping systems. Means ± SE, n = 4. Different letters show statistically significant differences (p < 0.05) in columns according to Kruskal–Wallis analysis with Fisher’s least significant difference post hoc test and the Benjamini–Hochberg correction. BF—bacteria feeders and PF—plant feeders.
3.2.2. Characteristics of the Nematode Communities
The results of the taxonomical analysis of the nematode communities were used for calculations of several indices useful for understanding the community structure, complexity, food availability and level of environmental disturbance (Table 4).
Table 4.
Indices expressing various biodiversity or environmental features based on the structure of the nematode community associated with the three cropping systems. Mean ± SE, n = 3. Different letters show statistically significant differences between columns data (p < 0.05, ANOVA with HSD post hoc test or Kruskal–Wallis * with BH correction for MI2-5, PPI and SI).
Few significant differences were observed in the nematode communities associated with the three cropping systems. The vegetable cropping system displayed the highest biodiversity measured by the Shannon Index (Index H) and total genera number (1.8 and 10.3, respectively), while the medium-term fruit production field had the lowest biodiversity (p-values 0.0322 and 0.0389, respectively) as expressed by these two parameters (1.2 and 6.3 respectively). CI, which is related to the predominant decomposition pathway of organic matter, showed significantly (p-value 0.0489) higher values for the medium-term fruit cropping system (22.1) in comparison to the long-term one (7.1). Similar differences were observed for BI (p-value 0.0310), which is a measure of food web structure and complexity. Three indices associated with the environmental disturbance that can be caused by various factors (MI, MI2-5 and ƩMI) showed non-significant differences (p-values 0.2480–0.4400) among the three analyzed cropping systems. Values of the Plant-Parasitic Index (PPI) did not differ among the cropping systems, although the lowest value was observed for the medium-term fruit cropping system. EI, describing food availability and nutrient enrichment, and SI, expressing the soil food web structure and disturbance, showed rather low and comparable values between the analyzed cropping systems (p-values 0.0506–0.3032). Utilizing these latter indices for the food web analysis, highlighted for almost all samples a disturbed condition, conductive and dominated by bacterivorous nematodes (Figure 3). However, no specific clustering depending on a cropping system was observed.
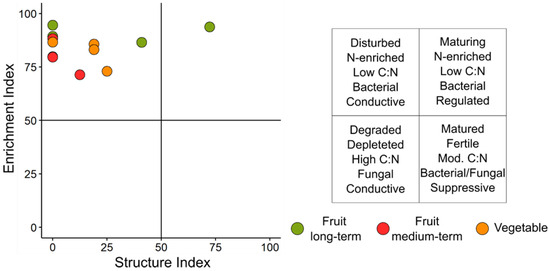
Figure 3.
Evaluation of soil health status based on the nematodes’ food web analysis of the three cropping systems. The legend on the right characterizes each quarter of the graph.
3.2.3. Interactions Between Nematode Trophic Groups’ Abundance and Soil Chemical Properties
The nematode trophic group abundance data were further used to find possible correlations among the groups and with soil chemical analysis in each location (Electronic Supplementary Material Table S4). There was a good correlation between absolute and relative abundance data (on average ρ = 0.90), except for BF. A strong positive correlation emerged between BF or PF absolute abundance and total nematode number (ρ = 0.89 and ρ = 0.62, respectively). However, the same correlation was not observed when the relative abundance of these two trophic groups was considered. A negative correlation resulted when comparing the relative abundance of BF and PF (ρ = −0.75). The only soil chemical parameter showing a correlation was phosphorus, which content resulted in being associated positively with both total nematode population (ρ = 0.70) and BF absolute abundance (ρ = 0.69).
4. Discussion
4.1. Composition of the Nematode Communities in Relation to the Method of Management and Cropping System
The method of field management (i.e., conventional with IPM vs. organic) did not affect the overall nematodes’ number, though it had some impact on the abundance of the trophic groups; mainly increasing the relative abundance of BF and decreasing FF absolute and relative abundance under organic management. Even though organic management is considered to increase the number of nematodes and modify the structure of the community [38,39], results not showing such impact were also found in previous studies with different horticultural crops [8,40]. The changes in BF and FF abundance were strong enough to show significant differences of nematode channel ratio, (the ratio between BF and BF+FF abundance). The values obtained for both kinds of crop management methods (0.85 and 0.74 for organic and IPM, respectively) suggest that the decomposition processes in soil sampled from these fields were dependent mainly on the bacterial-based energy channel rather than the fungal-based energy channel [33]. Such a trend has been found also in other horticultural cropping systems characterized by the application of organic fertilizers [41]. However, it should be noted that whole-season observations of total nematode number and trophic groups’ abundance in conventional and organic production also revealed that the changes could be time-dependent. A similar study on nematode biodiversity in tomato production showed that at the beginning of the growing season the nematode populations were similar in the conventional or organic plots, but over time, the communities under organic management increased [40].
Soil management practices are considered an important factor in shaping the soil nematode community and are thus discussed below in relation to the cropping system. However, plant protection is a major discriminant factor between organic and conventional crop management. Even though pesticide applications negatively influenced the total nematode abundance and the abundance of all trophic groups with particular regard to bacterial feeders and omnivores [42], the pesticide usage, in either organic or integrated management, is limited to non-synthetic or to less harming active substances, respectively. Therefore, according to the study results, both organic and integrated crop protection would have a limited impact as a diversifying factor of nematode communities, providing additional evidence of the non-harmful impact for both organic and integrated management approaches on the nematodes’ population.
The three cropping systems addressed by the study were characterized by diverse approaches to soil management, which provide an additional clue for the interpretation of the impact of the cropping systems on the nematode community. These cropping systems were characterized by a diversified management of soil tillage: less invasive for the long-term apple orchards (where tillage is normally not performed on the row) compared to the seasonal cultivation of tomato (normally under rotation where tillage is commonly applied several times each year, especially before transplanting, which was the period of the soil sampling) and a likewise intermediate medium-term cropping system characteristic of strawberry production. Moreover, the fertilization strategy adopted in the fields concerned by the study was highly dependent and directly related to the cropping system (i.e., the fore crops present or those of the previous season). Therefore, it was not surprising that the cropping system factor, as defined in this work, impacted the nematode communities: the appraisal of the impact emerged from the observation of a decreasing gradient from long-term to medium-term and seasonal vegetable cropping systems in the total number of nematodes. The cropping system could thus be considered as a kind of multilevel factor, since both practices related to soil management (tillage and fertilization) are known to have an impact on soil nematodes’ population, which is nevertheless dependent on the kind of tillage practice, as well as on the type of the fertilizer (i.e., mineral or organic) [29,43,44,45,46]. The impact of these practices, particularly of fertilization, on the structure of the nematode population could derive also from the changes induced on the microbial population by the various kinds of fertilizers (i.e., mineral or organic) [47,48,49] as well as by the addition of microbial biostimulants [16], thus indirectly promoting shifts in the nematode population.
The abundance of the five nematode trophic groups found in the studied sites was similar to that recorded in various terrestrial environments [50,51]. However, significant differences in PF, BF or OM populations’ abundance were recorded between the three cropping systems considered.
The high absolute abundance of PF found in the long-term cropping system confirmed previous findings [52,53,54]. Moreover, a significant increase of PF and specifically Pratylenchus specimens, one of the best known plant-parasitic nematodes commonly associated with symptoms of apple replant disease [55], were observed in the Polish long-term fruit cropping system in comparison with the other production systems, in accordance with previous reports from different countries [56]. The high relative abundance of PF in the vegetable cropping systems was expected, as these crops, which are grown in specialized farms, are frequently affected by attacks from parasitic nematodes [57].
It was noteworthy that the vegetable cropping systems, among those studied in the present work, were characterized by significantly lower abundance of BF nematodes compared to the other two cropping systems. BF are commonly associated with sites of high microbial activity [58] and related to soil organic matter content or the release of diverse root exudates by the different plant species [59]. The vegetable cropping systems studied were instead characterized by soil management practices that negatively affect organic matter accumulation (e.g., rotations with cereals or frequent tillage, etc.), which could account for the observed differences in this non-parasitic trophic group.
The role of the relationship between management method and cropping system was significant in the case of the seasonal cropping system when concerning the total number of nematodes and in the case of PF and BF abundance. These results further underline the importance of analyzing the specific agronomical practice and crop rotation carried out in the field and the environmental conditions, to be able to quantify their possible effect on specific trophic groups under diverse soil conditions [60,61], see below.
When considering the analyses of the Polish sites, the overall situation was comparable to that of the average data from the other sites, with regard to total population sizes and trophic groups’ abundance. It was not surprising that few genera (i.e., Cephalobus—BF, Aphelenchoides—FF, Paratylenchus and Pratylenchus—both PF) were among the most frequently found in all three cropping systems. Indeed, according to a recent meta-analysis, 126 botanical families represent plants associated with plant-parasitic Aphelenchoides species, but the majority of them include flowering plants affected by three species (A. besseyi, A. fragariae and A. ritzemabosi) [62]. Rhabditis and Cephalobus are also widespread genera with a wide trophic behavior [63]. Both Paratylenchus and Pratylenchus are recognized as having a wide range of crop hosts and global distribution, though their abundance can be strongly affected by pedo-climatic characteristics and agronomic management practices, as well as by crop species and cultivars [64,65].
A specific aspect of the taxonomic analysis performed on the Polish samples was the presence of some discrepancies when compared to the results of the analysis of trophic groups, particularly concerning FF and PF nematodes in the medium-term cropping system. The presence and high abundance of Aphelenchoides or Paratylenchus genera, which are frequently occurring in strawberry plantations [66] and are practically considered PF [67,68,69,70], was not supported by the trophic analysis done according to the default classification implemented in the NINJA tool [32], where Aphelenchoides (and Aphelenchus or Ditylenchus as well) are instead considered as fungal feeders. The high number of species included in this genus [70] and their wide adaptation to diverse ecological relationships, with the majority of them belonging to fungal feeders [71,72], could account for the observed discrepancy, considering also that only metabarcoding using DNA-based technique could allow one to correctly identify the species and thus its trophic group [73].
4.2. Status of the Nematodes’ Communities
In an effort to better understand the impact of the cropping systems on the nematode community structure, also in relation to the available food resources, several indices were elaborated with data from Polish sites. Irrespective of the production system considered, high CI values, associated with the soil organic matter decomposition pathways, pointed out a condition with increased decomposition dominance by bacteria. On the other hand, the high BI values determined could indicate a food web diminished by stress or limited nutrient resources [6,31,74]. The low SI values, paralleled by high (>50) EI values, particularly for the seasonal and medium-term systems, were consistent with the indication of a continuous soil disturbance due to anthropogenic factors [31], including the application of external inputs, typical for annual cropping systems [75]. On the other hand, the long-term system was instead characterized by high SI, similar to other less disturbed soils such as meadows or forests [76].
The high value of the Shannon biodiversity index H found in the samples of the vegetable seasonal system requires specific consideration. The field is devoted to trials with vegetable crops, which undergo rotation, hosting several different crop species. This condition, as well as cross-contamination between different areas of the field due to the use of agricultural machines, could be also considered as possible causes of the observed relatively high biodiversity [77,78].
Even though the maturity index (MI) and its derivatives as well as EI showed no differences among the cropping systems, their values are pointing to a rather high level of nutrient availability, substantial disturbance resulting from perturbations unrelated to nutrient enrichment and minimal plant-parasitic pressure [6,31], confirmed by low values of PPI observed in each system. However, only phosphorus content in the soil resulted in being correlated with the nematode communities in the analyzed data set, with both TNN and BF absolute abundance being positively correlated with its content. This relation was observed in different terrestrial landscapes, including apple orchards and other crops or natural environments [79,80,81], and it can be related to the relative low solubility and strong dependence on soil conditions (e.g., texture or pH) of P compared to others [82].
5. Conclusions
The analysis of the nematode community present in fields devoted to horticultural cropping systems under various pedo-climatic conditions confirmed that the management method (i.e., conventional with IPM vs. organic) impacted to a certain extent the abundance of the different trophic groups, particularly bacterial and fungal feeders. The duration of the cropping system was associated with the presence of plant feeders, the most abundant trophic group in the long-term cropping system, which could be an inducive factor of replanting diseases. The small differences observed in biodiversity and ecological indices between cropping systems was paralleled by a common soil disturbed condition, conductive and dominated by bacterivorous nematodes, a result that could be considered when monitoring soil quality, particularly when microbial-based products are applied for both fertilization or plant protection from soil-borne pests as a sustainable practice for the management of soil in horticultural cropping systems.
Supplementary Materials
The following supporting information can be downloaded at: https://www.mdpi.com/article/10.3390/soilsystems9030077/s1, Table S1: Description of the trials involved in the analysis. IPM and ORG stand for integrated pest management and organic management respectively. Table S2: Relative (%) or absolute trophic groups’ abundance among tested production systems. IPM and ORG stand for integrated pest management and organic management respectively. Trophic groups correspond to: BF—bacteria feeders, FF—fungi feeders, PF—plant feeders, OM—omnivorous, PR—predators; NCR—nematode channel ratio. Table S3. Total number of nematodes, and the relative and absolute abundance of trophic groups (BF—bacteria feeders, FF—fungi feeders, PF—plant feeders, OM—omnivorous, PR—predators) as affected by the cropping system and the field management method (mean ± SE). Different letters show statistically significant differences in columns according to Kruskal–Wallis analysis with Fisher’s least significant difference post hoc test and the Benjamini–Hochberg correction, with significance set at p ≤ 0.05. Table S4: Relative (%) and absolute abundance of genera identified in Polish integrated pest managed trials. Table S5: Spearman’s correlations between absolute or relative abundance of the nematodes’ trophic groups and chemical soil parameters. Only significant (p < 0.05) and strong (ρ = |0.60|) correlations coefficients are marked. TNN—total nematode number; BF—bacterial feeders; FF—fungal feeders; PF—plant feeders; OM—omnivores; PR—predators; %—for relative abundance.
Author Contributions
Conceptualization, E.M.; methodology, D.K.; formal analysis, E.M.F.; investigation, D.K., M.O., S.B., E.O., S.M., S.T., A.B., L.D. and H.M.; data curation, E.M.F.; writing—original draft preparation, E.M.F. and E.M.; writing—review and editing, E.M.F., M.O., S.B., L.D. and E.M.; visualization, E.M.F.; supervision, E.M. All authors have read and agreed to the published version of the manuscript.
Funding
The work was supported by the project EXCALIBUR funded by the European Union’s Horizon 2020 Research and Innovation Program under grant agreement No. 817946.
Institutional Review Board Statement
Not applicable.
Informed Consent Statement
Not applicable.
Data Availability Statement
The original contributions presented in this study are included in the article/Supplementary Materials. Further inquiries can be directed to the corresponding author.
Acknowledgments
Morgane Ourry would like to thank Nicolai Vitt Meyling for establishing the experiment in Denmark and for technical assistance in collecting samples.
Conflicts of Interest
Author Sara Turci was employed by the company RI.NOVA Research and Innovation Soc. Coop. The remaining authors declare that the research was conducted in the absence of any com-mercial or financial relationships that could be construed as a potential conflict of interest.
References
- Tsiafouli, M.A.; Thébault, E.; Sgardelis, S.P.; de Ruiter, P.C.; van der Putten, W.H.; Birkhofer, K.; Hemerik, L.; de Vries, F.T.; Bardgett, R.D.; Brady, M.V.; et al. Intensive Agriculture Reduces Soil Biodiversity across Europe. Glob. Chang. Biol. 2015, 21, 973–985. [Google Scholar] [CrossRef] [PubMed]
- Sohlenius, B. Abundance, Biomass and Contribution to Energy Flow by Soil Nematodes in Terrestrial Ecosystems. Oikos 1980, 34, 186–194. [Google Scholar] [CrossRef]
- Bardgett, R.D.; van der Putten, W.H. Belowground Biodiversity and Ecosystem Functioning. Nature 2014, 515, 505–511. [Google Scholar] [CrossRef] [PubMed]
- Ferris, H. Contribution of Nematodes to the Structure and Function of the Soil Food Web. J. Nematol. 2010, 42, 63–67. [Google Scholar] [PubMed]
- Griffiths, B.S.; Römbke, J.; Schmelz, R.M.; Scheffczyk, A.; Faber, J.H.; Bloem, J.; Pérès, G.; Cluzeau, D.; Chabbi, A.; Suhadolc, M.; et al. Selecting Cost Effective and Policy-Relevant Biological Indicators for European Monitoring of Soil Biodiversity and Ecosystem Function. Ecol. Indic. 2016, 69, 213–223. [Google Scholar] [CrossRef]
- Sánchez-Moreno, S.; Ferris, H. Nematode Ecology and Soil Health. In Plant Parasitic Nematodes in Subtropical and Tropical Agriculture; CABI Books; CAB International: Wallingford, UK, 2018; pp. 62–86. [Google Scholar]
- Neher, D.A. Role of Nematodes in Soil Health and Their Use as Indicators. J. Nematol. 2001, 33, 161. [Google Scholar]
- Neher, D.A. Nematode Communities in Organically and Conventionally Managed Agricultural Soils. J. Nematol. 1999, 31, 142–154. [Google Scholar] [PubMed]
- Lazarova, S.; Coyne, D.; G. Rodríguez, M.; Peteira, B.; Ciancio, A. Functional Diversity of Soil Nematodes in Relation to the Impact of Agriculture—A Review. Diversity 2021, 13, 64. [Google Scholar] [CrossRef]
- Puissant, J.; Villenave, C.; Chauvin, C.; Plassard, C.; Blanchart, E.; Trap, J. Quantification of the Global Impact of Agricultural Practices on Soil Nematodes: A Meta-Analysis. Soil Biol. Biochem. 2021, 161, 108383. [Google Scholar] [CrossRef]
- Salas, A.; Achinelly, M.F. Community Structure of Soil Nematodes Associated with the Rhizosphere of Solanum Lycopersicum in a Major Production Area in Argentina: A Case Study Among Agroecosystem Types. J. Soil. Sci. Plant Nutr. 2020, 20, 43–54. [Google Scholar] [CrossRef]
- Kanfra, X.; Wrede, A.; Mahnkopp-Dirks, F.; Winkelmann, T.; Heuer, H. Networks of Free-Living Nematodes and Co-Extracted Fungi, Associated with Symptoms of Apple Replant Disease. Appl. Soil Ecol. 2022, 172, 104368. [Google Scholar] [CrossRef]
- Kanfra, X.; Liu, B.; Beerhues, L.; Sørensen, S.J.; Heuer, H. Free-Living Nematodes Together with Associated Microbes Play an Essential Role in Apple Replant Disease. Front. Plant Sci. 2018, 9, 1666. [Google Scholar] [CrossRef] [PubMed]
- Li, X.; Lewis, E.E.; Liu, Q.; Li, H.; Bai, C.; Wang, Y. Effects of Long-Term Continuous Cropping on Soil Nematode Community and Soil Condition Associated with Replant Problem in Strawberry Habitat. Sci. Rep. 2016, 6, 30466. [Google Scholar] [CrossRef] [PubMed]
- Liu, T.; Hu, F.; Li, H. Spatial Ecology of Soil Nematodes: Perspectives from Global to Micro Scales. Soil Biol. Biochem. 2019, 137, 107565. [Google Scholar] [CrossRef]
- Malusa, E.; Sas-Paszt, L.; Trzcinski, P.; Górska, A. Influences of Different Organis Fertilizers and Amendments on Nematode Trophic Groups and Soil Microbial Communities during Strawberry Growth. Acta Hortic. 2012, 933, 253–260. [Google Scholar] [CrossRef]
- Furmanczyk, E.M.; Malusà, E. Control of Nematodes in Organic Horticulture Exploiting the Multifunctional Capacity of Microorganisms. Horticulturae 2023, 9, 920. [Google Scholar] [CrossRef]
- Gough, E.C.; Owen, K.J.; Zwart, R.S.; Thompson, J.P. A Systematic Review of the Effects of Arbuscular Mycorrhizal Fungi on Root-Lesion Nematodes, Pratylenchus spp. Front. Plant Sci. 2020, 11, 923. [Google Scholar] [CrossRef]
- Hol, W.H.G.; Cook, R. An Overview of Arbuscular Mycorrhizal Fungi–Nematode Interactions. Basic Appl. Ecol. 2005, 6, 489–503. [Google Scholar] [CrossRef]
- Moore, J.C. Impact of Agricultural Practices on Soil Food Web Structure: Theory and Application. Agric. Ecosyst. Environ. 1994, 51, 239–247. [Google Scholar] [CrossRef]
- Neher, D.A.; Darby, B.J. General Community Indices That Can Be Used for Analysis of Nematode Assemblages. In Nematodes as Environmental Indicators; CABI: Wallingford, UK, 2009; pp. 107–123. [Google Scholar]
- Tsiafouli, M.A.; Bhusal, D.R.; Sgardelis, S.P. Nematode Community Indices for Microhabitat Type and Large Scale Landscape Properties. Ecol. Indic. 2017, 73, 472–479. [Google Scholar] [CrossRef]
- Urzelai, A.; Hernández, A.J.; Pastor, J. Biotic Indices Based on Soil Nematode Communities for Assessing Soil Quality in Terrestrial Ecosystems. Sci. Total Environ. 2000, 247, 253–261. [Google Scholar] [CrossRef] [PubMed]
- European Commission. Proposal for a Directive of the European Parliament and of the Council on Soil Monitoring and Resilience (Soil Monitoring Law). COM/2023/416 Final. 2023. Available online: https://eur-lex.europa.eu/resource.html?uri=cellar:01978f53-1b4f-11ee-806b-01aa75ed71a1.0001.02/DOC_1&format=PDF (accessed on 10 July 2025).
- Luc, M.; Sikora, R.A.; Bridge, J. (Eds.) Plant Parasitic Nematodes in Subtropical and Tropical Agriculture; CABI Bioscience: Egham, UK, 2005. [Google Scholar]
- Yeates, G.W.; Bongers, T.; de Goede, R.G.M.; Freckman, D.W.; Georgieva, S.S. Feeding Habits in Soil Nematodes Families and Genera—An Outline for Soil Ecologists. J. Nematol. 1993, 25, 315–331. [Google Scholar] [PubMed]
- Bongers, A.M.T. De Nematoden van Nederland; Natuurhistorische bibliotheek van de KNNV: 46; Stichting Uitgeverij Koninklijke Nederlandse Natuurhistorische Vereniging: Utrecht, The Netherlands, 1988; ISBN 9789050110150. [Google Scholar]
- Bongers, T. The Maturity Index: An Ecological Measure of Environmental Disturbance Based on Nematode Species Composition. Oecologia 1990, 83, 14–19. [Google Scholar] [CrossRef] [PubMed]
- Bongers, T. The Maturity Index, the Evolution of Nematode Life History Traits, Adaptive Radiation and Cp-Scaling. Plant Soil 1999, 212, 13–22. [Google Scholar] [CrossRef]
- Sas-Paszt, L.; Sumorok, B.; Derkowska, E.; Trzciński, P.; Lisek, A.; Grzyb, Z.S.; Sitarek, M.; Przybył, M.; Frąc, M. Effect of Microbiologically Enriched Fertilizers on the Vegetative Growth of Strawberry Plants under Field Conditions in the First Year of Plantation. J. Res. Appl. Agric. Eng. 2019, 64, 29–37. [Google Scholar]
- Du Preez, G.; Daneel, M.; De Goede, R.; Du Toit, M.J.; Ferris, H.; Fourie, H.; Geisen, S.; Kakouli-Duarte, T.; Korthals, G.; Sánchez-Moreno, S.; et al. Nematode-Based Indices in Soil Ecology: Application, Utility, and Future Directions. Soil Biol. Biochem. 2022, 169, 108640. [Google Scholar] [CrossRef]
- Sieriebriennikov, B.; Ferris, H.; de Goede, R.G.M. NINJA: An Automated Calculation System for Nematode-Based Biological Monitoring. Eur. J. Soil Biol. 2014, 61, 90–93. [Google Scholar] [CrossRef]
- Yeates, G.W. Nematodes as Soil Indicators: Functional and Biodiversity Aspects. Biol. Fertil. Soils 2003, 37, 199–210. [Google Scholar] [CrossRef]
- R Core Team. R: A Language and Environment for Statistical Computing; R Foundation for Statistical Computing: Vienna, Austria, 2022; Available online: https://www.R-project.org/ (accessed on 10 July 2025).
- Warnes, G.R.; Bolker, B.; Bonebakker, L.; Gentleman, R.; Huber, W.; Liaw, A.; Maechler, M.; Magnusson, A.; Moeller, S.; Schwartz, M.; et al. gplots: Various R Programming Tools for Plotting Data; R package version 3.1.1. 2024. Available online: https://cran.r-project.org/web/packages/gplots/index.html (accessed on 10 July 2025).
- Hamilton, N.E.; Ferry, M. Ggtern: Ternary Diagrams Using Ggplot2. J. Stat. Softw. 2018, 87, 1–17. [Google Scholar] [CrossRef]
- Kassambara, A. ggcorrplot: Visualization of a Correlation Matrix Using “ggplot2”. R Package Version 0.1.4. 2023. Available online: https://cloud.r-project.org/web/packages/ggcorrplot/ggcorrplot.pdf (accessed on 10 July 2025).
- Li, Y.; Li, J.; Zheng, C.; Cao, Z. Effects of Organic, Low Input, Conventional Management Practices on Soil Nematode Community under Greenhouse Conditions. Acta Agric. Scand. Sect. B—Soil Plant Sci. 2014, 64, 360–371. [Google Scholar] [CrossRef]
- Quist, C.W.; Schrama, M.; de Haan, J.J.; Smant, G.; Bakker, J.; van der Putten, W.H.; Helder, J. Organic Farming Practices Result in Compositional Shifts in Nematode Communities That Exceed Crop-Related Changes. Appl. Soil Ecol. 2016, 98, 254–260. [Google Scholar] [CrossRef]
- Ferris, H.; Venette, R.C.; Lau, S.S. Dynamics of Nematode Communities in Tomatoes Grown in Conventional and Organic Farming Systems, and Their Impact on Soil Fertility. Appl. Soil Ecol. 1996, 3, 161–175. [Google Scholar] [CrossRef]
- Briar, S.S.; Grewal, P.S.; Somasekhar, N.; Stinner, D.; Miller, S.A. Soil Nematode Community, Organic Matter, Microbial Biomass and Nitrogen Dynamics in Field Plots Transitioning from Conventional to Organic Management. Appl. Soil Ecol. 2007, 37, 256–266. [Google Scholar] [CrossRef]
- Yang, B.; Chen, Q.; Liu, X.; Chen, F.; Liang, Y.; Qiang, W.; He, L.; Ge, F. Effects of Pest Management Practices on Soil Nematode Abundance, Diversity, Metabolic Footprint and Community Composition Under Paddy Rice Fields. Front. Plant Sci. 2020, 11, 88. [Google Scholar] [CrossRef] [PubMed]
- Rueda-Ayala, V.; Rasmussen, J.; Gerhards, R. Mechanical Weed Control. In Precision Crop Protection—The Challenge and Use of Heterogeneity; Springer: Dordrecht, The Netherlands, 2010; pp. 279–294. ISBN 978-90-481-9276-2. [Google Scholar]
- Zhong, S.; Zeng, H.; Jin, Z. Influences of Different Tillage and Residue Management Systems on Soil Nematode Community Composition and Diversity in the Tropics. Soil Biol. Biochem. 2017, 107, 234–243. [Google Scholar] [CrossRef]
- Zhang, X.; Ferris, H.; Mitchell, J.; Liang, W. Ecosystem Services of the Soil Food Web after Long-Term Application of Agricultural Management Practices. Soil Biol. Biochem. 2017, 111, 36–43. [Google Scholar] [CrossRef]
- Stefanovska, T.; Skwiercz, A.; Pidlisnyuk, V.; Zhukov, O.; Kozacki, D.; Mamirova, A.; Newton, R.A.; Ust’ak, S. The Short-Term Effects of Amendments on Nematode Communities and Diversity Patterns under the Cultivation of Miscanthus × Giganteus on Marginal Land. Agronomy 2022, 12, 2063. [Google Scholar] [CrossRef]
- Dincă, L.C.; Grenni, P.; Onet, C.; Onet, A. Fertilization and Soil Microbial Community: A Review. Appl. Sci. 2022, 12, 1198. [Google Scholar] [CrossRef]
- Guo, Z.; Wan, S.; Hua, K.; Yin, Y.; Chu, H.; Wang, D.; Guo, X. Fertilization Regime Has a Greater Effect on Soil Microbial Community Structure than Crop Rotation and Growth Stage in an Agroecosystem. Appl. Soil Ecol. 2020, 149, 103510. [Google Scholar] [CrossRef]
- Marschner, P.; Kandeler, E.; Marschner, B. Structure and Function of the Soil Microbial Community in a Long-Term Fertilizer Experiment. Soil Biol. Biochem. 2003, 35, 453–461. [Google Scholar] [CrossRef]
- van den Hoogen, J.; Geisen, S.; Routh, D.; Ferris, H.; Traunspurger, W.; Wardle, D.A.; de Goede, R.G.M.; Adams, B.J.; Ahmad, W.; Andriuzzi, W.S.; et al. Soil Nematode Abundance and Functional Group Composition at a Global Scale. Nature 2019, 572, 194–198. [Google Scholar] [CrossRef] [PubMed]
- Wilschut, R.A.; Geisen, S. Nematodes as Drivers of Plant Performance in Natural Systems. Trends Plant Sci. 2021, 26, 237–247. [Google Scholar] [CrossRef] [PubMed]
- de Ramos, E.K.K.; Pazdiora, P.C.; Dallagnol, L.J.; de Araujo Filho, J.V. Plant Parasitic Nematode Communities Associated to Apple Orchards in the Southern Brazil. Trop. Plant Pathol. 2022, 47, 626–634. [Google Scholar] [CrossRef]
- Yüksel, E.; Imren, M.; Özer, G.; Bozbuğa, R.; Dababat, A.A.; Canhilal, R. Occurrence, Identification, and Diversity of Parasitic Nematodes in Apple (Malus Domestica Borkh.) Orchards in the Central Anatolia Region of Türkiye. J. Plant Dis. Prot. 2023, 130, 1331–1346. [Google Scholar] [CrossRef]
- Pokharel, R.; Marahatta, S.P.; Handoo, Z.A.; Chitwood, D.J. Nematode Community Structures in Different Deciduous Tree Fruits and Grape in Colorado, USA and Impact of Organic Peach and Apple Production Practices. Eur. J. Soil Biol. 2015, 67, 59–68. [Google Scholar] [CrossRef]
- Nicol, J.M.; Turner, S.J.; Coyne, D.L.; den Nijs, L.; Hockland, S.; Maafi, Z.T. Current Nematode Threats to World Agriculture. In Genomics and Molecular Genetics of Plant-Nematode Interactions; Jones, J., Gheysen, G., Fenoll, C., Eds.; Springer: Dordrecht, The Netherlands, 2011; pp. 21–43. ISBN 978-94-007-0434-3. [Google Scholar]
- Kanfra, X.; Obawolu, T.; Wrede, A.; Strolka, B.; Winkelmann, T.; Hardeweg, B.; Heuer, H. Alleviation of Nematode-Mediated Apple Replant Disease by Pre-Cultivation of Tagetes. Horticulturae 2021, 7, 433. [Google Scholar] [CrossRef]
- Lopes-Caitar, V.S.; Pinheiro, J.B.; Pinheiro, F.C. Nematodes in Horticulture: An Overview. J. Hortic. Sci. Crop Res. 2019, 1, 106. [Google Scholar]
- Xiao, H.-F.; Li, G.; Li, D.-M.; Hu, F.; Li, H.-X. Effect of Different Bacterial-Feeding Nematode Species on Soil Bacterial Numbers, Activity, and Community Composition. Pedosphere 2014, 24, 116–124. [Google Scholar] [CrossRef]
- Sikder, M.M.; Vestergård, M. Impacts of Root Metabolites on Soil Nematodes. Front. Plant Sci. 2020, 10, 1792. [Google Scholar] [CrossRef] [PubMed]
- Ferris, H.; Sánchez-Moreno, S.; Brennan, E.B. Structure, Functions and Interguild Relationships of the Soil Nematode Assemblage in Organic Vegetable Production. Appl. Soil Ecol. 2012, 61, 16–25. [Google Scholar] [CrossRef]
- Wardle, D.A.; Yeates, G.W.; Williamson, W.; Bonner, K.I. The Response of a Three Trophic Level Soil Food Web to the Identity and Diversity of Plant Species and Functional Groups. Oikos 2003, 102, 45–56. [Google Scholar] [CrossRef]
- Sánchez-Monge, A.; Flores, L.; Salazar, L.; Hockland, S.; Bert, W. An Updated List of the Plants Associated with Plant-Parasitic Aphelenchoides (Nematoda: Aphelenchoididae) and Its Implications for Plant-Parasitism within This Genus. Zootaxa 2015, 4013, 207–224. [Google Scholar] [CrossRef] [PubMed]
- Sudhaus, W.; Fitch, D. Comparative Studies on the Phylogeny and Systematics of the Rhabditidae (Nematoda). J. Nematol. 2001, 33, 1–70. [Google Scholar] [PubMed]
- Castillo, P.; Vovlas, N. Pratylenchus (Nematoda: Pratylenchidae): Diagnosis, Biology Pathogenicity and Management; Brill Academic Publishers: Leiden, The Netherlands, 2007; ISBN 978-90-04-15564-0. [Google Scholar]
- Clavero-Camacho, I.; Cantalapiedra-Navarrete, C.; Archidona-Yuste, A.; Castillo, P.; Palomares-Rius, J.E. Distribution, Ecological Factors, Molecular Diversity, and Specific PCR for Major Species of Pin Nematodes (Paratylenchus Spp.) in Prunus Plantations in Spain. Plant Dis. 2022, 106, 2711–2721. [Google Scholar] [CrossRef] [PubMed]
- Crow, R.V.; Macdonald, D.H. Phytoparasitic Nematodes Adjacent to Established Strawberry Plantations. J. Nematol. 1978, 10, 204–207. [Google Scholar] [PubMed]
- Abd-Elgawad, M.M.M. Plant-Parasitic Nematodes of Strawberry in Egypt: A Review. Bull. Natl. Res. Cent. 2019, 43, 7. [Google Scholar] [CrossRef]
- Askary, T.H.; Banday, S.A.; Iqbal, U.; Khan, A.A.; Mir, M.M.; Waliullah, M.I.S. Plant Parasitic Nematode Diversity in Pome, Stone and Nut Fruits. In Agroecology and Strategies for Climate Change; Lichtfouse, E., Ed.; Sustainable Agriculture Reviews; Springer: Dordrecht, The Netherlands, 2012; pp. 237–268. ISBN 978-94-007-1905-7. [Google Scholar]
- McCuiston, J.L.; Hudson, L.C.; Subbotin, S.A.; Davis, E.L.; Warfield, C.Y. Conventional and PCR Detection of Aphelenchoides Fragariae in Diverse Ornamental Host Plant Species. J. Nematol. 2007, 39, 343–355. [Google Scholar] [PubMed]
- Handoo, Z.; Kantor, M.; Carta, L. Taxonomy and Identification of Principal Foliar Nematode Species (Aphelenchoides and Litylenchus). Plants 2020, 9, 1490. [Google Scholar] [CrossRef] [PubMed]
- Nickle, W.R. A Taxonomic Review of the Genera of the Aphelenchoidea (Fuchs, 1937) Thorne, 1949 (Nematoda: Tylenchida). J. Nematol. 1970, 2, 375–392. [Google Scholar] [PubMed]
- Nickle, W.R.; Hooper, D.J. The Aphelenchina: Bud, Leaf, and Insect Nematodes. In Manual of Agricultural Nematology; CRC Press: Boca Raton, FL, USA, 1991; ISBN 978-1-00-306657-6. [Google Scholar]
- Treonis, A.M.; Unangst, S.K.; Kepler, R.M.; Buyer, J.S.; Cavigelli, M.A.; Mirsky, S.B.; Maul, J.E. Characterization of Soil Nematode Communities in Three Cropping Systems through Morphological and DNA Metabarcoding Approaches. Sci. Rep. 2018, 8, 2004. [Google Scholar] [CrossRef] [PubMed]
- Berkelmans, R.; Ferris, H.; Tenuta, M.; van Bruggen, A.H.C. Effects of Long-Term Crop Management on Nematode Trophic Levels Other than Plant Feeders Disappear after 1 Year of Disruptive Soil Management. Appl. Soil Ecol. 2003, 23, 223–235. [Google Scholar] [CrossRef]
- Siebert, J.; Ciobanu, M.; Schädler, M.; Eisenhauer, N. Climate Change and Land Use Induce Functional Shifts in Soil Nematode Communities. Oecologia 2020, 192, 281–294. [Google Scholar] [CrossRef] [PubMed]
- Matveeva, E.M.; Sushchuk, A.A. Features of Soil Nematode Communities in Various Types of Natural Biocenoses: Effectiveness of Assessment Parameters. Biol. Bull. Russ. Acad. Sci. 2016, 43, 474–482. [Google Scholar] [CrossRef]
- El-Saadony, M.T.; Abuljadayel, D.A.; Shafi, M.E.; Albaqami, N.M.; Desoky, E.-S.M.; El-Tahan, A.M.; Mesiha, P.K.; Elnahal, A.S.M.; Almakas, A.; Taha, A.E.; et al. Control of Foliar Phytoparasitic Nematodes through Sustainable Natural Materials: Current Progress and Challenges. Saudi J. Biol. Sci. 2021, 28, 7314–7326. [Google Scholar] [CrossRef] [PubMed]
- Ikoyi, I.; Grange, G.; Finn, J.A.; Brennan, F.P. Plant Diversity Enhanced Nematode-Based Soil Quality Indices and Changed Soil Nematode Community Structure in Intensively-Managed Agricultural Grasslands. Eur. J. Soil Biol. 2023, 118, 103542. [Google Scholar] [CrossRef]
- Nisa, R.U.; Tantray, A.Y.; Kouser, N.; Allie, K.A.; Wani, S.M.; Alamri, S.A.; Alyemeni, M.N.; Wijaya, L.; Shah, A.A. Influence of Ecological and Edaphic Factors on Biodiversity of Soil Nematodes. Saudi J. Biol. Sci. 2021, 28, 3049–3059. [Google Scholar] [CrossRef] [PubMed]
- Wright, C.J.; Coleman, D.C. Cross-Site Comparison of Soil Microbial Biomass, Soil Nutrient Status, and Nematode Trophic Groups. Pedobiologia 2000, 44, 2–23. [Google Scholar] [CrossRef]
- Hu, C.; Qi, Y. Abundance and diversity of soil nematodes as influenced by different types of organic manure. Helminthologia 2010, 47, 58–66. [Google Scholar] [CrossRef]
- Richardson, A.E.; Simpson, R.J. Soil Microorganisms Mediating Phosphorus Availability Update on Microbial Phosphorus. Plant Physiol. 2011, 156, 989–996. [Google Scholar] [CrossRef] [PubMed]
Disclaimer/Publisher’s Note: The statements, opinions and data contained in all publications are solely those of the individual author(s) and contributor(s) and not of MDPI and/or the editor(s). MDPI and/or the editor(s) disclaim responsibility for any injury to people or property resulting from any ideas, methods, instructions or products referred to in the content. |
© 2025 by the authors. Licensee MDPI, Basel, Switzerland. This article is an open access article distributed under the terms and conditions of the Creative Commons Attribution (CC BY) license (https://creativecommons.org/licenses/by/4.0/).