Article

Simulating Soil Carbon Under Variable Nitrogen Application, Planting, and Residue Management

by
Tajamul Hussain
1,*,
Charassri Nualsri
1,
Muhammad Fraz Ali
2 and
Saowapa Duangpan
1,3
1
Agricultural Innovation and Management Division, Faculty of Natural Resources, Prince of Songkla University, Songkhla 90112, Thailand
2
College of Agronomy, Northwest A&F University, Yangling 712100, China
3
Oil Palm Agronomical Research Center, Faculty of Natural Resources, Prince of Songkla University, Songkhla 90110, Thailand
*
Author to whom correspondence should be addressed.
Soil Syst. 2025, 9(3), 104; https://doi.org/10.3390/soilsystems9030104
Submission received: 26 July 2025 / Revised: 8 September 2025 / Accepted: 16 September 2025 / Published: 19 September 2025

Abstract

Effective residue management is crucial for maintaining soil organic carbon (SOC) in upland rice systems, particularly under diverse fertilization and planting management practices. This study investigates the impacts of residue management in upland rice fields using the CQESTR model through simulation of SOC dynamics over a 20-year period. The first 10 years served as a spin-up period for carbon pool stabilization in the model, followed by simulations under varying nitrogen (N) application rates and planting date management strategies. Experiments for various N application rates and planting times were conducted during 2018–2019 and 2019–2020. In 2019, 30% and in 2020, 100% of the residue was returned, and these data were used for evaluating model performance. Subsequently, we modeled predictions for residue retention levels of 100%, 70%, 50%, and 30% to assess their effects on SOC. The results indicated a good agreement between the simulated and observed data for model performance evaluation with an MSD value of 9.13. Lack of correlation (0.44) accounted for 5% of MSD, indicating a good agreement between the simulated and observed SOC values. The highest change in SOC was observed at 100% residue return under moderately delayed planting, potentially due to higher crop productivity and residue retention, and moderate climatic conditions. Reduced residue retention gradually declined the SOC stocks, especially under low N input. Delays in planting exacerbated negative impacts, possibly due to low crop productivity and reduced residue return. Despite the limited number of years of data and inconsistent management practices, the overall trends highlight the importance of residue retention under different N fertilization and planting management strategies. This research serves as a preliminary study for sustainable management practices to enhance long-term soil carbon sequestration in upland rice systems in southern Thailand. Long-term evaluations are necessary using the observed data and the CQESTR model application for applicable recommendations.

1. Introduction

Rice is an important cereal, and a major contributor to food security worldwide [1]. Thailand is ranked as the sixth-largest rice-producing country, where upland rice is commonly cultivated by small-land owners. Upland rice is cultivated in the northern and southern parts of Thailand, and it is grown in the rainy season in southern Thailand [2] that lasts from May to October. In general, upland rice is cultivated on foothill plains and slopy and steep areas in Thailand. Low production potential and continuous land use change are major factors for the limited research and a lack of scientific evidence on optimal management strategies for upland rice production. Among the other crop and soil management strategies, fertilizer management and planting period are the easiest options to adjust for rice farmers. However, the limited and obsolete data and information used by farmers contribute to applying a range of nitrogen (N) fertilization under wide planting periods. As N fertilization is critical in rice production, a diverse range of 10–90 kg N ha−1 application rates has been observed in southern Thailand [3,4,5]. Planting windows impact rice productivity as climatic conditions are highly variable over time [6]. Rainfall is a critical factor in southern Thailand that varies over different planting periods, thus influencing rice production by drought intervals in early planting or by higher runoff losses during rainy seasons. In fact, inappropriate management practices then contribute to yield losses and high nutrient losses in rice fields.
Approximately 11–12 million hectares of area constituted rice production during 2017–2021 [7]. Considering the residue to product ratio of 0.81, the country generates 25–27 million tons of dry rice straw annually [8]. Thailand, being a world leader, faces several challenges in managing rice straw during the harvest season. In addition to usage in different industries, rice straw is openly burnt at a large scale or used for household purposes by small landholders, leading to greenhouse gas emissions and environmental concerns, or reduced residue return to soils, impacting soil health, respectively. Agriculture in Thailand is considered as second largest source of greenhouse gas emissions [9]. Conversion of rice straw into biomass energy has been promoted by the Thai government [10]. This provides the opportunity for growers to generate additional income and reduce emissions. However, in the long run, complete removal of rice residue may impact upland soils negatively. Conversely, rice residue retention can benefit the marginal upland soils, improve soil health, and help reduce the fertilizer input. Application of crop residues has been practiced, enhancing soil organic carbon [11]. Optimizing N fertilization in combination with an ideal planting date and sufficient residue return could be an option for sustainable upland rice production. In this regard, a simulation modeling approach could be useful for this evaluation and for estimating soil organic carbon dynamics in uplands.
Statistical techniques, smart farming approaches, and application of simulation models for crop, soil, and environment interactions can be used in determining various management options in rice production [12,13]. According to Jones et al. [14], application of simulation models not only helps in understanding the underlying mechanisms of processes but also aids in research and evaluation budgets. Soil carbon models have been used to predict the impact of agricultural practices on soil organic carbon stock [15]. The CQESTR model, which has the ability to simulate soil organic carbon in five soil horizons, was employed in this study to evaluate soil organic carbon dynamics influenced by different nitrogen fertilization, planting, and residue management practices in uplands. CQESTR does not account for N fertilization rate as a direct input; rather, it utilizes the biomass produced and the N content under different N fertilizations. The model has been successfully used to predict soil organic carbon under different agricultural management practices [16] such as tillage [17], residue management [18], and crop rotations [19] in different regions worldwide. However, the model has not been used to predict soil organic carbon in upland rice systems, particularly with different N fertilization, planting, and residue management practices. Simultaneously, there is no established research reported for soil organic carbon dynamics in upland systems under diverse fertilization and planting management strategies in Southern Thailand.
Due to lack of sufficient research on soil organic carbon dynamics under these management practices in uplands, the authors performed this study to obtain the preliminary scientific evidence. Therefore, the objectives of the study were to (i) gain insights into the impacts of N, planting, and residue management practices on soil organic carbon and (ii) evaluate the performance of CQESTR under different N fertilization, planting, and residue management strategies for its potential application in future research. The findings of the study will be helpful in understanding the impact of various management practices and allow researchers and policy makers to use CQESTR in assessing soil carbon dynamics in upland rice systems.

2. Materials and Methods

2.1. Model Description

The CQESTR is a process-based carbon model developed by USDA-ARS scientists at the Columbia Plateau Conservation Research Center, Oregon, USA. The model was developed to evaluate the effect of various agricultural management practices on soil organic carbon. The model computes the biological decomposition rate of crop residues, such as roots and shoots, and organic amendments on a daily time step with organic residue conversion and addition [20,21]. The CQESTR requires soil data such as texture, drainage class, bulk density, and initial soil organic carbon; crop data such as aboveground crop biomass, its nitrogen content, root biomass, and planting and harvest dates; input of organic amendments; and weather data, including air temperature and precipitation [22]. Irrigation amount can be added to precipitation in the corresponding months. Field operation and crop management practices such as tillage (implements and depths), fertilization, and operation dates are defined in management files of Revised Universal Soil Loss Equation (RUSLE, V1) [23]. Detailed description of CQESTR can be obtained from previously published studies [20,24].

2.2. Experimental Years and Data

The experimental data in this study indicated the experimental duration of 2018–2020, where the crop-, soil-, and treatment-specific information were obtained (Figure 1) when upland rice was grown under different N application rates and planting dates, and residue was returned to soil at 30% and 100% rates in 2019 and 2020, respectively. Field experiments were conducted during 2018–2020 crop years at the experimental field area of the Faculty of Natural Resources, Prince of Songkla University, Thailand (7°00′14.5″ N, 100°30′14.7″ E), during rice growing periods. The climate of Southern Thailand is highly variable, particularly in terms of seasonal and annual rainfall. The mean minimum and maximum temperatures reached 24.8 and 31.5 °C, respectively. Annual average temperature reaches 27.9 °C with an average annual rainfall of 2066.7 mm [25]. The soil is sandy clay loam at 0–30 cm soil depth, whereas the texture is different deeper in the soil profile [4]. Field trials consisted of two major treatments, including N application rates and planting dates. Nitrogen application rates included the 30 (N30), 60 (N60), and 90 (N90) kg N ha−1 urea applied in addition to a non-fertilized control (N0). Rice planting periods were the last weeks of August (early), September (moderately delayed), and October (delayed). However, planting date was affected over the years due to unfavorable climatic conditions (Table S1) [4]. Dawk Pa-yawm, a rice cultivar which is commonly cultivated in upland rice growing areas of Thailand and significantly differs among other cultivars in terms of productivity, was grown in these trials. Before planting, the field was plowed twice, and the soil was completely disturbed due to extensive tillage operations. The treatments were arranged in a randomized complete block design with three experimental repeats. Each experimental unit was designated in an individual plot sized 3 × 3 m2. The recommended basal fertilizer application rate [5] for phosphorus (19 kg P2O5 ha−1) and potassium (13 kg K2O ha−1) was applied equally to all the plots prior to planting. A sprinkler irrigation system was used for supplementary irrigation with 10–15 mm per application at the time of planting and during critical intervals of the crop growing period. Urea (46% N) was used as a source of N fertilizer and was applied in two uniform splits by incorporating the fertilizer at a 5 cm soil depth in the plant rows using a hand-operated mini plow in the experimental plots according to the experimental design at the initiation of the tillering and panicle emergence stages. Weeds were manually removed from plots, and recommended standard practices were performed to control insects, pests, and diseases through suitable chemical applications to reduce yield losses.

2.3. Non-Experimental Years and Data

The non-experimental years in this study indicate the duration of 2016–2017, when rice and other crops, such as corn or legumes, for small plot experiments were grown over different parts of the same field. Carbon data obtained through composite samples from these years were integrated for carbon modeling. The years 2004–2015 and 2021–2023 were also classified as non-experimental years when the same field remained under different management pratices or was used for other small plot experiments. Due to inconsistency in field management, general rice field operations were used for non-experimental years to complete the 10-year CQESTR model files.

2.4. Soil Data

Soil data on soil organic carbon during the experimental years was obtained for 0–30 cm and 30–60 cm soil depths prior to planting and after harvest. Composite soil samples from each treatment were prepared. Soil data on soil organic carbon during non-experimental years (2016–2017) was obtained at 0–30 cm and 30–60 cm soil depths, representing the field soil, as there were no N or planting treatments, and rice experiments were planted under standard management practices. Soil samples were dried, rocks and plant residues were separated, and samples were ground and passed through a 2 mm sieve for analysis of soil organic carbon using Walkley and Black’s method [26].

2.5. Climate Data

Climate data, including monthly average temperature and rainfall, was collected from Kho Hong Agrometeorology–Agricultural Information Center (7°01′06.0″ N, 100°29′52.1″ E), Hat Yai, located 1.8 km from the experimental site. Experimental fields usually receive supplemental irrigation during the crop growing season; therefore, the irrigation amount that was applied during the experimental years was added to specific months.

2.6. Simulation Study

2.6.1. RUSLE and RUSLE Files

The CQESTR model utilizes the C-factor of the Revised Universal Soil Loss Equation (RUSLE) program, and crop rotation files are created or modified in RUSLE. The RUSLE files were created for climate data, residue, root biomass, and field operations. City code refers to the mean monthly temperature and rainfall of an experimental or geographical location. Two city codes were created for each planting date, having 10 years of average data (2004–2013 and 2014–2023). Six weather files were defined as the planting dates occurred over different months, and the irrigation amount differed for each planting window. Irrigation amount was added to rainfall data for each month and planting date (Tables S2 and S3).
Vegetation information, including residue and root biomass, was defined for experimental years (2018–2019, 2019–2020), whereas average residue and root biomass data were used in all non-experimental years. A total of 36 vegetation scenarios were created corresponding to different years and treatment combinations. For example, each N application rate had three individual vegetation scenarios for experimental years 2018–2019 and 2019–2020, and an average data file for non-experimental years. Major operations included tillage, seeding, and harvest on specified dates for each year. Rotary tiller 6″ N was selected as a tillage implement representing the tillage depth, whereas drill was selected as the seeding operation. Following the completion of all the operations, the C-factor was computed for each RUSLE file.

2.6.2. CQESTR Model Operation

Following the completion of the RUSLE files and C-factor computation, the CQESTR program was initialized. Setup was completed, defaults were set, and data files were specified. Soil and other defaults and N contents were adjusted according to the observed data or representative information of the soil. A set of twelve soil records was created representing N application and planting date treatment combinations. Soil properties, i.e., % organic matter, bulk density, texture, and drainage class, were defined for three soil depths (0–30, 30–60, and 60–120 cm). Following the setup for defaults and soil record, the rotation and simulation records were created. A set of 24 rotation records was created, referring to 24 RUSLE files for each treatment combination. A total of twelve simulation records were created for each treatment, and each simulation record consisted of two rotation files.

2.7. Model Application and Performance Evaluation

Following the completion of all the required files, the CQESTR model was run to perform simulations. Iterations were performed by changing tillage depth, specifying tillage implements, and changing % organic matter in soil records until a good fit was achieved. Data was compared for each individual simulation for the specified treatment combinations. Model performance was evaluated using linear regression and mean squared deviation (MSD) [27]. Computation of MSD involved three components, including squared bias (SB), lack of correlation (LC), and a non-unity slope (NU). Soil organic carbon data was converted to Mg ha−1 using information on soil depth, volume of soil, and bulk density.
Simulation scenarios were then created for 100, 70, 50, and 30% residue return for each treatment combination to predict the impact of residue return on soil organic carbon in upland systems. RUSLE files, soil, rotation, and simulation records were created separately for each simulation scenario following the process mentioned above.

3. Results and Discussion

3.1. Crop Residue and Root Biomass

Crop biomass was affected under different N fertilization and planting management practices. An increase in N input increased the biomass yields, whereas delayed planting resulted in lower biomass yields. The detailed agronomic performance of upland rice under applied treatments and its related dynamics are available in our previously published study [28]. During the experimental years, crop biomass was returned to the field at 30% and 100% rates at harvest in 2019 and 2020, respectively. The 30% and 100% residue rates were computed from the observed straw biomass from each treatment and were returned to the respective plots. Root biomass was computed from the root-to-shoot ratio of 25%, meaning that total crop biomass was multiplied by 0.25 to obtain root biomass. The resulting residue and root biomass data from the experimental years utilized in this study are presented in Table 1. These data indicate that low residue returns to the plots under lower N input as well as delayed planting date (Table 1). Average data on residue and root biomass from experimental years were used to represent the data for non-experimental years.

3.2. CQESTR Model Performance

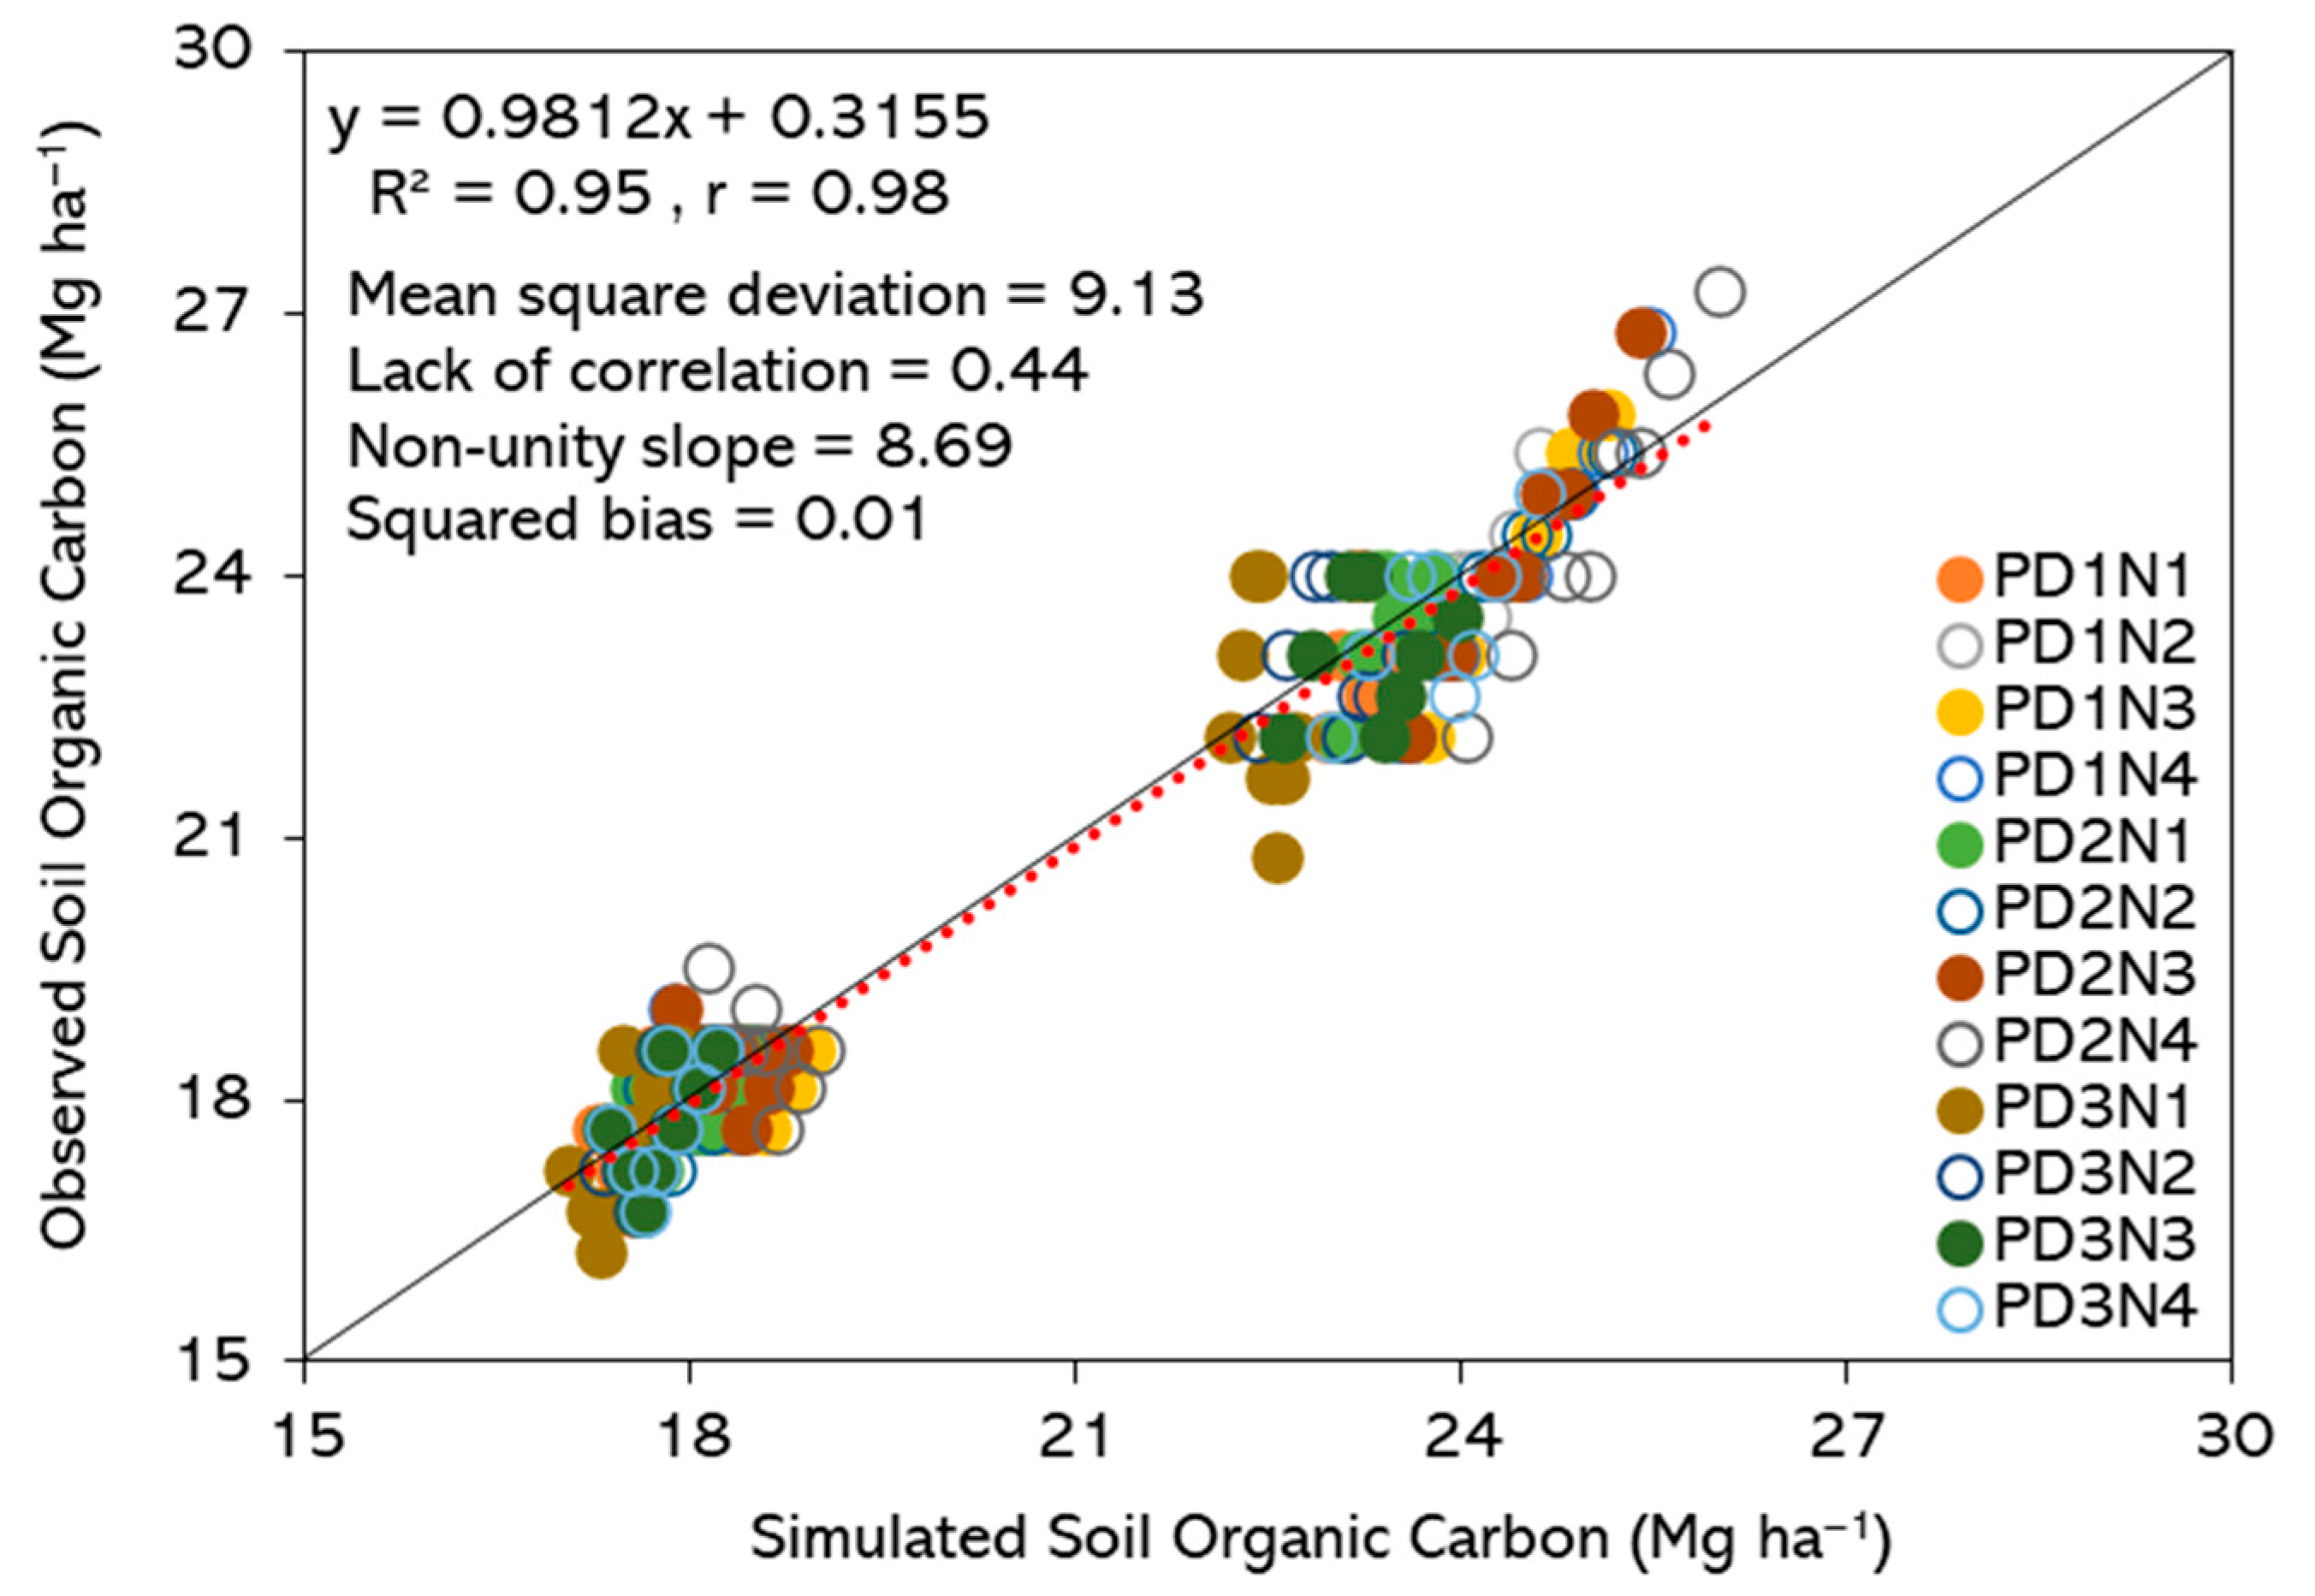
The simulation results indicated a higher sensitivity of soil organic carbon (SOC) to changes in % organic matter inputs to soil layers compared to tillage depth during adjustment of parameters. The simulation results for all twelve treatment combinations resulted in high correlation (r = 0.98, Y = 0.9812X + 0.3155) and an MSD value of 9.13 (Figure 2). Lack of correlation (0.44) accounted for 5% of MSD, indicating a good agreement between the simulated and observed SOC values. It should be noted that the first four observed data points were the same for all the treatments, as there were no N application and planting date treatments during non-experimental years (Figure 2, Figure 3, Figure 4, Figure 5, Figure 6, Figure 7 and Figure 8). Squared bias of 0.01 accounted for smaller variations (<1%) in the non-unity slope of 8.69, indicating that the regression line is approaching a 1:1 line (Figure 2). In general, CQESTR under-estimated the SOC under early and moderately delayed planting dates, whereas it over-estimated the SOC under delayed planting dates. In real-time field conditions, upland rice under early and moderately delayed planting confronted higher rainfall. Temperatures were higher, and rainfall and total water input were lower in delayed planting. Climatic conditions thus influenced rice biomass productivity and ultimately the residue return. Variations in residue return and climatic factors in CQESTR simulations possibly influenced prediction trends. Over- and under-estimation in SOC by CQESTR might be attributed to the overall changes in SOC under different agro-climatic conditions. With respect to field management and maximizing SOC in upland systems, optimal planting management might be a practical strategy.

3.3. Effect of Nitrogen Application, Planting Date, and Residue Return

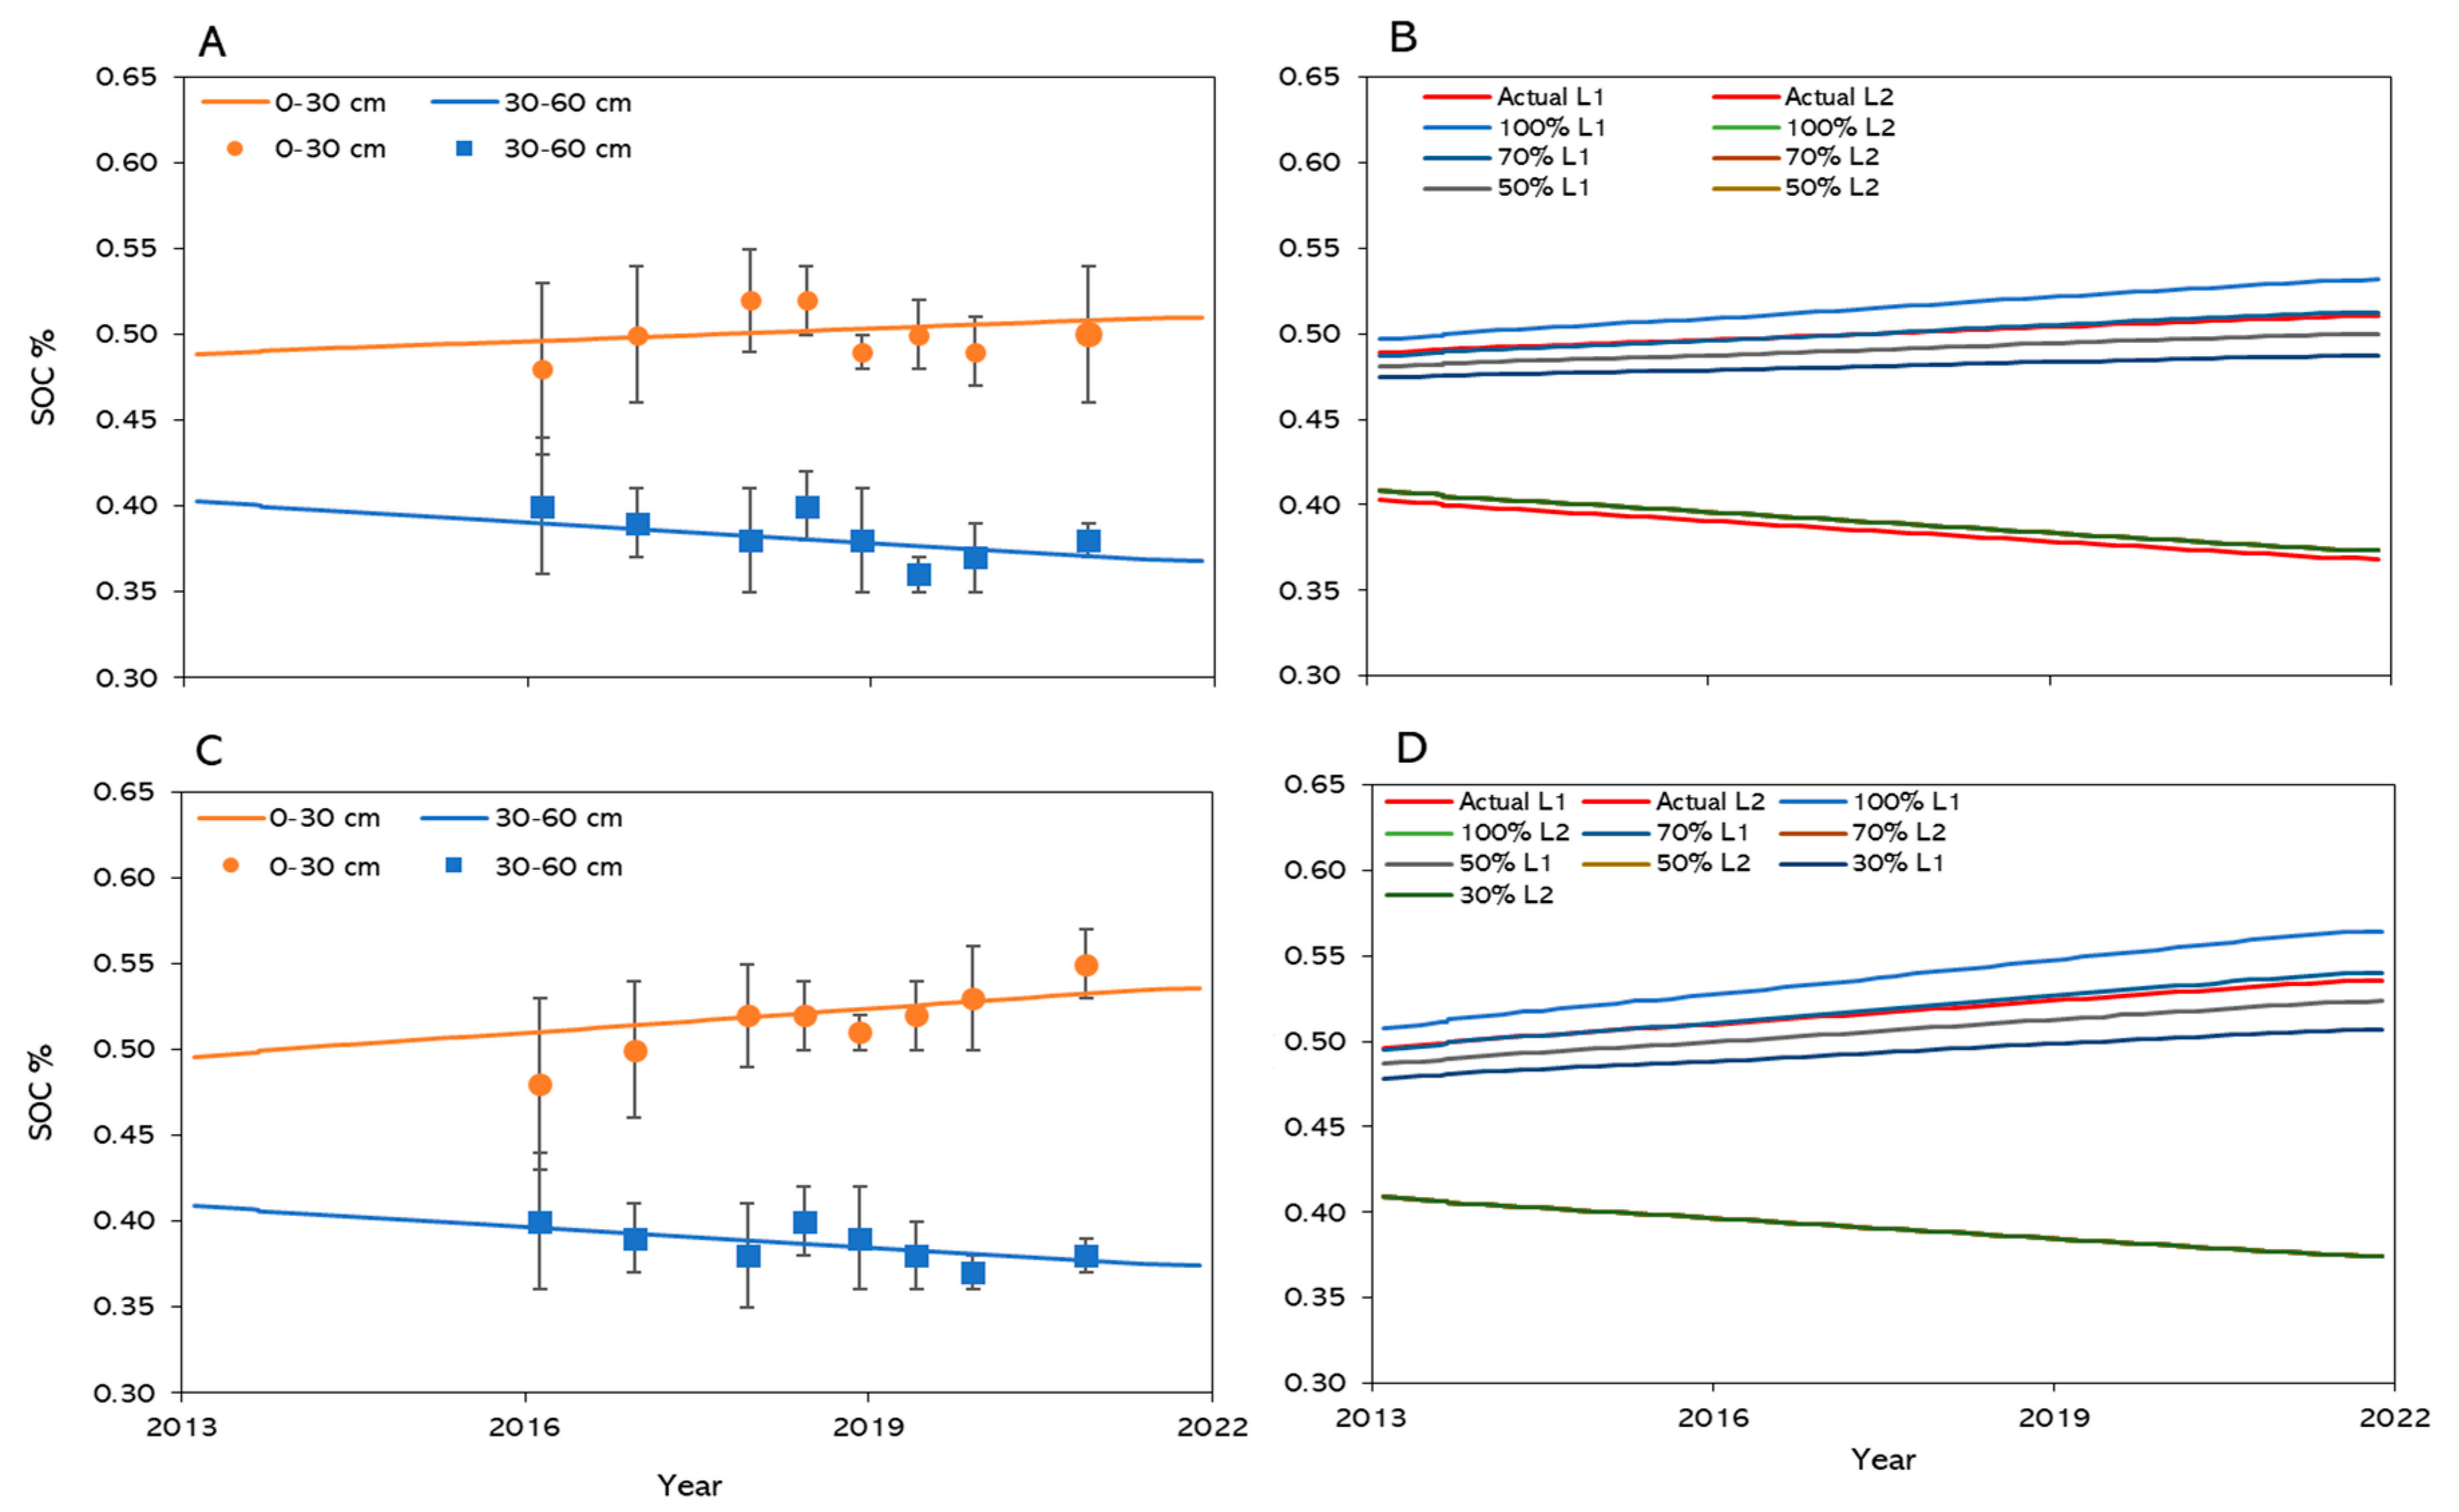
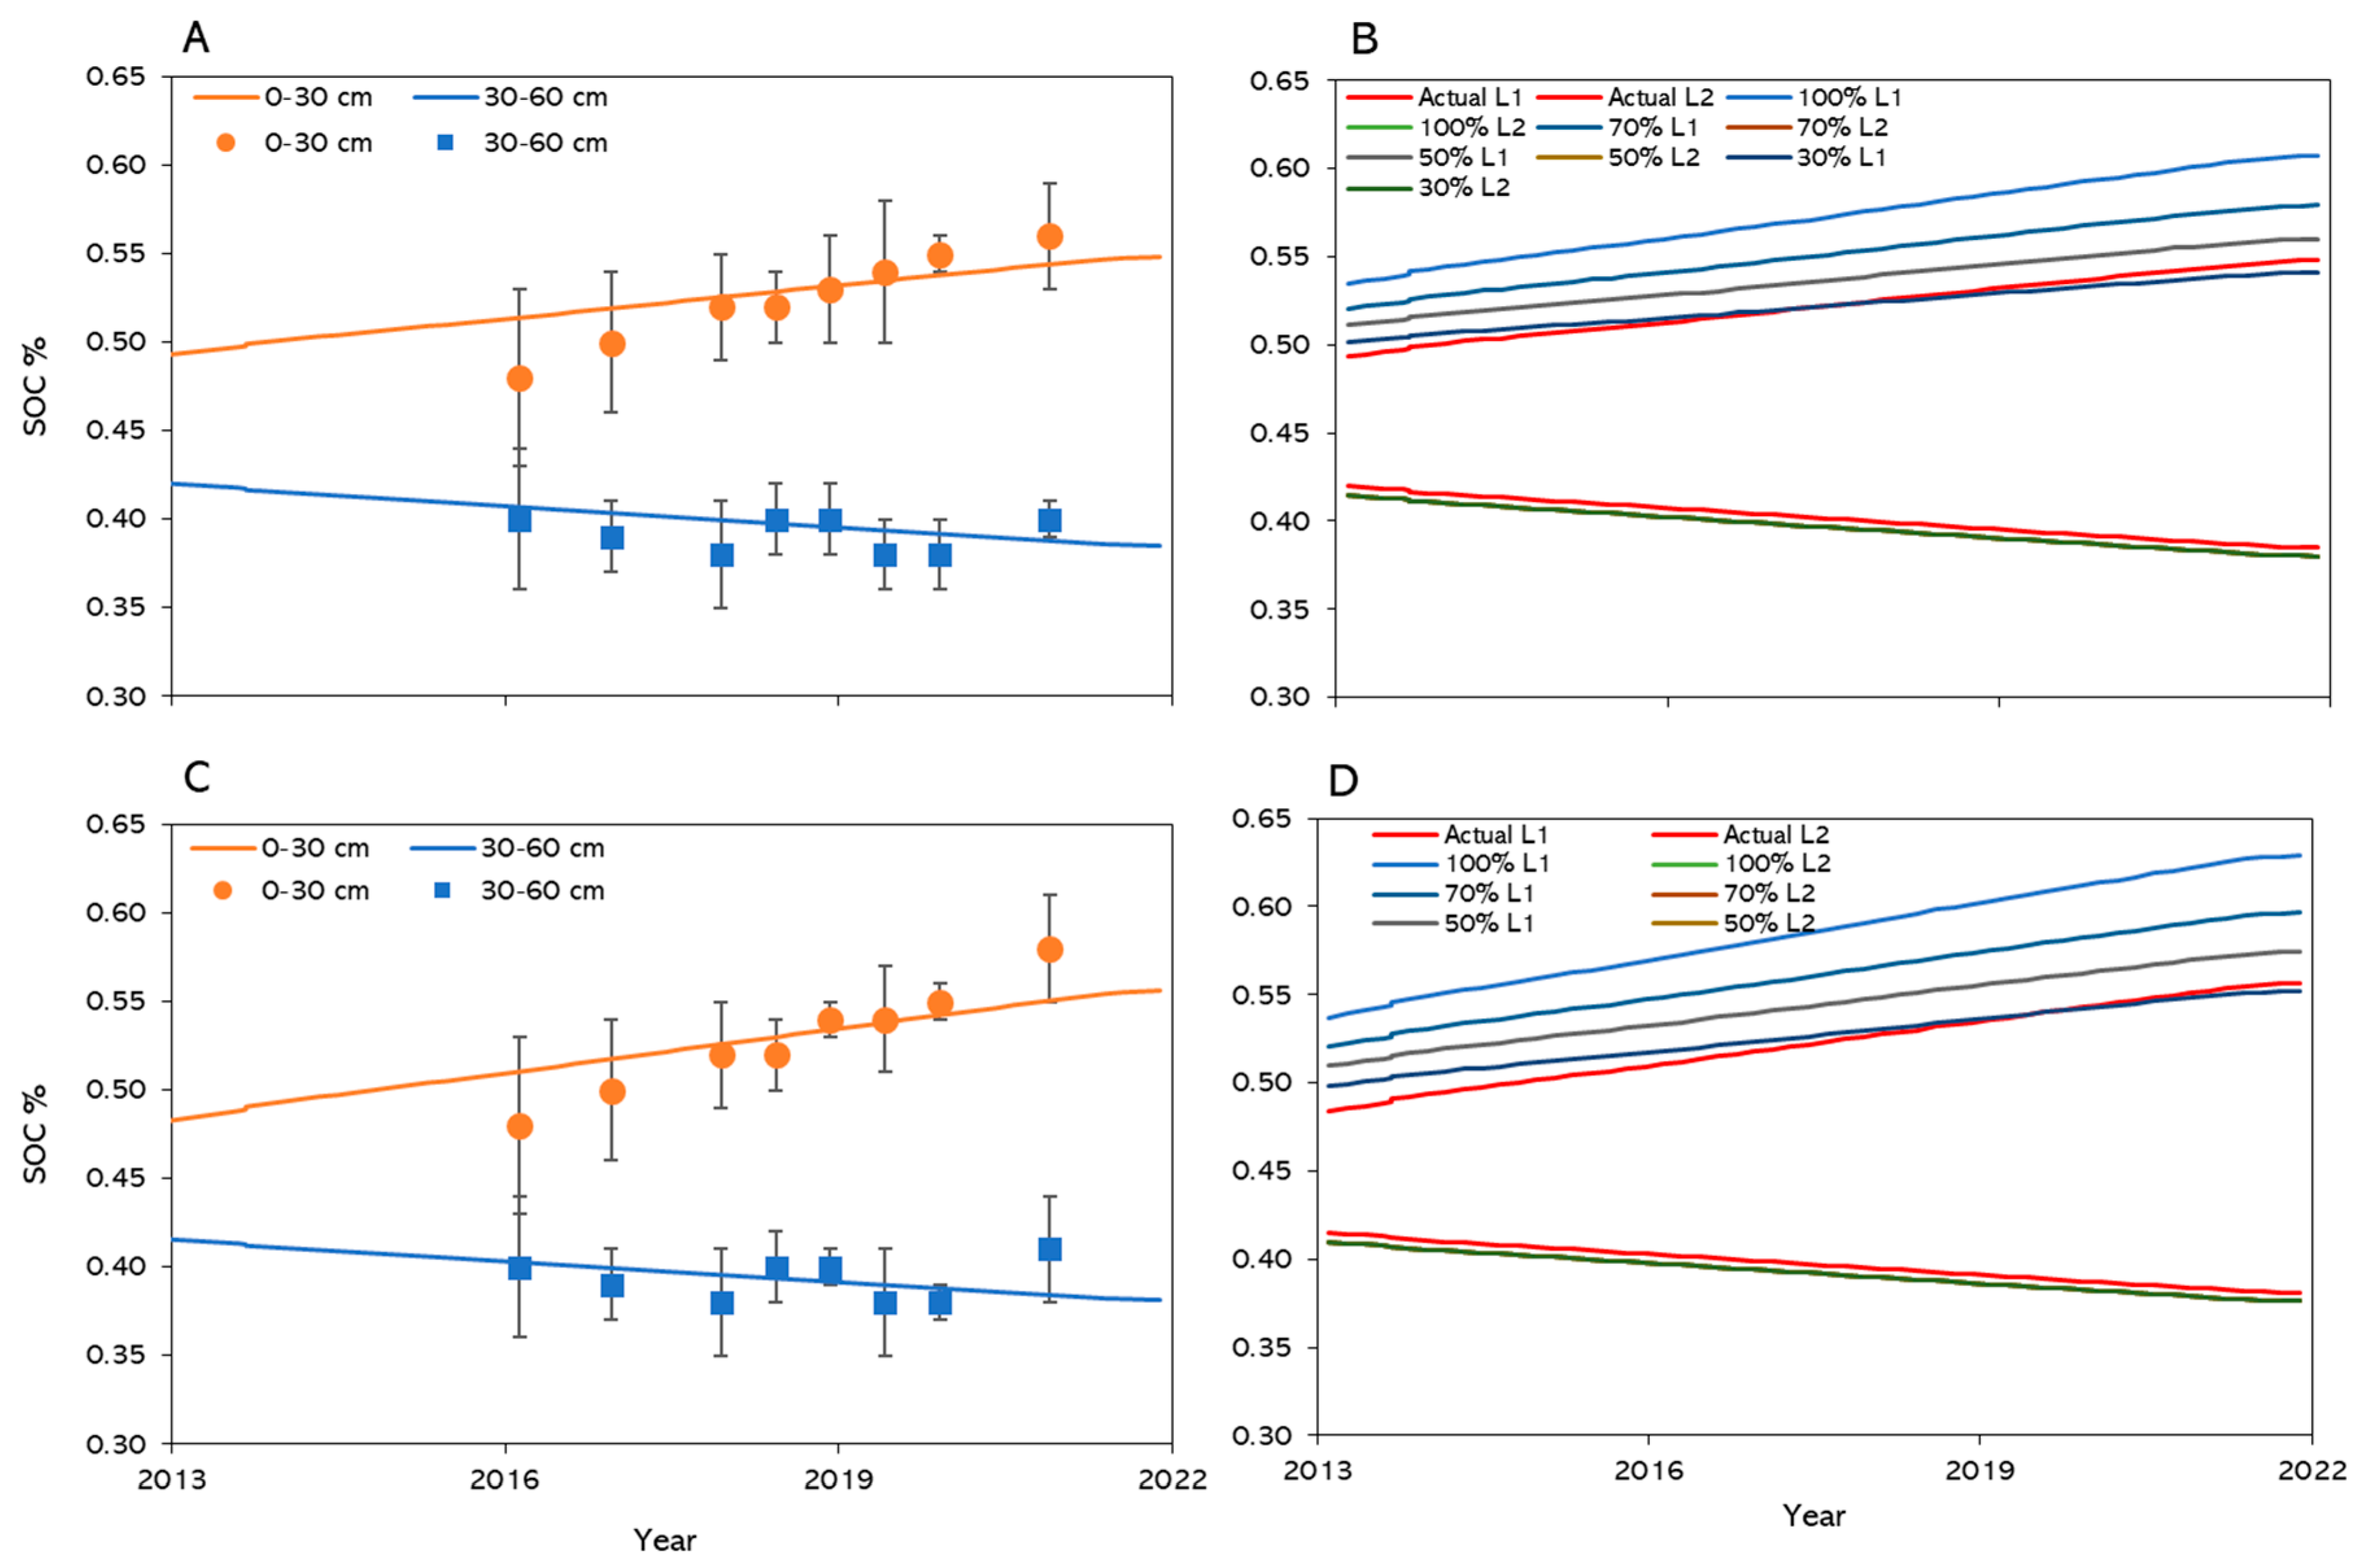
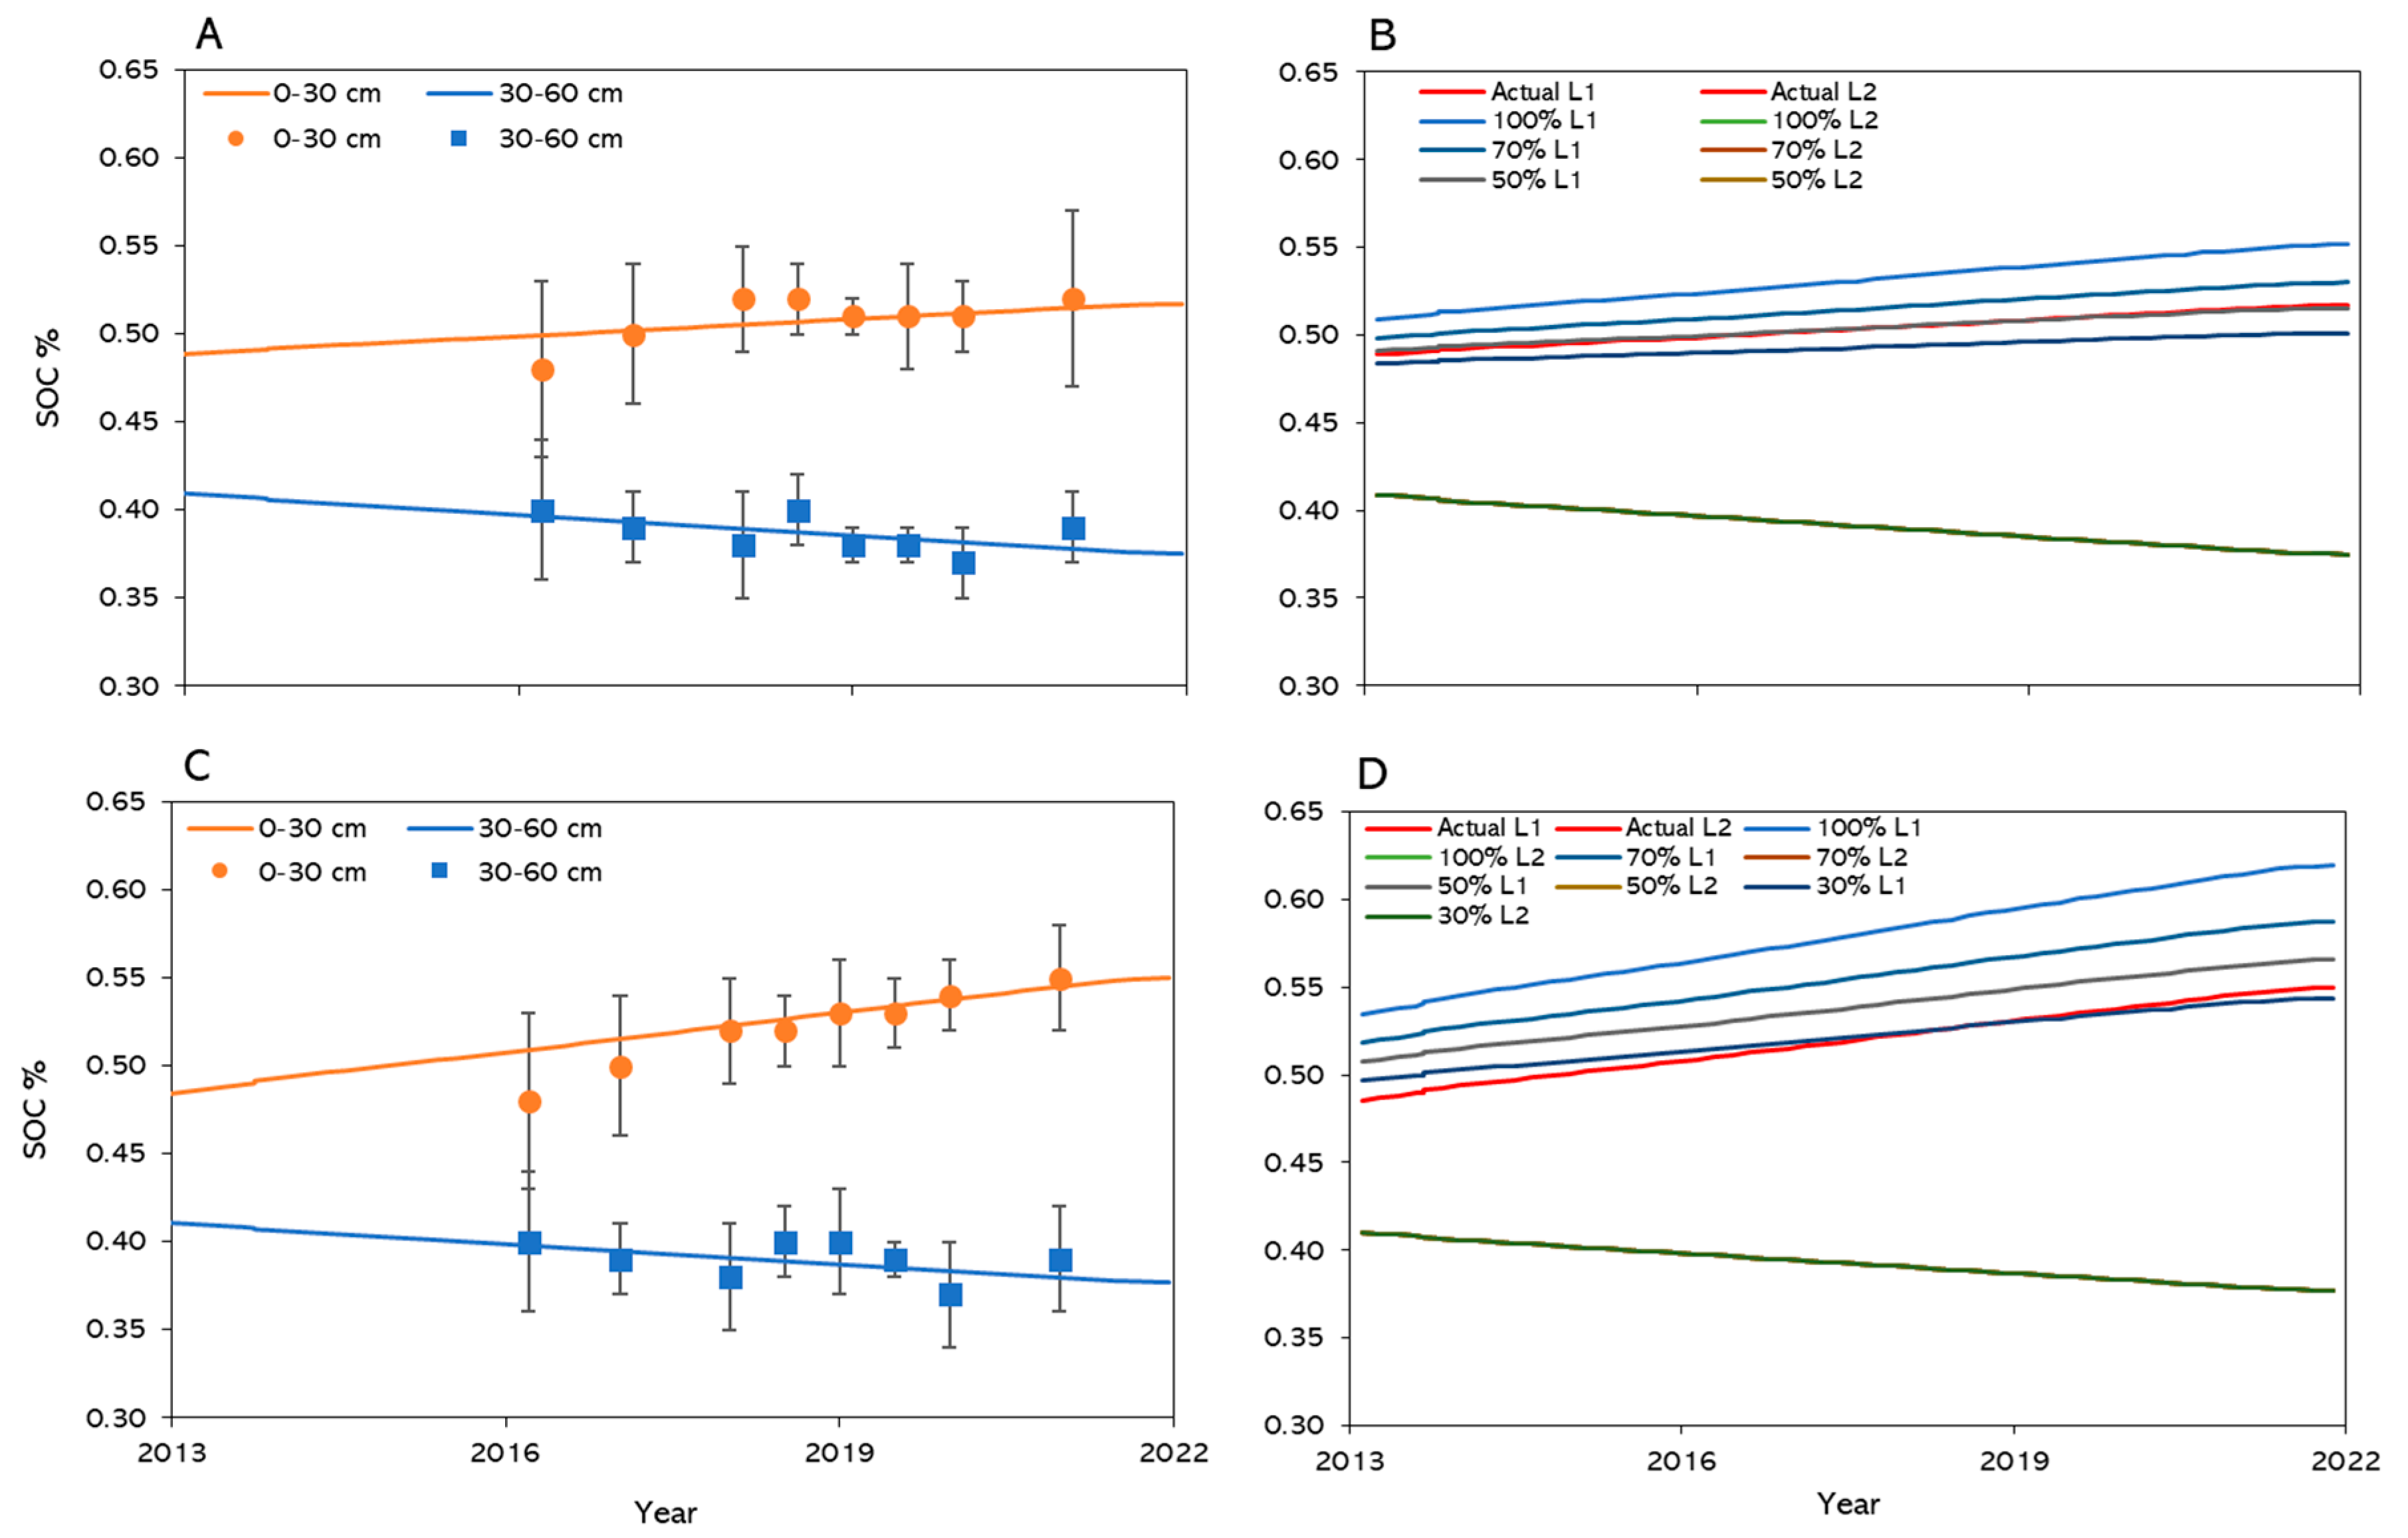
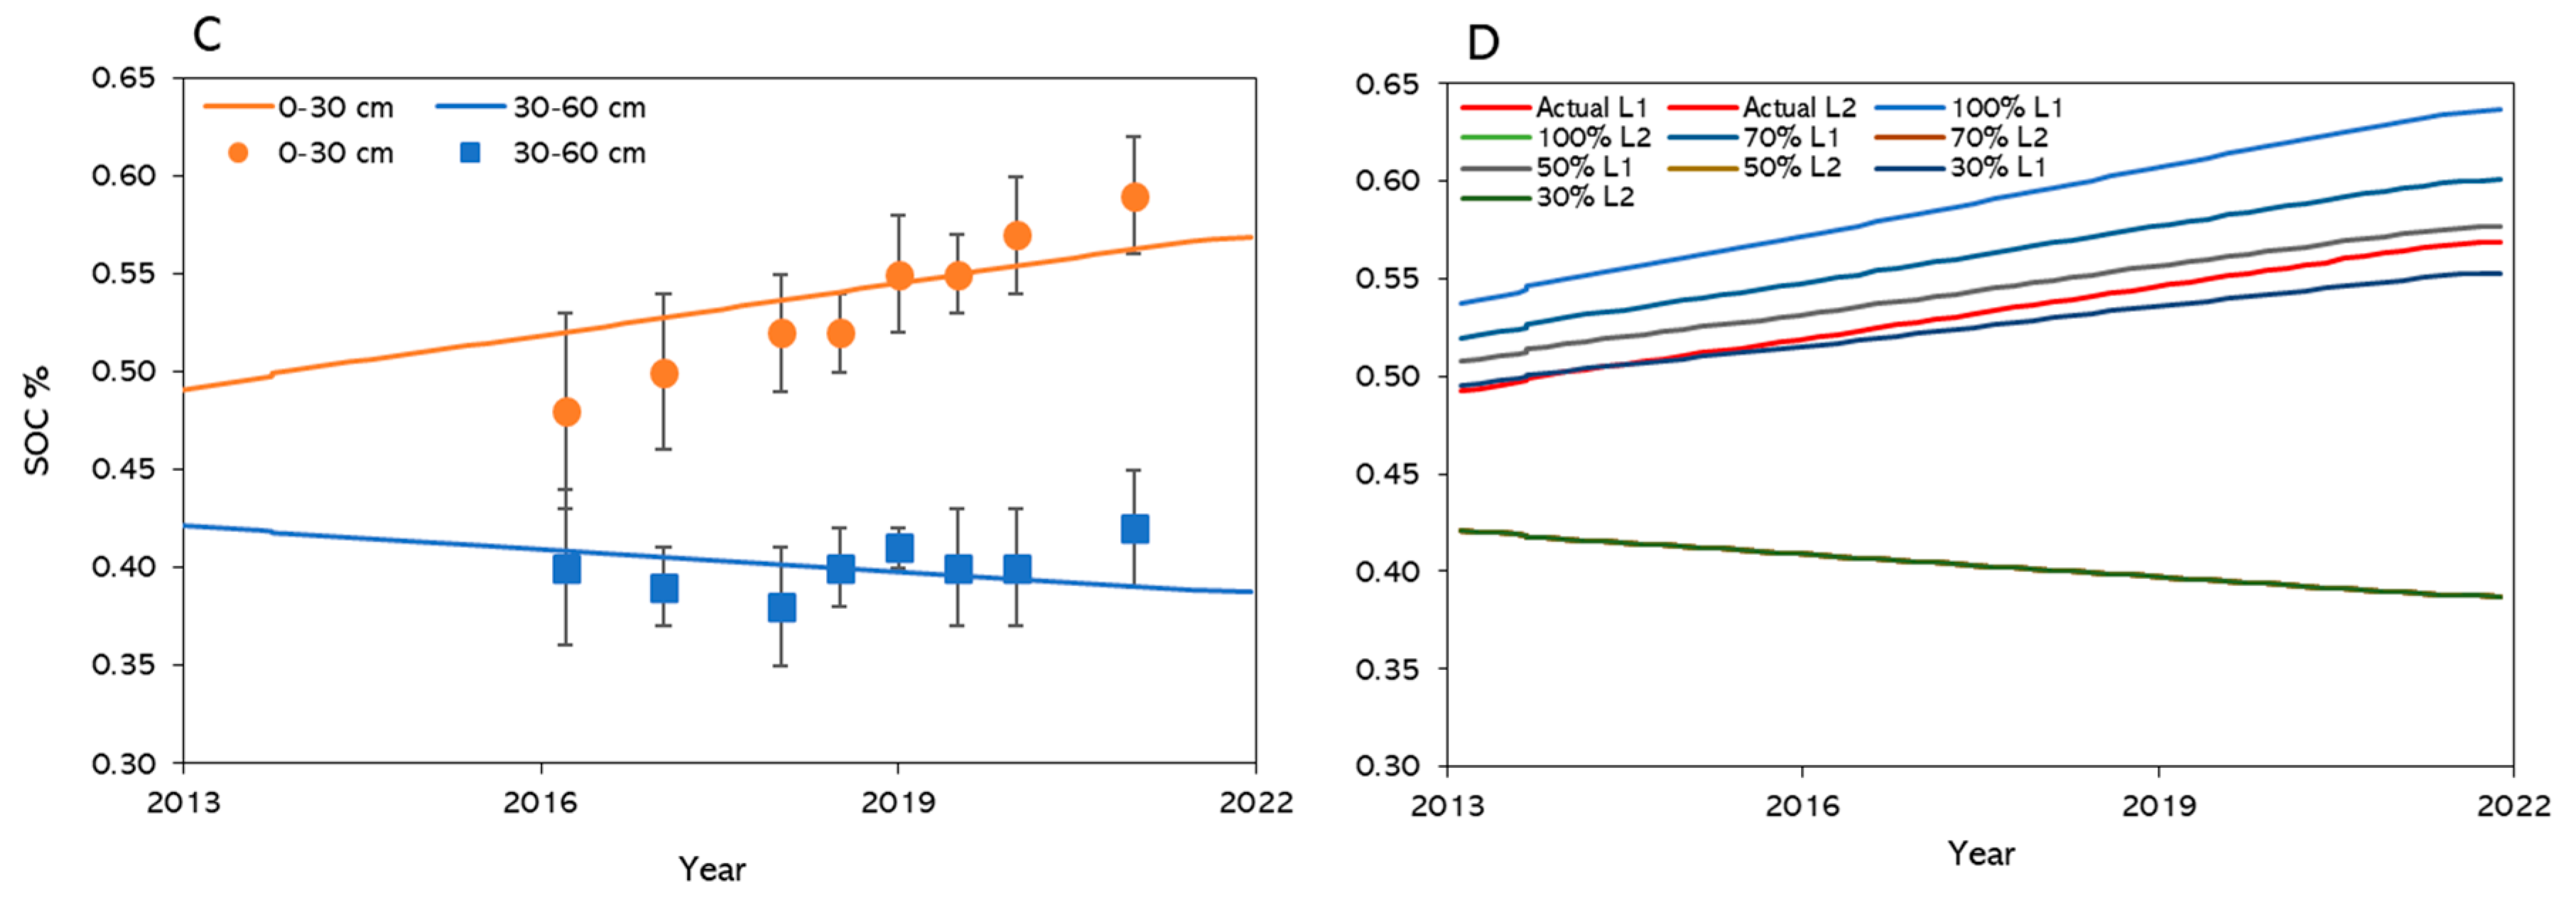
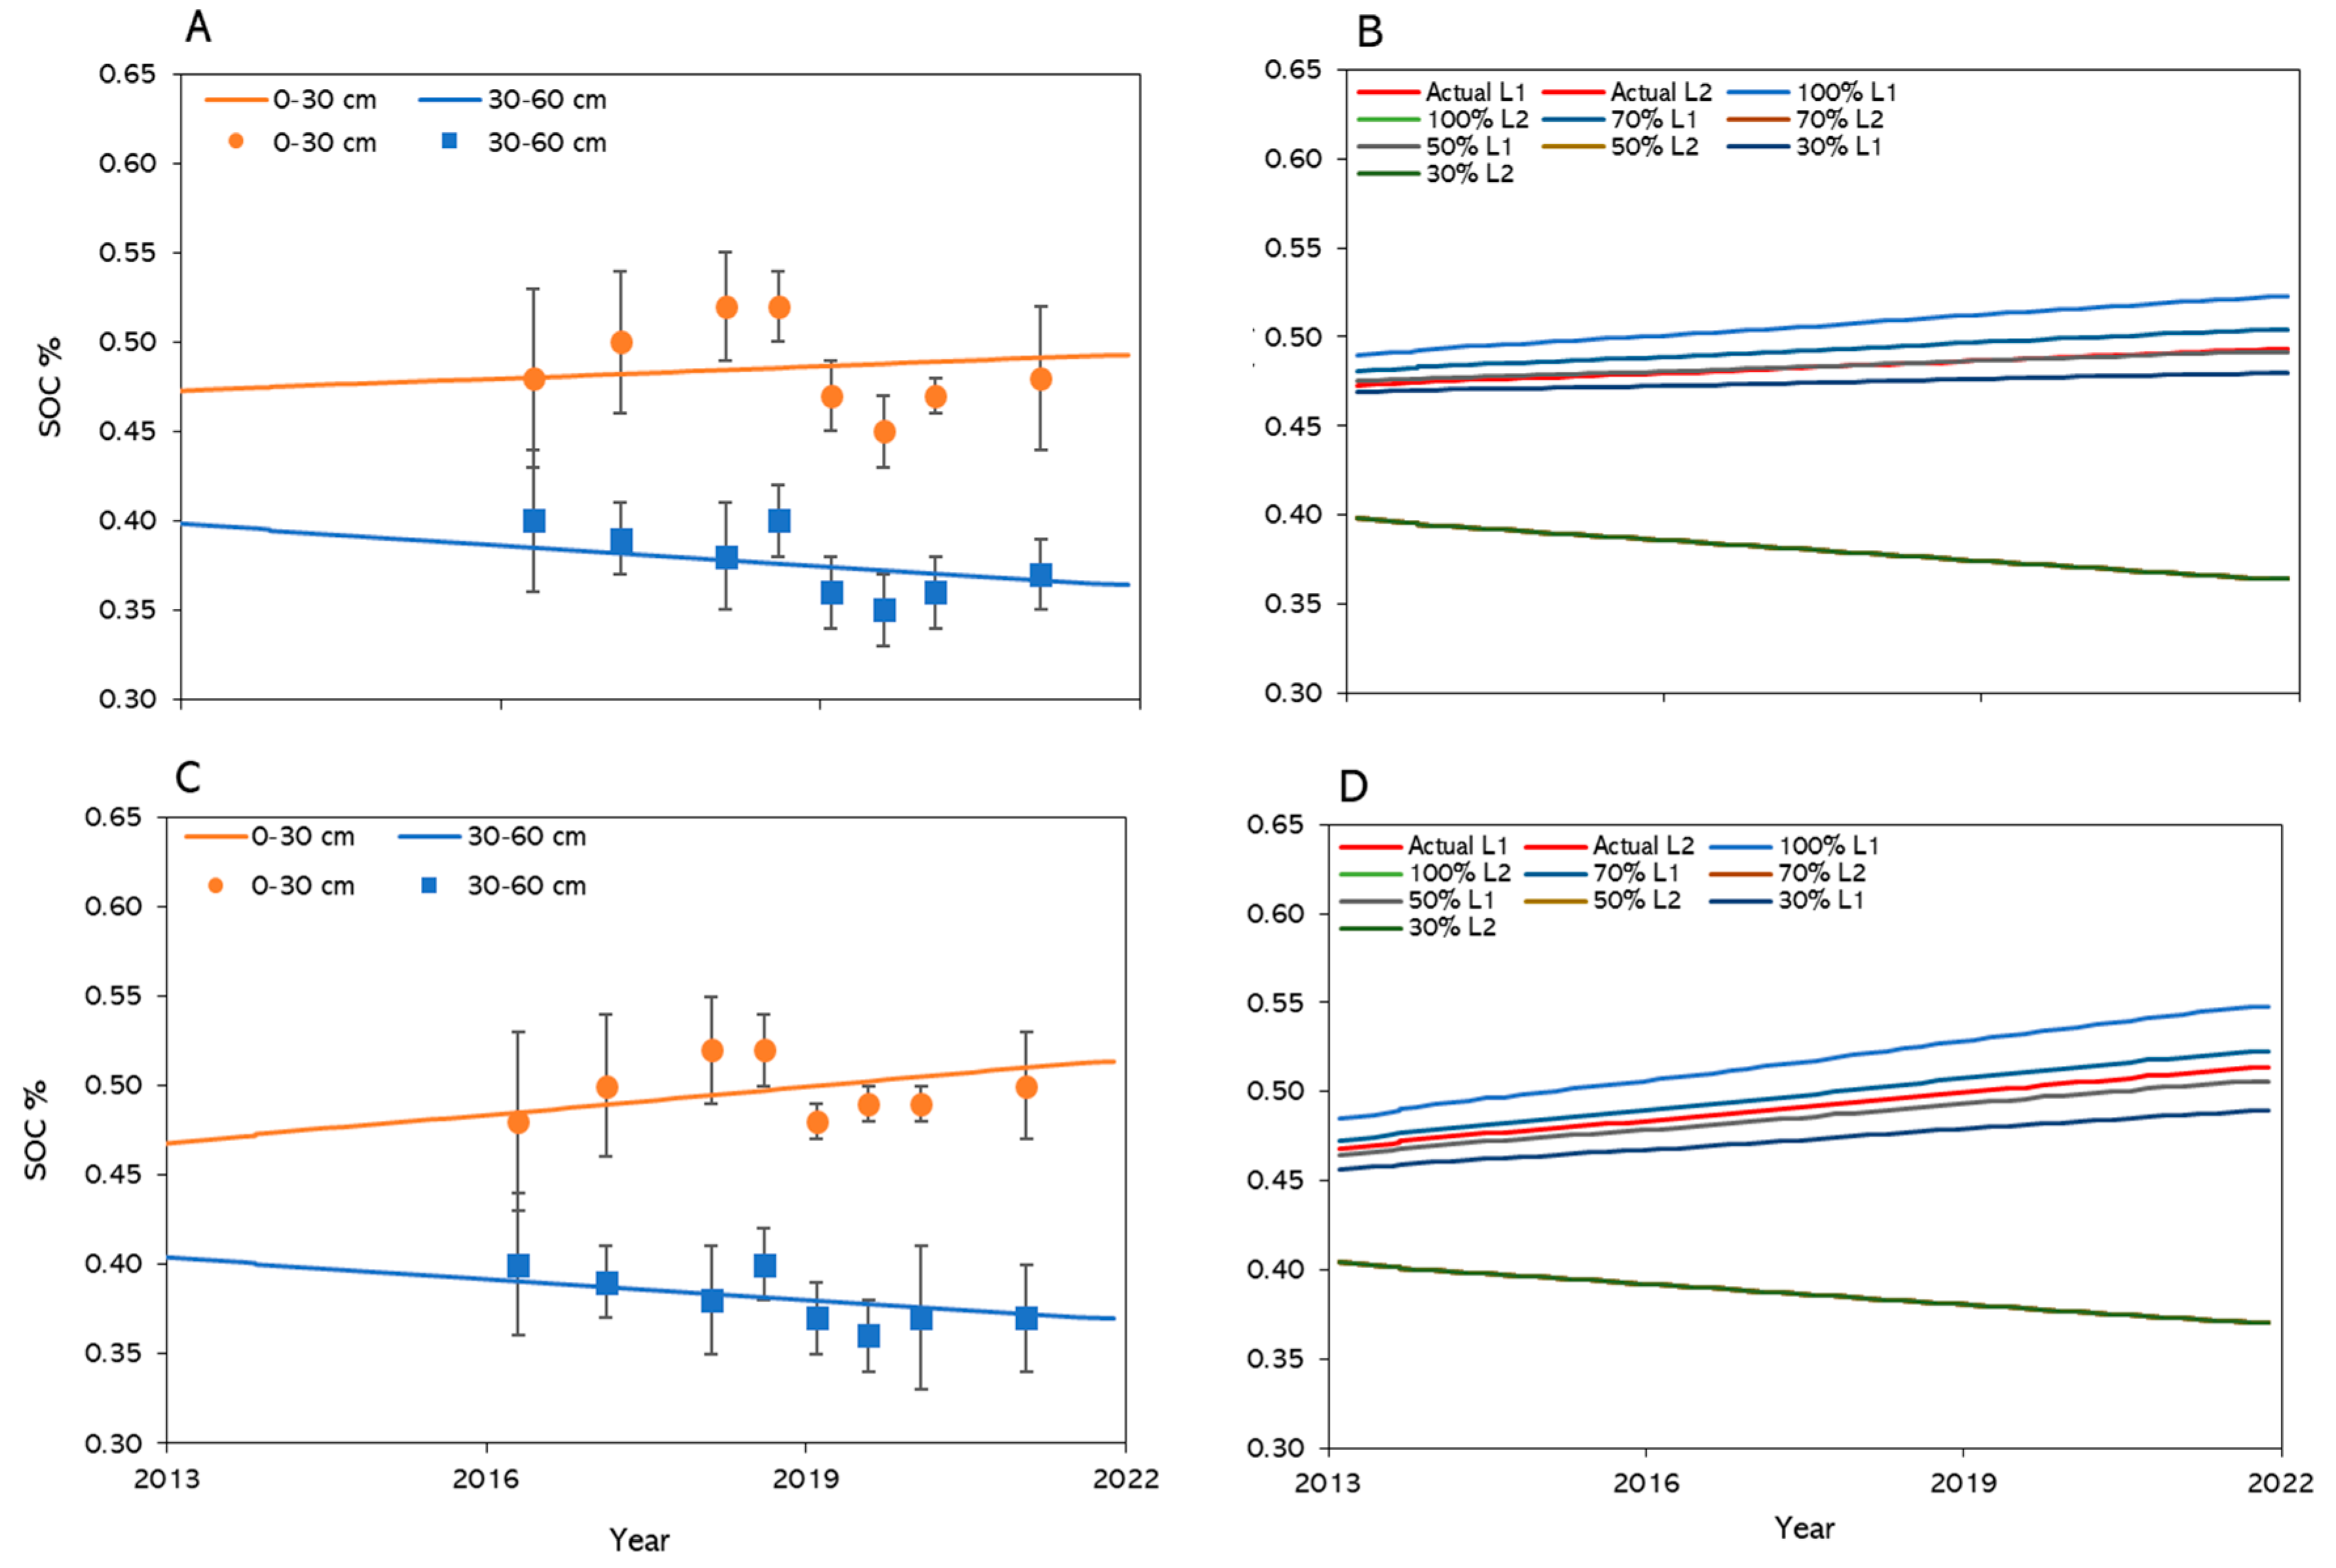
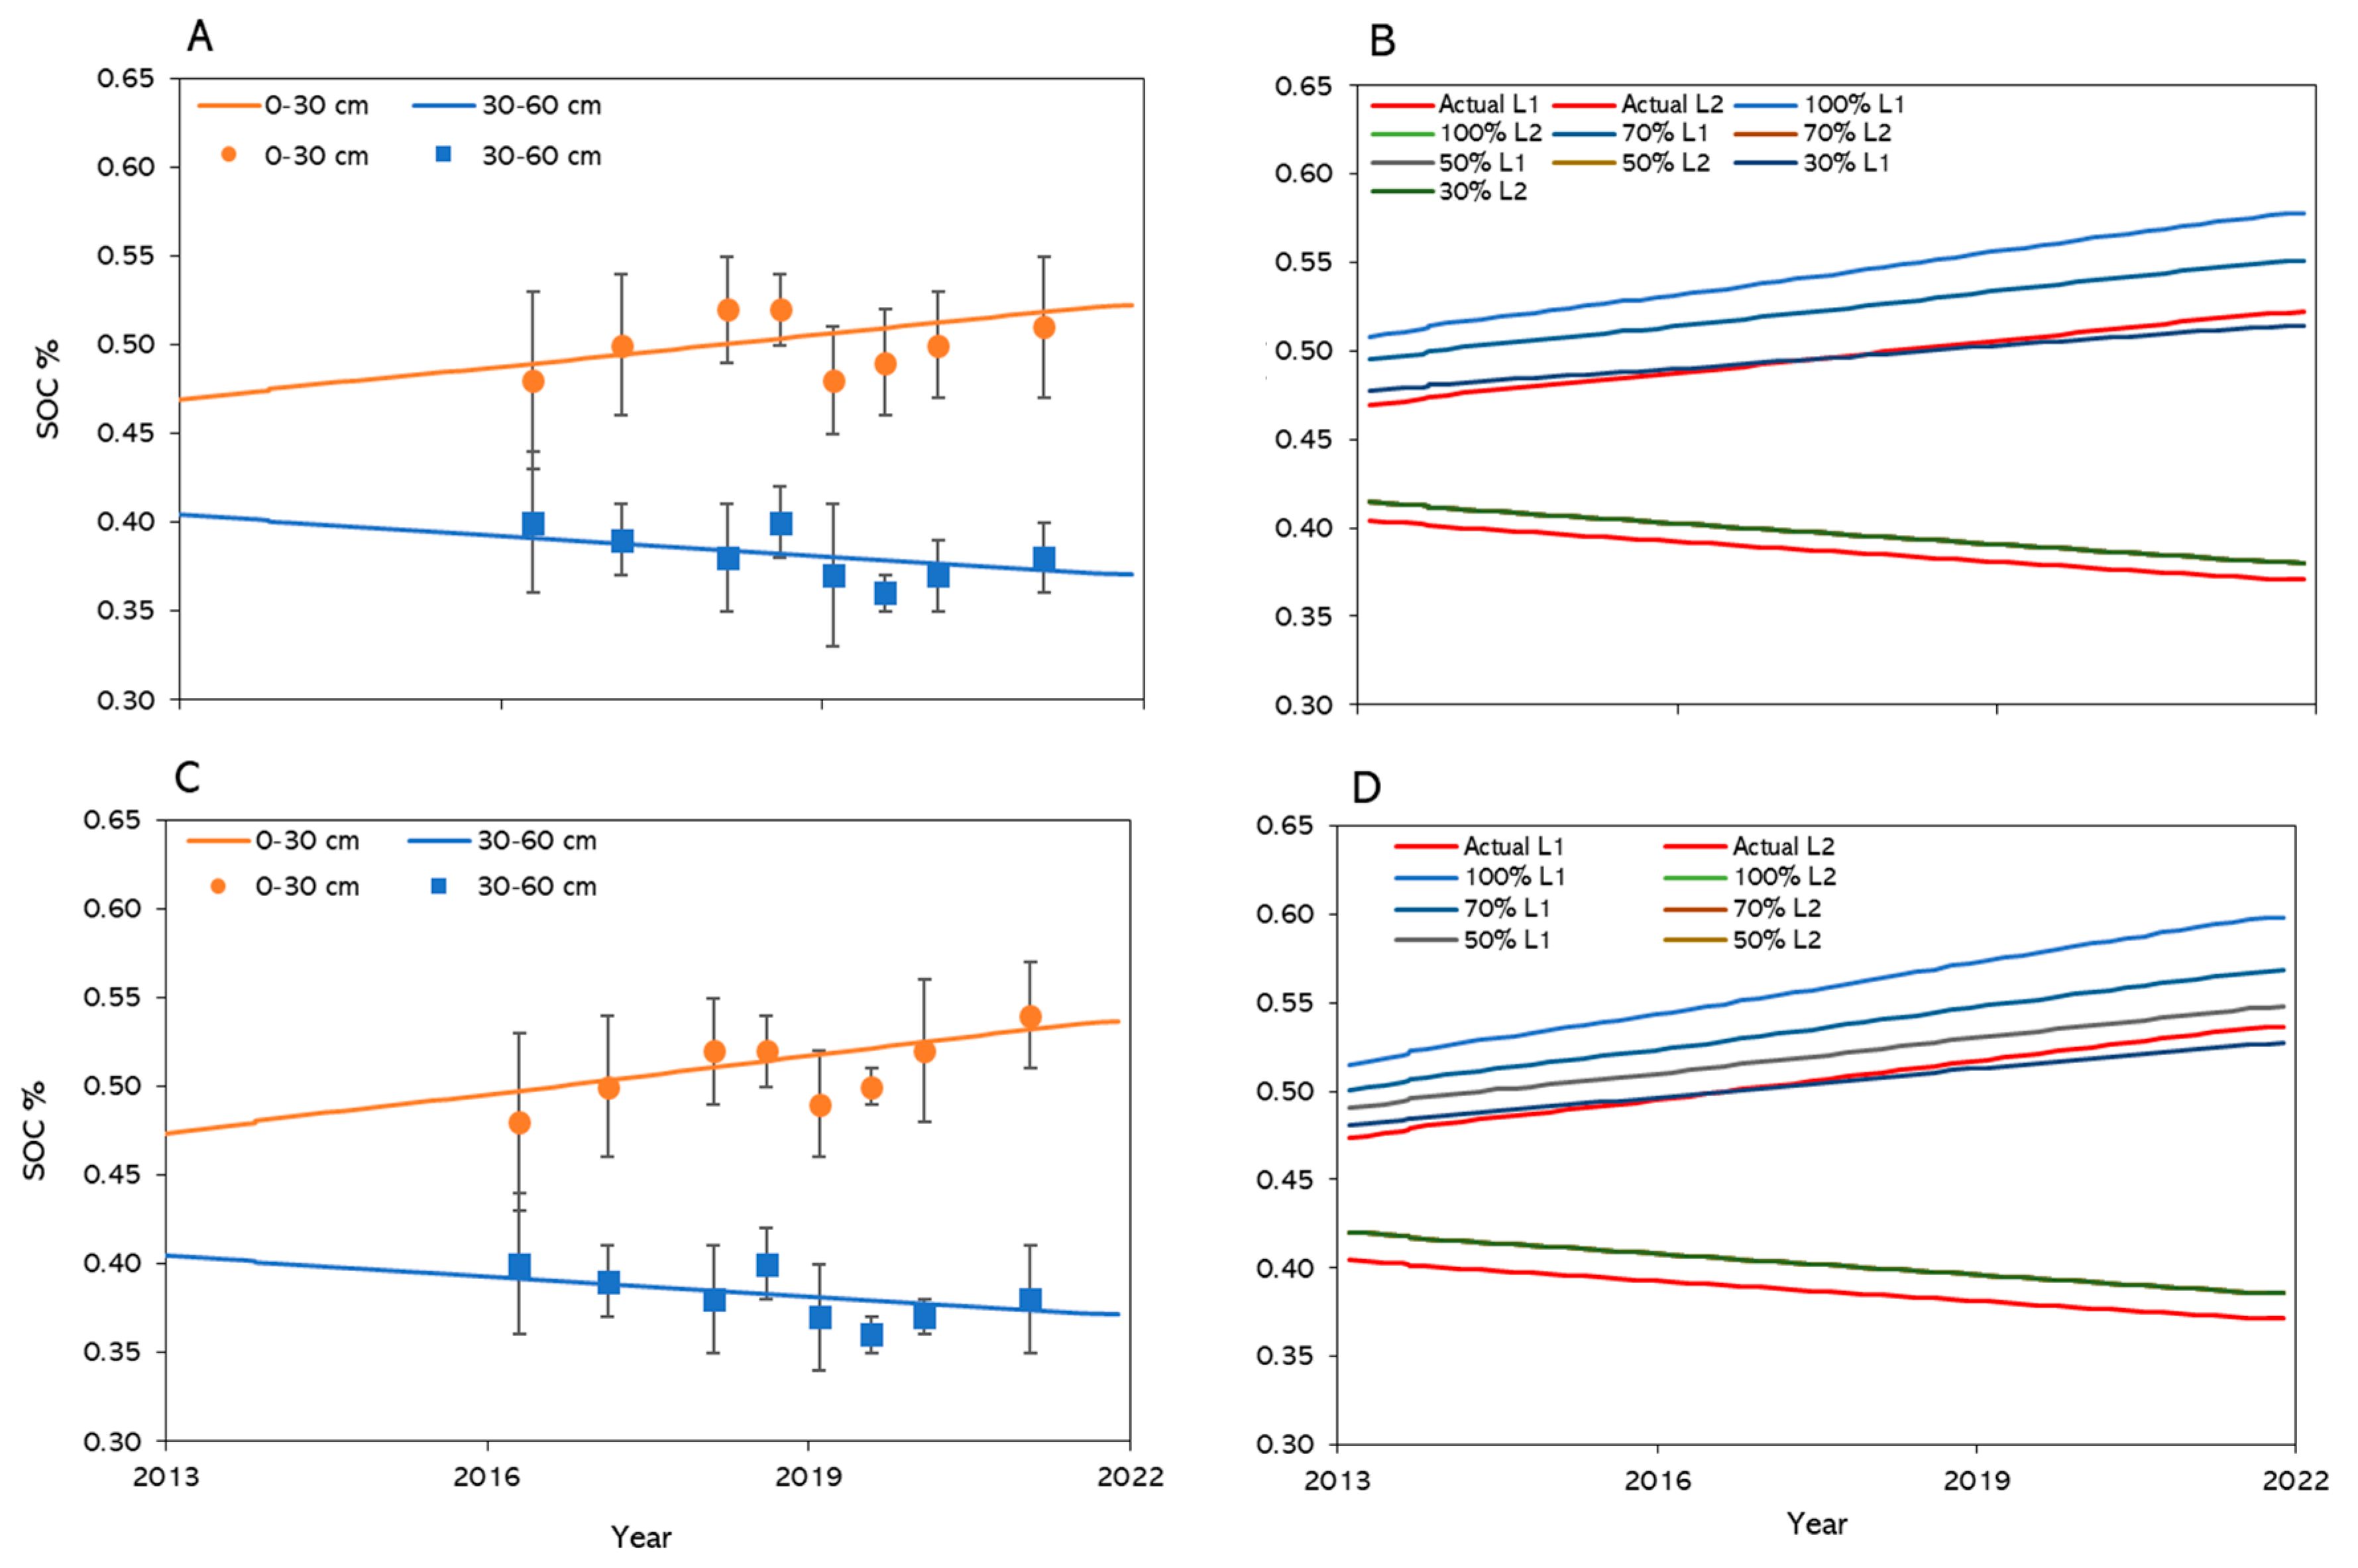
Individual simulations with the fitted lines with the observed data are presented in this section, along with predictions for different simulation scenarios of residue return. The first four data points on fitted lines are the same for all treatments, as there were no N application and planting date treatments during non-experimental years, as stated earlier (Figure 3, Figure 4, Figure 5, Figure 6, Figure 7 and Figure 8). The simulation results indicated that the increase in N application and residue return increased SOC in the 0–30 cm soil depth, whereas reducing the N input and residue return reduced the SOC in the 0–30 cm soil layer under all N application treatments in all planting dates (Figure 3, Figure 4, Figure 5, Figure 6, Figure 7 and Figure 8). The highest increase in SOC was observed at 90 kg N ha−1 (N90) under moderately delayed planting date (Figure 6). Considering the 30–60 cm soil depth, no considerable change was observed in most of the treatments (Figure 3, Figure 4, Figure 5, Figure 6, Figure 7 and Figure 8). Previous research has indicated that fertilizer applications increased the crop yields [28,29,30], and this could be a reason for increasing SOC in rice [31] due to higher residue return. Wang et al. [32] found that fertilization in rice-based cropping systems increased SOC sequestration. Whereas Wang et al. [33] suggested crop residue return as a promising strategy to enhance SOC. Hence, optimal fertilization will enhance overall crop productivity, thus enabling higher residue return. Keller and Handler [34] also stated that high plant productivity or biomass will have high potential for soil carbon storage.

3.4. Soil Organic Carbon Dynamics

Soil carbon dynamics were evaluated utilizing the simulated data after comparison between the simulated and observed data and model performance evaluation. Simulation results indicated that SOC varied under different N application rates and planting dates (Table 2). Soil organic carbon was increased under higher N application, and the highest values were observed at 90 kg N ha−1 under all the planting dates. This was possibly due to increased fertilization [31], high crop yields [28], and increased residue return (Table 1) at 90 kg N ha−1 in the actual and simulated scenarios. Early (49.5″ and 45.5″) and moderately delayed (43.0″, 38.5″) planting dates received higher total water input compared to delayed planting (33.7″, 29.5″) (Tables S2 and S3). Higher SOC under early and moderately delayed planting dates was possibly due to higher water input, increased crop yields, and residue return compared to delayed planting dates, where the water input, crop yields, and residue return were low (Table 1, Tables S2 and S3). These results indicate that N fertilization, planting, and residue management strategies have an impact on SOC. Soil organic carbon is higher in paddies compared to uplands because of low decomposition of organic matter in presence of floodwater [35]. Kladivko [36] found that crop productivity and organic matter were affected by fertilization and irrigation. Climatic conditions, particularly the air temperature and rainfall, were highly variable over different planting dates, possibly impacting crop productivity and soil organic carbon. A recent study on soil carbon indicated that plant biomass and soil organic carbon were positively correlated across different sites and concluded that relationships between plant biomass and soil organic carbon depend on prevailing climatic conditions [37]. These arguments support our findings as we observed higher SOC in the planting periods with higher crop productivity and water input.
The simulation scenarios for residue return at 100, 70, 50, and 30% of crop yields indicated that soil organic carbon was decreased with a decline in residue return in all the N applications and planting dates. These results indicate that sufficient residue return is necessary to increase soil organic carbon in uplands. A higher residue return ratio should be considered, particularly under low N input or delayed planting dates, to maintain soil organic carbon stocks in uplands.

4. Findings and Recommendations

The purpose of this study was to apply and evaluate the CQESTR model to predict soil organic carbon dynamics under different nitrogen applications, planting date, and residue management strategies in upland systems. We identified that fertilizer management and planting date impacted soil organic carbon. Improper residue management, such as reduced or no residue return, can have long-term consequences for upland soils. Hence, it is important to optimize N fertilizer input and practice optimal planting windows. It is understandable that climate conditions differ over the years, thus impacting biomass and overall productivity. Growers should plan the residue management according to the prevailing conditions and return an optimal amount of residue to upland soils. This strategy will not only help to enhance soil organic carbon stocks in upland soils but also assist in reducing fertilizer input benefits in overall economics and soil sustainability. Due to limited data and duration of experiments on N application rate and planting date management, the data from non-experimental years for the same field were used, where upland and lowland rice and some other crops were grown. Climatic conditions were highly variable at the experimental site, and the field area remained under different crop management practices over the years. In addition, high runoff occurred during the rainy seasons. These issues potentially impacted soil organic carbon. According to the author’s knowledge, no specific experimentation or studies exist on soil organic carbon dynamics under different N application and planting date management in addition to residue retention strategies for southern Thailand. Although the findings of the study involve several challenges (i.e., inconsistent crop cultivation, management practices, and limited measured data on soil organic carbon), these findings serve only as a preliminary assessment of N fertilization, planting, residue management, and model performance and soil organic carbon dynamics in upland rice systems in southern Thailand. These findings are useful in understanding the importance of optimal residue management in combination with optimal N application and planting management strategies. Long-term studies are required for evaluating dynamics of soil organic carbon in uplands, and the CQESTR model could be used for applicable recommendations.

Supplementary Materials

The following supporting information can be downloaded at https://www.mdpi.com/article/10.3390/soilsystems9030104/s1. Table S1: Details of nitrogen application rates and planting dates during 2018–2019 and 2019–2020 crop growing seasons. Table S2: Applied irrigation amount, precipitation, and total water input for each planting date during experimental years. Table S3: Average monthly temperature and rainfall for experimental location and mean monthly total water input for each planting date.

Author Contributions

Author T.H. conducted experiments and collected data under the supervision of S.D. and C.N. C.N. and S.D. provided technical guidance for experimentation. T.H. analyzed the data, performed simulations, and prepared the first draft. C.N., S.D. and M.F.A. edited the manuscript. All authors have read and agreed to the published version of the manuscript.

Funding

This study was partially supported by the Faculty of Natural Resources—Prince of Songkla University; Graduate School—Prince of Songkla University; and the CGIAR Research Program on Climate Change, Agriculture and Food Security (CCAFS) and the Global Research Alliance on Agricultural Greenhouse Gases (GRA) through their Climate, Food and Farming Global Research Alliance Development Scholarship (CLIFF-GRADS) program. CCAFS capability-building objectives are carried out with support from the CGIAR Trust Fund and through bilateral funding agreements. For details, please visit https://ccafs.cgiar.org/donors. First author thanks the Government of New Zealand for providing support.

Data Availability Statement

The data presented in this study are available in this article and Supplementary Materials. For further information please contact first author (T.H.).

Acknowledgments

Field expeiements were conducted at Faculty of Natural Resources—Prince of Songkla University, Thailand. Modeling work was performed at USDA. Thanks to Hero T. Gollany and Wayne Polumsky for providing the software and their guidance on CQESTR modeling. Mention of trade names or commercial products in this research does not imply recommendation or endorsement by the U.S. Department of Agriculture—Agricultural Research Service.

Conflicts of Interest

The authors declare no conflicts of interest.

References

  1. FAO. FAOSTAT (Online). 2020. Available online: https://www.fao.org/faostat/en/#home (accessed on 18 August 2021).
  2. Hussain, T.; Anothai, J.; Nualsri, C.; Soonsuwon, W. Evaluating Performance of Sixteen Upland Rice Genotypes under Field Conditions for Further Breeding Process. J. Agric. Sci 2018, 10, 144–150. [Google Scholar] [CrossRef][Green Version]
  3. Norsuwan, T.; Utasuk, K.; Panyasai, T.; Sangchyoswat, C. Optimization of Nitrogen Fertilizer Application in Lowland Rice Production System of Agricultural Resource System Research Station Using Tailored Farm-Plot Database. Chiang Mai Univ. J. Nat. Sci. 2020, 19, 333–349. [Google Scholar] [CrossRef]
  4. Hussain, T.; Gollany, H.T.; Mulla, D.J.; Ben, Z.; Tahir, M.; Ata-ul-karim, S.T.; Liu, K.; Maqbool, S.; Hussain, N.; Duangpan, S. Assessment and Application of EPIC in Simulating Upland Rice Productivity, Soil Water, and Nitrogen Dynamics under Different Nitrogen Applications and Planting Windows. Plants 2023, 13, 2379. [Google Scholar] [CrossRef]
  5. DRRD Soil and Fertilizer Management in Rice Fields, Fertilizer Recommendations for Southern Region. Rice Knowledge Bank. 2017. Available online: https://webold.ricethailand.go.th/rkb3/title-index.php-file=content.php&id=043.htm#p9 (accessed on 22 December 2021).
  6. Candradijaya, A.; Kusmana, C.; Syaukat, Y.; Syaufina, L.; Faqih, A. Climate Change Impact on Rice Yield and Adaptation Response of Local Farmers in Sumedang District, West Java, Indonesia. Int. J. Ecosyst. 2014, 4, 212–223. [Google Scholar] [CrossRef]
  7. Thai Rice Exporters Association Rice Production Forecast Results 2017–2022. 2022.
  8. Kanchanapiya, P.; Tantisattayakul, T. Enhancing Carbon Reduction and Sustainable Agriculture in Thailand: An Assessment of Rice Straw Utilization Strategies. Green Technol. Sustain. 2025, 3, 100136. [Google Scholar] [CrossRef]
  9. ONEP Second Biennial Update Report of Thailand; UNFCCC: Bangkok, Thailand, 2017.
  10. Cheewaphongphan, P.; Junpen, A.; Garivait, S.; Kamnoet, O. Study on the Potential of Rice Straws as a Supplementary Fuel in Very Small Power Plants. Energies 2018, 11, 270. [Google Scholar] [CrossRef]
  11. Cha-un, N.; Chidthaisong, A.; Yagi, K.; Sudo, S.; Towprayoon, S. Greenhouse Gas Emissions, Soil Carbon Sequestration and Crop Yields in a Rain-Fed Rice Field with Crop Rotation Management. Agric. Ecosyst. Environ. 2017, 237, 109–120. [Google Scholar] [CrossRef]
  12. Ali, A.; Hussain, T.; Zahid, A. Smart Irrigation Technologies and Prospects for Enhancing Water Use Efficiency for Sustainable Agriculture. AgriEngineering 2025, 7, 106. [Google Scholar] [CrossRef]
  13. Ali, A.; Hussain, T.; Tantashutikun, N.; Hussain, N.; Cocetta, G. Application of Smart Techniques, Internet of Things and Data Mining for Resource Use Efficient and Sustainable Crop Production. Agriculture 2023, 13, 397. [Google Scholar] [CrossRef]
  14. Jones, J.W.; Hoogenboom, G.; Porter, C.H.; Boote, K.J.; Batchelor, W.D.; Hunt, L.A.; Wilkens, P.W.; Singh, U.; Gijsman, A.J.; Ritchie, J.T. The DSSAT Cropping System Model. Eur. J. Agron. 2003, 18, 235–265. [Google Scholar] [CrossRef]
  15. Chang, K.-H.; Warland, J.; Voroney, P.; Bartlett, P.; Wagner-Riddle, C. Using DayCENT to Simulate Carbon Dynamics in Conventional and No-Till Agriculture. Soil Sci. Soc. Am. J. 2013, 77, 941–950. [Google Scholar] [CrossRef]
  16. Gollany, H.T.; Elnaggar, A.A. Simulating Soil Organic Carbon Changes across Toposequences under Dryland Agriculture Using CQESTR. Ecol. Modell. 2017, 355, 97–104. [Google Scholar] [CrossRef]
  17. Cavigelli, M.A.; Nash, P.R.; Gollany, H.T.; Rasmann, C.; Polumsky, R.W.; Le, A.N.; Conklin, A.E. Simulated Soil Organic Carbon Changes in Maryland Are Affected by Tillage, Climate Change, and Crop Yield. J. Environ. Qual. 2018, 47, 588–595. [Google Scholar] [CrossRef]
  18. Wienhold, B.J.; Schmer, M.R.; Jin, V.L.; Varvel, G.E.; Gollany, H. CQESTR Simulated Changes in Soil Organic Carbon under Residue Management Practices in Continuous Corn Systems. BioEnergy Res. 2016, 9, 23–30. [Google Scholar] [CrossRef]
  19. Gollany, H.T.; Fortuna, A.M.; Samuel, M.K.; Young, F.L.; Pan, W.L.; Pecharko, M. Soil Organic Carbon Accretion vs. Sequestration Using Physicochemical Fractionation and CQESTR Simulation. Soil Sci. Soc. Am. J. 2013, 77, 618–629. [Google Scholar] [CrossRef]
  20. Liang, Y.; Gollany, H.T.; Rickman, R.W.; Albrecht, S.L.; Follett, R.F.; Wilhelm, W.W.; Novak, J.M.; Douglas, C.L. Simulating Soil Organic Matter with CQESTR (v. 2.0): Model Description and Validation against Long-Term Experiments across North America. Ecol. Modell. 2009, 220, 568–581. [Google Scholar] [CrossRef]
  21. Rickman, R.W.; Douglas, C.L., Jr.; Albrecht, S.L.; Bundy, L.G.; Berc, J.L. CQESTR: A Model to Estimate Carbon Sequestration in Agricultural Soils. J. Soil Water Conserv. 2001, 56, 237–242. [Google Scholar] [CrossRef]
  22. Nash, P.R.; Gollany, H.T.; Sainju, U.M. CQESTR-Simulated Response of Soil Organic Carbon to Management, Yield, and Climate Change in the Northern Great Plains Region. J. Environ. Qual. 2018, 47, 674–683. [Google Scholar] [CrossRef]
  23. Renard, K.G.; Foster, G.R.; Weesies, G.A.; McCool, D.K.; Yoder, D.C. Predicting Soil Erosion by Water: A Guide to Conservation Planning with the Revised Universal Soil Loss Equation (RUSLE); USDA: Washington, DC, USA, 1996. [Google Scholar]
  24. Gollany, H.T.; Follett, R.F.; Liang, Y. Chapter 16—CQESTR Simulations of Soil Organic Carbon Dynamics; Liebig, M.A., Franzluebbers, A.J., Follett, R.F.B.T.-M.A.G.G., Eds.; Academic Press: San Diego, CA, USA, 2012; pp. 271–292. ISBN 978-0-12-386897-8. [Google Scholar]
  25. Thai Meteorological Department Report; TMD Climatological Center: Bangkok, Thailand, 2021.
  26. Walkley, A.; Black, I.A. An examination of Degtjareff method for determining soil organic matter, and proposed modification of the chromic acid titration method. Soil Sci. 1934, 37, 29–38. [Google Scholar] [CrossRef]
  27. Gauch, H.G.; Hwang, J.T.G.; Fick, G.W. Model Evaluation by Comparison of Model-Based Predictions and Measured Values. Agron. J. 2003, 95, 1442–1446. [Google Scholar] [CrossRef]
  28. Hussain, T.; Hussain, N.; Ahmed, M.; Tahir, M.; Duangpan, S. Synchronizing Nitrogen Fertilization and Planting Date to Improve Resource Use Efficiency, Productivity, and Profitability of Upland Rice. Front. Plant Sci. 2022, 13, 5811. [Google Scholar] [CrossRef]
  29. Zhang, J.; Tong, T.; Potcho, P.M.; Huang, S.; Ma, L.; Tang, X. Nitrogen Effects on Yield, Quality and Physiological Characteristics of Giant Rice. Agronomy 2020, 10, 1816. [Google Scholar] [CrossRef]
  30. Jahan, A.; Islam, A.; Sarkar, M.I.U.; Iqbal, M.; Ahmed, M.N.; Islam, M.R. Nitrogen Response of Two High Yielding Rice Varieties as Influenced by Nitrogen Levels and Growing Seasons. Geol. Ecol. Landsc. 2022, 6, 24–31. [Google Scholar] [CrossRef]
  31. Arunrat, N.; Pumijumnong, N.; Hatano, R. Practices Sustaining Soil Organic Matter and Rice Yield in a Tropical Monsoon Region. Soil Sci. Plant Nutr. 2017, 63, 274–287. [Google Scholar] [CrossRef]
  32. Wang, S.; Sun, N.; Liang, S.; Zhang, S.; Meersmans, J.; Colinet, G.; Xu, M.; Wu, L. SOC sequestration affected by fertilization in rice-based cropping systems over the last four decades. Front. Environ. Sci. 2023, 11, 1152439. [Google Scholar] [CrossRef]
  33. Wang, X.; He, C.; Liu, B.; Zhao, X.; Liu, Y.; Wang, Q.; Zhang, H. Effects of Residue Returning on Soil Organic Carbon Storage and Sequestration Rate in China’s Croplands: A Meta-Analysis. Agronomy 2020, 10, 691. [Google Scholar] [CrossRef]
  34. Keller, A.B.; Handler, S.D. USDA Northern Forests Climate Hub. Soil Organic Carbon in Temperate Managed Ecosystems: A Primer; Northern Institute of Applied Climate Science: Duluth, MN, USA, 2024. [Google Scholar]
  35. Katoh, T. Carbon Accumulation in Soils by Soil Management, Mainly by Organic Matter Application-Experimental Results in Aichi Prefecture. Jpn. Soc. Soil Sci. Plant Nutr. 2003, 74, 99–104. [Google Scholar] [CrossRef]
  36. Kladivko, E.J. Tillage Systems and Soil Ecology. Soil Tillage Res. 2001, 61, 61–76. [Google Scholar] [CrossRef]
  37. Spohn, M.; Bagchi, S.; Biederman, L.A.; Borer, E.T.; Bråthen, K.A.; Bugalho, M.N.; Caldeira, M.C.; Catford, J.A.; Collins, S.L.; Eisenhauer, N.; et al. The Positive Effect of Plant Diversity on Soil Carbon Depends on Climate. Nat. Commun. 2023, 14, 6624. [Google Scholar] [CrossRef] [PubMed]
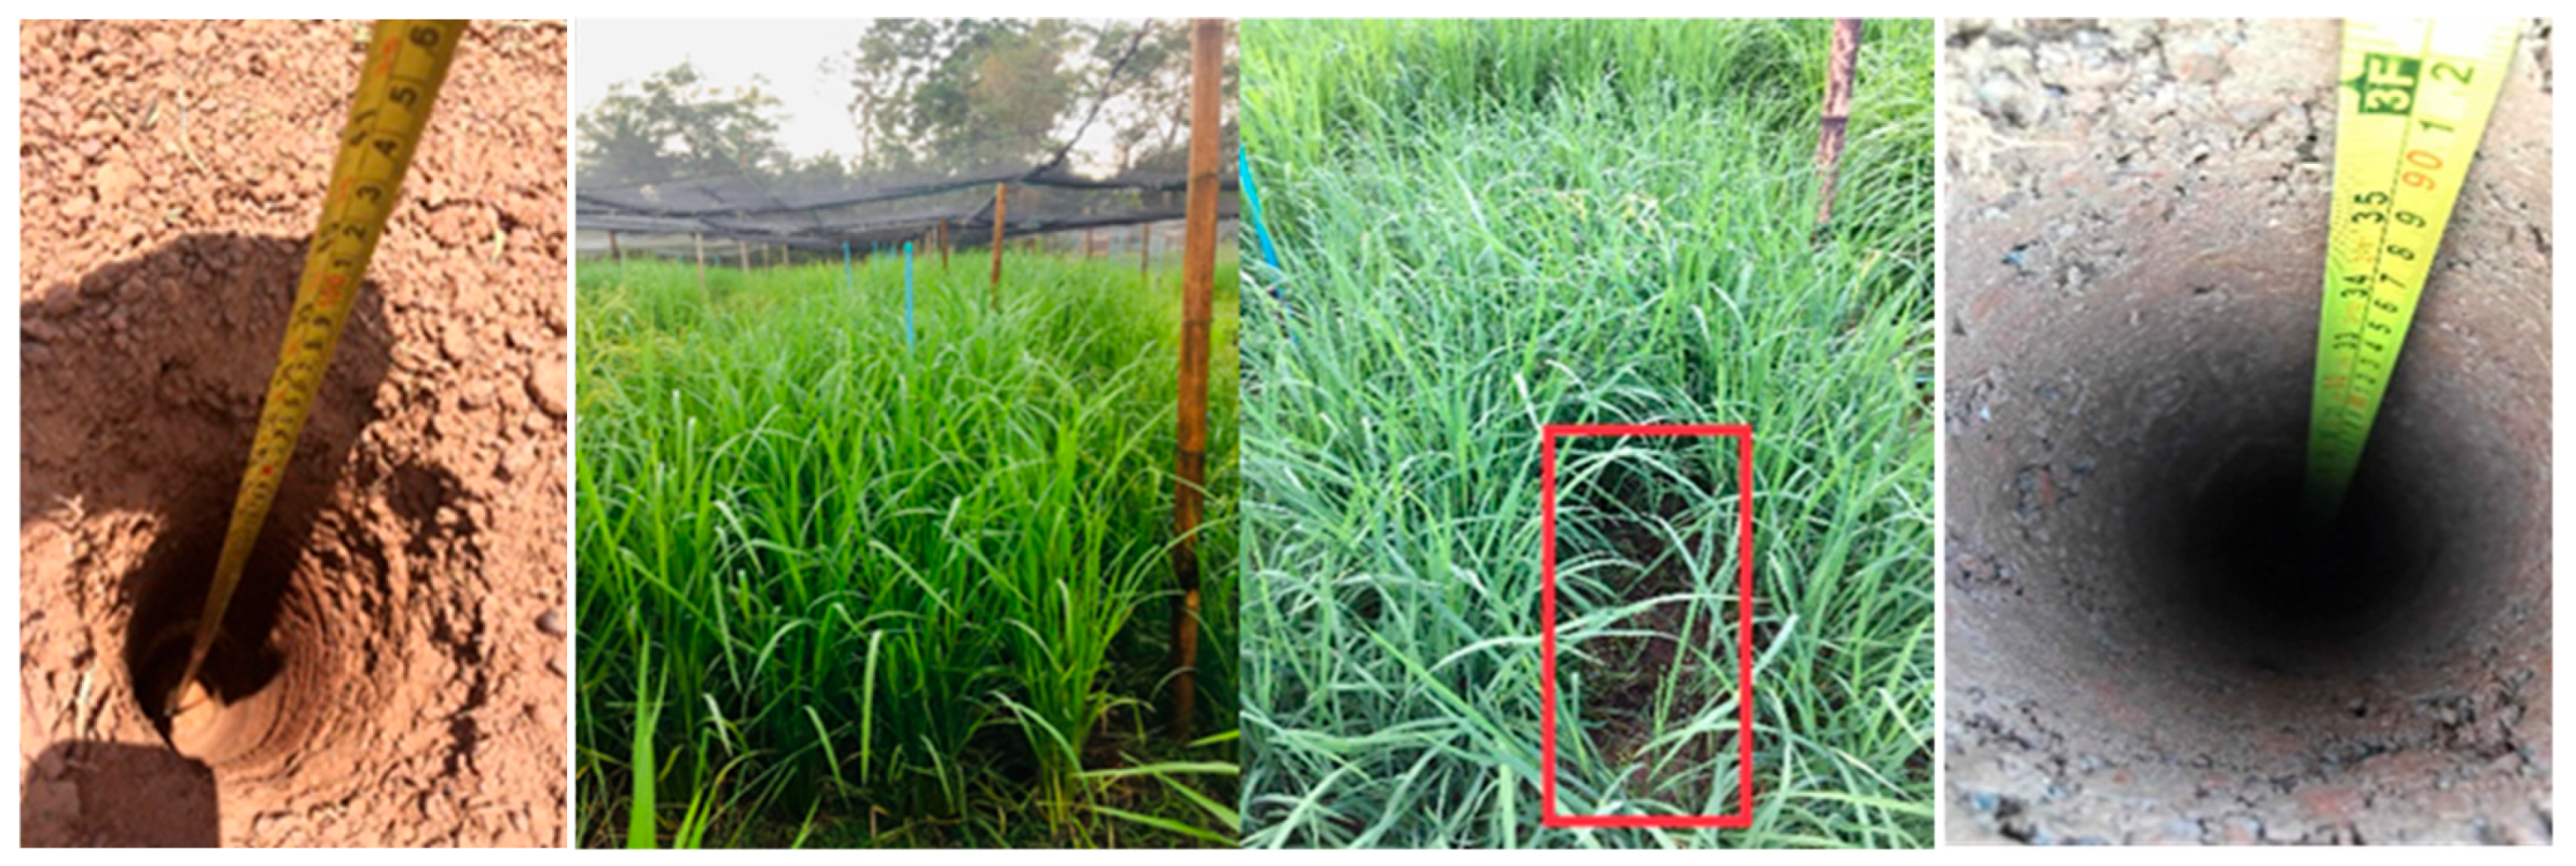
Figure 1. Pre and post plantation soil sampling, establishment of rice experiments, and biomass data collection during experimental years.
Soilsystems 09 00104 g001
Figure 2. Simulated vs. observed soil organic carbon for twelve treatment combinations (nitrogen application rate × planting date) under actual residue return at 30% and 100% during experimental years (2018–2020). PD1, PD2, and PD3 refer to early, moderately delayed, and delayed planting dates, respectively, whereas N1, N2, N3, and N4 refer to 0 kg N ha−1 (N0), 30 kg N ha−1 (N30), 60 kg N ha−1 (N60), and 90 kg N ha−1 (N90), respectively.
Soilsystems 09 00104 g002
Figure 3. Simulated vs. observed soil organic carbon (A,C) and model predictions for simulation scenarios of 100, 70, 50, and 30% residue return (B,D) for non-fertilized control 0 kg N ha−1 (N0) (A,B) and nitrogen application rate of 30 kg N ha−1 (N30) (C,D) under early planting date. The actual line indicates the simulations under the actual residue return rate at 30% in 2018–2019 and 100% in 2019–2020 experimental years. L1 and L2 refer to 0–30 and 30–60 cm soil depths.
Soilsystems 09 00104 g003
Figure 4. Simulated vs. observed soil organic carbon (A,C) and model predictions for simulation scenarios of 100, 70, 50, and 30% residue return (B,D) for nitrogen application rate of 60 kg N ha−1 (N60) (A,B) and 90 kg N ha−1 (N90) (C,D) under early planting date. The actual line indicates the simulations under the actual residue return rate at 30% in 2018–2019 and 100% in 2019–2020 experimental years. L1 and L2 refer to 0–30 and 30–60 cm soil depths.
Soilsystems 09 00104 g004
Figure 5. Simulated vs. observed soil organic carbon (A,C) and model predictions for simulation scenarios of 100, 70, 50, and 30% residue return (B,D) for non-fertilized control 0 kg N ha−1 (N0) (A,B) and nitrogen application rate of 30 kg N ha−1 (N30) (C,D) under moderately delayed planting date. The actual line indicates the simulations under the actual residue return rate at 30% in 2018–2019 and 100% in 2019–2020 experimental years. L1 and L2 refer to 0–30 and 30–60 cm soil depths.
Soilsystems 09 00104 g005
Figure 6. Simulated vs. observed soil organic carbon (A,C) and model predictions for simulation scenarios of 100, 70, 50, and 30% residue return (B,D) for nitrogen application rate of 60 kg N ha−1 (N60) (A,B) and 90 kg N ha−1 (N90) (C,D) under moderately delayed planting date. The actual line indicates the simulations under the actual residue return rate at 30% in 2018–2019 and 100% in 2019–2020 experimental years. L1 and L2 refer to 0–30 and 30–60 cm soil depths.
Soilsystems 09 00104 g006aSoilsystems 09 00104 g006b
Figure 7. Simulated vs. observed soil organic carbon (A,C) and model predictions for simulation scenarios of 100, 70, 50, and 30% residue return (B,D) for non-fertilized control 0 kg N ha−1 (N0) (A,B) and nitrogen application rate of 30 kg N ha−1 (N30) (C,D) under delayed planting date. The actual line indicates the simulations under the actual residue return rate at 30% in 2018–2019 and 100% in 2019–2020 experimental years. L1 and L2 refer to 0–30 and 30–60 cm soil depths.
Soilsystems 09 00104 g007
Figure 8. Simulated vs. observed soil organic carbon (A,C) and model predictions for simulation scenarios of 100, 70, 50, and 30% residue return (B,D) for nitrogen application rate of 60 kg N ha−1 (N60) (A,B) and 90 kg N ha−1 (N90) (C,D) under delayed planting date. The actual line indicates the simulations under the actual residue return rate at 30% in 2018–2019 and 100% in 2019–2020 experimental years. L1 and L2 refer to 0–30 and 30–60 cm soil depths.
Soilsystems 09 00104 g008
Table 1. Rice residue and computed root biomass under different nitrogen application rates and planting dates during experimental years.
Planting DateNitrogen Application Rate (kg ha−1)Residue (kg ha−1)Root Biomass (kg ha−1)
2018–20192019–2020Avg2018–20192019–2020Avg
Early01058.82548.11803.5882.3633.3757.8
301377.73318.52348.11148.1788.9968.5
601658.43644.42651.41382.0922.21152.1
901817.84622.23220.01514.81166.71340.7
Moderately delayed01128.42641.51885.0940.3628.4784.4
301747.83859.72803.81456.5918.31187.4
601699.54379.83039.61416.21042.01229.1
901863.94550.83207.31553.21082.71317.9
Delayed0951.12411.41681.2792.6578.9685.8
301337.83221.32279.51114.8816.9965.8
601431.13547.92489.51192.6896.51044.5
901680.03809.22744.61400.0933.61166.8
Table 2. The CQESTR-simulated change in soil organic carbon (SOC) at 0–30 cm soil depth under various nitrogen application rates, planting dates, and residue management scenarios.
Planting DateNitrogen Application Rate (kg ha−1)Depth
(cm)
∆ SOC (Mg C ha−1)
Residue Return
* Actual100%70%50%30%
Early 030 0.611.000.730.550.37
3030 1.121.621.281.040.81
6030 1.542.071.671.401.13
9030 2.052.602.151.831.52
Moderately delayed 030 0.801.220.920.710.51
3030 1.832.431.981.671.36
6030 1.972.542.071.751.43
9030 2.172.832.331.981.64
Delayed 030 0.580.940.670.490.31
3030 1.281.801.431.190.94
6030 1.481.981.591.321.05
9030 1.782.371.931.621.32
* actual residue return refers to 30% and 100% residue return rate during experimental years (2018–2020), whereas 100, 70, 50, and 30% refer to simulation scenarios for residue return.
Disclaimer/Publisher’s Note: The statements, opinions and data contained in all publications are solely those of the individual author(s) and contributor(s) and not of MDPI and/or the editor(s). MDPI and/or the editor(s) disclaim responsibility for any injury to people or property resulting from any ideas, methods, instructions or products referred to in the content.