Article

Dynamics of Pharmaceuticals in the Soil–Plant System: A Case Study on Mycorrhizal Artichoke

1
Department of Soil, Plant, and Food Sciences, University of Bari “Aldo Moro”, Via Amendola 165/A, 70126 Bari, Italy
2
CNR IRSA (National Research Council of Italy, Water Research Institute), V.le F. De Blasio 5, 70132 Bari, Italy
*
Authors to whom correspondence should be addressed.
These authors contributed equally to this work.
Soil Syst. 2025, 9(2), 51; https://doi.org/10.3390/soilsystems9020051
Submission received: 21 March 2025 / Revised: 11 May 2025 / Accepted: 13 May 2025 / Published: 15 May 2025

Abstract

:
Contaminants of emerging concern, such as pharmaceuticals (PhACs), are continuously introduced into agro-ecosystems through irrigation with treated wastewater (TWW). While this practice is increasingly common in drought regions, only limited information is available on the fate of PhACs within the soil–plant system. For this purpose, a two-year study was conducted by irrigating artichokes, non-inoculated and inoculated with different arbuscular mycorrhizal fungi, with water containing PhACs at different concentrations. The experiment, conducted in both open field and pot conditions, aimed to evaluate their potential accumulation in the soil and plant tissues. Results showed that PhACs concentrations varied according to the physicochemical properties of the compounds and the duration of irrigation. The study revealed minimal accumulation of contaminants in the soil and non-edible plant parts. This was observed only at the end of the second growing cycle, when the plants were irrigated with TWW containing trace PhAC levels. In contrast, during both pot cultivation cycles, PhACs accumulated in the soil were translocated into plant organs when irrigated with water enriched to 200 μg L−1 with eight PhACs. At the end of the trial, climbazole had the highest concentration in soil, while carbamazepine and fluconazole showed greater accumulation across all plant organs compared to other PhACs. In both trials, plants inoculated with Septoglomus viscosum absorbed less PhACs compared to those inoculated with Rhizophagus irregularis + Funneliformis mosseae. These results suggest that, while the long-term use of TWW containing PhACs may improve artichoke yield, it could present different degrees of risk to both environmental and human health, depending on the concentration levels of contaminants.

1. Introduction

Water supply sources are not always able to meet the demands of various sectors due to climate change and rapid population growth, particularly in drought regions and countries using non-innovative water management practices [1]. Non-conventional water resources, such as urban and industrial treated wastewater, can address such water shortages [2]. However, the use of non-conventional water resources, especially in agriculture, requires careful and strategic planning to minimize potential risks to public health and the environment. Recently, the European Commission introduced the Water Reuse regulation, which defines the minimum quality requirements for wastewater (WW) used for crop irrigation [3]. This regulation primarily focuses on physicochemical parameters and microbiological risks, but there is no mention of risks posed by contaminants of emerging concern (CECs), such as Pharmaceutical Active Compounds (PhACs), which may be present in reclaimed water. The EU market has registered around 3000 commonly used pharmaceuticals, with global usage still on the rise [4]. As a result, most WW discharges continue to be contaminated with PhACs and personal care products [5]. Although environmental risks associated with water reuse in agriculture are a top priority, there is still limited understanding of the environmental fate of wastewater-borne biological and chemical contaminants and their potential ecotoxicological impacts on soil-dwelling organisms and eco-physiological functions. Akhter et al. [6] and Wei et al. [7] found that the uptake and translocation of PhACs from soil to plant roots and aerial parts can be influenced by factors such as the physicochemical properties of PhACs, environmental factors affecting transpiration, plant physiology, and soil or matrix properties. Thus, the evaluation of the fate of PhACs within the plant–soil system is crucial, especially in drought-prone areas like the Mediterranean basin, where plants can increasingly be irrigated with reclaimed wastewater.
A crop that could benefit from this kind of irrigation is globe artichoke (Cynara cardunculus var. scolymus (L.) Fiori), an important crop in the Mediterranean Basin [8], grown for its edible part, the “head”. The annual global production of artichoke heads is approximately 1700 kt, with significant contributions from southern Europe (e.g., Italy, Spain, France, Greece), the Middle East (e.g., Turkey, Syria, Israel), North Africa (e.g., Egypt, Morocco, Algeria, Tunisia), and recently, China as well [9]. Italy is the largest producer globally, yielding around 477 kt per year, with artichoke cultivation mainly occurring in southern Italy (i.e., Sicily, Sardinia, Apulia).
Several microorganisms, or their byproducts, can be used for the bioremediation of PhACs and pesticides using in situ or ex situ approaches [10]. Fungi are promising because they can absorb several organic contaminants and/or produce enzymes that degrade them, although they grow slowly and are sensitive to environmental conditions [11]. The symbiosis between arbuscular mycorrhizal fungi (AMF) and roots can help keep fungal metabolism at its best, as well as enhance root access to water and essential inorganic nutrients (e.g., P, N, K, Ca, S, Zn, Cu) leading to increased plant biomass [12], crop yield [13], and consequently, crop quality [14,15]. In addition to modifying soil structure [16], the extraradical mycelium can also influence the uptake of contaminants, including heavy metals [17] and CECs, thereby reducing their potential negative impact on ecosystems [18]. Thus, the application of AMF can be a promising phytoremediation strategy for restoring contaminated soils and rehabilitating degraded ecosystems [19]. AMF can also shield plants from the harmful effects of CECs by modulating the transport and distribution of these contaminants within plant tissues. Previous research has reported that AMF affect the dynamics of organic contaminants in the soil–plant system [20,21], helping to reduce CEC concentrations in plant shoots by promoting CEC accumulation in the roots [22,23]. Furthermore, mycorrhizal fungi may contribute to the biodegradation and metabolization of CECs. Recent studies by Yu et al. [24] and Małachowska-Jutszet et al. [25] indicate that AMF can enhance the removal of polycyclic aromatic hydrocarbons and petroleum compounds from soils. Despite incomplete knowledge of the mechanisms of action of AMF [26], it is likely that these fungi play a key role in CEC-contaminated environments. The main objective of this study was to address these knowledge gaps by investigating the behavior of selected organic contaminants within the water–soil–plant system for the specific conditions of artichoke grown in pots and open fields over multiple crop cycles.

2. Materials and Methods

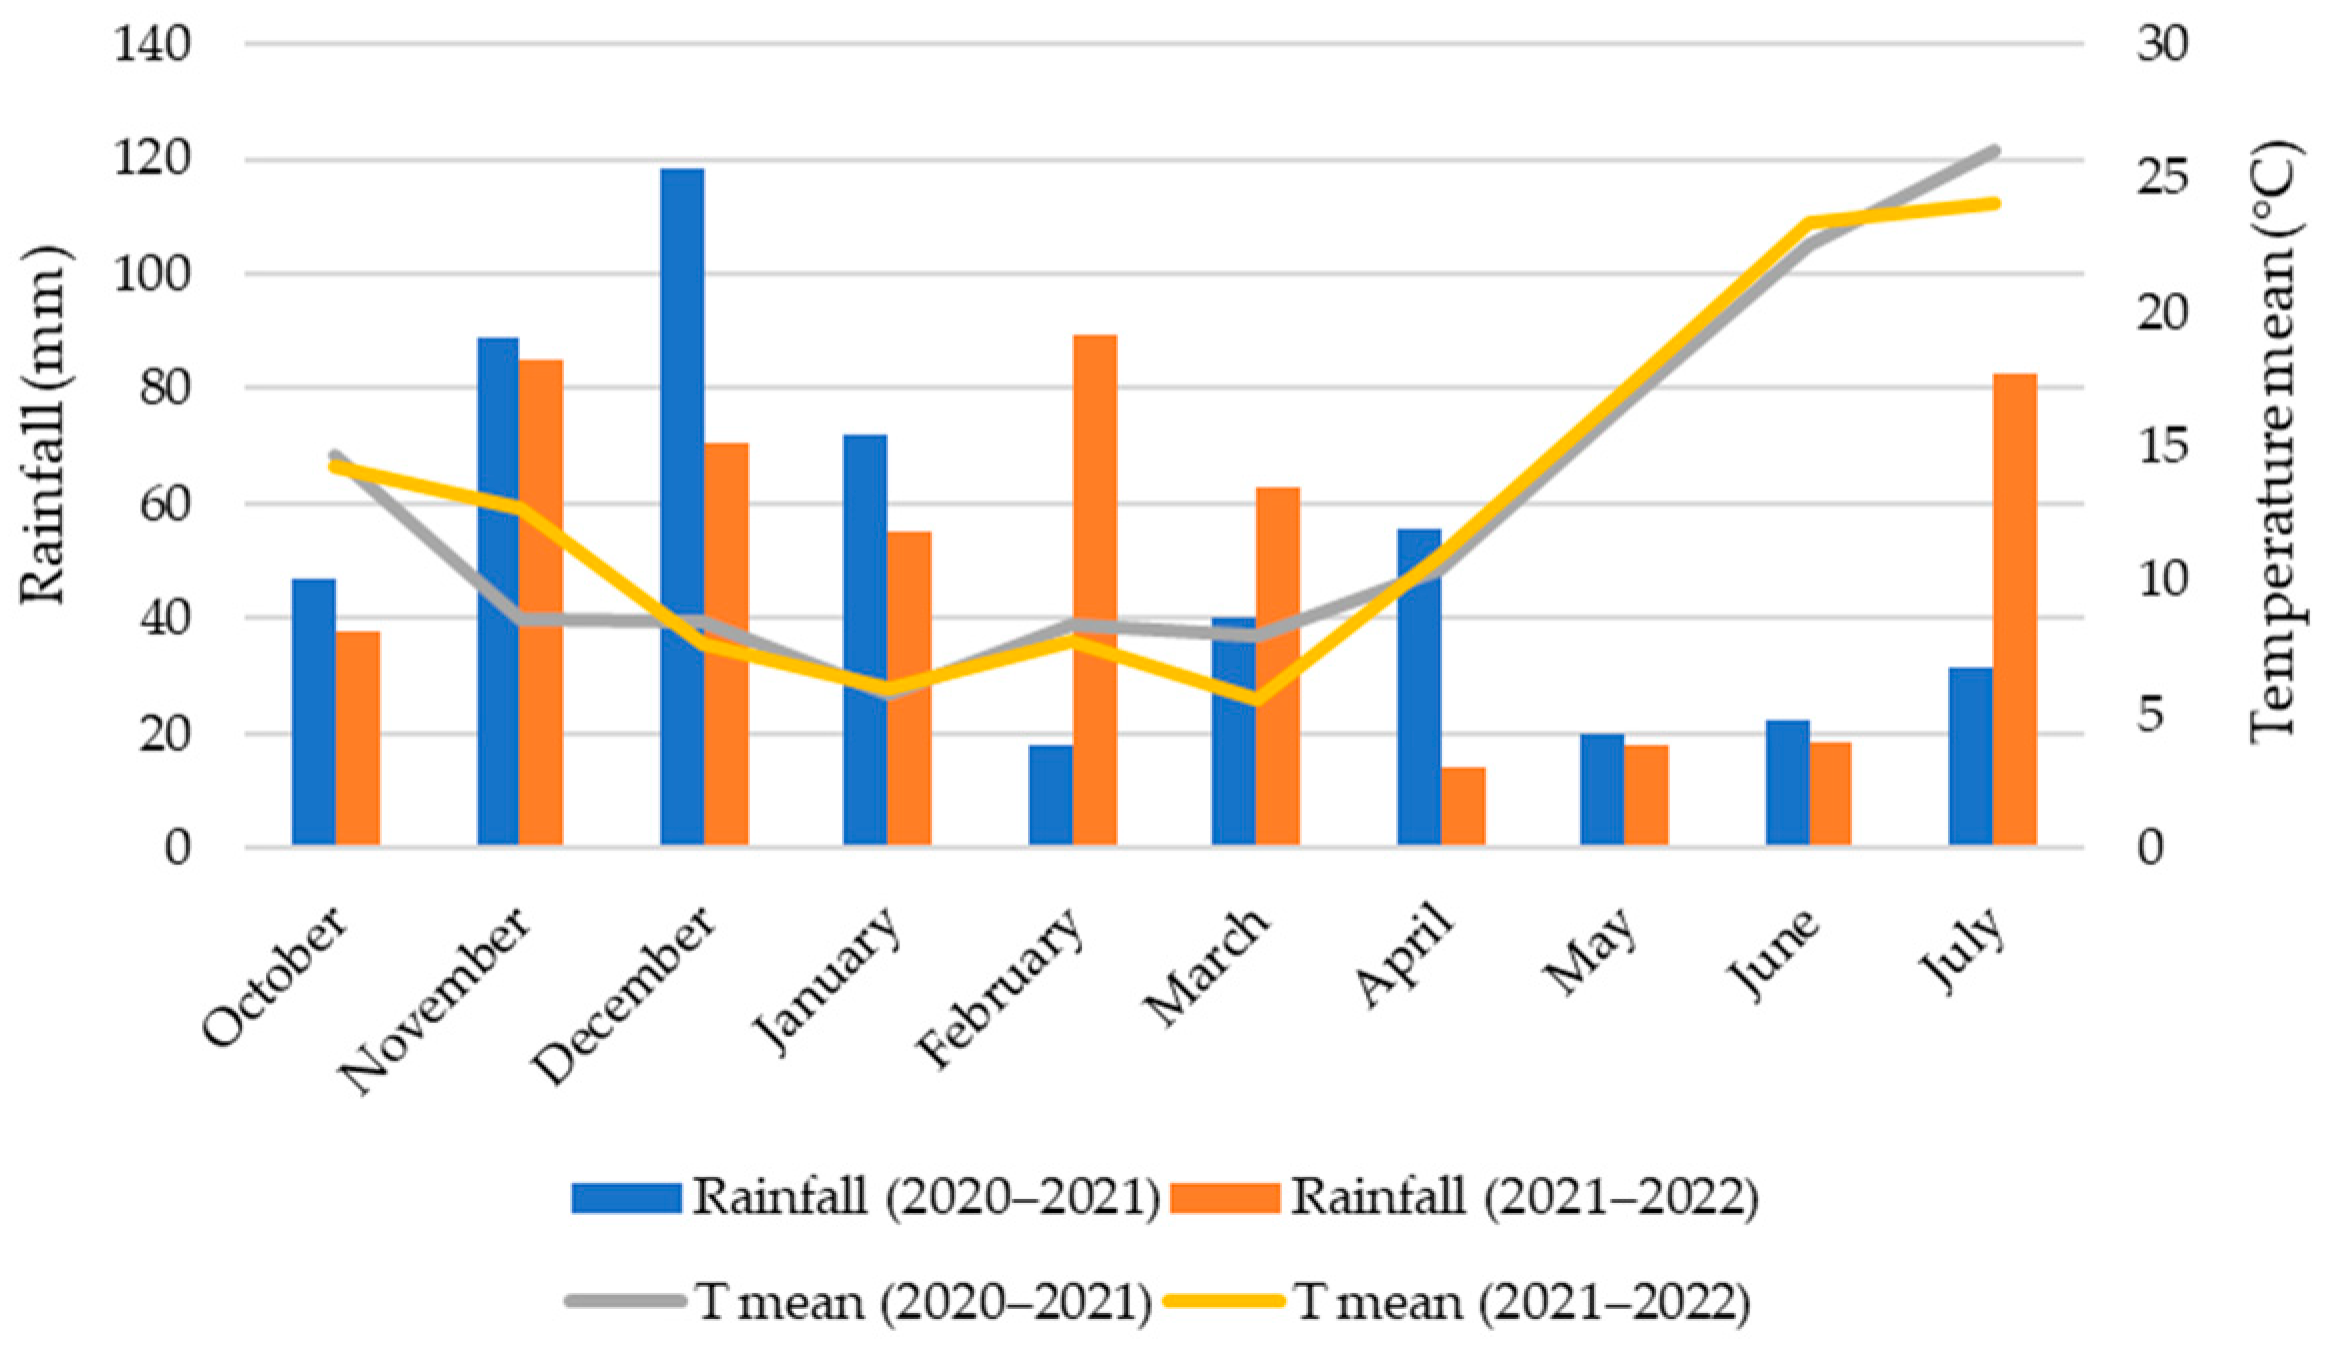
2.1. Site Description and Climate Conditions

The experiment was conducted concurrently in both open field and pot setups in Noci, Puglia, southern Italy (40°79′18″ N, 17°08′13″ E; altitude: 420 m a.s.l.) over two crop cycles (2020–2021 and 2021–2022). The area was characterized by a typical Mediterranean climate, with air temperatures dipping below 0 °C in winter and exceeding 40 °C during the summer. The historical average annual rainfall is approximately 590 mm, with precipitation unevenly distributed throughout the year and primarily concentrated between October and April (Figure 1).

2.2. Experimental Design and Crop Management

Globe artichoke (Cynara cardunculus L. var. scolymus (L.) Fiori, cultivar Brindisino) plantlets, inoculated and not inoculated (control) with AMF in the greenhouse, were transplanted into the open fields and pots in October 2020. For the open field test, each plot (5 m × 5 m) was characterized by loamy-clayey-loamy soil and contained 20 plants (about 8000 plants ha−1). Since mycorrhizal hyphae generally spread at a rate of 1.5–2 m per year in soil [27,28], plots were placed 10 m apart to inhibit mycorrhizal colonization of the other artichoke plants. The experiment followed a split-plot design with two irrigation treatments (GW: locally sourced groundwater and TWW: treated wastewater), as main factors, and three AMF inoculation treatments, as sub-factors. Inoculations of AMF were performed in accordance with the protocol described by De Mastro et al. [29], and included (1) a crude inoculum of Septoglomus viscosum (syn. Glomus viscosum) (MSE), (2) an inoculum of Rhizophagus irregularis (syn. Glomus intraradices) and Funneliformis mosseae (syn. Glomus mosseae) (MSY), and (3) a non-inoculated control (CON).
The pot trial was conducted using GW, TWW, and GW spiked with eight commonly detected PhACs in wastewater (SGW) at a concentration of 200 μg L−1. The PhACs were three antibiotics (CLR: clarithromycin, SMX: sulfamethoxazole, and TMP: trimethoprim), one antiepileptic (CBZ: carbamazepine), two anti-inflammatories (KET: ketoprofen and NPX: naproxen), and two antifungals (FCZ: fluconazole and CLZ: climbazole) (Table 1). Details of the preparation of the pot trial are reported elsewhere [29].
Each combination of irrigation and AMF inoculation was replicated in four blocks. For both experiments, a drip irrigation system with a single plastic pipe and two 2 L h−1 drippers was used for all treatments. Soil moisture was monitored with smart sensors (X-Farm Technologies srl, Valmacca, Italia) placed in the top and middle soil layers for each treatment and replication, triggering irrigation when moisture fell to 25% of the available water capacity. During the growing season, in addition to weed and pest management, fertilizers were applied to artichoke plants using the rates reported by De Mastro et al. [29].

2.3. Water, Soil and Plant Sampling and Analysis

During each growing season, irrigation water, soil and plants were sampled multiple times to monitor variations during crop cycles. GW and TWW samples were collected monthly in triplicate using sterile 1000 mL glass bottles, transported to the laboratory and analyzed within 24 h to determine conventional physical and chemical properties according to APHA [39]. PhACs concentration in GW and TWW samples was analyzed with the analytical technique of high-resolution mass spectrometry and ultra-pressure liquid chromatography using an online solid phase extraction method with previously optimized analytical settings [40], and the operating conditions reported by De Mastro et al. [29].
Soil samples were collected in triplicate at a depth of 0–0.3 m in the areas wetted by the drippers before the beginning of the test and at the end of the first and second crop cycles for both experimental trials. The main soil chemical and physical parameters were determined according to the analytical methods of Swift et al. [41].
Roots, leaves, stems, and heads of artichokes were collected in triplicate at the same time as the soil samples and immediately transported to the laboratory for analysis.
Modified QuEChERS methods [29,42] were used for PhACs extraction from soil and different parts of the artichoke plant. The same analytical technique used for water samples was applied to determine the concentrations of PhACs in all plant organs.
The number of heads per plant, head diameter, and the weight of fresh heads were measured only for plants grown in the open field, and were calculated as cumulative values of all main and second-order flower head harvests after complete removal of the floral stem.
Root colonization by AMF (mycorrhizal frequency in %) was assessed at the end of the first and second crop cycles of the open field test and at the end of the second crop cycle of the potted trial. Three root samples per plant were collected, washed with tap water to remove soil residue, and prepared for microscopic observation according to the method of Phyllips and Hyman [43]. The percentages of colonization were measured under an optical microscope (Leica DMLB100, Buccinasco, Italy) following the method outlined by Trouvelot et al. [44].

2.4. Pharmaceutical Active Compounds (PhACs) Uptake and Translocation Factors

The propensity of each PhAC to translocate from the soil to the artichoke plant was assessed by the uptake factor (UF), calculated using Equation (1) [45]:
UF = Cplant/Csoil
where Cplant is the concentration of each contaminant in the plant and Csoil is its corresponding concentration in the soil.
Each PhAC can accumulate itself in the root apparatus or can translocate to other organs of the plant. This behavior was assessed by the translocation factor (TF), calculated according to Equation (2) [46]:
TF = Cao/Croot
where Cao is the concentration of each PhAC in the aerial organs of the plant, such as leaves and heads, and Croot is its corresponding concentration in the roots.

2.5. Statistical Data Analysis

All experimental data were tested against the normal distribution of variables (Shapiro–Wilk test) and the homogeneity of variance (Bartlett test) using R studio software, version 4.1.3. The variables were then subjected to the suitable ANOVA and post-hoc test. The difference was significant when the p value ≤ 0.05.

3. Results and Discussion

3.1. Assessment of Mycorrhizal Frequency

The values of the mycorrhizal root colonization, measured at the end of the first and second crop cycles of the open field test, are reported in Figure 2a. The results, expressed as mycorrhizal frequency, show that the highest values of mycorrhizal colonization were observed at the end of the first growing season, while a reduction of about 10% of infection for all the treatments and AMF tested occurred in the second cycle. The highest colonizations were obtained in the presence of TWW, achieving values of more than 60% of frequency in the first year, and between 55% and 58% in the second year. Between MSY and MSE, the colonization of the former AMF was slightly lower than the latter (on average 59.2% vs. 63.33% in the first year, and 48.0% vs. 53.0% in the second year, respectively).
In contrast, the application of TWW in the pot trial resulted in a significant reduction in MSE with respect to MSY, and a similar trend was observed in the pots irrigated with SGW, where the frequency of MSE was numerically lower than MSY (Figure 2b). The declining trend of MSE colonization can be attributed to the presence of two fungicides, i.e., FCZ and CLZ, in the cocktail of PhACs added to GW, that may have exerted a slow but more selective inhibitory effect on Septoglomus viscosum than the other two fungi present in MSY.

3.2. Characteristics of Soil and Water Used for Irrigation

3.2.1. Soil

The main chemical and physical properties of the soils and their changes over time are given in Table 2.
The water used for irrigation affected all soil parameters evaluated except for pH and total CaCO3. Similar results were reported by Rusan et al. [47] after the long-term WW irrigation of soil. TWW increased electrical conductivity (EC), total nitrogen (TN), and available phosphorus (Pava) in the soil at the end of the first crop cycle, while an increase in soil organic matter (SOM) content was observed at the end of the experimental trial. These results can be ascribed to the chemical and physical properties of WW. The significant EC increase can be attributed to the higher salt and total dissolved solids (TDSs) concentrations in TWW, which is in agreement with what has been reported in the literature [48]. Additionally, the use of TWW improved TN and Pava, which is notably higher especially in the second year. Similar trends have been observed by Li et al. [49] and Castro et al. [50]. According to Alrajhi et al. [51], using TWW for irrigation, total N percentage increased by 4% in soil due to the presence of urea and other nitrogen compounds commonly contained in urban wastewater [52]. In our study, the SOM content increased with TWW irrigation only at the end of the second cycle. This is likely due to an initial boost in microbial input from TWW, which enhanced soil microbiological activity and contributed to SOM losses [53]. Relative to mycorrhizal treatment, as found by Brunetti et al. [17], no significant differences were observed for some soil physicochemical parameters, such as pH, Ntot, OC, and OM. However, EC and Pava content were notably higher in MSY soil. In fact, AMF play a crucial role in improving P availability in soil since they accelerate the transformation of P into bioavailable forms through various chemical reactions and biological interactions [54]. Recent studies revealed that AMF lack the capacity to release phosphatases into the soil [55]. However, they recruit phosphate-solubilizing bacteria which produce phosphatases that mineralize organic P [56,57]. Additionally, AMF contribute to phosphorus solubilization by converting inorganic phosphates into soluble forms through processes such as acidification, chelation, exchange reactions, and the production of organic acids, and other metabolites [58,59].
Finally, no difference was observed between soil parameters irrigated with SGW and GW.

3.2.2. Water

Characteristics of the analyzed TWW and GW during the two growing seasons of the artichoke are given in Table 3.
Regarding the pH main values, which greatly influence the dissociation of studied PhACs, the analyzed TWW samples were moderately alkaline (7.22–7.30) and within the National (6.0–9.5) and FAO guidelines (6.5–8.5) for irrigation use. The EC mean values ranged from 0.9 to 1.08 (dS m−1), indicating that the analyzed TWW samples were within the National maximum allowable EC value (3 dS m−1) and fall within the FAO specified range (0.7–3.0 dS m−1) for slight to moderate restrictions on irrigation water. These results are partially in line with Muscarella et al. [62] and Urbano et al. [63] who found slightly higher pH values in TWW used to irrigate tomato and lettuce plants, while EC were very similar to the values observed in our experimental test. The mean TSS concentration ranged from 0.75 to 2.36 mg L−1, which is well within the limits set by Italian (10 mg L−1) and EU (35 mg L−1) guidelines. The mean biochemical oxygen demand (BOD5) and chemical oxygen demand (COD) levels suggest that the TWW has higher organic content compared to GW. This may affect the bioavailability of weakly acidic PhACs, as polar interactions between acidic PhACs and dissolved organic matter in the WW can lead to the formation of water-soluble complexes. These complexes are less available for uptake and/or co-sorption onto solid phases in the soil, which in turn reduces their concentration in the soil solution [64,65]. The mean values of BOD5 and COD measured (9.80–10.80 and 22.57–20.10 mg L−1, respectively) were below the limits established by the Italian guidelines (20 and 100 mg L−1, respectively) and in agreement with Cirelli et al. [66], who found similar values in TWW used to irrigate eggplant and tomato plants. Finally, bacteriological results showed higher loads of TC (1556.19–1456.20 MPN 100 mL−1) and E. coli (596.69–606.10 MPN 100 mL−1) in the examined TWW collected samples (Table 4). TC is a heterogeneous group of different bacterial species having some common characteristics, whose E. coli species is a member. The mean E. coli levels exceeded the Italian regulatory limit but remained within the EU limit of 1000 MPN/100 mL.

3.3. Pharmaceutical Active Compounds (PhACs) in Irrigation Water

Table 4 reports the PhACs concentration in GW and TWW.
The GW did not have any PhACs, while several PhACs were detected in TWW in two years of investigation. The presence of these compounds in TWW used for irrigation raises concerns about their potential accumulation in crops and subsequent transfer into the food chain. In literature, PhACs concentrations in TWW range from low ng L−1 to low μg L−1 [67,68,69]. In our trial, the concentrations of PhACs were about a few µg L−1. The highest concentration was observed for CBZ (0.54 µg L−1 in the first year and 0.51 µg L−1 in the second year) followed, in the second year, by SMX and FCZ. This concentration range aligns with findings from other studies that reported PhACs in WW [69], and in reclaimed wastewater used for irrigation [68], suggesting that the detected PhACs are relatively persistent. Our results are in agreement even with the findings of Ternes et al. [70], who identified 52 CECs in secondary reclaimed wastewater used for irrigation in Braunschweig, Germany. Detected compounds included trimethoprim, sulfamethoxazole, clarithromycin, erythromycin, carbamazepine, metoprolol, clofibric acid, diclofenac, and caffeine.
Some PhACs, however, were not detected in our second-year experimental samples. In general, the water solubility of a compound, its pKa (acid dissociation constant) and Kow (octanol/water coefficient) are key factors influencing its behavior in the environment.
In particular, the pKa values of PhACs affect their interaction with other molecules. The charge state of pollutants, determined by pKa under different pH conditions, significantly influences their absorption, distribution, metabolism, excretion, and toxicity [71]. When the pKa of a compound is higher than the water pH value, as in the case of CLR, the molecule exists predominantly in its non-ionized form. This form is generally less soluble in water due to reduced interactions with water molecules. Among the PhACs investigated, CBZ also has a pKa higher than the pH of the WW. Its presence, however, can be attributed to the high dosages administered to patients (800–1200 mg day−1) [72]. Furthermore, the absence of CLZ, TMP, NPX, and KET in the TWW used for irrigation of artichoke may be due to their Kow, since molecules with a logKow > 3, such as the previous PhACs, are classified as hydrophobic and not retained by soils [73].

3.4. Dynamics of the Pharmaceutical Active Compounds (PhACs) in the Soil–Plant System

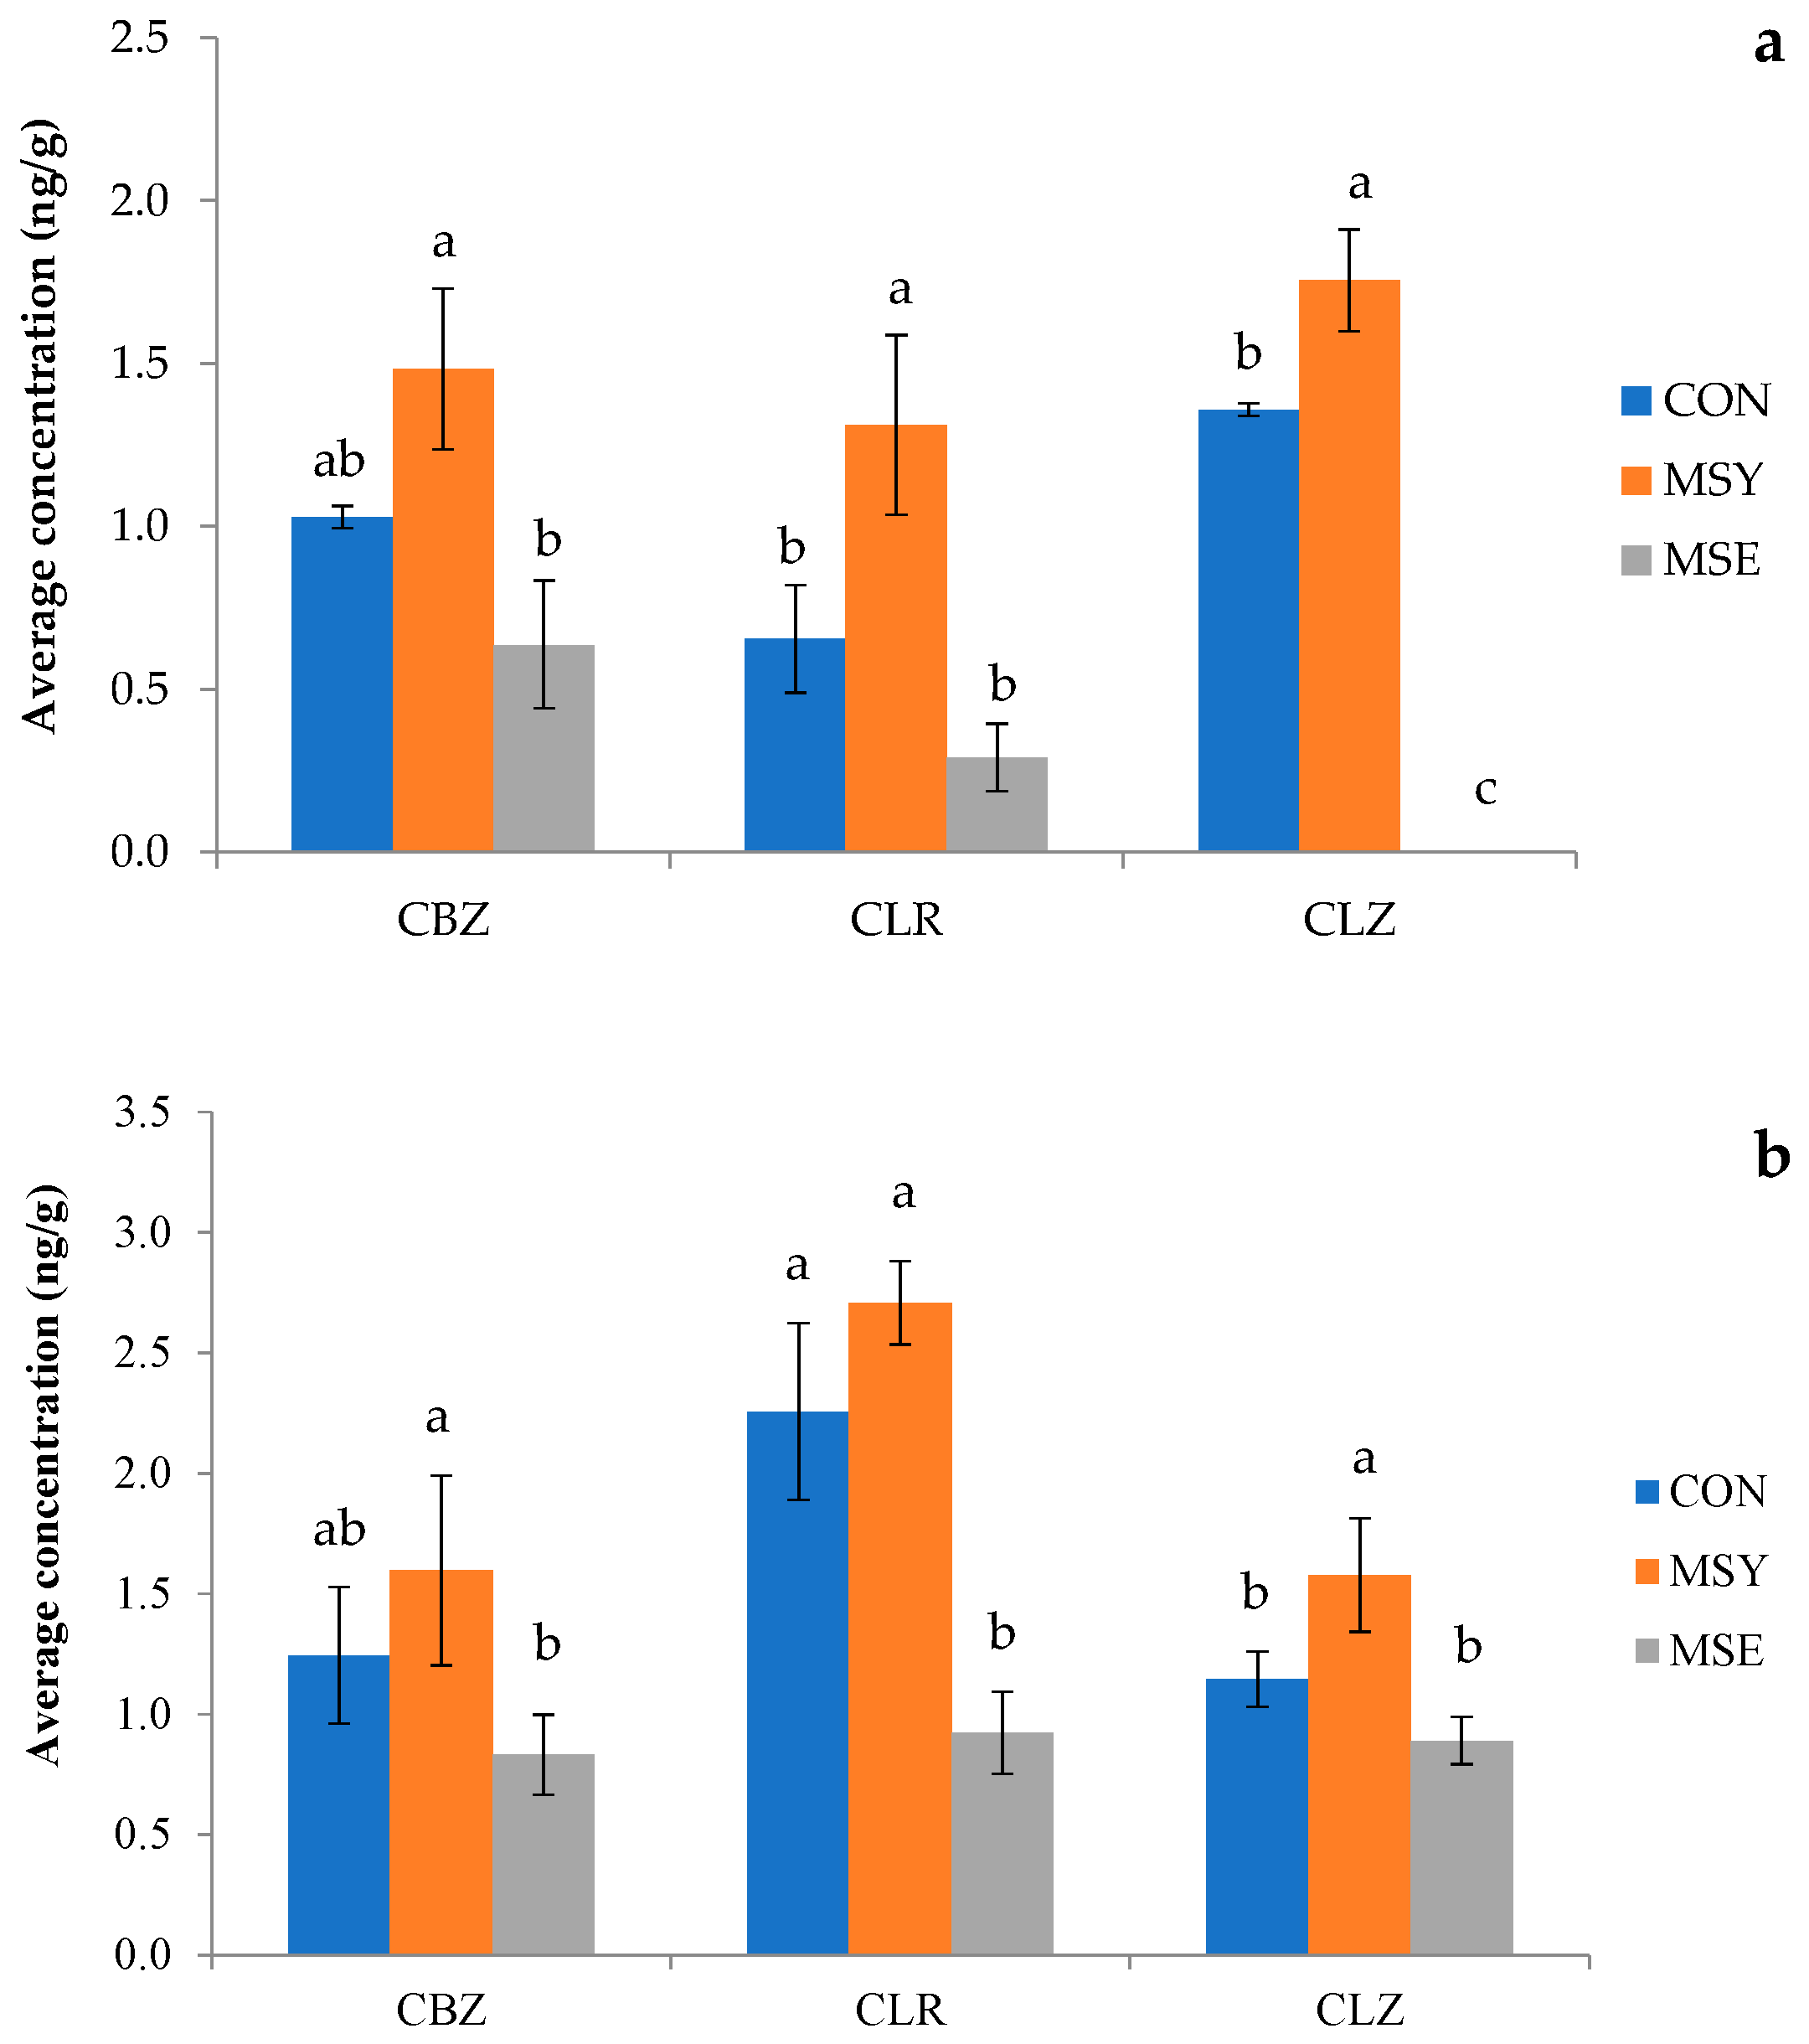
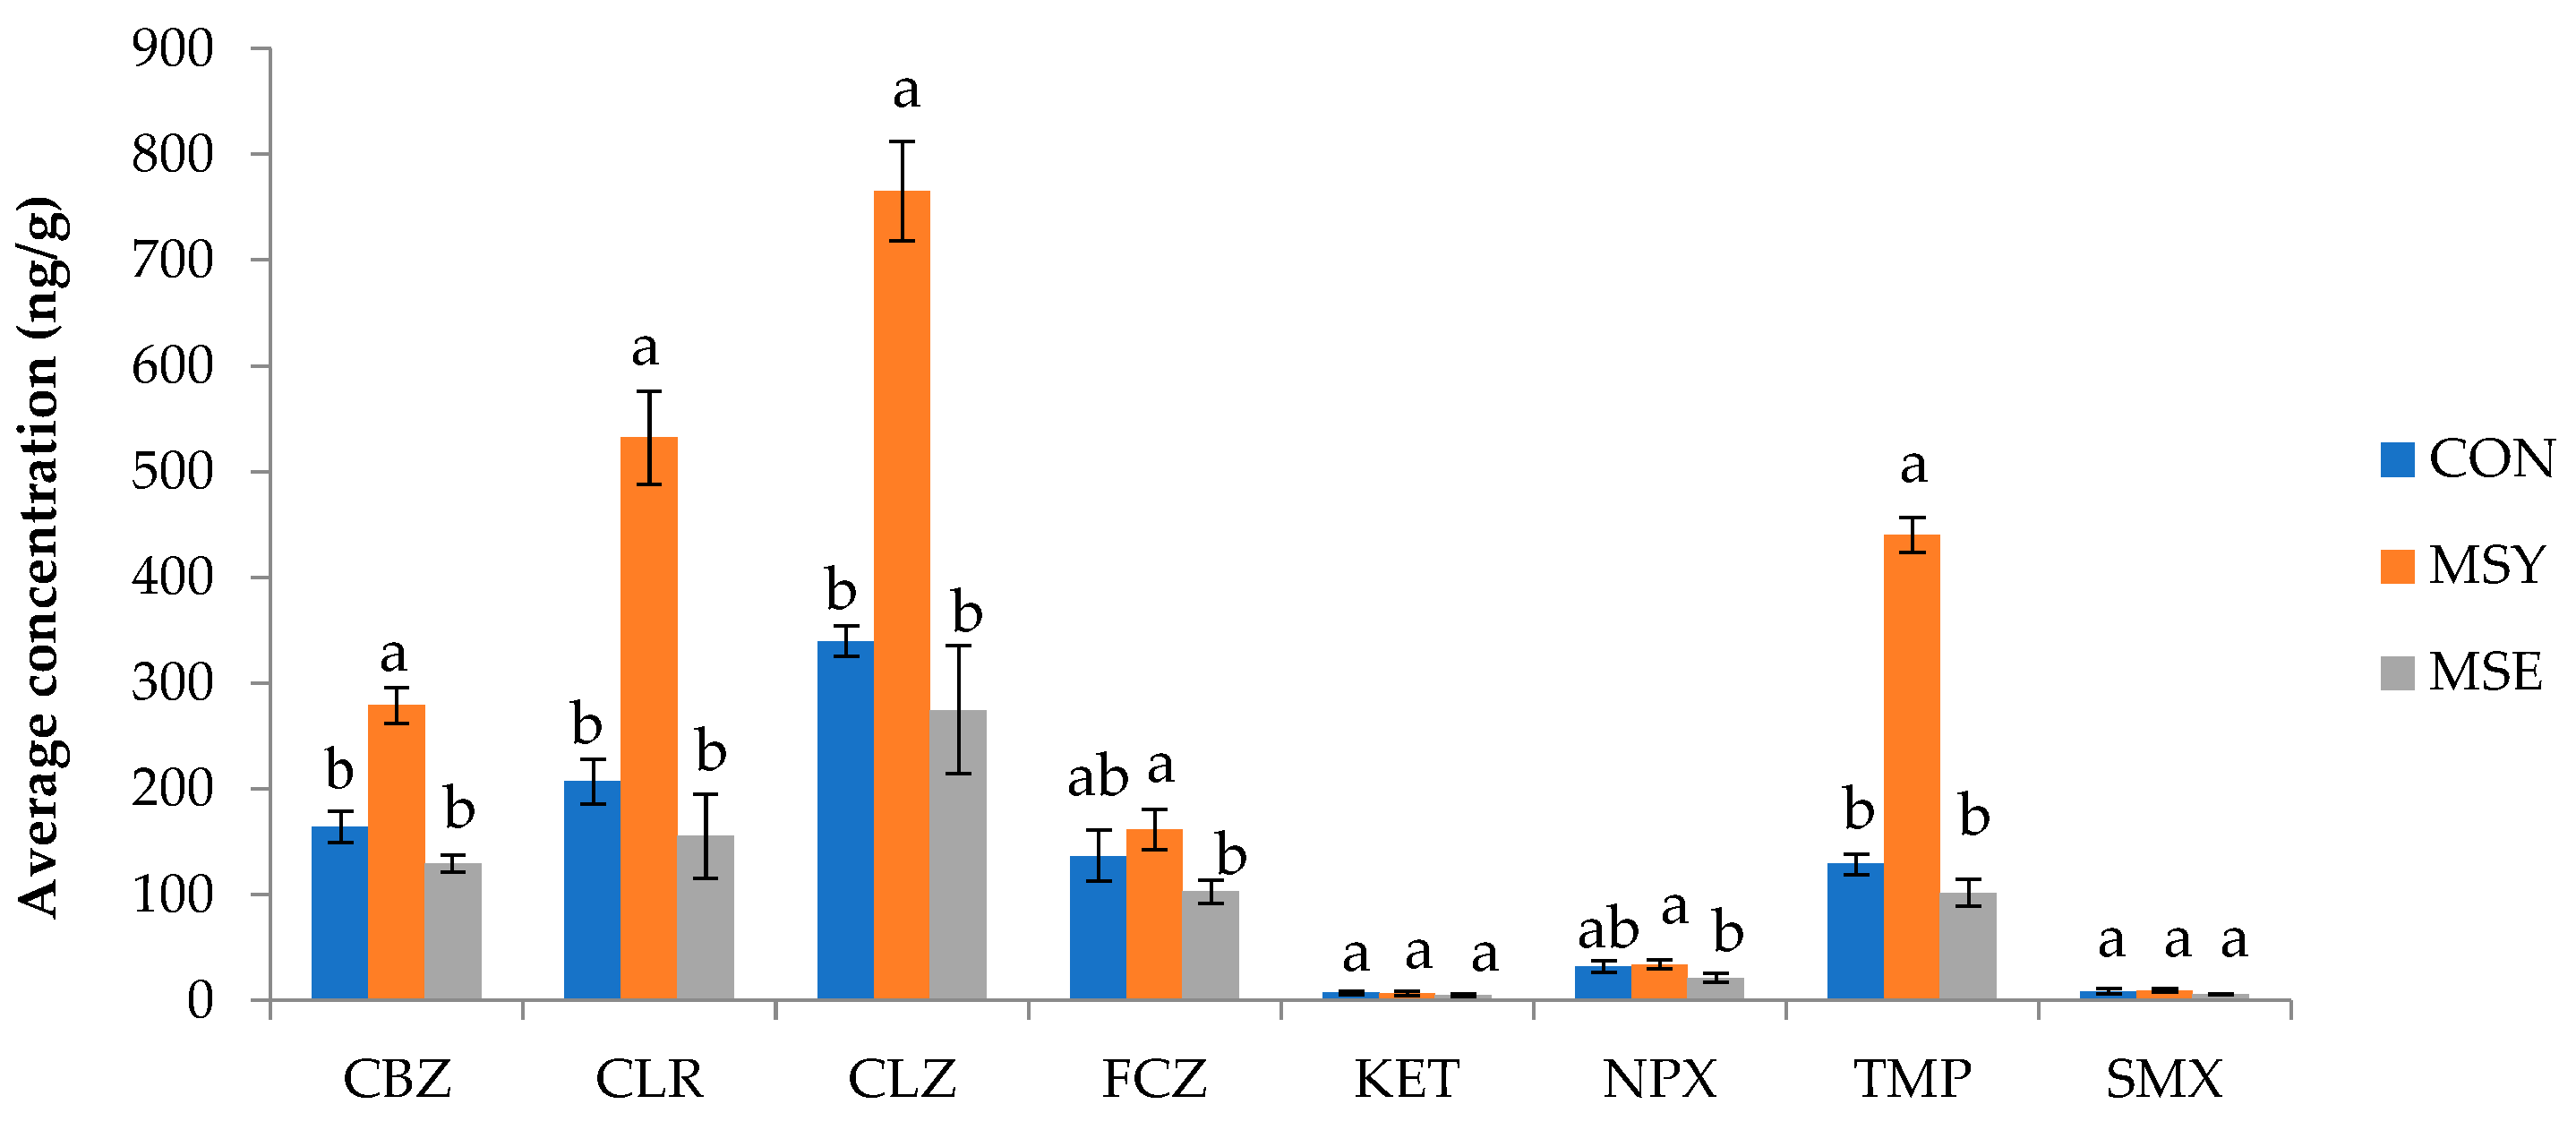
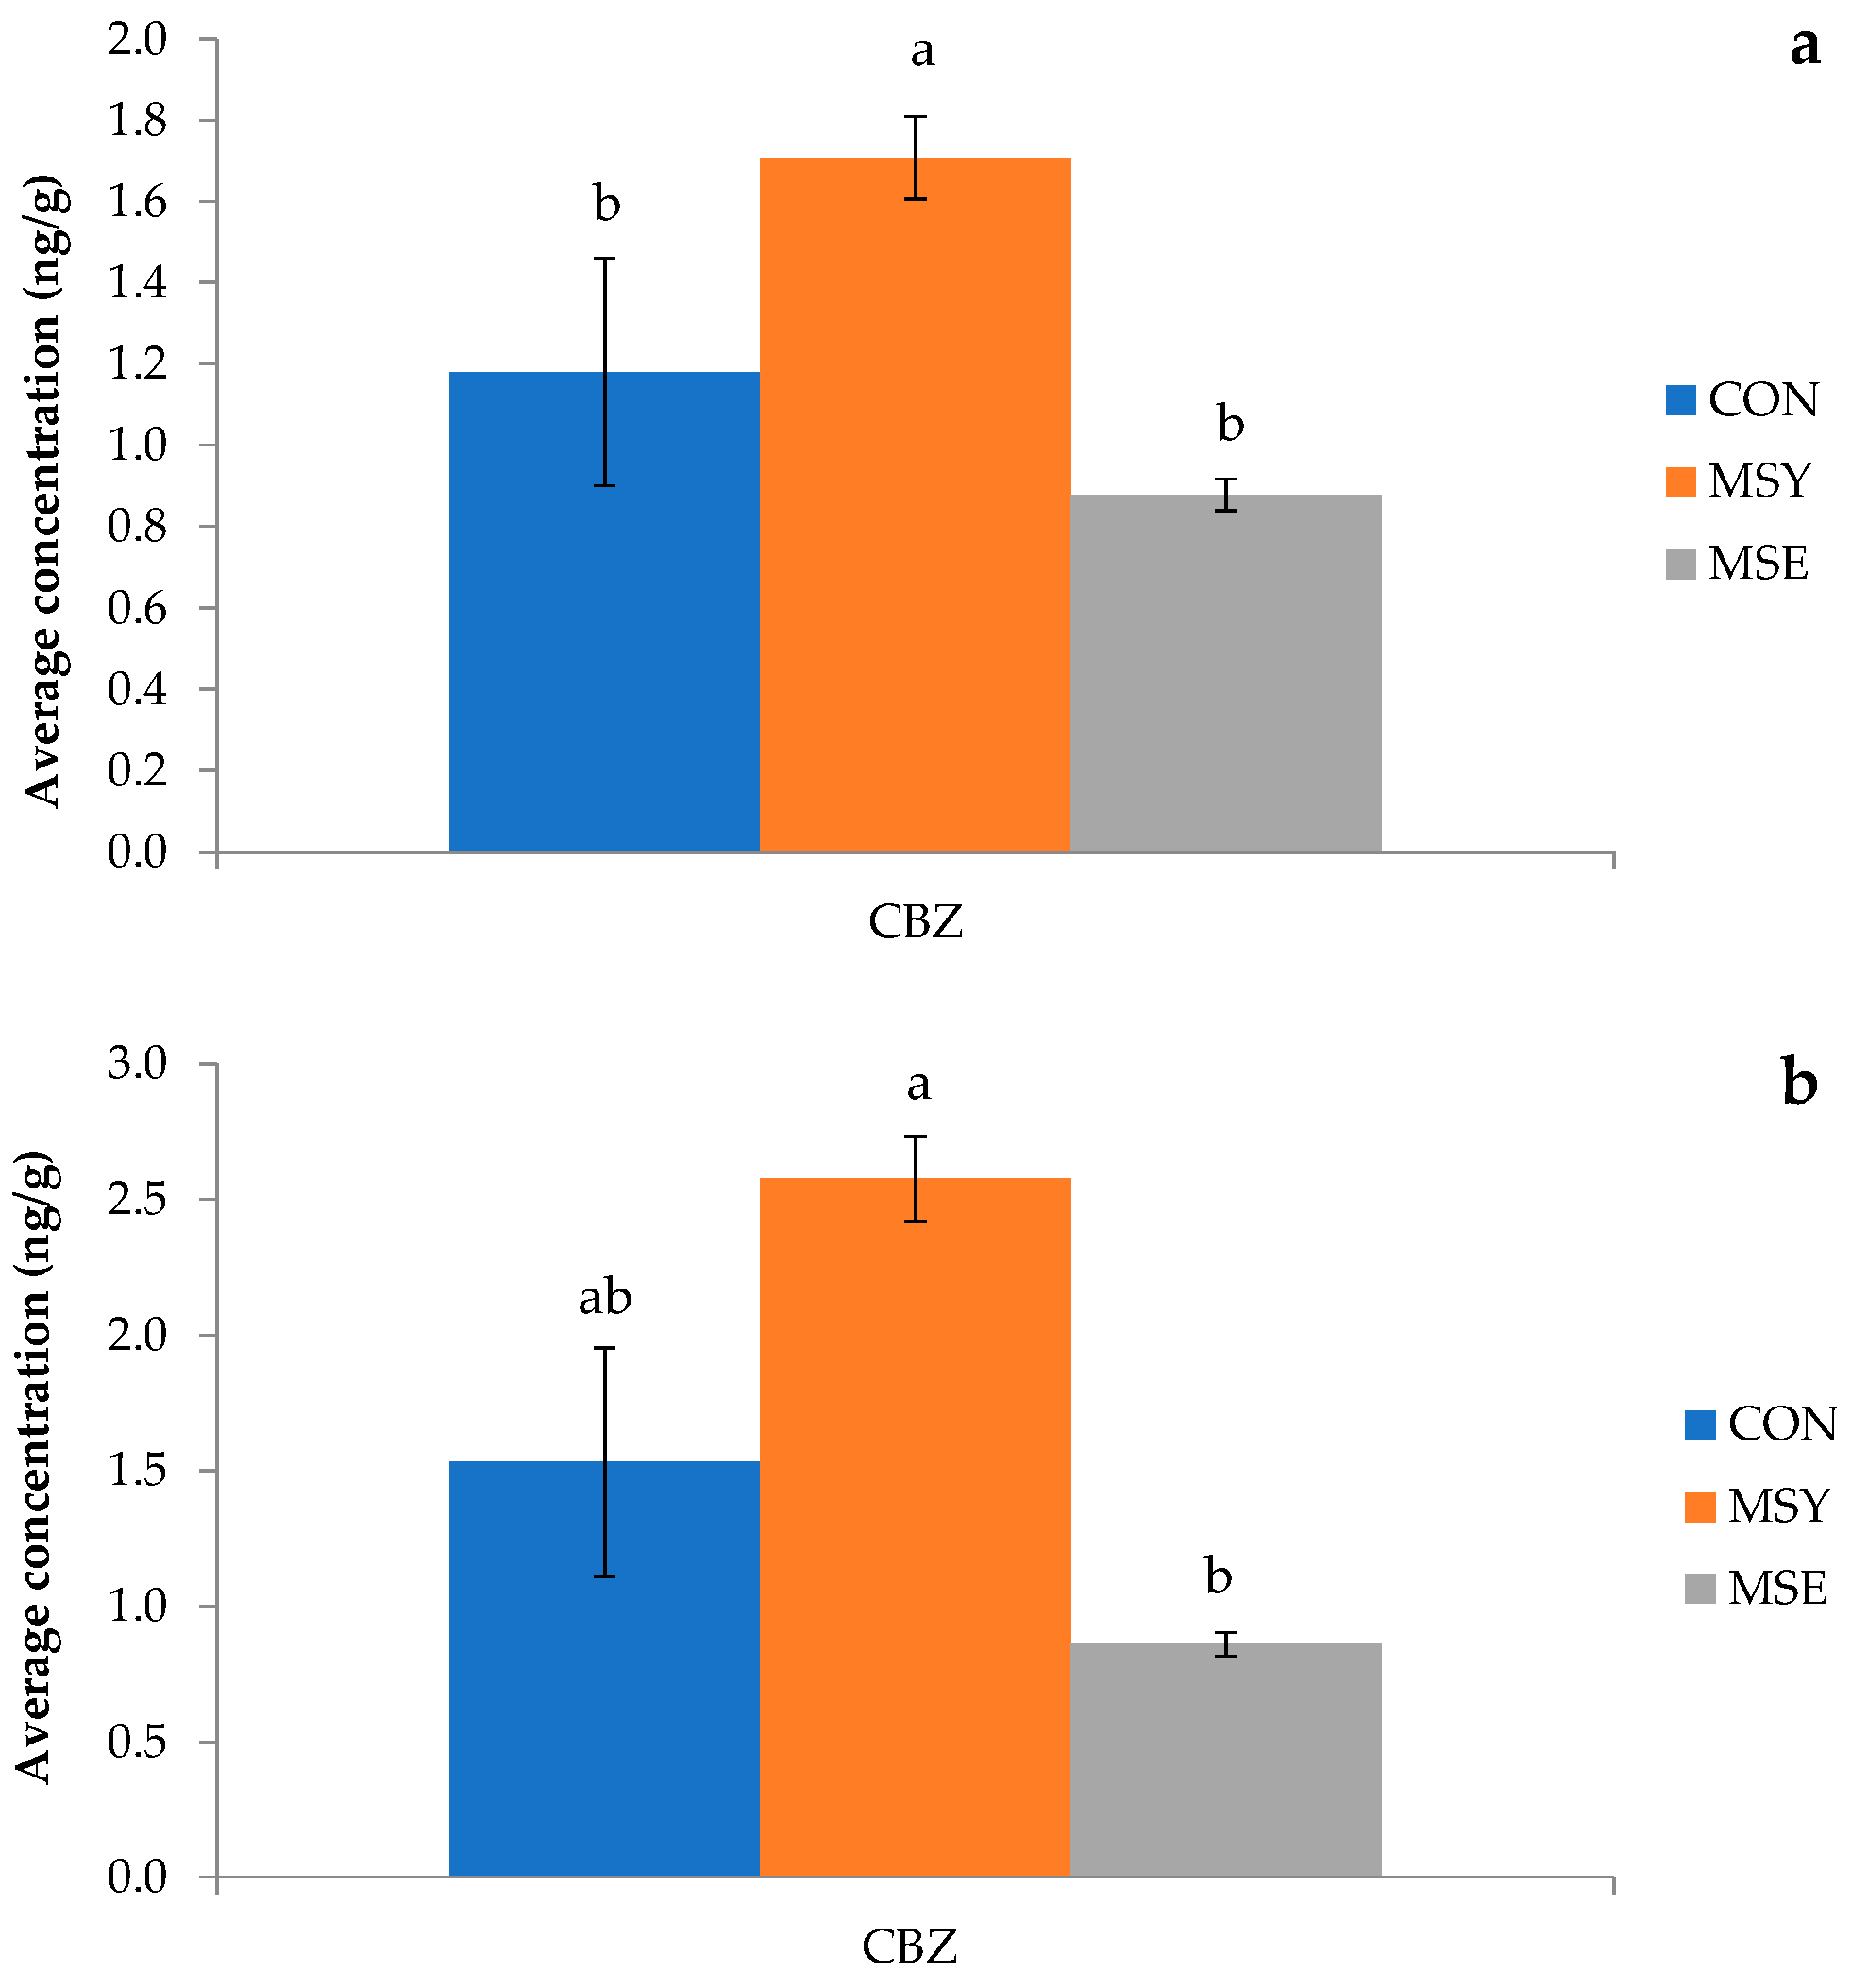
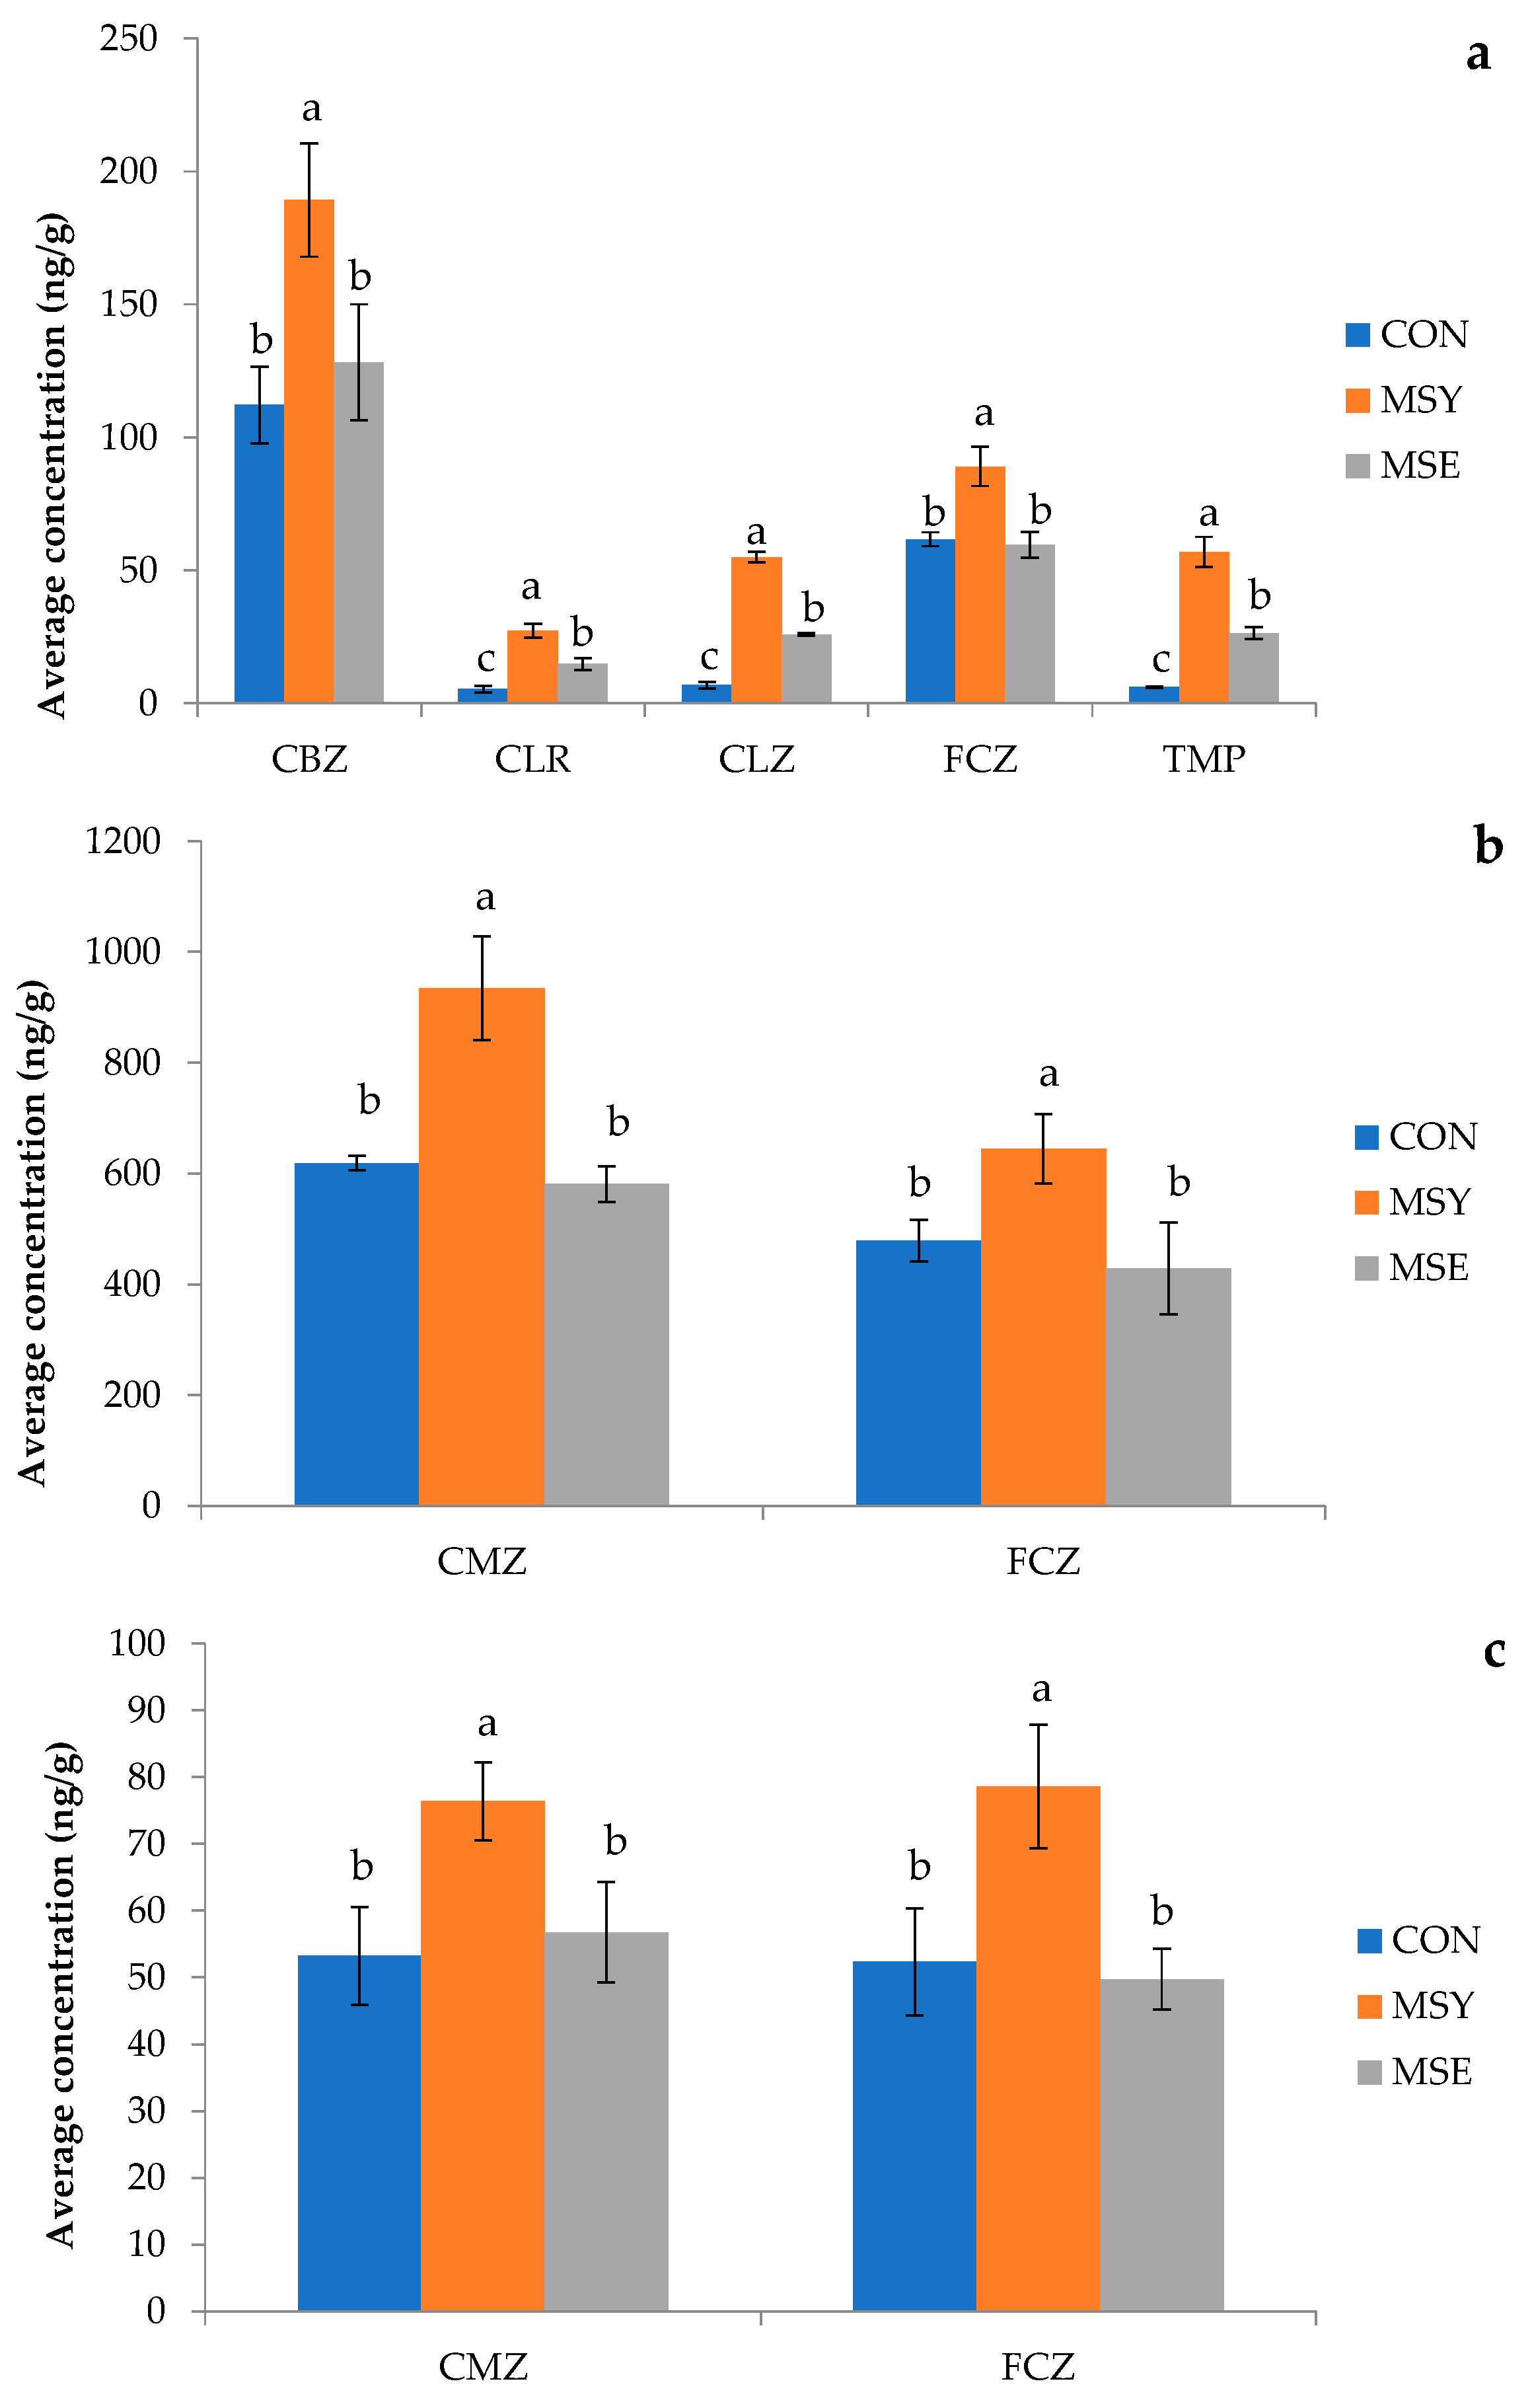
3.4.1. Pharmaceutical Active Compounds (PhACs) in Soil

Soil is considered as one of the final destinations of chemical wastes [74]. The uptake, degradation, and accumulation of PhACs within the soil–plant system are influenced by their physical and chemical properties [75]. However, research on the behavior and dynamics of PhACs in soil and plants irrigated with reclaimed water remains limited. In this study, soils irrigated with GW showed no detectable PhACs, either in open field or in pot experiment. In contrast, when TWW was used to irrigate open field and pots trials, only trace amounts of CBZ were found at the end of the first cycle. At the end of the second experimental year, trace residues of three of the eight compounds searched were detected in soil samples from both open field and pot trials (Figure 3a,b).
The concentration of the three PhACs detected in soils irrigated with TWW was in the range of a few ng/g and was consistent with that reported in numerous other studies that have detected PhACs in soil environments. For example, Ben Mordechay et al. [67] found that CEC concentrations in soils irrigated with reclaimed WW ranged from low ng g−1 to tens of ng g−1. In particular, the range of the mean concentrations of CBZ, CLR, and CLZ was very similar to each other. This result, especially for the antibiotic and antifungal, was closely correlated with their relatively high kd values (262–400 and 123–200 L kg−1, respectively), which explained their retention in the soil. Regarding the CBZ concentration, it was very similar between the two experimental trials, confirming that this pharmaceutical is one of the most frequently and consistently detected in WW due to a limited removal efficiency (<10%) during conventional WW treatment processes [76,77]. Similarly, Kinney et al. [78] and Gielen et al. [33] identified CBZ as one of the most commonly detected PhACs in their study sites. The low concentration or absence of the other PhACs in soil samples can be attributed to the low detection frequencies of pharmaceuticals in water samples used for irrigation (Table 2). In addition, degradation processes in the soil and on its surface, due to sunlight, could justify the low concentrations observed.
Most of the PhACs were detected at the end of the second year in soil samples irrigated with SGW in the pot trial (Figure 4).
The concentration of these PhACs was much higher than those reported by De Mastro et al. [29] at the end of the first production cycle. These results confirm that prolonged irrigation with reclaimed water inevitably leads to the accumulation of pollutants in soil. In this regard, Christou et al. [65] reported that after three years of irrigation with reclaimed water, the concentration of PhACs in the topsoil layer was significantly influenced by both the duration of irrigation and the origin of the WW used. KET, NPX, and SMX exhibited lower concentrations in soil compared to the other contaminants. De Mastro et al. [29] and Mininni et al. [34] also reported low concentrations or absence of KET, NPX, and SMX in their experimental soils. These three compounds, which share similar molecular weight and negative charge at pH > 7, are characterized by weak interactions and limited sorption in soil, as indicated by their low soil–water sorption coefficients (Table 1) [64,79,80]. Furthermore, these compounds are characterized by high water solubility and were reported to be readily degradable in agricultural soils [81]. Other studies reported a similar behavior for SMX probably due to its low octanol/water partition coefficient (Kow) and low adsorption capacity, which may contribute to its high mobility and removal, assuming rapid degradation of sulfonamide antibiotics in the soil [82]. The other five PhACs were found at concentrations above 100 ng g−1 in both control and mycorrhizal soils. CLZ and CLR were the most abundant in MSY soil (765 and 532 ng g−1, respectively), followed by TMP, CBZ, and FCZ. This result was well correlated with the relatively low kd values of the latter PhACs (Table 1), which explain their poor retention in soil [30]. Similar results were found by Gallego et al. [5] in a greenhouse experiment involving two successive lettuce cultivation campaigns, using the same soil and irrigated with deionized and spiked water containing a mixture of 14 compounds.
In addition, all contaminants were more prevalent in MSY soil than in control and MSE soils, either in open field or in pot trial. This suggests that MSY and MSE, present at a comparable mycorrhizal frequency (Figure 1), differently influenced the fate of PhACs. MSE may have promoted a greater degradation of the contaminants compared to MSY due to the high antioxidase activities of Septoglomus viscosum and its higher adaptability to changing environments [83]. The MSY treatment may have favored the adsorption of PhACs on soil colloids and/or their uptake in plants, possibly due to a synergistic effect of the two fungi, present in its composition, on the aggregates stability [84].
It is known that the benefits of the plant–mycorrhiza association can differ depending on both the plant and the AMF species involved [85]. Regarding the artichoke, Avio et al. [86] reported that different mycorrhizae modulated the plant’s secondary metabolism in distinct ways, thereby influencing the microbial community in the soil responsible for degrading organic contaminants. Several studies have reported that mycorrhizal fungi can differently stimulate the release of root exudates and enzymes and/or improve soil structure, which in turn influences the degradation of contaminants [87]. In addition, the concentrations observed in MSE and CON soils were similar. In the control soil, the absence of competition with the mycorrhizal fungus may have favored a greater microbial presence, responsible for a rapid PhACs degradation. Lindahl et al. [88] demonstrated that mycorrhizal fungi can also suppress microbial activity to better compete for soil nutrients, confirming our thesis.

3.4.2. Pharmaceutical Active Compounds (PhACs) in Plant Organs

Only a few studies have investigated the uptake and accumulation of organic contaminants by plants irrigated with TWW over several cycles, both in pots and open fields, under realistic agricultural conditions. In our study, under TWW irrigation, no PhACs were found in all artichoke organs after the first year of irrigation, either in open fields or in pots, probably due to the low concentration of contaminants detected in TWW. Instead, at the end of the second experimental year, traces of CBZ were found in artichoke roots and leaves in both experimental trials (Figure 5 and Figure 6), but not in the edible parts, the heads.
Ben Mordechay et al. [67] found traces of PhACs in crops irrigated with recovered wastewater, with concentrations ranging from low ng g−1 to low µg g−1, depending on the plant and its organs (e.g., leaves, roots, fruits, or tubers). In roots and tubers, they confirmed concentrations <10 ng g−1. However, the results of our study revealed that two years of irrigation with TWW can lead to the uptake and bioaccumulation of some pharmaceuticals, such as CBZ, in all organs of artichoke except for the heads. Increased PhACs concentrations due to prolonged WW use were also confirmed by Christou et al. [65]. They observed higher concentrations of SMX and TMP (5.26 and 3.40 μg kg−1, respectively) in tomato berries harvested during the third year of the study.
The use of SGW determined a greater translocation of PhACs across all organs of the artichoke plants, even heads, in the pot test (Figure 7).
CBZ and FCZ showed higher concentrations in roots than other compounds, likely due to their chemical properties. In fact, these molecules have an intermediate lipophilicity (0 < Kow < 3) and a molecular weight < 500, that allow them to be easily absorbed by plant roots [89]. Higher concentrations of CBZ and FCZ were also measured in the roots in experiments conducted on tomato [90] and olive [34]. The increased root uptake capacity of CBZ and FCZ was further confirmed by their UF indexes (Table 5). In fact, the CBZ and FCZ UF values were much higher than those of the other PhACs, ranging from 0.66 to 0.99 and 0.46 to 0.59, respectively.
These two PhACs were also the only ones found at the end of the first growing season, as shown by De Mastro et al. [29], but at much lower concentrations. Furthermore, in contrast to the first year, the highest concentration was observed in the roots inoculated with MSY, rather than in the control, resembling the trend found in soils (Figure 4). CLR, on the other hand, was the pharmaceutical with the lowest concentration in the roots likely due to its high volume and molecular weight, factors that influence the translocation of the compound. Smaller molecules have been shown to more easily cross the Casparian strip in the root [91,92]. In contrast, anionic compounds such as KET, NPX, and SMX were not detected in the roots. This result can be attributed firstly to their low concentration in soil and secondly to the low permeability of cell membranes to ionic organic compounds in general [93].
Climbazole and FCZ were the only PhACs detected in artichoke leaves, stems, and heads when irrigated with SGW (Figure 7b,c) and their accumulation was directly related to the irrigation duration. The concentration of CBZ and FCZ at the end of the second year was more than double that observed after one year of SGW irrigation [29]. For example, in the leaves of plants inoculated with MSY, the concentration of CBZ increased from 400 ng g−1 in 2021 to 934.9 ng g−1 in 2022, while FCZ levels rose from 208.3 ng g−1 to 644.8 ng g−1 during the same period. The concentration of these two PhACs was significantly higher in the leaves and stems with respect to that in the roots and heads, as indicated by their UF values (Table 5). These results reflect those of Carter et al. [45], who also found higher UF values for CMZ in ryegrass, radish leaf, and radish bulb. In general, small-sized and neutrally charged compounds like CBZ and FCZ can be absorbed by plants and, moving through the symplastic pathway, can easily cross the Casparian strip, enter the xylem, and reach the aerial parts of the plant [94,95]. Several studies have also reported higher concentrations of CBZ in leaves compared to roots [96,97], suggesting a passive uptake of this compound not restricted by root membranes.
Climbazole and FCZ were also detected in the edible parts of the plant but only at the end of the second experimental year and at much lower concentrations than those found in the leaves (Figure 7c). This trend is also confirmed by their TF (Figure 8).
Specifically, both PhACs showed TF > 1 in leaves, indicating a stronger tendency for these compounds to accumulate in the leaves. Moreover, FCZ showed higher TF values (7.45, mean value) than CBZ (5.10, mean value) in the aerial parts of the plant. This difference can be attributed to their different logKow values (0.25 for FCZ and 2.45 for CBZ). More hydrophilic compounds, as FCZ, are translocated to a greater extent than the more hydrophobic compounds [98].
Regarding mycorrhiza, similar concentrations for both PhACs (about 75 ng g−1) were detected in the artichoke head of MSY plants, while significantly lower levels were observed in the other two treatments.

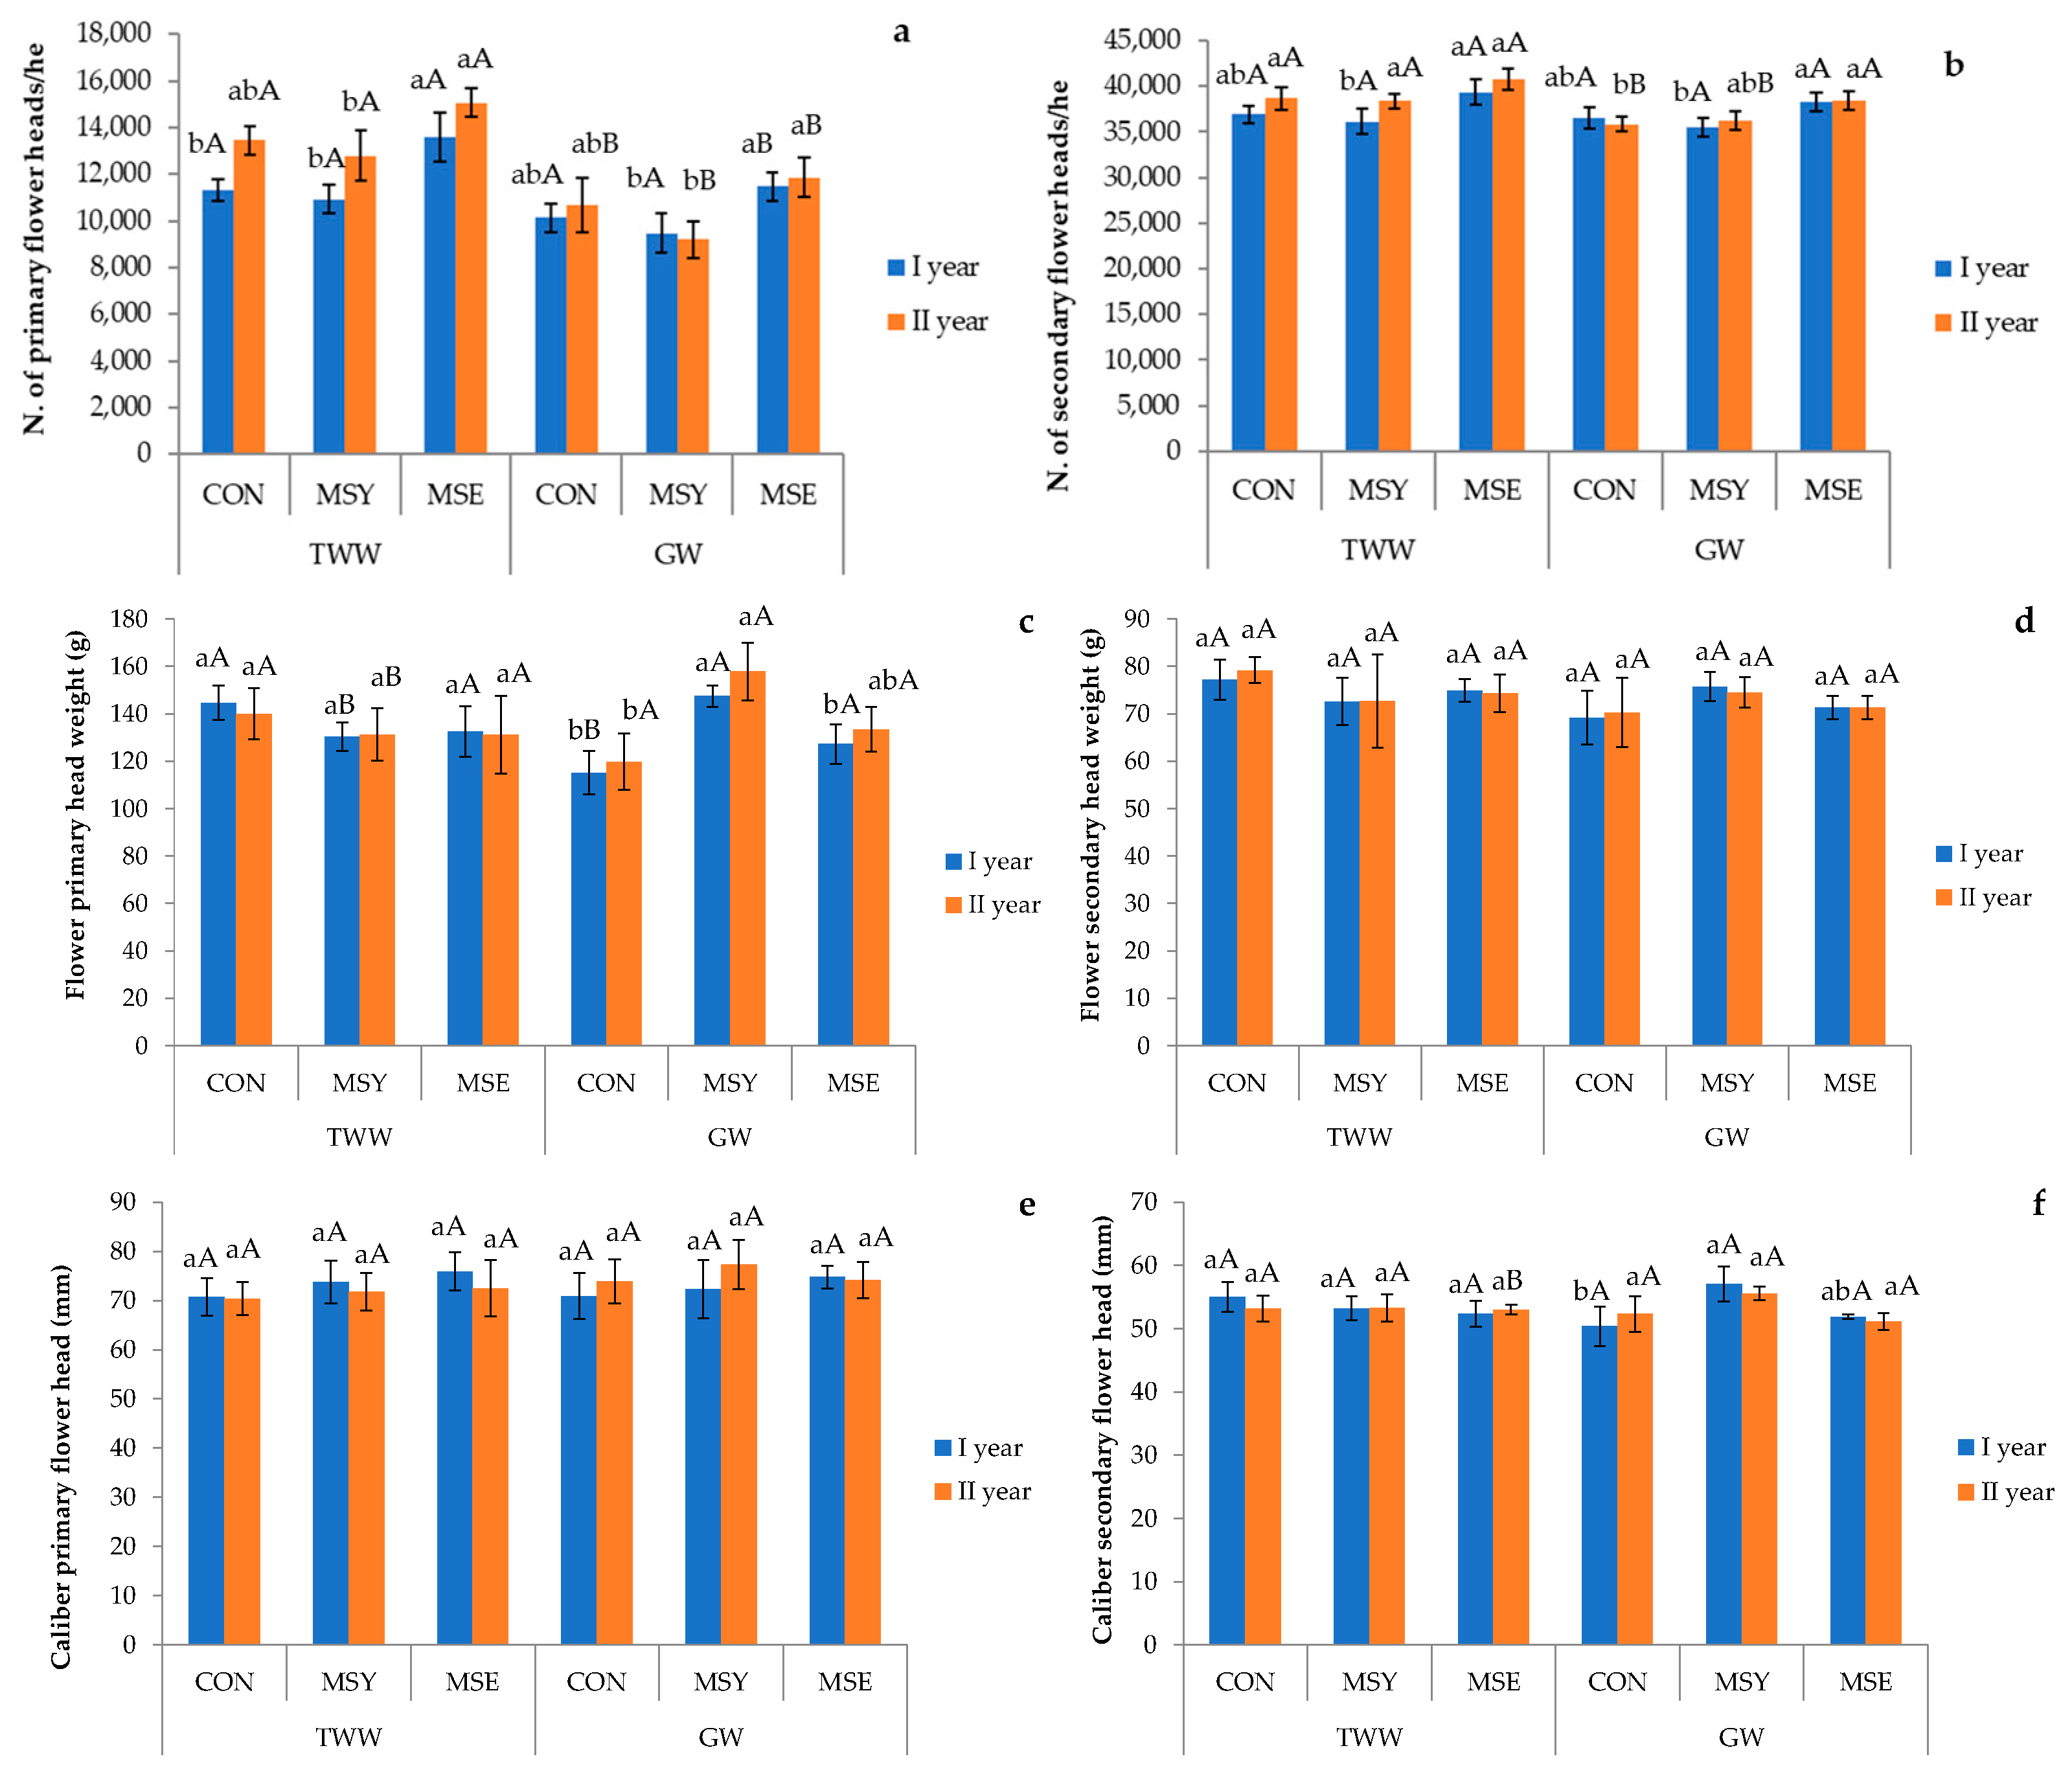
3.5. Artichoke Agronomic Parameters

Table 6 shows the effects of growing seasons, irrigation treatments, and mycorrhiza on the number of primary and secondary heads per hectare, weight, and diameter of heads.
The yield of primary and secondary artichoke heads, expressed in terms of head count per hectare, varied significantly across the two growing seasons, irrigation treatments, and mycorrhizal fungi.
Over the two experimental years, the number of primary heads per hectare was higher in 2022, reaching approximately 12,177 heads compared to 11,155 heads in 2021. A similar trend was observed for secondary heads, which constituted approximately 76% of the total production by the conclusion of the first production season and 78% by the end of the second. This variation in artichoke yield between growing seasons likely reflects the influence of climatic conditions during the trial (Figure 1). Higher average rainfall in the second growing season appears to have positively impacted yield. Previous studies have confirmed that climate variability can significantly affect crop yields [99,100]. According to Rezaei et al. [101], under severe climate change scenarios, crop yield losses could range from 7% to 23%.
Total marketable heads yield per hectare increased significantly under TWW. Specifically, plants irrigated with TWW produced a higher number of primary and secondary heads compared to those irrigated with GW (12,866 vs. 10,466 primary heads and 38,377 vs. 36,800 secondary heads, respectively). This difference was due to the higher concentration of plant nutrients of TWW (Table 4). The positive effect of TWW was much more evident for the second growing season for both types of heads (Figure 9a,b), confirming the positive correlation between TWW irrigation frequency and soil nutrient concentration.
Our results agree with those reported in other similar studies, which have highlighted the positive effects of TWW irrigation on crop yields. The application of TWW improved carrot plant growth and increased soil nutrient levels in the experimental trial conducted by Ofori et al. [102]. Similarly, Du et al. [103] reported that irrigating cucumbers with pig WW significantly improved yields and increased the content of vitamin C, soluble sugars, and proteins. An optimal balance of the supply of these nutrients, combined with the selection of suitable artichoke genotypes, can represent an effective approach to boost yield performance [104]. In particular, a higher nitrogen supply can influence protein synthesis in plants, by promoting the increase in growth characters [105].
Regarding mycorrhizal treatment, plants inoculated with MSE produced a significantly higher number of primary and secondary heads compared to those treated with MSY and the control. This result confirms a possible greater interaction between the AMF Septoglomus viscosum (syn. Glomus viscosum) and the artichoke plant compared to other mycorrhizal fungal species present in the same soil with similar mycorrhizal frequencies (Figure 2). Improved plant–AMF affinity could lead to higher productivity through more efficient resource use, supporting key physiological processes in plants and promoting root system growth. This hypothesis is confirmed by Ancona et al. [106], who found that the pure mycorrhizal inoculum of S. viscosum, three months after transplanting, had a positive impact on leaf and root growth of the artichoke cultivar “Troianella”. A potential functional specificity between MSE and artichoke plant was also demonstrated by Campanelli et al. [107]. In their study, the mycorrhizal fungus Glomus viscosum was found to better support the growth of artichoke plantlets. Enhanced morphological responses were observed due to the greater increase in the surface area of the host root systems.
However, no significant differences were observed for other morphological parameters, such as the weight and diameter of the artichoke heads (Figure 9c–f). These results are partly in agreement with those of Gatta et al. [108], who found no variation in head weight and diameter between the two growing seasons, although these parameters were significantly influenced by irrigation treatments.

4. Conclusions

The present study sheds light on the fate of PhACs in real agricultural systems subjected to irrigation with TWW, as well as in pot trials where it was possible to use artificially enriched waters with high concentrations of PhACs. The results showed that the concentration of the studied PhACs in soils and various organs of the artichoke plant was influenced by the duration of irrigation, the type of water applied, and the physicochemical properties of the PhACs. Notably, short-term irrigation with TWW containing low concentrations of contaminants can facilitate the accumulation into the soil of PhACs traces characterized by high Kd values such as CLR and CLZ and the translocation of very persistent PhACs as CBZ into the non-edible organs of the plants. On the other hand, the use of TWW with higher PhACs concentrations poses a significant risk to human health. In addition, the presence and concentration of PhACs in soils irrigated with SGW increased significantly compared to data collected at the end of the first crop cycle; some PhACs translocated up to the artichoke head after only two crop cycles. Therefore, our study confirms the hypothesis of a positive correlation between the risk of PhACs accumulation in soil and plants and the duration of irrigation with TWW. In addition, mycorrhizal activity also influenced PhACs uptake. The species of AMF applied played an important role in reducing contaminant concentrations, as well as microbial activity in soil controls. Finding the best affinity between the AMF species and crop could be a great opportunity not only to increase productivity, but also to ensure greater food security. To reduce human exposure to PhACs and other CECs from WW, irrigation with TWW could be used for non-edible crops or for tree crops. Another strategy to minimize risk would be to alternate TWW and GW for the irrigation of perennial crops in order to reduce soil contamination or apply TWW only during the early part of the crop cycle for annual crops. Furthermore, the potential risk of using these unconventional waters could be reduced by irrigating plants grown in soils rich in organic matter or by amending the soil with organic soil conditioners. Further research is needed today to fully understand the environmental risks of TWW irrigation, particularly regarding the long-term impact of PhACs on soil quality and plant uptake.

Author Contributions

Conceptualization, F.D.M. and G.B.; methodology, F.D.M., S.M. and C.R.; software, F.D.M. and S.M.; validation, F.D.M. and G.B.; formal analysis, F.D.M., C.R., C.S. and S.M.; investigation, F.D.M., C.R. and S.M.; resources, G.B.; data curation, F.D.M., C.R. and S.M.; writing—original draft preparation, F.D.M. and C.R.; writing—review and editing, G.B., C.C., G.D.M. and G.M.; visualization, G.B.; supervision, G.B., C.C., G.D.M. and G.M.; funding acquisition, G.B. All authors have read and agreed to the published version of the manuscript.

Funding

This research was funded by MINISTERO DELL’ISTRUZIONE DELL’UNIVERSITA E. DELLA RICERCA, Italy, Grant number 2017C5CLFB.

Institutional Review Board Statement

Not applicable.

Informed Consent Statement

Not applicable.

Data Availability Statement

Data are contained within the article.

Conflicts of Interest

The authors declare no conflicts of interest.

References

  1. Yahaya, S.M.; Mahmud, A.A.; Abdu, N. The Use of Wastewater for Irrigation: Pros and Cons for Human Health in Developing Countries. Total Environ. Res. Themes 2023, 6, 100044. [Google Scholar] [CrossRef]
  2. Karimidastenaei, Z.; Avellán, T.; Sadegh, M.; Kløve, B.; Haghighi, A.T. Unconventional Water Resources: Global Opportunities and Challenges. Sci. Total Environ. 2022, 827, 154429. [Google Scholar] [CrossRef] [PubMed]
  3. European Commission. Regulation (EU) 2020/741 of the European Parliament and of the Council of 25 May 2020 on Minimum Requirements for Water Reuse. Off. J. Eur. Union 2020, 177, 32–55. [Google Scholar]
  4. Patel, M.; Kumar, R.; Kishor, K.; Mlsna, T.; Pittman Jr, C.U.; Mohan, D. Pharmaceuticals of Emerging Concern in Aquatic Systems: Chemistry, Occurrence, Effects, and Removal Methods. Chem. Rev. 2019, 119, 3510–3673. [Google Scholar] [CrossRef]
  5. Gallego, S.; Montemurro, N.; Béguet, J.; Rouard, N.; Philippot, L.; Pérez, S.; Martin-Laurent, F. Ecotoxicological Risk Assessment of Wastewater Irrigation on Soil Microorganisms: Fate and Impact of Wastewater-Borne Micropollutants in Lettuce-Soil System. Ecotoxicol. Environ. Saf. 2021, 223, 112595. [Google Scholar] [CrossRef]
  6. Akhter, S.; Bhat, M.A.; Hashem, A.; Abd_Allah, E.F.; Ahmed, S.; Siddiqi, W.A.; Kulsoom, I.; Un Nisa, F. Profiling of Antibiotic Residues in Soil and Vegetables Irrigated Using Pharmaceutical-Contaminated Water in the Delhi Stretch of the Yamuna River, India. Water 2023, 15, 4197. [Google Scholar] [CrossRef]
  7. Wei, H.; Tang, M.; Xu, X. Mechanism of Uptake, Accumulation, Transport, Metabolism and Phytotoxic Effects of Pharmaceuticals and Personal Care Products within Plants: A Review. Sci. Total Environ. 2023, 892, 164413. [Google Scholar] [CrossRef]
  8. Rottenberg, A. The Wild Gene Pool of Globe Artichoke. Israel J. Plant Sci. 2015, 62, 33–38. [Google Scholar] [CrossRef]
  9. Food and Agriculture Organisation of the United Nations. Crop Evapotranspiration: Guidelines for Computing Crop Water Requirements (FAO) 2013. Available online: http://faostat.fao.org (accessed on 20 November 2024).
  10. Bhaskaralingam, A.; Sharma, G.; Wang, T.; Kumar, A.; Dhiman, P.; Kumar, D.; Shi, H. Bioremediation of Pharmaceuticals Waste and Pesticides Using Various Microorganisms: A Review. Process Saf. Environ. Prot. 2025, 194, 1116–1132. [Google Scholar] [CrossRef]
  11. Khan, M.F. Fungi for Sustainable Pharmaceutical Remediation: Enzymatic Innovations, Challenges, and Applications—A Review. Processes 2025, 13, 1034. [Google Scholar] [CrossRef]
  12. Bowles, T.M.; Barrios-Masias, F.H.; Carlisle, E.A.; Cavagnaro, T.R.; Jackson, L.E. Effects of Arbuscular Mycorrhizae on Tomato Yield, Nutrient Uptake, Water Relations, and Soil Carbon Dynamics under Deficit Irrigation in Field Conditions. Sci. Total Environ. 2016, 566–567, 1223–1234. [Google Scholar] [CrossRef] [PubMed]
  13. Rouphael, Y.; Franken, P.; Schneider, C.; Schwarz, D.; Giovannetti, M.; Agnolucci, M.; De Pascale, S.; Bonini, P.; Colla, G. Arbuscular Mycorrhizal Fungi Act as Biostimulants in Horticultural Crops. Sci. Hortic. 2015, 196, 91–108. [Google Scholar] [CrossRef]
  14. Bona, E.; Lingua, G.; Todeschini, V. Effect of Bioinoculants on the Quality of Crops. In Bioformulations: For Sustainable Agriculture; Arora, N.K., Mehnaz, S., Balestrini, R., Eds.; Springer: New Delhi, India, 2016; pp. 93–124. [Google Scholar] [CrossRef]
  15. Noceto, P.A.; Bettenfeld, P.; Boussageon, R.; Hériché, M.; Sportes, A.; van Tuinen, D.; Courty, P.E.; Wipf, D. Arbuscular Mycorrhizal Fungi, a Key Symbiosis in the Development of Quality Traits in Crop Production, Alone or Combined with Plant Growth-Promoting Bacteria. Mycorrhiza 2021, 31, 655–669. [Google Scholar] [CrossRef]
  16. Chen, M.; Arato, M.; Borghi, L.; Nouri, E.; Reinhardt, D. Beneficial Services of Arbuscular Mycorrhizal Fungi—From Ecology to Application. Front. Plant Sci. 2018, 9, 1270. [Google Scholar] [CrossRef] [PubMed]
  17. Brunetti, G.; Ruta, C.; Traversa, A.; D’Ambruoso, G.; Tarraf, W.; De Mastro, F.; De Mastro, G.; Cocozza, C. Remediation of a Heavy Metals Contaminated Soil Using Mycorrhized and Non-Mycorrhized Helichrysum italicum (Roth) Don. Land Degrad. Dev. 2018, 29, 91–104. [Google Scholar] [CrossRef]
  18. Hu, B.; Hu, S.; Chen, Z.; Vymazal, J. Employ of Arbuscular Mycorrhizal Fungi for Pharmaceuticals Ibuprofen and Diclofenac Removal in Mesocosm-Scale Constructed Wetlands. J. Hazard. Mater. 2021, 409, 124524. [Google Scholar] [CrossRef]
  19. Richter, B.S.; Stutz, J.C. Mycorrhizal Inoculation of Big Sacaton: Implications for Grassland Restoration of Abandoned Agricultural Fields. Restor. Ecol. 2002, 10, 607–616. [Google Scholar] [CrossRef]
  20. Shi, Y.F.; Wang, S.M.; Guo, J.N.; Xu, Z.J.; Wang, S.G.; Sang, Y.M. Effects of Arbuscular Mycorrhizal Inoculation on the Phytoremediation of PAH-Contaminated Soil: A Meta-Analysis. Chemosphere 2022, 307, 136033. [Google Scholar] [CrossRef]
  21. Fan, X.X.; Chang, W.; Sui, X.; Liu, Y.F.; Song, G.; Song, F.Q.; Feng, F.J. Changes in Rhizobacterial Community Mediating Atrazine Dissipation by Arbuscular Mycorrhiza. Chemosphere 2020, 256, 127046. [Google Scholar] [CrossRef]
  22. Debiane, D.; Garçon, G.; Verdin, A.; Fontaine, J.; Durand, R.; Shirali, P.; Grandmougin-Ferjani, A.; Sahraoui, A.L.-H. Mycorrhization Alleviates Benzo[a]pyrene-Induced Oxidative Stress in an In Vitro Chicory Root Model. Phytochemistry 2009, 70, 1421–1427. [Google Scholar] [CrossRef]
  23. Langer, I.; Syafruddin, S.; Steinkellner, S.; Puschenreiter, M.; Wenzel, W.W. Plant Growth and Root Morphology of Phaseolus vulgaris L. Grown in a Split-Root System Is Affected by Heterogeneity of Crude Oil Pollution and Mycorrhizal Colonization. Plant Soil 2010, 332, 339–355. [Google Scholar] [CrossRef]
  24. Yu, X.Z.; Wu, S.C.; Wu, F.Y.; Wong, M.H. Enhanced Dissipation of PAHs from Soil Using Mycorrhizal Ryegrass and PAH-Degrading Bacteria. J. Hazard. Mater. 2011, 186, 1206–1217. [Google Scholar] [CrossRef] [PubMed]
  25. Małachowska-Jutsz, A.; Rudek, J.; Janosz, W. The Effect of Ribwort (Plantago lanceolata) and Its Mycorrhizas on the Growth of Microflora in Soil Contaminated with Used Engine Oil. Arch. Environ. Prot. 2011, 37, 99–113. [Google Scholar]
  26. Rajtor, M.; Piotrowska-Seget, Z. Prospects for Arbuscular Mycorrhizal Fungi (AMF) to Assist in Phytoremediation of Soil Hydrocarbon Contaminants. Chemosphere 2016, 162, 105–116. [Google Scholar] [CrossRef] [PubMed]
  27. Alkobaisy, S.; Jamal, J. Factors Affecting Mycorrhizal Activity. In Arbuscular Mycorrhizal Fungi in Agriculture—New Insights; IntechOpen: London, UK, 2023. [Google Scholar] [CrossRef]
  28. Powell, C.L. Spread of Mycorrhizal Fungi through Soil. N. Z. J. Agric. Res. 1979, 22, 335–339. [Google Scholar] [CrossRef]
  29. De Mastro, F.; Brunetti, G.; De Mastro, G.; Ruta, C.; Stea, D.; Murgolo, S.; De Ceglie, C.; Mascolo, G.; Sannino, F.; Cocozza, C.; et al. Uptake of Different Pharmaceuticals in Soil and Mycorrhizal Artichokes from Wastewater. Environ. Sci. Pollut. Res. 2023, 30, 33349–33362. [Google Scholar] [CrossRef]
  30. Manasfi, R.; Brienza, M.; Ait-Mouheb, N.; Montemurro, N.; Perez, S.; Chiron, S. Impact of Long-Term Irrigation with Municipal Reclaimed Wastewater on the Uptake and Degradation of Organic Contaminants in Lettuce and Leek. Sci. Total Environ. 2021, 765, 142742. [Google Scholar] [CrossRef]
  31. Franco, A.; Fu, W.; Trapp, S. Influence of Soil pH on the Sorption of Ionizable Chemicals: Modeling Advances. Environ. Toxicol. Chem. 2009, 28, 458–464. [Google Scholar] [CrossRef]
  32. Carter, L.J.; Ryan, J.J.; Boxall, A.B. Effects of Soil Properties on the Uptake of Pharmaceuticals into Earthworms. Environ. Pollut. 2016, 213, 922–931. [Google Scholar] [CrossRef]
  33. Gielen, G.J.H.P.; van den Heuvel, M.R.; Clinton, P.W.; Greenfield, L.G. Factors Impacting on Pharmaceutical Leaching Following Sewage Application to Land. Chemosphere 2009, 74, 537–542. [Google Scholar] [CrossRef]
  34. Mininni, A.N.; Pietrafesa, A.; Calabritto, M.; Di Biase, R.; Brunetti, G.; De Mastro, F.; Murgolo, S.; De Ceglie, C.; Salerno, C.; Dichio, B. Uptake and Translocation of Pharmaceutically Active Compounds by Olive Tree (Olea europaea L.) Irrigated with Treated Municipal Wastewater. Front. Plant Sci. 2024, 15, 1382595. [Google Scholar] [CrossRef]
  35. Paz, A.; Tadmor, G.; Malchi, T.; Blotevogel, J.; Borch, T.; Polubesova, T.; Chefetz, B. Fate of Carbamazepine, Its Metabolites, and Lamotrigine in Soils Irrigated with Reclaimed Wastewater: Sorption, Leaching, and Plant Uptake. Chemosphere 2016, 160, 22–29. [Google Scholar] [CrossRef] [PubMed]
  36. Doretto, K.M.; Rath, S. Sorption of Sulfadiazine on Brazilian Soils. Chemosphere 2013, 90, 2027–2034. [Google Scholar] [CrossRef] [PubMed]
  37. Singh, J.; Knapp, H.V.; Arnold, J.G.; Demissie, M. Hydrological Modeling of the Iroquois River Watershed Using HSPF and SWAT. J. Am. Water Resour. Assoc. 2005, 41, 343–360. [Google Scholar] [CrossRef]
  38. Franco, A.; Trapp, S. Estimation of the Soil-Water Partition Coefficient Normalized to Organic Carbon for Ionisable Organic Chemicals. Environ. Toxicol. Chem. 2008, 27, 1995–2004. [Google Scholar] [CrossRef] [PubMed]
  39. American Public Health Association (APHA); American Water Works Association (AWWA); Water Environment Federation (WEF). Standard Methods for the Examination of Water and Wastewater, 24th ed.; Lipps, W., Braun-Howland, E., Baxter, T., Eds.; APHA Press: Washington, DC, USA, 2023. [Google Scholar]
  40. Montagna, M.T.; De Giglio, O.; Calia, C.; Pousis, C.; Triggiano, F.; Murgolo, S.; De Ceglie, C.; Bagordo, F.; Apollonio, F.; Diella, G.; et al. Microbiological and Chemical Assessment of Wastewater Discharged by Infiltration Trenches in Fractured and Karstified Limestone (SCA.Re.S. Project 2019–2020). Pathogens 2020, 9, 1010. [Google Scholar] [CrossRef]
  41. Swift, R.S. Method of Soil Analysis: Part 3. Chemical Methods; SSSA Book Series No. 5; Sparks, D.L., Page, A.L., Helmke, P.A., Loeppert, R.H., Soltanpour, P.N., Tabatabai, M.A., Johnston, C.T., Sumner, M.E., Eds.; ASA and SSSA: Madison, WI, USA, 1996; pp. 1011–1069. [Google Scholar]
  42. De Mastro, F.; Cocozza, C.; Traversa, A.; Cacace, C.; Mottola, F.; Mezzina, A.; Brunetti, G. Validation of a Modified QuEChERS Method for the Extraction of Multiple Classes of Pharmaceuticals from Soils. Chem. Biol. Technol. Agric. 2022, 9, 49. [Google Scholar] [CrossRef]
  43. Phillips, J.M.; Hayman, D.S. Improved Procedures for Clearing Roots and Staining Parasitic and Vesicular-Arbuscular Mycorrhizal Fungi for Rapid Assessment of Infection. Trans. Br. Mycol. Soc. 1970, 55, 158–161, IN16–IN18. [Google Scholar] [CrossRef]
  44. Trouvelot, A.; Kough, J.L.; Gianinazzi-Pearson, V. Mesure du taux de mycorhization VA d’un système radiculaire. Recherche de méthodes d’estimation ayant une signification fonctionnelle. In Physiological and Genetical Aspects of Mycorrhizae; Gianinazzi-Pearson, V., Gianinazzi, S., Eds.; INRA: Paris, France, 1986; pp. 217–221. [Google Scholar]
  45. Carter, L.J.; Harris, E.; Williams, M.; Ryan, J.J.; Kookana, R.S.; Boxall, A.B. Fate and Uptake of Pharmaceuticals in Soil-Plant Systems. J. Agric. Food Chem. 2014, 62, 816–825. [Google Scholar] [CrossRef]
  46. Pérez, D.J.; Lombardero, L.R.; Doucette, W.J. Influence of Exposure Time, Physicochemical Properties, and Plant Transpiration on the Uptake Dynamics and Translocation of Pharmaceutical and Personal Care Products in the Aquatic Macrophyte Typha latifolia. Sci. Total Environ. 2023, 896, 165107. [Google Scholar] [CrossRef]
  47. Rusan, M.J.M.; Hinnawi, S.; Rousan, L. Long Term Effect of Wastewater Irrigation of Forage Crops on Soil and Plant Quality Parameters. Desalination 2007, 215, 143–152. [Google Scholar] [CrossRef]
  48. Romaneckas, K.; Buragienė, S.; Kazlauskas, M.; Steponavičius, D.; Naujokienė, V.; Bručienė, I.; Šarauskis, E. Effects of Soil Electrical Conductivity and Physical Properties on Seeding Depth Maintenance and Winter Wheat Germination, Development and Productivity. Agronomy 2023, 13, 190. [Google Scholar] [CrossRef]
  49. Li, S.; Tao, Z.; Liu, Y.; Li, S.; Kama, R.; Hu, C.; Fan, X.; Li, Z. Influence of Swine Wastewater Irrigation and Straw Return on the Accumulation of Selected Metallic Elements in Soil and Plants. Agriculture 2024, 14, 317. [Google Scholar] [CrossRef]
  50. Castro, E.; Mañas, M.P.; De Las Heras, J. Effects of Wastewater Irrigation on Soil Properties and Turfgrass Growth. Water Sci. Technol. 2011, 63, 1678–1688. [Google Scholar] [CrossRef] [PubMed]
  51. Alrajhi, A.; Beecham, S.; Nanthi, S.B.; Hassanli, A. Evaluation of Soil Chemical Properties Irrigated with Recycled Wastewater under Partial Root-Zone Drying Irrigation for Sustainable Tomato Production. Agric. Water Manag. 2015, 161, 127–135. [Google Scholar] [CrossRef]
  52. Bernal, A.D.; Ramos, S.M.C.; Tapia, N.T.; Portugal, V.O.; Hernandez, J.T.F.; Dendooven, L. Effects of Tanneries Wastewater on Chemical and Biological Soil Characteristics. Appl. Soil Ecol. 2006, 33, 269–277. [Google Scholar] [CrossRef]
  53. Lu, J.; Li, S.; Liang, G.; Wu, X.; Zhang, Q.; Gao, C.; Li, J.; Jin, D.; Zheng, F.; Zhang, M.; et al. The Contribution of Microorganisms to Soil Organic Carbon Accumulation under Fertilization Varies among Aggregate Size Classes. Agronomy 2021, 11, 2126. [Google Scholar] [CrossRef]
  54. Zhu, J.; Li, M.; Whelan, M. Phosphorus Activators Contribute to Legacy Phosphorus Availability in Agricultural Soils: A Review. Sci. Tot. Environ. 2018, 612, 522–537. [Google Scholar] [CrossRef]
  55. Zhang, L.; Xu, M.; Liu, Y.; Zhang, F.; Hodge, A.; Feng, G. Carbon and Phosphorus Exchange May Enable Cooperation between an Arbuscular Mycorrhizal Fungus and a Phosphate-Solubilizing Bacterium. New Phytol. 2016, 210, 1022–1032. [Google Scholar] [CrossRef]
  56. Zhang, L.; Shi, N.; Fan, J.; Wang, F.; George, T.S.; Feng, G. Arbuscular Mycorrhizal Fungi Stimulate Organic Phosphate Mobilization Associated with Changing Bacterial Community Structure under Field Conditions. Environ. Microbiol. 2018, 20, 2639–2651. [Google Scholar] [CrossRef]
  57. Etesami, H.; Jeong, B.R. Contribution of Arbuscular Mycorrhizal Fungi, Phosphate-Solubilizing Bacteria, and Silicon to P Uptake by Plant: A Review. Front. Plant Sci. 2021, 12, 1355. [Google Scholar] [CrossRef] [PubMed]
  58. Behera, B.C.; Singdevsachan, S.K.; Mishra, R.R.; Dutta, S.K.; Thatoi, H.N. Diversity, Mechanism and Biotechnology of Phosphate Solubilising Microorganism in Mangrove: A Review. Biocatal. Agric. Biotechnol. 2014, 3, 97–110. [Google Scholar] [CrossRef]
  59. Mahanta, D.; Rai, R.K.; Dhar, S.; Varghese, E.; Raja, A.; Purakayastha, T.J. Modification of Root Properties with Phosphate Solubilizing Bacteria and Arbuscular Mycorrhiza to Reduce Rock Phosphate Application in Soybean-Wheat Cropping System. Ecol. Eng. 2018, 111, 31–43. [Google Scholar] [CrossRef]
  60. Santos, A.F.; Alvarenga, P.; Gando-Ferreira, L.M.; Quina, M.J. Urban Wastewater as a Source of Reclaimed Water for Irrigation: Barriers and Future Possibilities. Environments 2023, 10, 17. [Google Scholar] [CrossRef]
  61. Ayers, R.S.; Westcot, D.W. Water Quality for Agriculture; FAO Irrigation and Drainage Paper 29 Rev. 1; Food and Agriculture Organization of the United Nations: Rome, Italy, 1985. [Google Scholar]
  62. Muscarella, S.M.; Alduina, R.; Badalucco, L.; Capri, F.C.; Di Leto, Y.; Gallo, G.; Laudicina, V.A.; Paliaga, S.; Mannina, G. Water Reuse of Treated Domestic Wastewater in Agriculture: Effects on Tomato Plants, Soil Nutrient Availability and Microbial Community Structure. Sci. Total Environ. 2024, 928, 172259. [Google Scholar] [CrossRef]
  63. Urbano, V.R.; Mendonça, T.G.; Bastos, R.G.; Souza, C.F. Effects of Treated Wastewater Irrigation on Soil Properties and Lettuce Yield. Agric. Water Manag. 2017, 181, 108–115. [Google Scholar] [CrossRef]
  64. Zhang, Y.-L.; Lin, S.-S.; Dai, C.-M.; Shi, L.; Zhou, X.-F. Sorption–Desorption and Transport of Trimethoprim and Sulfonamide Antibiotics in Agricultural Soil: Effect of Soil Type, Dissolved Organic Matter, and pH. Environ. Sci. Pollut. Res. 2014, 21, 5827–5835. [Google Scholar] [CrossRef] [PubMed]
  65. Christou, A.; Karaolia, P.; Hapeshi, E.; Michael, C.; Fatta-Kassinos, D. Long-Term Wastewater Irrigation of Vegetables in Real Agricultural Systems: Concentration of Pharmaceuticals in Soil, Uptake and Bioaccumulation in Tomato Fruits and Human Health Risk Assessment. Water Res. 2017, 109, 24–34. [Google Scholar] [CrossRef]
  66. Cirelli, G.L.; Consoli, S.; Licciardello, F.; Aiello, R.; Giuffrida, F.; Leonardi, C. Treated Municipal Wastewater Reuse in Vegetable Production. Agric. Water Manag. 2012, 104, 163–170. [Google Scholar] [CrossRef]
  67. Ben Mordechay, E.; Mordehay, V.; Tarchitzky, J.; Chefetz, B. Pharmaceuticals in Edible Crops Irrigated with Reclaimed Wastewater: Evidence from a Large Survey in Israel. J. Hazard. Mater. 2021, 416, 126184. [Google Scholar] [CrossRef]
  68. Riemenschneider, C.; Al-Raggad, M.; Moeder, M.; Seiwert, B.; Salameh, E.; Reemtsma, T. Pharmaceuticals, Their Metabolites, and Other Polar Pollutants in Field-Grown Vegetables Irrigated with Treated Municipal Wastewater. J. Agric. Food Chem. 2016, 64, 5784–5792. [Google Scholar] [CrossRef] [PubMed]
  69. Rogowska, J.; Cieszynska-Semenowicz, M.; Ratajczyk, W.; Wolska, L. Micropollutants in Treated Wastewater. Ambio 2020, 49, 487–503. [Google Scholar] [CrossRef] [PubMed]
  70. Ternes, T.A.; Bonerz, M.; Herrmann, N.; Teiser, B.; Andersen, H.R. Irrigation of Treated Wastewater in Braunschweig, Germany: An Option to Remove Pharmaceuticals and Musk Fragrances. Chemosphere 2007, 66, 894–904. [Google Scholar] [CrossRef]
  71. Manallack, D.T.; Prankerd, R.J.; Yuriev, E.; Oprea, T.I.; Chalmers, D.K. The Significance of Acid/Base Properties in Drug Discovery. Chem. Soc. Rev. 2013, 42, 485–496. [Google Scholar] [CrossRef]
  72. Hai, F.I.; Yang, S.; Asif, M.B.; Sencadas, V.; Shawkat, S.; Sanderson-Smith, M.; Gorman, J.; Xu, Z.-Q.; Yamamoto, K. Carbamazepine as a Possible Anthropogenic Marker in Water: Occurrences, Toxicological Effects, Regulations and Removal by Wastewater Treatment Technologies. Water 2018, 10, 107. [Google Scholar] [CrossRef]
  73. Verliefde, A.R.; Heijman, S.; Cornelissen, E.; Amy, G.; Van der Bruggen, B.; Van Dijk, J. Rejection of Trace Organic Pollutants with High Pressure Membranes (NF/RO). Environ. Prog. 2008, 27, 180–188. [Google Scholar] [CrossRef]
  74. Sakshi; Singh, S.K.; Haritash, A.K. Polycyclic Aromatic Hydrocarbons: Soil Pollution and Remediation. Int. J. Environ. Sci. Technol. 2019, 16, 6489–6512. [Google Scholar] [CrossRef]
  75. Qin, Q.; Chen, X.J.; Zhuang, J. The Fate and Impact of Pharmaceuticals and Personal Care Products in Agricultural Soils Irrigated with Reclaimed Water. Crit. Rev. Environ. Sci. Technol. 2014, 45, 1379–1408. [Google Scholar] [CrossRef]
  76. Vazquez-Roig, P.; Andreu, V.; Blasco, C.; Picó, Y. Risk Assessment on the Presence of Pharmaceuticals in Sediments, Soils, and Waters of the Pego–Oliva Marshlands (Valencia, Eastern Spain). Sci. Total Environ. 2012, 440, 24–32. [Google Scholar] [CrossRef]
  77. Watkinson, A.J.; Murby, E.J.; Costanzo, S.D. Removal of Antibiotics in Conventional and Advanced Wastewater Treatment: Implications for Environmental Discharge and Wastewater Recycling. Water Res. 2007, 41, 4164–4176. [Google Scholar] [CrossRef]
  78. Kinney, C.A.; Furlong, E.T.; Werner, S.L.; Cahill, J.D. Presence and Distribution of Wastewater-Derived Pharmaceuticals in Soil Irrigated with Reclaimed Water. Environ. Toxicol. Chem. 2006, 25, 2956–2962. [Google Scholar] [CrossRef] [PubMed]
  79. De Mastro, F.; Cacace, C.; Traversa, A.; Pallara, M.; Cocozza, C.; Mottola, F.; Brunetti, G. Influence of Chemical and Mineralogical Soil Properties on the Adsorption of Sulfamethoxazole and Diclofenac in Mediterranean Soils. Chem. Biol. Technol. Agric. 2022, 9, 34. [Google Scholar] [CrossRef]
  80. Borgman, O.; Chefetz, B. Combined Effects of Biosolids Application and Irrigation with Reclaimed Wastewater on Transport of Pharmaceutical Compounds in Arable Soils. Water Res. 2013, 47, 3431–3443. [Google Scholar] [CrossRef]
  81. Grossberger, A.; Hadar, Y.; Borch, T.; Chefetz, B. Biodegradability of Pharmaceutical Compounds in Agricultural Soils Irrigated with Treated Wastewater. Environ. Pollut. 2014, 185, 168–177. [Google Scholar] [CrossRef]
  82. Zhang, Y.; Hu, S.; Zhang, H.; Shen, G.; Yuan, Z.; Zhang, W. Degradation Kinetics and Mechanism of Sulfadiazine and Sulfamethoxazole in an Agricultural Soil System with Manure Application. Sci. Total Environ. 2017, 607–608, 1348–1356. [Google Scholar] [CrossRef]
  83. Yang, S.L.; Bi, X.X.; Huang, B.; Xia, T.Y.; Deng, L.J.; Luo, X.Q.; Ren, Z. Screening and Transcriptomic Profiling of Tobacco Growth-Promoting Arbuscular Mycorrhizal Fungi. Plant Signal. Behav. 2025, 20, 2467935. [Google Scholar] [CrossRef]
  84. Cavagnaro, T.R.; Bender, S.F.; Asghari, H.R.; van der Heijden, M.G.A. The Role of Arbuscular Mycorrhizas in Reducing Soil Nutrient Loss. Trends Plant Sci. 2015, 20, 283–290. [Google Scholar] [CrossRef] [PubMed]
  85. Smith, S.E.; Read, D.J. Mycorrhizal Symbiosis, 3rd ed.; Academic Press: London, UK, 2008. [Google Scholar]
  86. Avio, L.; Maggini, R.; Ujvári, G.; Incrocci, L.; Giovannetti, M.; Turrini, A. Phenolics Content and Antioxidant Activity in the Leaves of Two Artichoke Cultivars are Differentially Affected by Six Mycorrhizal Symbionts. Sci. Hortic. 2020, 264, 109153. [Google Scholar] [CrossRef]
  87. Joner, E.J.; Corgié, S.; Amellal, N.; Leyval, C. Nutritional Constraints to PAH Degradation in a Rhizosphere Model. Soil Biol. Biochem. 2002, 34, 859–864. [Google Scholar] [CrossRef]
  88. Lindahl, B.D.; Stenlid, J.; Olsson, S.; Finlay, R.D. Translocation of 32P between Interacting Mycelia of a Wood-Decomposing Fungus and Ectomycorrhizal Fungi in Microcosm Systems. New Phytol. 1999, 144, 183–193. [Google Scholar] [CrossRef]
  89. Yan, Q.; Feng, G.; Gao, X.; Sun, C.; Guo, J.; Zhu, Z. Removal of Pharmaceutically Active Compounds (PhACs) and Toxicological Response of Cyperus alternifolius Exposed to PhACs in Microcosm Constructed Wetlands. J. Hazard. Mater. 2016, 301, 566–575. [Google Scholar] [CrossRef] [PubMed]
  90. Denora, M.; Candido, V.; Brunetti, G.; De Mastro, F.; Murgolo, S.; De Ceglie, C.; Salerno, C.; Gatta, G.; Giuliani, M.M.; Mehmeti, A.; et al. Uptake and Accumulation of Emerging Contaminants in Processing Tomato Irrigated with Tertiary Treated Wastewater Effluent: A Pilot-Scale Study. Front. Plant Sci. 2023, 14, 1238163. [Google Scholar] [CrossRef]
  91. Miller, E.L.; Nason, S.L.; Karthikeyan, K.G.; Pedersen, J.A. Root Uptake of Pharmaceuticals and Personal Care Product Ingredients. Environ. Sci. Technol. 2016, 50, 525–541. [Google Scholar] [CrossRef]
  92. Shi, Q.; Xiong, Y.; Kaur, P.; Sy, N.D.; Gan, J. Contaminants of Emerging Concerns in Recycled Water: Fate and Risks in Agroecosystems. Sci. Total Environ. 2022, 814, 152527. [Google Scholar] [CrossRef] [PubMed]
  93. Goldstein, M.; Shenker, M.; Chefetz, B. Insights into the Uptake Processes of Wastewater-Borne Pharmaceuticals by Vegetables. Environ. Sci. Technol. 2014, 48, 5593–5600. [Google Scholar] [CrossRef] [PubMed]
  94. Chuang, Y.-H.; Liu, C.-H.; Sallach, J.B.; Hammerschmidt, R.; Zhang, W.; Boyd, S.A.; Li, H. Mechanistic Study on Uptake and Transport of Pharmaceuticals in Lettuce from Water. Environ. Int. 2019, 131, 104976. [Google Scholar] [CrossRef]
  95. Kodesová, R.; Klement, A.; Golovko, O.; Féř, M.; Kočárek, M.; Nikodem, A.; Grabic, R. Soil Influences on Uptake and Transfer of Pharmaceuticals from Sewage Sludge Amended Soils to Spinach. J. Environ. Manage. 2019, 250, 109407. [Google Scholar] [CrossRef] [PubMed]
  96. Shenker, M.; Harush, D.; Ben-Ari, J.; Chefetz, B. Uptake of Carbamazepine by Cucumber Plants—A Case Study Related to Irrigation with Reclaimed Wastewater. Chemosphere 2011, 82, 905–910. [Google Scholar] [CrossRef]
  97. Winker, M.; Clemens, J.; Reich, M.; Gulyas, H.; Otterpoh, R. Ryegrass Uptake of Carbamazepine and Ibuprofen Applied by Urine Fertilization. Sci. Total Environ. 2010, 408, 1902–1908. [Google Scholar] [CrossRef]
  98. García-Valcárcel, A.I.; Loureiro, I.; Escorial, C.; Molero, E.; Tadeo, J.L. Uptake of Azoles by Lamb’s Lettuce (Valerianella locusta L.) Grown in Hydroponic Conditions. Ecotoxicol. Environ. Saf. 2016, 124, 138–146. [Google Scholar] [CrossRef]
  99. Lobell, D.B.; Schlenker, W.S.; Costa-Roberts, J. Climate Trends and Global Crop Production Since 1980. Science 2011, 333, 616–620. [Google Scholar] [CrossRef]
  100. Iizumi, T.; Yokozawa, M.; Sakurai, G.; Travasso, M.I.; Romanenkov, V.; Oettli, P.; Newby, T.; Ishigooka, Y.; Furuya, J. Historical Changes in Global Yields: Major Cereal and Legume Crops from 1982 to 2006. Glob. Ecol. Biogeogr. 2014, 23, 346–357. [Google Scholar] [CrossRef]
  101. Rezaei, E.E.; Webber, H.; Asseng, S.; Boote, K.; Durand, J.L.; Ewert, F.; Martre, P.; MacCarthy, D.S. Climate Change Impacts on Crop Yields. Nat. Rev. Earth Environ. 2023, 4, 831–846. [Google Scholar] [CrossRef]
  102. Ofori, S.; Abebrese, D.K.; Růžičková, I.; Wanner, J. Reuse of Treated Wastewater for Crop Irrigation: Water Suitability, Fertilization Potential, and Impact on Selected Soil Physicochemical Properties. Water 2024, 16, 484. [Google Scholar] [CrossRef]
  103. Du, Z.; Zhao, S.; She, Y.; Zhang, Y.; Yuan, J.; Rahman, S.U.; Qi, X.; Xu, Y.; Li, P. Effects of Different Wastewater Irrigation on Soil Properties and Vegetable Productivity in the North China Plain. Agriculture 2022, 12, 1106. [Google Scholar] [CrossRef]
  104. Ierna, A.; Mauro, R.P.; Mauromicale, G. Improved Yield and Nutrient Efficiency in Two Globe Artichoke Genotypes by Balancing Nitrogen and Phosphorus Supply. Agron. Sustain. Dev. 2012, 32, 773–780. [Google Scholar] [CrossRef]
  105. Shaheen, A.M.; Fatma, F.; Rizk, A.; Elbassiony, A.M.; El-Shal, Z.S.A. Effect of Ammonium Sulphate and Agricultural Sulphur on the Artichoke Plant Growth, Head Yield, and Its Some Physical and Chemical Properties. Res. J. Agric. Biol. Sci. 2007, 3, 82–90. [Google Scholar]
  106. Ancona, S.; De Mastro, G.; Jenderek, M.M.; Ruta, C. Micropropagation Supports Reintroduction of an Apulian Artichoke Landrace in Sustainable Cropping Systems. Agronomy 2021, 11, 1169. [Google Scholar] [CrossRef]
  107. Campanelli, A.; Ruta, C.; Tagarelli, A.; Morone-Fortunato, I.; De Mastro, G. Effectiveness of Mycorrhizal Fungi on Globe Artichoke (Cynara cardunculus L. var. scolymus) Micropropagation. J. Plant Interact. 2013, 9, 100–106. [Google Scholar] [CrossRef]
  108. Gatta, G.; Libutti, A.; Beneduce, L.; Gagliardi, A.; Disciglio, G.; Lonigro, A.; Tarantino, E. Reuse of Treated Municipal Wastewater for Globe Artichoke Irrigation: Assessment of Effects on Morpho-Quantitative Parameters and Microbial Safety of Yield. Sci. Hortic. 2016, 213, 55–65. [Google Scholar] [CrossRef]
Figure 1. Monthly rainfall and temperature in Noci during 2020–2021 and 2021–2022 crop cycles.
Soilsystems 09 00051 g001
Figure 2. Mycorrhizal frequency (%) at the end of the first and second crop cycles of the open field test (a) and at the end of the second crop cycle of the pot test (b). Mean values marked with different letters are significantly different (p < 0.05) and bars represent the standard deviations. Lowercase letters represent differences between water treatment (GW, TWW, and SGW) under the same mycorrhizal inoculation. Uppercase letters represent differences between mycorrhizal inoculation (CON, MSE, and MSY) under the same water treatment. GW: locally sourced groundwater; TWW: treated wastewater; SGW: spiked groundwater; CON: not mycorrhizal artichoke; MSY: artichoke inoculated with Rhizophagus irregularis and Funneliformis mosseae; MSE: artichoke inoculated with Septoglomus viscosum.
Soilsystems 09 00051 g002
Figure 3. Mean concentration (ng g−1) of PhACs detected in soil irrigated with TWW at the end of the second cycle in open field (a) and pot tests (b). Mean values marked with different letters are significantly different (p < 0.05) and bars represent standard deviations. CON: not mycorrhizal artichoke; MSY: artichoke inoculated with Rhizophagus irregularis and Funneliformis mosseae; MSE: artichoke inoculated with Septoglomus viscosum.
Soilsystems 09 00051 g003
Figure 4. Average concentration (ng g−1) of the compounds detected in soil irrigated with SGW at the end of the second cycle in the pot test. Mean values marked with different letters are significantly different (p < 0.05) and bars represent the standard deviations. CON: not mycorrhizal artichoke; MSY: artichoke inoculated with Rhizophagus irregularis and Funneliformis mosseae; MSE: artichoke inoculated with Septoglomus viscosum.
Soilsystems 09 00051 g004
Figure 5. Average concentration (ng g−1) of the PhACs detected in roots (a) and leaves and stems (b) of plants irrigated with TWW at the end of the second cycle in the open field trial. Mean values marked with different letters are significantly different (p < 0.05) and bars represent the standard deviations. CON: not mycorrhizal artichoke; MSY: artichoke inoculated with Rhizophagus irregularis and Funneliformis mosseae; MSE: artichoke inoculated with Septoglomus viscosum.
Soilsystems 09 00051 g005
Figure 6. Average concentration (ng g−1) of the PhACs detected in roots (a) and leaves and stems (b) irrigated with TWW at the end of the second cycle in the pot test. Mean values marked with different letters are significantly different (p < 0.05) and bars represent the standard deviations. CON: not mycorrhizal artichoke; MSY: artichoke inoculated with Rhizophagus irregularis and Funneliformis mosseae; MSE: artichoke inoculated with Septoglomus viscosum.
Soilsystems 09 00051 g006
Figure 7. Average concentration (ng g−1) of the compounds detected in the roots (a), leaves and stems (b), and heads of plants (c) irrigated with SGW at the end of the second cycle in the pot test. Mean values marked with different letters are significantly different (p < 0.05) and bars represent the standard deviations. CON: not mycorrhizal artichoke; MSY: artichoke inoculated with Rhizophagus irregularis and Funneliformis mosseae; MSE: artichoke inoculated with Septoglomus viscosum.
Soilsystems 09 00051 g007
Figure 8. Translocation factor (TF) calculated for CBZ and FCZ, after irrigation with SGW. Data are expressed as mean value and bars are standard errors (n = 3). CON: not mycorrhizal artichoke; MSY: artichoke inoculated with Rhizophagus irregularis and Funneliformis mosseae; MSE: artichoke inoculated with Septoglomus viscosum.
Soilsystems 09 00051 g008
Figure 9. Effect of different water treatments and mycorrhizal inoculation on the number of primary (a) and secondary heads (b) of artichoke, weight of primary (c) and secondary heads (d) of artichoke, and caliber of primary (e) and secondary heads (f) of artichoke evaluated at the end of the first and second growing seasons of the open field test. Lowercase letters represent differences between mycorrhizal inoculation (C, MSE, and MSY) under the same water treatment (TWW, and GW). Uppercase letters represent differences between different water treatments under the same mycorrhizal inoculation and growing seasons (I and II years). TWW: treated wastewater; GW: locally sourced groundwater; CON: not mycorrhizal artichoke; MSY: artichoke inoculated with Rhizophagus irregularis and Funneliformis mosseae; MSE: artichoke inoculated with Septoglomus viscosum.
Soilsystems 09 00051 g009
Table 1. Physicochemical properties (Mw: molecular weight; KOW: octanol/water coefficient; pKa: acid ionization constant; Kd: adsorption coefficient) of the selected PhACs.
PhACsMw
(g mol−1)
Chemical
Structure
Chemical
Class
Water Solubility
(mg L−1)
KOWpKaLiterature
Kd
(Reference)
Carbamazepine
(CBZ)
236.27Soilsystems 09 00051 i001anti-
depressants
18
at 25 °C
2.45 13.9 12–20 [30]
0.53–16.7 [31]; 0.43 [32]; 0.08 [33]
Clarithromycin
(CLR)
748Soilsystems 09 00051 i002antibiotic1.693
at 25 °C
3.16 8.99 262–400 [30]
Climbazole
(CLZ)
292.76Soilsystems 09 00051 i003antifungal58
at 25 °C
3.76 6.49 123–200 [30]
Fluconazole
(FCZ)
306.27 Soilsystems 09 00051 i004antifungal4.363
at 25 °C
0.25 2.27 16.04 [34]
Ketoprofene
(KET)
254.28 Soilsystems 09 00051 i005anti-
inflammatory
51
at 22 °C
3.12 4.45 0.09–9.59 [31]; 1.26–8.24 [35]
Naproxen
(NPX)
230.26Soilsystems 09 00051 i006anti-
inflammatory
15.9
at 25 °C
3.18 4.150.23–17.5 [31]; 2.39–4.4 [36]
Sulfamethoxazole
(SMX)
253.28Soilsystems 09 00051 i007antibiotic610
at 37 °C
0.891.60.6–4.9 [30]
Trimethoprim
(TMP)
290.32Soilsystems 09 00051 i008antibiotic400
at 25 °C
0.91 7.12
1.16 [32]; 7.42 [37];
7.06–9.2 [38]
Table 2. Main properties of irrigated soils (mean ± STD of three samples for GW and TWW soils). TWW: tertiary treated wastewater irrigated soil; GW: groundwater irrigated soil; EC: electrical conductivity; CaCO3: calcium carbonate; OC: organic carbon; OM: organic matter; Ntot: total nitrogen; Pava: available phosphorus.
ParametersTWWGW
1st Year2nd Year1st Year2nd Year
CONMSYMSECONMSYMSECONMSYMSECONMSYMSE
pH (H2O)7.6 ± 0.27.4 ± 0.17.6 ± 0.27.9 ± 0.07.4 ± 0.37.5 ± 0.17.9 ± 0.27.4 ± 0.27.6 ± 0.07.5 ± 0.17.6 ± 0.07.4 ± 0.3
pH (KCl)5.7 ± 0.16.5 ± 0.16.5 ± 0.27.1 ± 0.16.7 ± 0.26.9 ± 0.37.0 ± 0.06.6 ± 0.36.7 ± 0.16.4 ± 0.06.7 ± 0.16.4 ± 0.0
EC (μS cm−1)1769.0 ± 321844.0 ± 451708.0 ± 25.91863.9 ± 56.91863.4 ± 42.81695.4 ± 72.5629.5 ± 20.9789.6 ± 21.8678.0 ± 15.2601.9 ± 12.9741.9 ± 41.1628.1 ± 28.0
CaCO3tot (%)3.0 ± 0.42.2 ± 0.302.4 ± 0.103.1 ± 0.12.1 ± 0.22.3 ± 0.13.0 ± 0.302.4 ± 0.402.3 ± 0.502.9 ± 0.22.0 ± 0.32.2 ± 0.2
OC (g kg−1)7.8 ± 1.17.7 ± 1.16.7 ± 0.88.2 ± 1.28.0 ± 0.97.7 ± 1.17.5 ± 1.07.2 ± 0.25.7 ± 1.57.4 ± 0.67.3 ± 0.56.0 ± 1.1
OM (%)13.5 ± 1.313.3 ± 1.311.6 ± 1.114.1 ± 1.113.8 ± 0.913.3 ± 1.213.0 ± 1.312.4 ± 1.29.8 ± 1.912.8 ± 0.812.6 ± 0.810.3 ± 1.6
Ntot (g kg−1)1.3 ± 0.10.9 ± 0.41.1 ± 0.11.7 ± 0.21.3 ± 0.31.4 ± 0.20.8 ± 0.40.6 ± 0.10.7 ± 0.20.9 ± 0.20.5 ± 0.20.7 ± 0.1
Pava (mg kg−1)73.7 ± 4.495.5 ± 3.768.9 ± 5.982.4 ± 2.3124.6 ± 2.176.2 ± 1.649.5 ± 4.786.8 ± 4.648.2 ± 6.453.8 ± 1.379.6 ± 2.249.8 ± 5.2
Table 3. Physicochemical and microbiological analysis of TWW and GW used for the irrigation of the artichoke crop during the two years. TWW: treated wastewater; GW: locally sourced groundwater.
ParametersTWWGWRecommended Value
1st Year2nd Year1st Year2nd YearItaly [60]EU [3]FAO [61]
Temperature (°C)19.88 ± 5.7520.1 ± 5.822.30 ± 0.1421.80 ± 0.10---
pH7.22 ± 0.277.30 ± 0.207.50 ± 0.067.48 ± 0.026.0–9.5 6.50–8.50
EC (dS m−1)1.08 ± 0.100.90 ± 0.100.35 ± 0.000.32 ± 0.103.0 (0.7–3) SM
TSSs (mg L−1)2.36 ± 1.632.0 ± 0.500.83 ± 0.80.75 ± 0.101035<50.00
Turbidity (NTU)1.22 ± 0.721.11 ± 0.101.39 ± 0151.32 ± 0.08--
N-NH4+ (mg L−1)2.24 ± 4.862.10 ± 0.200.04 ± 0.020.03 ± 0.02
N-NO2 (mg L−1)0.79 ± 1.770.80 ± 0.0NDND
N-NO3 (mg L−1)5.89 ± 2.446.10 ± 1.200.93 ± 0.310.88 ± 0.18
Ntot (mg L−1)12.65 ± 7.1613.10 ± 1.902.89 ± 0.252.77 ± 0.2015-
Ptot (mg L−1)4.75 ± 1.885.10 ± 1.900.03 ± 00.03 ± 02-
COD (mg O2 L−1)22.57 ± 7.2520.10 ± 3.30.70 ± 0.200.60 ± 0.20100
BOD5 (mgO2 L−1)9.80 ± 1.0410.80 ± 1.0NDND2025<30
Free Chlorine (mg L−1)0.13 ± 0.240.10 ± 0.0NDND
Tot. Chlorine (mg L−1)1.07 ± 2.501.10 ± 0.00.1 ± 0.0ND
TC (MPN 100 mL−1)1556.19 ± 752.321456.20 ± 485.2NDND
E. coli (MPN 100 mL−1) 596.69 ± 230.58606.10 ± 189.47NDND1001000<200
EC: electrical conductivity; TSSs: total suspended solids; N-NH4: nitrogen in ammonium form; N-NO2: nitrogen in nitrite form; N-NO3: nitrogen in nitrate form; Ntot: total nitrogen; Ptot: total phosphorus; COD: chemical oxygen demand; BOD5: biochemical oxygen demand for 5 days; TC: total coliform; MPN: most probable number; E.coli: Escherichia coli; ND: not detected; SM: slight to moderate restrictions; water quality values are mean ± STD (n = 3).
Table 4. Concentration values of PhACs detected in GW and TWW. GW: locally sourced groundwater; TWW: treated wastewater.
PharmaceuticalsFormulaGWTWWTWW
I and II YearsI YearII Year
µg/L
ClarithromycinC38H69NO13<LOQ0.8 ± 0.001<LOQ
SulfamethoxazoleC10H11N3O3S<LOQ<LOQ0.28 ± 0.001
TrimethoprimC14H18N4O3<LOQ<LOQ<LOQ
KetoprofenC16H14O3<LOQ0.2 ± 0.01<LOQ
CarbamazepineC15H12N2O<LOQ0.54 ± 0.040.51 ± 0.01
FluconazoleC13H12F2N6O<LOQ0.07 ± 0.0020.25 ± 0.001
ClimbazoleC15H17ClN2O2<LOQ0.03 ± 0.0010.1 ± 0.001
NaproxenC14H14O3<LOQ0.21 ± 0.02<LOQ
Table 5. Uptake factors (UFs) for each PhAC calculated in the organs of the artichoke plant irrigated with SGW. CON: not mycorrhizal artichoke; MSY: artichoke inoculated with Rhizophagus irregularis and Funneliformis mosseae; MSE: artichoke inoculated with Septoglomus viscosum.
PhACsInoculationPlant Organs
RootsLeaves and StemsHead
CBZCON0.69 ± 0.103.80 ± 0.340.33 ± 0.04
MSY0.68 ± 0.053.37 ± 0.480.27 ± 0.02
MSE0.99 ± 0.154.51 ± 0.500.44 ± 0.03
CLRCON0.03 ± 0.01<LOQ<LOQ
MSY0.05 ± 0.00<LOQ<LOQ
MSE0.10 ± 0.01<LOQ<LOQ
CLZCON0.02 ± 0.00<LOQ<LOQ
MSY0.07 ± 0.00<LOQ<LOQ
MSE0.10 ± 0.02<LOQ<LOQ
FCZCON0.46 ± 0.063.55 ± 0.490.39 ± 0.08
MSY0.56 ± 0.054.03 ± 0.590.49 ± 0.10
MSE0.59 ± 0.104.16 ± 0.430.49 ± 0.02
TMPCON0.05 ± 0.00<LOQ<LOQ
MSY0.13 ± 0.01<LOQ<LOQ
MSE0.26 ± 0.06<LOQ<LOQ
Table 6. Effects of water irrigation treatments, growing seasons, and mycorrhiza on artichoke agronomic parameters. GW: locally sourced groundwater; TWW: treated wastewater; SGW: spiked groundwater; CON: not mycorrhizal artichoke; MSY: artichoke inoculated with Rhizophagus irregularis and Funneliformis mosseae; MSE: artichoke inoculated with Septoglomus viscosum.
Experimental FactorNumber of Heads (n. ha−1)Heads Mean Weight (g)Diameter Heads (cm)
MainSecondaryMainSecondaryMainSecondary
Growing
seasons
***n.s.n.s.n.s.n.s.
First 11,155.56 b37,111.11 b132.92 a73.48 a73.08 a53.31 a
Second12,177.78 a38,066.67 a135.62 a73.74 a73.34 a53.08 a
Irrigation
treatment
******n.s.n.s.n.s.n.s.
GW10,466.67 b36,800.00 b133.53 a72.07 a73.91 a53.06 a
TWW12,866.67 a38,377.78 a135.01 a75.16 a72.51 a53.33 a
Inoculum******n.s.n.s.n.s.n.s.
CON11,400 b37,000.00 b129.93 a73.97 a71.49 a52.72 a
MSY10,600 b36,566.67 b141.76 a73.87 a73.79 a53. 66 a
MSE13,000 a39,200.00 a131.12 a72.99 a74.35 a53.20 a
The values in each column followed by a different letter are significantly different according to Tukey’s test. n.s.: not significant; *, **, and *** are significant at p ≤ 0.05, p ≤ 0.01, and p ≤ 0.001, respectively.
Disclaimer/Publisher’s Note: The statements, opinions and data contained in all publications are solely those of the individual author(s) and contributor(s) and not of MDPI and/or the editor(s). MDPI and/or the editor(s) disclaim responsibility for any injury to people or property resulting from any ideas, methods, instructions or products referred to in the content.

