Article

Cutting-Edge Technology Using Blended Controlled-Release Fertilizers and Conventional Monoammonium Phosphate as a Strategy to Improve Phosphorus Coffee Nutrition During the Coffee Development Phase

by
Mateus Portes Dutra
1,*,
Leonardo Fernandes Sarkis
1,
Damiany Pádua Oliveira
1,
Hugo de Almeida Santiago
2,
Gustavo Tadeu de Sousa Resende
2,
Maria Elisa Araújo de Melo
1,
Adrianne Braga da Fonseca
1,
Cristhian José Hernández López
1,
Euler dos Santos Silva
1,
Aline dos Santos Zaqueu
1,
Gustavo Henrique Furtado de Lima
1,
João Marcelo Silva
2,
Adélia Aziz Alexandre Pozza
1 and
Douglas Guelfi
1
1
Laboratory of Fertilizers Technologies—INNOVA FERT, Department of Soil Science, Federal University of Lavras, Lavras 37203-202, MG, Brazil
2
Department of Agriculture, Federal University of Lavras, Lavras 37203-202, MG, Brazil
*
Author to whom correspondence should be addressed.
Soil Syst. 2025, 9(2), 47; https://doi.org/10.3390/soilsystems9020047
Submission received: 16 January 2025 / Revised: 6 May 2025 / Accepted: 8 May 2025 / Published: 13 May 2025

Abstract

:
Controlled-release fertilizers contain polymeric coatings that modify the dynamics of phosphorus (P) release in soil. This study aimed to characterize P release from physical mixtures between conventional and controlled-release fertilizers (CRFs), quantify soil P availability, and assess agronomic responses of coffee plants during the establishment phase. Two main types of P fertilizer were evaluated: conventional monoammonium phosphate (MAP) and a blend (physical mixture of conventional MAP and controlled-release P fertilizers). Both fertilizers were applied at 0, 134, 268, and 403 kg ha−1 of P2O5. Our findings revealed a blend longevity of 3 and 6 months. P fertilization contributed to an increase in leaf area (1134.7 cm2 plant−1) and shoot biomass (602.8 kg ha−1) and raised P in the soil (0.061 mg dm−3 per kg of P2O5 applied). P accumulation in the coffee plants ranged between 3 and 4 kg ha−1. Other macronutrient accumulations in aerial parts were of the following ranges (in kg ha−1): 47–60 for N, 36–46 for K, 18–22 for Ca, 5–7 for Mg, and 3–4 for S. Micronutrients accumulated (in g ha−1): 454–657 for Fe; 117–160 for B; 117–149 for Mn; 58–71 for Cu; and 34–43 for Zn. Up to 74% of the nutrients were distributed in the leaves. We concluded that the use of blends did not impose any limitation on P nutrition for coffee plants and led to biomass gains (18.9%) in plagiotropic branches. P fertilization proved essential for supporting the initial growth of coffee plants and increasing coffee leaf area and P levels in the soil and promotes adequate levels of P accumulation in plants, leading to improvements in coffee crop nutrition in the establishment phase.

1. Introduction

The success of coffee farming depends on various agricultural practices and environmental conditions. The starting point for achieving this success is building soil fertility, which is the second most important factor in achieving sustainable coffee productivity [1,2].
Soil fertility has been improving over the years as farmers continue to apply soil amendments and fertilizers. However, low-mobility nutrients, such as phosphorus (P), require more careful applications during crop development [3,4]. Although coffee plants require P in smaller amounts than other macronutrients, its low availability in soil limits vegetative development and root growth. Consequently, during the development phase, it is common practice to apply high rates of phosphorus, at values of 350 kg ha−1 of P2O5, to support initial nutrient demands and maintain optimal soil P levels throughout the coffee cycle [2,5,6].
However, fertilizers provide P with low efficiency in most coffee plantations since the coffee is cultivated predominantly in tropical regions, where soils are typically highly weathered. This low efficiency is attributed to the strong affinity of inorganic P for Fe, Al, and Mn oxyhydroxides (>350 mg P kg−1 of soil), which renders it unavailable for plant uptake [7,8,9]. As a result, under these conditions, the nutrient uptake can be as low as 5 to 30% of the total P applied through fertilizers [10]. Therefore, adopting management strategies and fertilizers that enhance nutrient uptake is essential to ensuring proper nutrition and sustainability in coffee crop environments.
Excessive fertilization to overcome P adsorption and precipitations processes is neither economically viable for production systems nor sustainable for agriculture [11]. More effective strategies include cultivars with better nutrient uptake [3,12] and well-established agricultural practices, such as liming and gypsum application to promote root growth and improve P radicular interception and uptake by coffee. In addition, the use of enhanced-efficiency fertilizers can optimize coffee nutrition [4,10,13,14,15].
The use of enhanced-efficiency phosphate fertilizers, regardless of their specific technology, shares the common goal of activating mechanisms that increase P availability in the soil and improve P uptake by coffee. Among innovative fertilizer technologies, controlled-release fertilizers represent a smart option in this regard. Their gradual nutrient release through fertilizer granule coatings synchronizes nutrient availability and crop demand, minimizing the contact time between inorganic P and soil colloids [4,14,16,17].
Despite the potential benefits of mitigating losses and increasing yield, controlled-release fertilizers incur higher costs per unit of nutrient compared to conventional fertilizers used alone. Therefore, the use of blends aims to reduce the final product cost by combining conventional fertilizers with controlled-release sources in a single formulation without compromising efficiency. Additionally, this physical mixture of fertilizers allows for greater flexibility in adjusting nutrient release according to the crop’s demand, thereby promoting the adoption and accessibility of the technology [2,4,13].
Several studies have demonstrated the potential of controlled-release phosphate fertilizers to improve P nutrition. These investigations have focused on modifications in the diffusion rate of P in the soil [4,11,14,16,18]. Despite advancements in understanding this technology, conclusive evidence validating its effectiveness in enhancing P uptake in coffee crops under field conditions, particularly during development, remains limited. Accordingly, the challenges associated with P nutrition underscore the need for further studies to rigorously evaluate and validate this technology for coffee cultivation environments.
Therefore, considering that the polymeric coatings of fertilizers can alter the dynamics of P release and diffusion in the soil, enhancing its availability, the objectives of this study were as follows: to characterize the release dynamics of P from fertilizer technologies; to quantify leaf area, P accumulation, biomass, and yield of coffee plants associated with applications of conventional fertilizers and blends of phosphate fertilizer technologies for increasing P rates; and to quantify the availability of P in soil during the coffee development phase. In this regard, the main contribution of this scientific paper is answer if controlled-release and their blends with conventional MAP can have effects on the dynamics of P in soil and improves nutrient uptake by young Coffea arabica L. plants.

2. Material and Methods

The experiment was conducted in a commercial Arabica coffee plantation area located in the municipality of Santo Antônio do Amparo, Minas Gerais state, Brazil (20°53′52.90″ S and 44°52′52.30″ W), which has an average altitude of 1100 m. The region’s average annual temperature is 19.6 °C. During the experiment (November 2020 to December 2021), the accumulated precipitation was 1809 mm, and from January to June 2022, the accumulated precipitation was 847 mm (Figure 1).
The crop was established with the cultivar MGS Paraíso 2 of Coffea arabica L. on 1 December 2020, in fertile “Latossolo Vermelho distrófico” [19], equivalent to Haplustox according to the Soil Survey Staff [15]. Plants were spaced 3.5 m between rows and 0.6 m between plants within the same row. The experiment was conducted at a coffee renewal area, which also cultivates Coffea arabica L. and has a good record of fertilization and phytosanitary management. The chemical and textural characterization of the soil are presented in Table S1.

2.1. Experimental Design and Description of Treatments

The experiment was conducted for 18 months and divided into the development and post-development phases of coffee plant growth. The experimental design followed a randomized block design with three replications. Each experimental plot consisted of 16 plants, with the 10 central plants considered as the useful plot (33.60 m2). The blocks were delimited among the rows of coffee plants, leaving one border row between adjacent blocks.
Phosphate fertilization was divided annually corresponding to the development and post-development phases, with 85% of the total fertilizer applied initially during the development phase and the remaining 15% applied as topdressing during the post-development phase.
A factorial 2 × 4 arrangement was designed to combine the types of P fertilizer and phosphorus rates. The first factor was the phosphate fertilizer technologies: (1) conventional monoammonium phosphate (MAP—11% N and 52% P2O5) and (2) a blend—a physical mixture of conventional MAP and two controlled-release phosphate fertilizers (10% N and 48% P2O5), with longevities of 4 and 8 months, as declared by the manufacturer (MulticoteTM Haifa®, Haifa, Israel). Both factors were subjected to increasing P2O5 doses during the development phase—0, 114, 228, and 343 kg ha−1—and the post-development phase—0, 2, 40, and 60 kg ha−1—totaling 0, 134, 268, and 403 kg ha−1 of P2O5.
During the development phase, fertilizer was applied in the planting furrow on 17 November 2020 (15 days before planting the seedlings) and subsequently incorporated using a furrow beater to a maximum depth of 0.30 m. In the post-development phase, both fertilizers were applied as a single topdressing application on 28 October 2021, in the area under the projection of the plant canopies.

2.2. Coffee Crop Management

Before the experiment, in June 2020, 3000 kg ha−1 of dolomitic limestone was applied over the entire area and incorporated to a depth of 0.30 m. On 5 May 2021, 1500 kg ha−1 of gypsum was applied along the canopy projection lines of the coffee plants.
Along with the phosphate fertilizers during the development phase, 90 kg ha−1 of nitrogen (N) and 30 kg ha−1 of potassium (K2O) were applied in all treatments. Ammonium nitrate (32% N) and potassium chloride (60% K2O) were used as sources for treatments associated with conventional MAP. For the blend, the fertilizers included two types of controlled-release urea (longevity of 4 and 6 months, 42% N), potassium nitrate (longevity of 4 months; 13% N and 42% K2O), and conventional ammonium nitrate and potassium sulfate (50% K2O).
Nitrogen and potassium were applied in the planting furrow alongside the phosphate fertilizers for the blend treatments. For treatments with conventional sources, only K2O fertilizers were applied in the planting furrow. The remaining portion of the N dose, not provided by the phosphate fertilizer, was applied as topdressing 40 days after transplanting the seedlings to the field. This application was carried out in strips along the canopy projection line.
In the same planting furrow where the fertilizers were applied, 3500 g per linear meter of organic compost was incorporated, along with Fritted Trace Elements BR12 fertilizer, supplying 1 kg ha−1 of B, Cu, and Mn and 6 kg ha−1 of Zn.
During the post-development phase, 140 kg ha−1 of N and 90 kg ha−1 of K2O were applied. In the treatments that received conventional phosphate fertilizer, ammonium nitrate and potassium chloride were applied. For the blend, the sources included two types of controlled-release urea (longevity of 4 and 6 months, 42 N) and potassium nitrate with longevities of 4 months (13% N and 42% K2O) and 8 months (12% N and 44% K2O).

2.3. Characterization of the Controlled-Release Fertilizers and Nutrient Release in Field Conditions

The thickness of the controlled-release fertilizer granules was evaluated using scanning electron microscopy (Union CED 020 model, dpUNION®, São Paulo, Brazil). Additionally, the samples were observed using a stereomicroscope (LEO EVO 40 XVP, Zeiss model, ZEISS®, Oberkochen, Germany). The micrographs are presented in Figure 2.

Nutrient Release from the Fertilizer Blends

In both phases (development and post-development), the nutrient release curve was evaluated in the field under the crop’s natural edaphoclimatic conditions. During the development phase, the fertilizers were incorporated along the fertilization furrow at a depth of 0.30 m. In contrast, in the post-development phase, they were surface-applied under the canopy projection of the plants. In both phases, 40 g of fertilizer, following the proportion of each fertilizer in each blend, was sealed in nylon bags measuring 0.125 × 0.18 m, with a mesh thickness of 1.8 mm.
In each coffee growing season, the plots received 33 fertilizer bags, divided into 11 bags per plot, with three replications per sampling date: 7, 14, 28, 42, 56, 77, 98, 126, 154, and 196 days after fertilization. During the post-development phase, an additional sampling was conducted at 242 days, coinciding with the harvest date.
On the sampling date, the fertilizers were removed from the bags and dried in a forced-air circulation oven at 35 °C for 24 h. The fertilizers were ground with 100 mL of distilled water to break the polymer and release all nutrients into the solution. Nitrogen was determined using the Raney micro method [20], while P2O5 and K2O were analyzed using inductively coupled plasma optical emission spectrometry (ICP-OES) after a nitro-perchloric acid digestion (HNO3:HClO4, 3:1 v/v).
The nutrient release curves were determined by subtracting the initial quantities of N, P2O5, and K2O in each sample from the amounts of each nutrient released by the fertilizer at each sampling time.

2.4. Leaf Area, Biomass, and Coffee Yield

2.4.1. Leaf Area

Leaf area was determined by considering the area of all leaves from three plants per plot at intervals of 0, 90, 180, and 340 days. At 470 days, leaf area was measured on only four plagiotropic branches from the same three plants, as measuring the entire plant at this stage would have been unfeasible. Individual leaf evaluations were performed by measuring the dimensions (length [L] and maximum width [W] of the lamina), with leaf area being calculated using Equation (1), as proposed by Antunes et al. [21].
LA (cm2) = 0.6626(LW)^1.0116
The total leaf area per plant was obtained by summing the individual leaf areas. The leaf area increment was calculated as the difference between current and previous measurements.

2.4.2. Dry Biomass

To quantify dry biomass and nutrient accumulation in the aerial plant parts, one plant per plot was sampled before harvest. Each plant was divided into orthotropic branches, plagiotropic branches, leaves, husks, and beans. These components were dried at 65 °C for 72 h and then weighed to determine dry biomass.
Next, all the structures were ground, and a fraction was taken to determine N using the Kjeldahl method [22], while the remaining nutrients (P, K, Ca, Mg, S, B, Cu, Fe, Mn, and Zn) were analyzed using ICP-OES.
Nutrient accumulation was calculated using the dry biomass and the nutrient concentrations obtained. The values were extrapolated to kg ha−1 for biomass, kg ha−1 for macronutrients, and g ha−1 for micronutrients, based on a population of 4762 plants ha−1.

2.4.3. Coffee Bean Yield

Coffee fruits were manually harvested by stripping when the percentage of unripe fruits was below 10%. Yield was quantified in the useful area (ten plants) considering the volume of uncleaned coffee fruits, which included a mixture of unripe and dry fruits. From the total production of each plot, a representative 3.2 L sample was dried in a coffee drying yard until reaching approximately 120 g kg−1 of moisture content. The final yield was determined by extrapolating the data from the sampled area to a plant density of 4762 plants ha−1.

2.5. Available Phosphorus in Soil

Available soil P (mg dm−3) was evaluated at depths of 0.0–0.20, 0.20–0.40, and 0.40–0.60 m. The evaluations occurred at the end of the harvest (September 2022). A hand probe was used to collect one subsample at each depth on both sides of the coffee plant canopy projection. The subsamples were combined to form a composite sample, representing each soil depth per plot. The samples were taken per block, with three replications for each depth under evaluation. Available P levels were determined using the Mehlich-1 extractor [23].

2.6. Statistical Analysis

Statistical analyses were performed using R software (version 4.4.3) [24]. Data validation was conducted with the GVLMA package (version 4.4.3) [25], and the models were manually verified for assumptions of normality and homoscedasticity using plots generated by the “plot” function.
The data were subjected to analysis of variance (ANOVA), and qualitative comparisons were performed using Tukey’s test (p ≤ 0.05). For quantitative analyses, fitted regression curves and the determination coefficient (R2) were determined using the “ExpDes.pt” package (Version 1.2.2) [26] and the “nlsLM” function. The nutrient release pattern was evaluated by non-linear regression analysis, adjusting the data to a logistic equation model and logarithm, using the SigmaPlot® (version 12.5 [27]) function “curve fit”. Figures were created using SigmaPlot® version 12.5 and R software.

3. Results

3.1. Thickness of the Coatings and Nutrient Release from Fertilizers

The coated phosphate fertilizers showed an average coating thickness of 57.52 ± 3.31 µm for the 4-month-longevity MAP and 75.93 ± 15.93 µm for the 8-month-longevity MAP (Figure 2A,B). This characterization supports the longevities of the fertilizers claimed by the manufacturer. The thickness coating ensures that the nutrients are released over a longer period of time or have increased longevity.
Figure 3 shows the nutrient release dynamics of N, P2O5, and K2O for the fertilizer blend during both management stages (development and post-development). The fitted models for each nutrient and their respective determination coefficients are presented in Table 1.
The longevity of a fertilizer with gradual nutrient release is defined as the time required to reach 75% of the cumulative nutrient release. This is a universal parameter for characterizing controlled-release fertilizers [28]. During the development phase, the durations required to reach 75% cumulative release were 71 days for N, 102 days for P2O5, and 41 days for K2O. By the end of the evaluation period (196 days), the cumulative release of nutrients reached 97%, 97%, and 98%, respectively (Figure 3; Table 1).
In the post-development phase, 75% cumulative nutrient release was achieved in 127 days for N, 175 days for P2O5, and 142 days for K2O. At 242 days (corresponding to the harvest), the cumulative nutrient release reached 85%, 80%, and 87%, respectively.
The blend applied during the development phase showed a 102-day longevity (~3 months), while the post-development blend exhibited a 175-day longevity (~6 months). The differences in longevity and nutrient release were influenced by the addition of the conventional fertilizers to the blend during the development phase. The initial 7 days after fertilization (DAF) and final (196 DAF) intervals represent a 20% higher P2O5 release for this application in the development phase (conventional source + CRF) compared to the post-development phase (CRF only). Thus, the addition of the conventional fertilizers promoted an increased nutrient release rate at two points: initially, due to its solubility, and at the end of the evaluation, as the proportion of controlled-release sources was reduced in the final fertilizer composition.

3.2. Leaf Area Increment in Coffee Plants

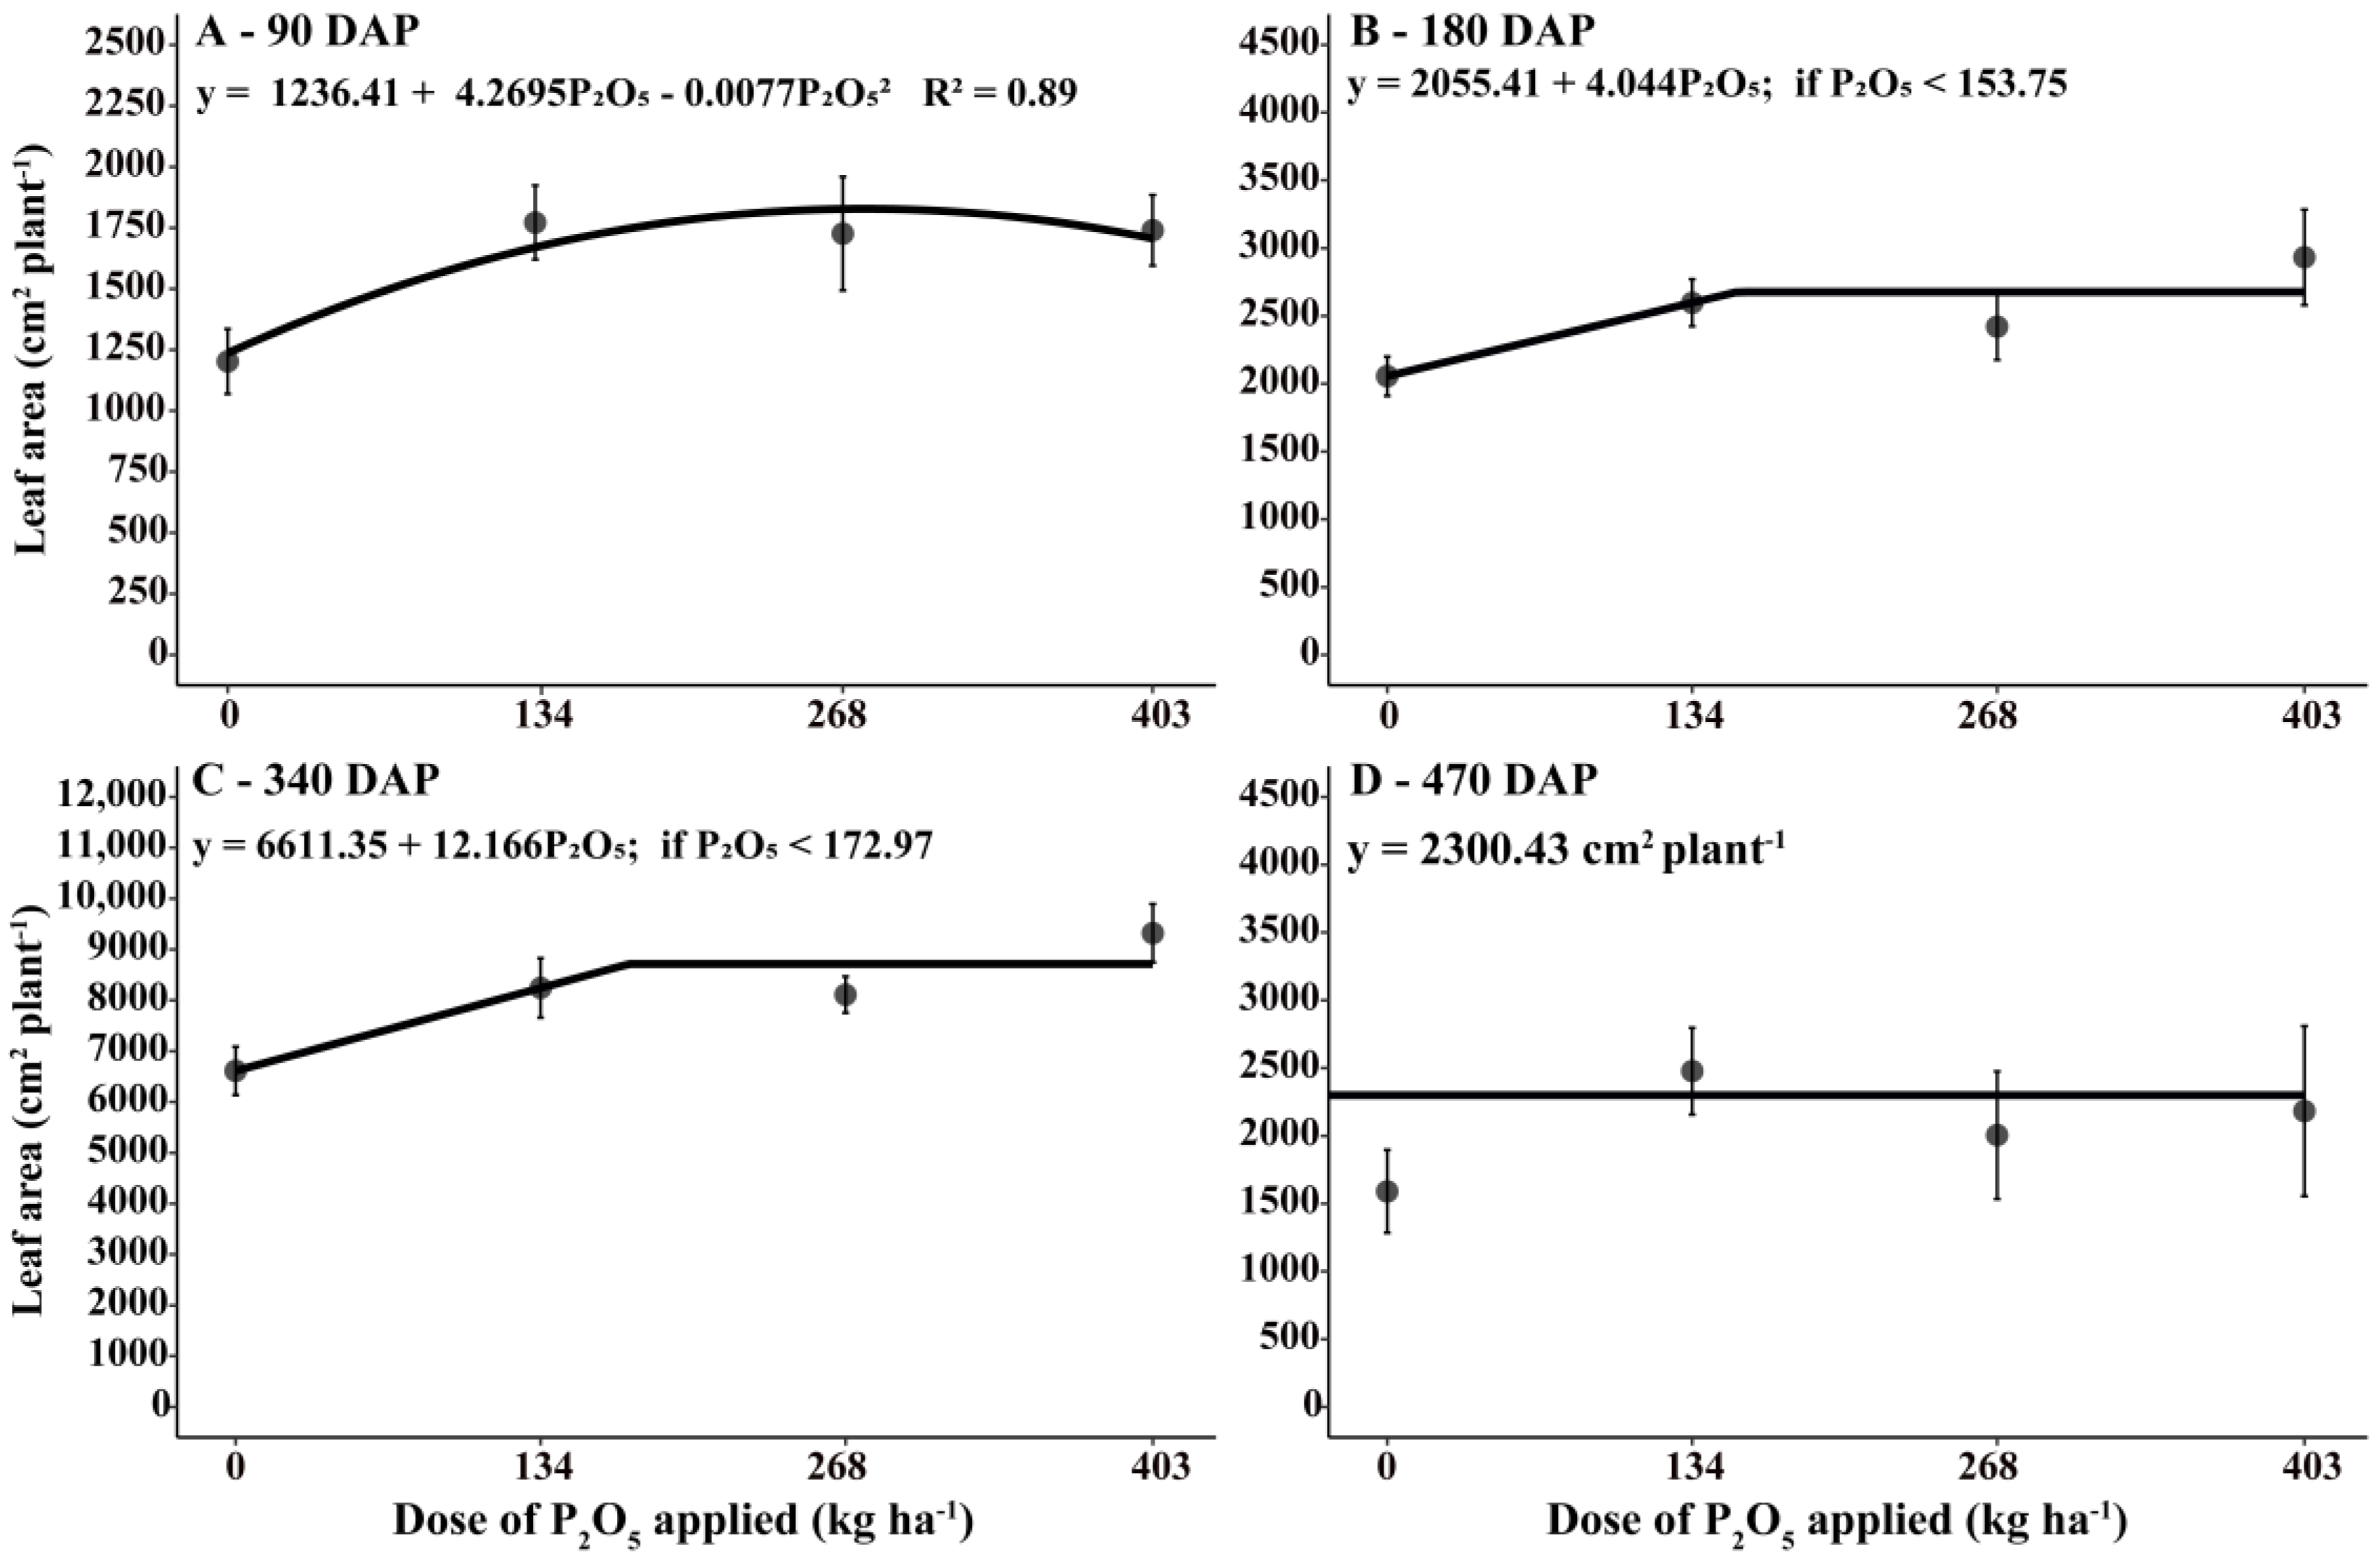
Leaf area increment was influenced only by P2O5 doses throughout the development phase: 90, 180, and 340 days after coffee planting (DAP). At 470 days (post-development phase), neither the individual factors nor their interaction (fertilizers vs. rates) significantly affected leaf area increment (Figure 4).
Increasing P2O5 doses resulted in a maximum leaf area increment of 1828.24 cm2 per plant with the application of 277 kg ha−1 of P2O5 at 90 DAP (Figure 4A). At 180 and 340 DAP, the leaf area responded linearly to the applied doses, up to 154 and 173 kg ha−1 of P2O5, respectively, with rise rates of 4 cm2 and 12.2 cm2 per kg of P2O5 applied (Figure 4B,C).
Compared with the non-fertilized treatment, the average leaf area increments at the maximum response doses were 591.6 cm2, 621.8 cm2, and 2190.8 cm2 per plant at 90, 180, and 340 DAP, respectively. No additional gains were observed with P2O5 doses exceeding these limits (Figure 4D).

3.3. Yield, Biomass, and Nutrient Accumulation

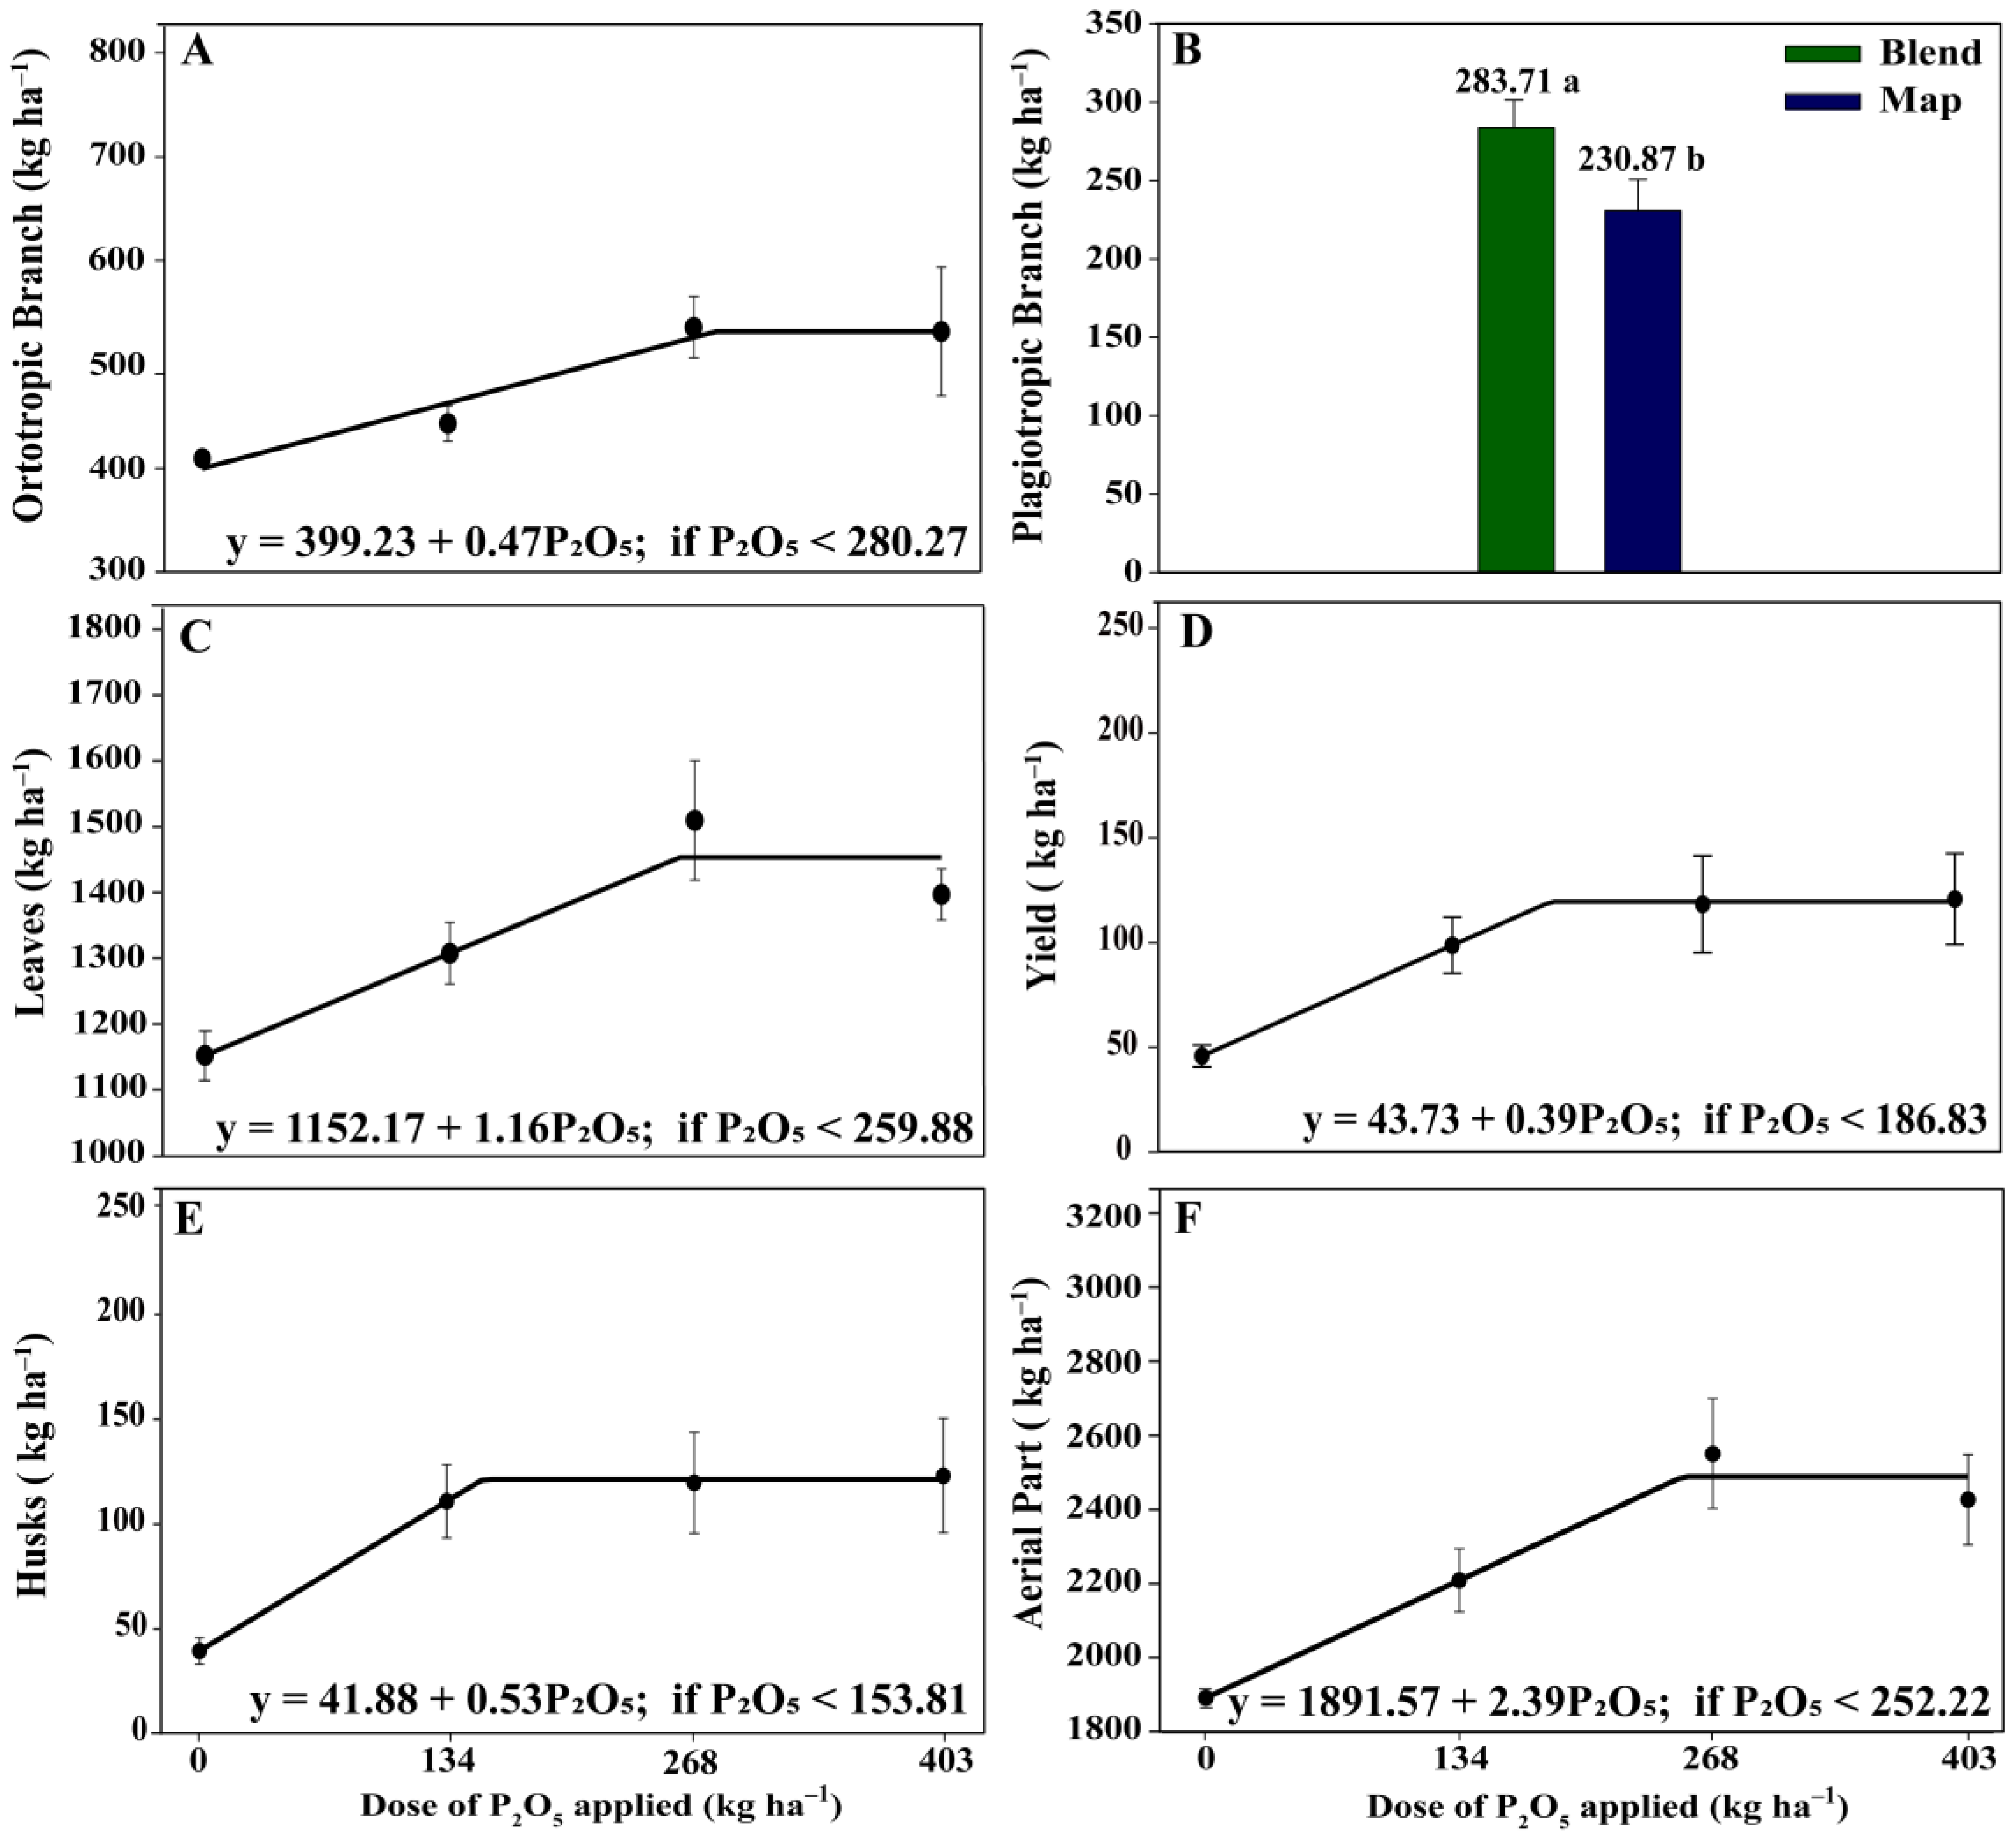
The biomass of the vegetative structures of the development phase, i.e., orthotropic branches, leaves, and the total aerial biomass, were significantly influenced solely by the P2O5 doses (Figure 5A,C,F). These structures showed linear increases in biomass with increasing P2O5 doses up to 280 kg ha−1, 260 kg ha−1, and 252 kg ha−1, respectively, with no additional gains observed beyond these limits. This resulted in biomass increments of 131.7 kg, 301.5 kg, and 602.8 kg, respectively, compared to zero P2O5.
The isolated application of the blend treatments, regardless of the P2O5 dose, significantly increased plagiotropic branch biomass, with an additional 52.8 kg ha−1 compared to conventional sources (Figure 5B).
Coffee yield was influenced only by P2O5 doses. The yield increased linearly up to 186.83 kg ha−1 of P2O5, producing 116.59 kg ha−1 of coffee beans (~1.94 bags) (Figure 5D). A similar trend was observed for husk biomass production, with 123.39 kg ha−1 of husk biomass produced with 153.81 kg ha−1 of P2O5 (Figure 5E). No significant yield increases were observed with doses higher than 186.83 kg ha−1 of P2O5.
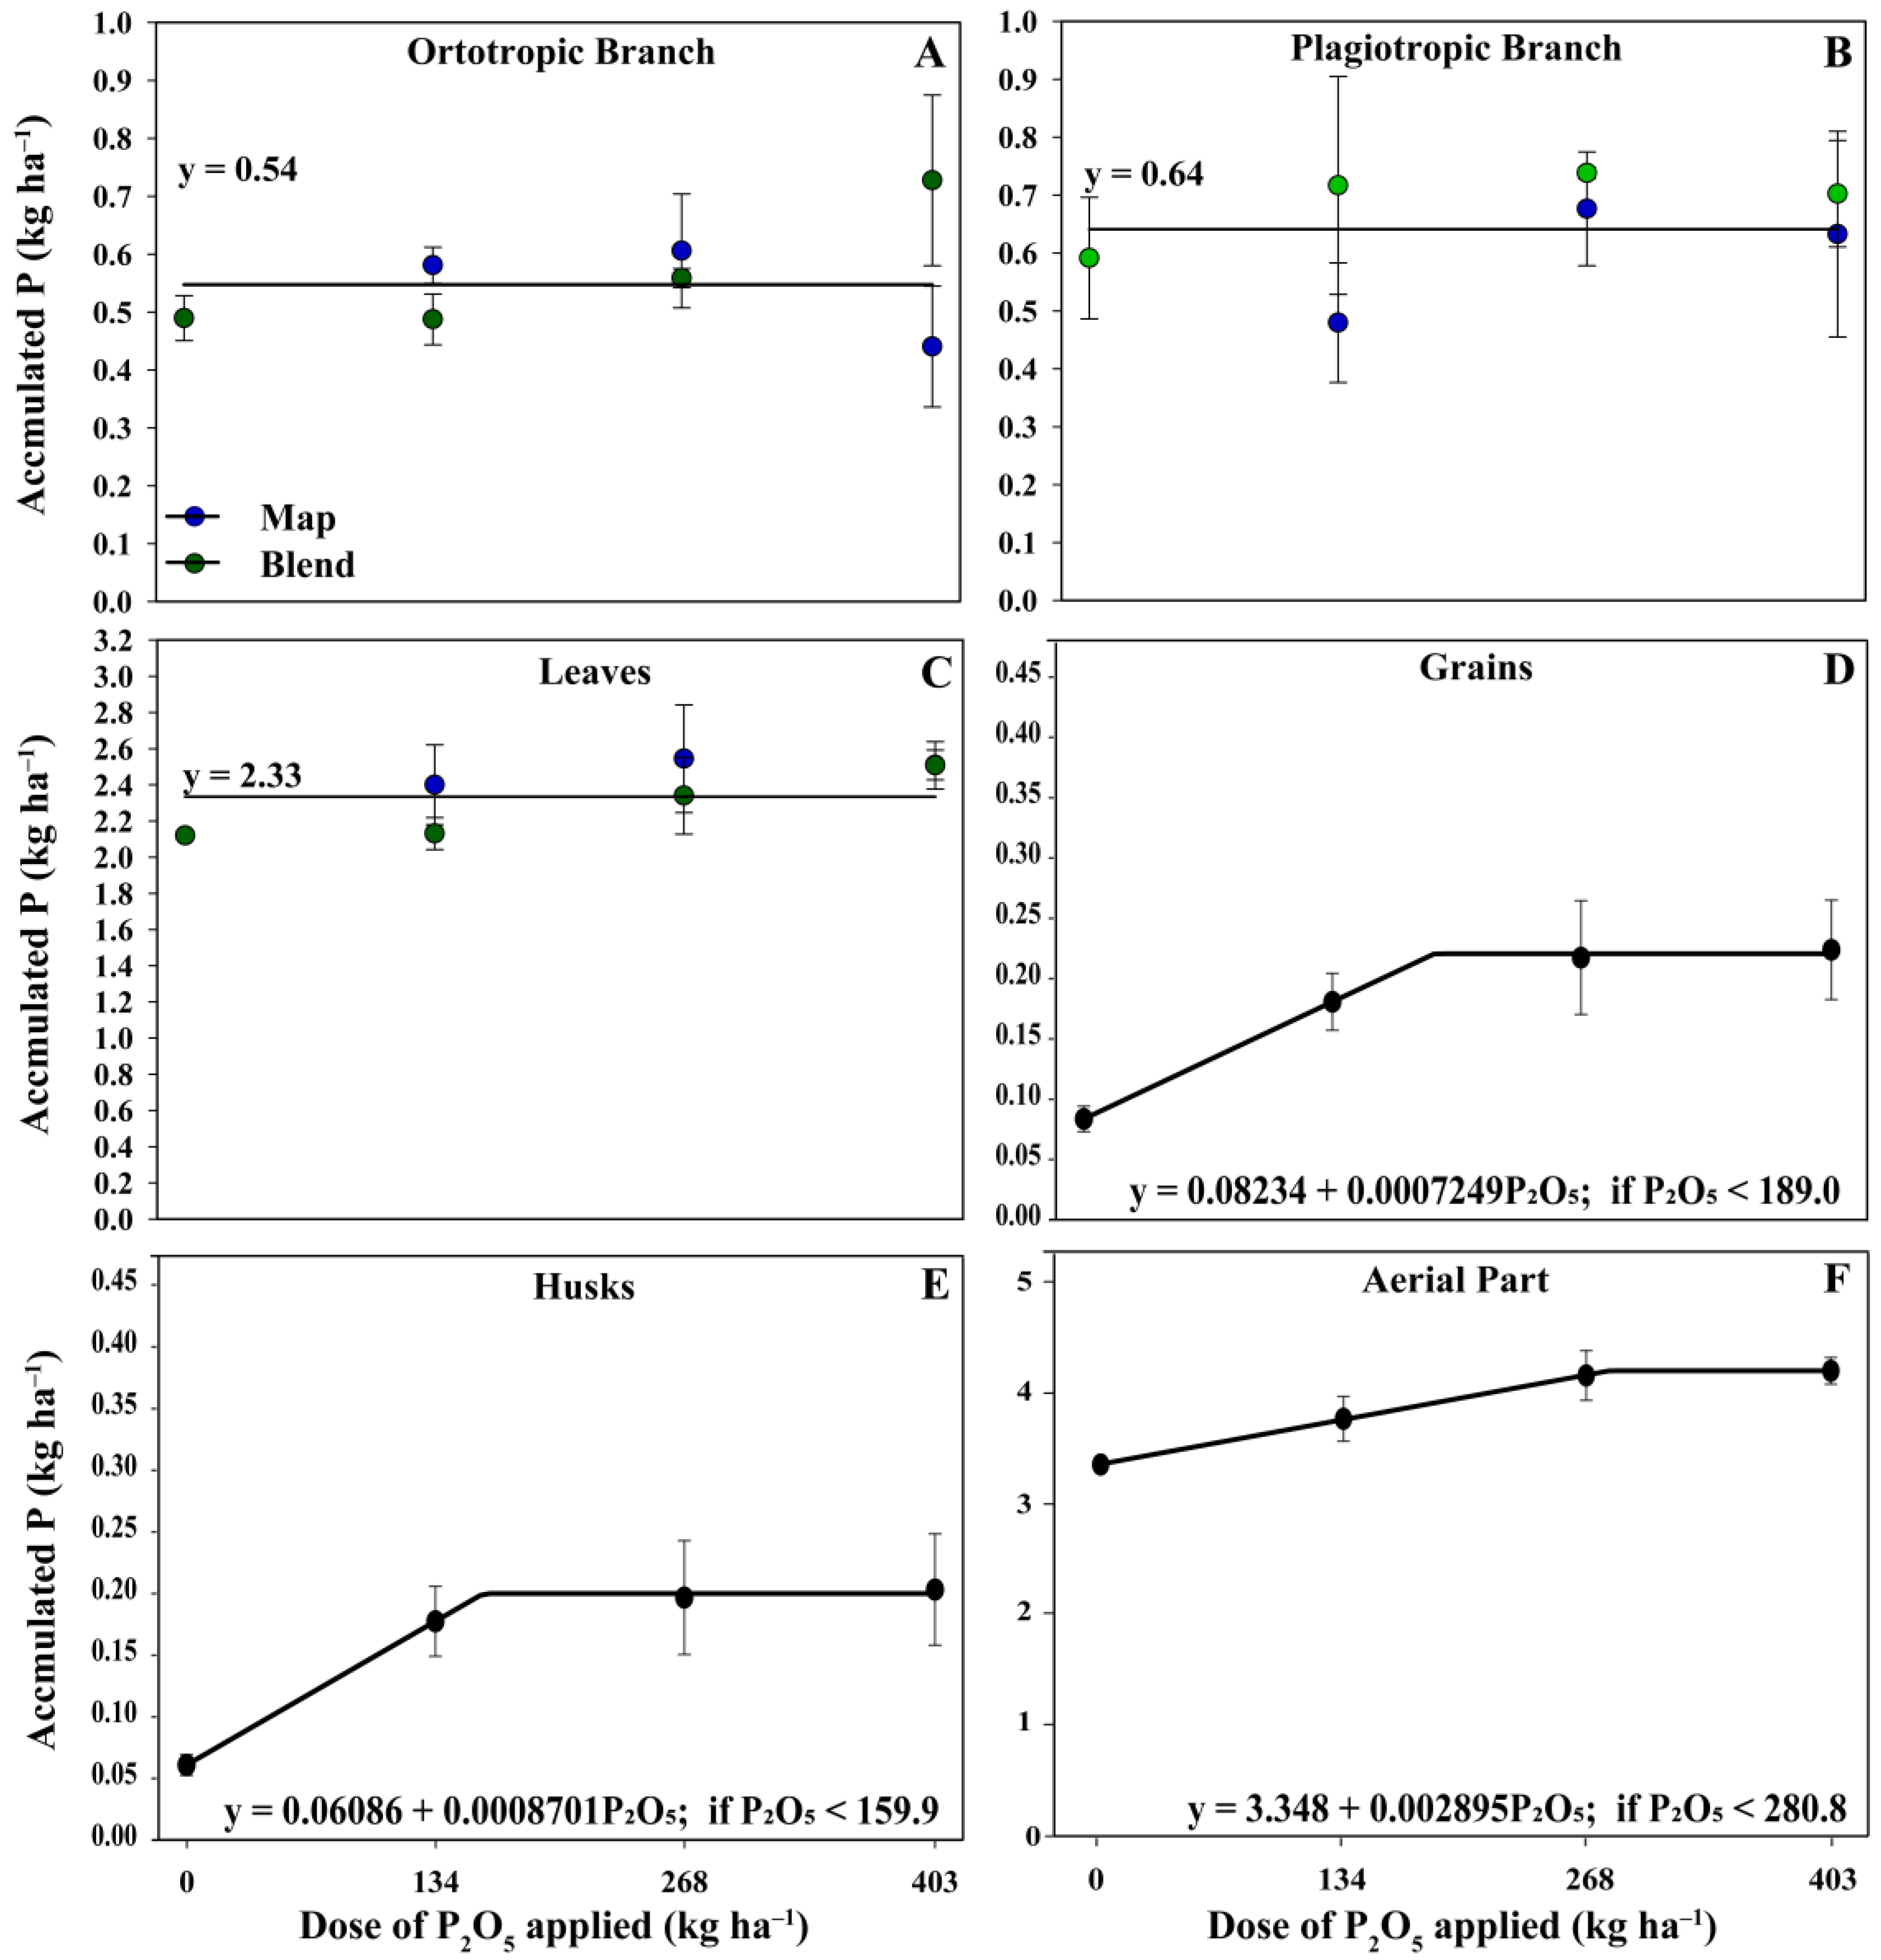
The increase in yield as a function of P2O5 doses also resulted in higher P accumulation in the beans, as shown in Figure 6D. This effect was significant up to a dose of 189 kg ha−1 of P2O5, with a maximum P export rate of 0.22 kg ha−1 in the beans (Figure 6E). A similar trend was observed for P accumulation in the husks, with a maximum P export rate of 0.20 kg ha−1 of P2O5 with an application of 160 kg ha−1 of P2O5.
P accumulation in the aerial parts of the plants showed a linear increase with rising P2O5 doses, reaching a maximum of 4.16 kg ha−1 of P at a dose of 281 kg ha−1 of P2O5, with no further increases at higher doses (Figure 6F).
P accumulation in the vegetative structures (orthotropic branches, plagiotropic branches, and leaves) was not influenced by the fertilizers, the applied doses, or the interaction between these factors. On average, P accumulation was 0.54, 0.64, and 2.33 kg ha−1 of P, respectively.
The accumulation of macro- and micronutrients in the parts of the coffee plants was not influenced by the main effects of fertilizers or P doses applied through fertilization nor by their interaction (p < 0.05). However, there is a trend of increased nutrient accumulation in the aerial parts of the plants due to the application of P2O5. Nutrient accumulation data are presented in Table 2.
Macronutrient accumulations in aerial parts were of the following ranges (in kg ha−1): 47–60 for N, 36–46 for K, 18–22 for Ca, 5–7 for Mg, and 3–4 for S. Micronutrients accumulated were of the following ranges (in g ha−1): 454–657 for Fe; 117–160 for B; 117–149 for Mn; 58–71 for Cu; and 34–43 for Zn. Up to 74% of the nutrients were distributed in the leaves.
The vegetative structures required, on average, 93% of the nutrients, while the harvest index during the development stage was 7%, considering the demand from beans and husks. Overall, the average nutrient distribution was 74% in the leaves, 11% in plagiotropic branches, 9% in orthotropic branches, 4% in the husks, and 3% in the fruits.

3.4. Available Phosphorus in Soil

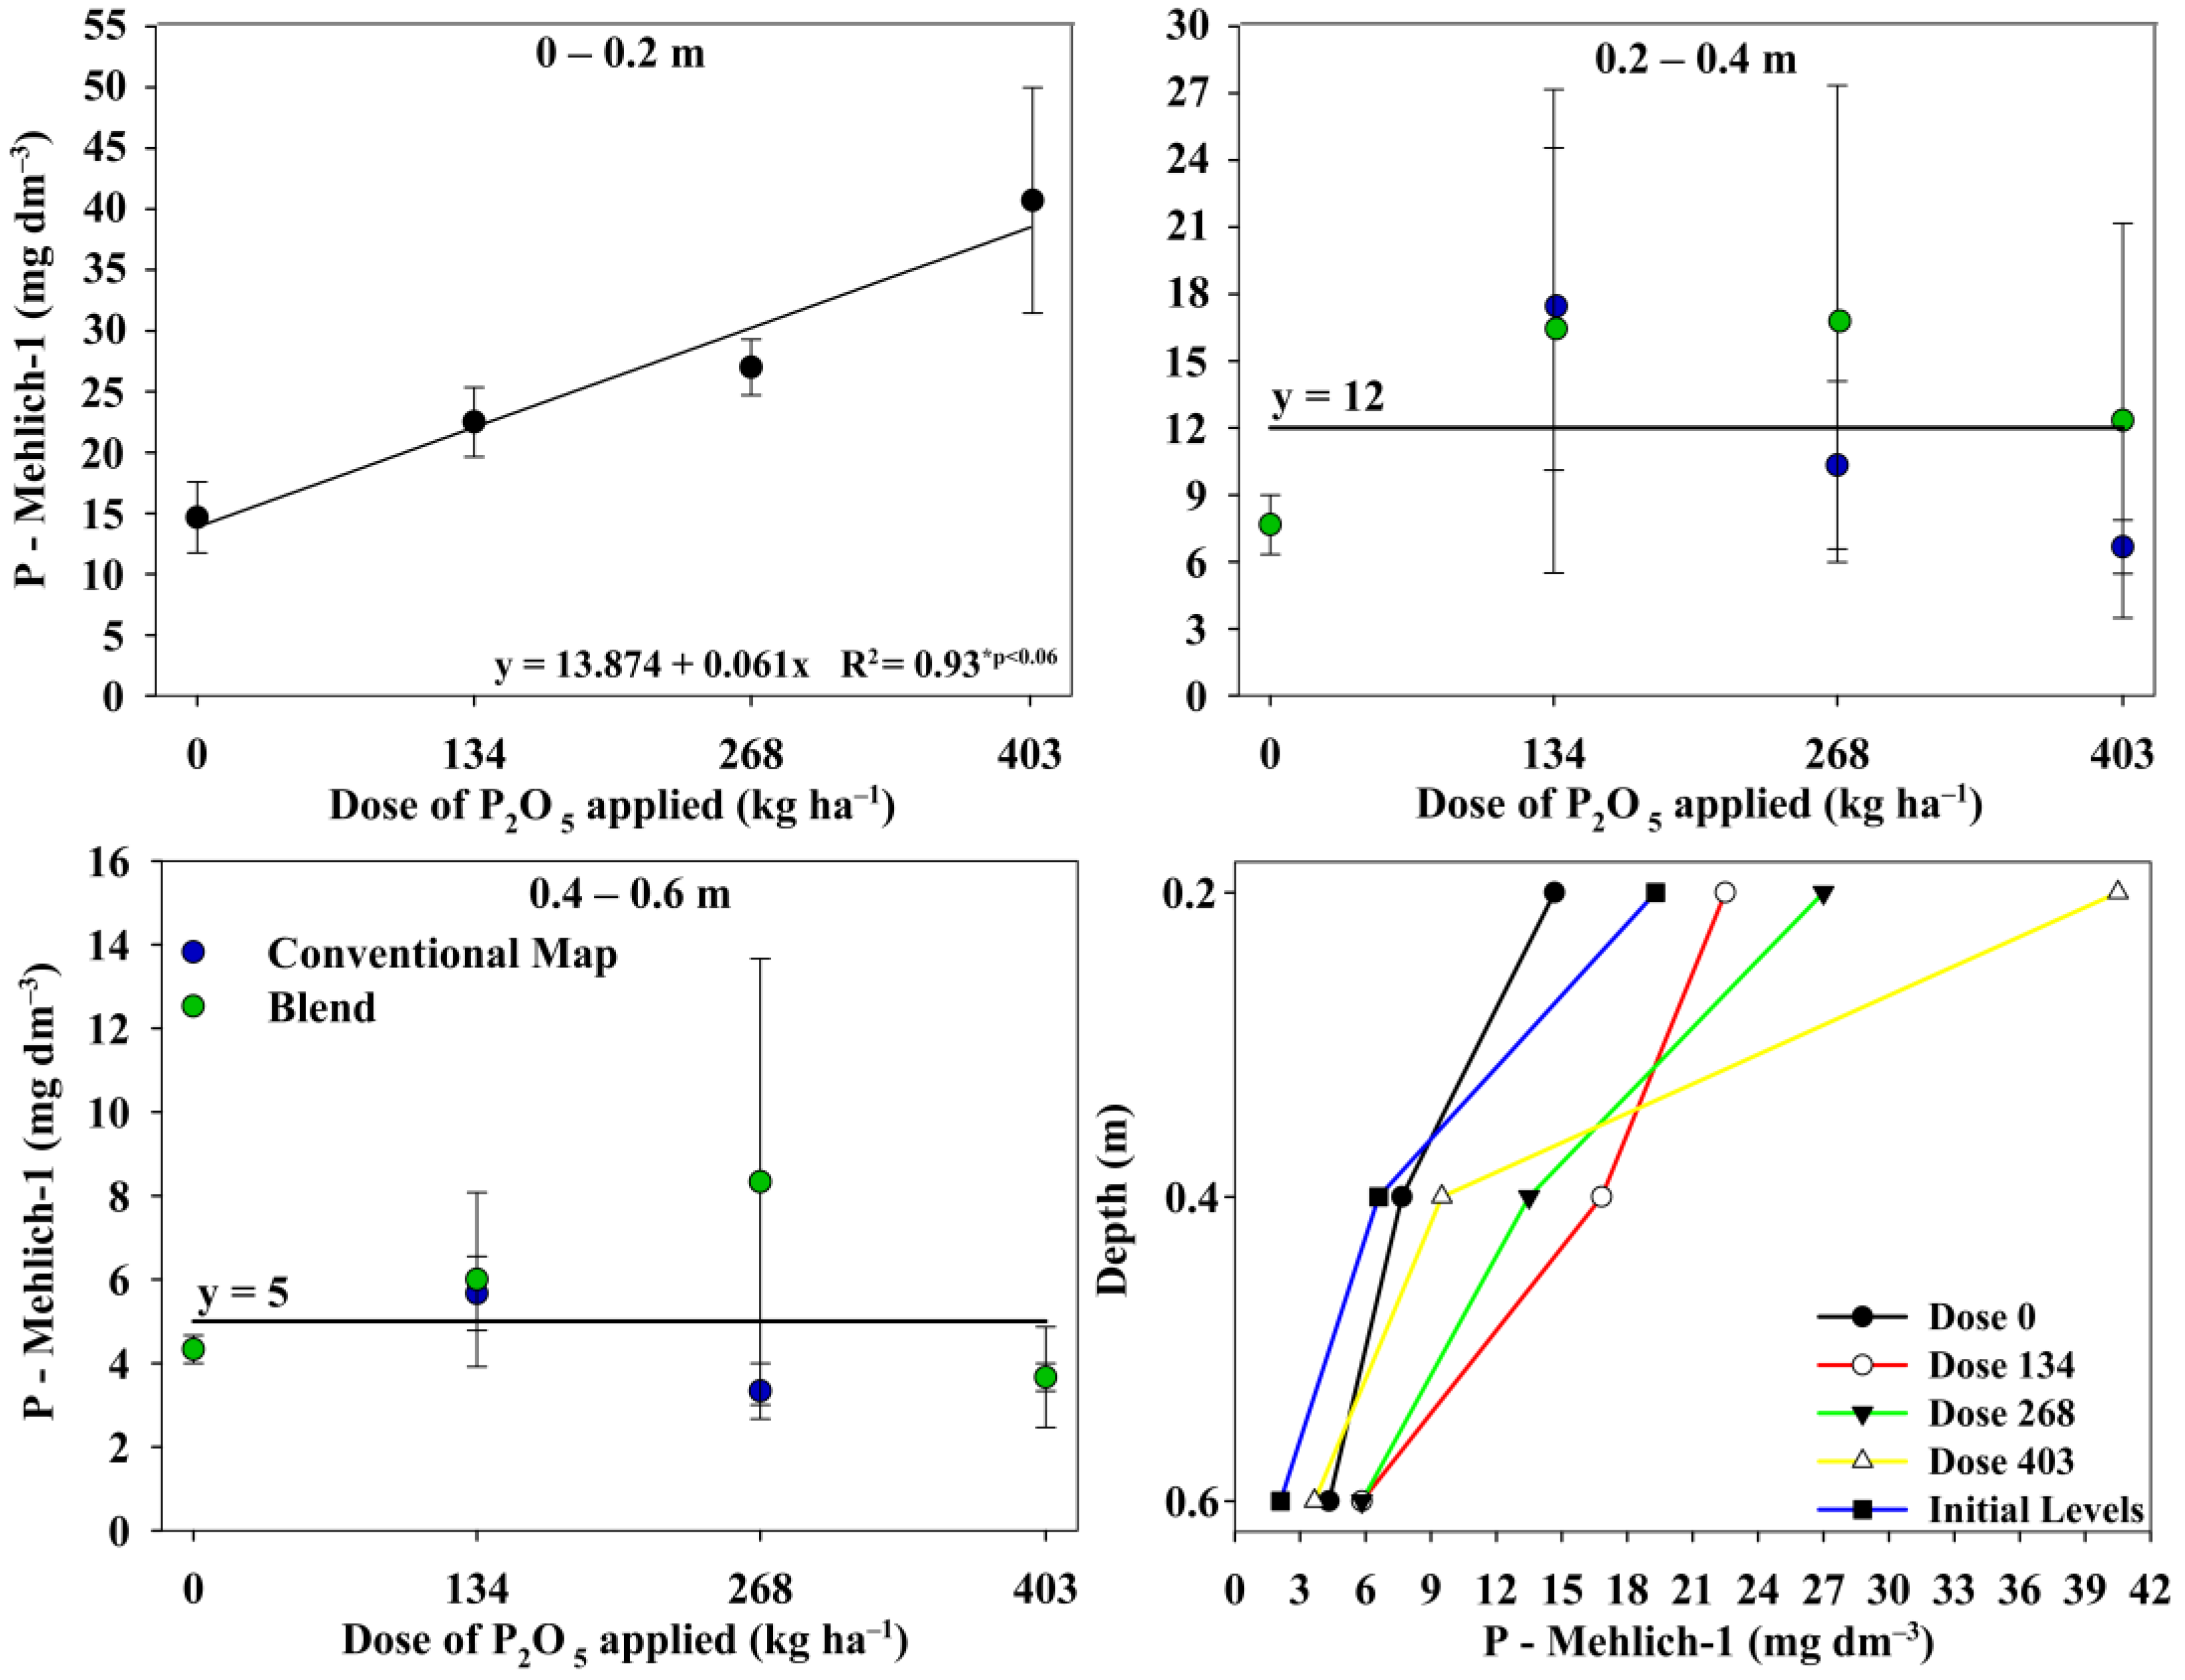
Available P (Mehlich-1) in the soil were influenced by the isolated application of P2O5 doses only at the 0.0–0.20 m depth, showing a linear increase of 0.061 mg dm−3 of available P per kg of applied P2O5. This resulted in a maximum available P level of 38.45 mg dm−3, compared to 13.87 mg dm−3 in the soil without fertilization (Figure 7).
At the other sampled depths (0.20–0.40 m and 0.40–0.60 m), P availability did not differ significantly (p < 0.05). The average P levels were 12 mg dm−3 and 5 mg dm−3, respectively.

4. Discussion

Phosphorus coffee nutrition, besides being influenced by genetic variations [3,12], is strongly linked to various agricultural practices. These practices include strategies that directly and indirectly affect P availability, such as soil amendments, inter-row cover crops, application of organic materials, and enhanced-efficiency fertilizers [4,6,29]. This study highlights the application of controlled-release phosphate fertilizers (CRPFs) and their contribution to coffee plant performance during their development.

4.1. Nutrient Release Dynamics

Nutrient release dynamics of controlled-release fertilizers are influenced by multiple factors, including those related to the coating (type, thickness, permeability), and by external environmental conditions such as the humidity and temperature of the soil and air. Additionally, when these fertilizers are incorporated into blends, the proportion of conventional fertilizers plays a significant role [4,30,31].
The effect of adding conventional fertilizer to the blend was evident when comparing the two blends used in this study. At 7 days after fertilization (DAF), the blend applied during the development phase had released 21% of its total P2O5, whereas the blend applied during the post-development phase released only 2%. This trend persisted throughout this study, with the development-phase blend releasing 97% of P2O5 by 196 DAF and the post-development blend releasing 80% by 242 DAF (harvest). These release rates correspond to an average daily rate of 0.50% and 0.33%, respectively, indicating that the addition of conventional MAP reduced the longevity of the blend and increased the amount of nutrients readily available in soil for the coffee plants.
Another benefit observed with the blend is the elimination of split fertilizer application. In coffee plantations, splitting phosphorus (P) fertilization is not a common practice; however, for nitrogen (N) and potassium (K), it is common to apply these nutrients in three to four splits per crop cycle using conventional fertilizers. In this scenario, the lack of significant differences in the method of N and K application regarding nutrient accumulation in the aerial parts (Table 2) indicates that the adoption of blended controlled-release technology with conventional fertilizers was an advancement for coffee farmers because it is feasible to reduce machinery use in farms and likewise soil compaction. When using this fertilizer management, there was no limitation in nutrient supply when applied as a single dose in comparison to split applications using conventional fertilizers. This innovative strategy helps reduce labor costs and improves the operational efficiency of machinery in farms by eliminating the need for multiple fertilizer applications, allowing efforts to be redirected to other aspects of coffee management, such as the application of coffee crop protection products and foliar fertilizers.

4.2. Agronomic Performance of Coffee Plants Associated with the Application of Fertilizer Blends and Phosphorus Doses

Reis et al. [6] and Chagas et al. [4] demonstrated improved P nutrition with CRPF, resulting in significant enhancements in photosynthetic performance, biochemical and physiological traits, and biomass production in coffee seedlings.
In this study, applying the blend resulted in 18.5% more biomass in plagiotropic branches in comparison with the conventional fertilizer. This was the only significant difference in agronomic performance between the two types of fertilizers. However, although the blend did not show other superior responses over the conventional fertilizer, the results indicated that the P release dynamics from the blend did not compromise its availability in the soil and effectively met the nutrient demands of the plants.
The experimental area showed no soil chemical attributes, such as pH (5.8) or exchangeable Al3+ (0.0 cmolc dm−3) (Table S1), that could potentially reduce the performance of phosphate fertilization. These conditions persisted along the soil profile, with Ca2+ (3.6 cmolc dm−3) and Mg2+ (1.5 cmolc dm−3) levels exceeding their critical thresholds [2,29]. Consequently, chemical limitations that could restrict P availability for the crop were not observed. A favorable environment for plant nutrition was sustained regardless of the technology used.
In general, the study results highlight the importance of phosphate fertilization for the vegetative development of coffee plants at early stages. Among the factors studied here, dose factor had the most significant impact compared to the fertilizer type and their interactions.
An adequate supply of P is essential for coffee plant development in any environment or growth stage as it supports physiological activities, photosynthesis, and, consequently, the vegetative development of the plant [32].
The results of this study support this statement, as phosphate fertilization proved crucial for increasing leaf area, with gains of 591.6, 621.8, and 2190.8 cm2 per plant observed at 90, 180, and 340 days after planting (DAP), respectively (Figure 4). As reported by Hawkesford et al. [33], low P availability in the soil impairs cell division, leading to lower leaf production and reduced leaf expansion.
In the first year of development, the coffee plant prioritizes vegetative growth and reserve accumulation. The increase in leaf area contributed to proper photosynthetic activity and consequently higher carbon assimilation, favoring the production and accumulation of plant biomass [33,34,35]. This relationship is evidenced by the positive correlation between leaf area and biomass gain and between yield and P accumulation in the aerial parts (Figure 8).
The responses to P2O5 doses in terms of aerial biomass, yield, and P accumulation in coffee plants varied within the application range of 154 to 281 kg ha−1 of P2O5 (Figure 5 and Figure 6). No significant responses were observed above this range, despite the linear increase in available soil P at the end of the evaluation period (Figure 7).
Therefore, our results indicate that the critical level of available P in the soil was 30.95 mg dm−3 (Figure 7), which corresponds to the range of responses observed for the coffee plants. This level is lower than the critical level (47.4 mg dm−3) or the ideal P content in the soil recommended for the development phase of Arabica coffee [2]. The observed difference may be attributed to variations in the overall soil fertility conditions and genetic variability of the coffee plants. For example, the MGS Paraíso 2 cultivar demonstrates increased gains in biomass under conditions of lower nutrient availability than other traditional cultivars (e.g., Mundo Novo and Catuaí) [3]. Our results suggest that this cultivar also performs better in conditions with lower P levels than the critical threshold established in recommendation bulletins.
Regarding the total aerial biomass, the maximum response dose (249 kg of P2O5 ha−1) resulted in a 25% increase in biomass (compared to the non-fertilized plants), which corresponds to 2.39 kg of biomass per kg of P2O5 applied. This 2513.25 kg total biomass production was distributed as follows: 21% in orthotropic branches, 11% in plagiotropic branches, 59% in leaves, 5% in husks, and 4% in beans. Similarly, the maximum P accumulation in the aerial parts (4.16 kg ha−1 of P) was achieved with the application of 281 kg ha−1 of P2O5, representing a 21% increase in P accumulation (compared to the non-fertilized plots) and a rate of 2.85 g of P accumulated per kg of P2O5 applied. This accumulation was partitioned in the coffee plant as follows: 14% in orthotropic branches, 17% in plagiotropic branches, 60% in leaves, 4% in husks, and 5% in beans.
In fact, during the formation phase of the plants, the total P demand for the aerial parts was relatively low (~4 kg ha−1 of P accumulated), representing a harvest index of 9% of its total accumulation, similar to the proportion of biomass produced by the reproductive structures (9% of the biomass in beans and husks). Compared to the accumulations of N (54.83 kg ha−1) and K (42.60 kg ha−1) in this study, the total P demand was 93% and 91% lower, respectively, than the demands for these two macronutrients.
However, despite the relatively low P demand, the supply of phosphate was essential for significant biomass accumulation. This result aligns with findings from other studies, where adequate P supply was responsible for 39% [12] to 52% [36] increases in the aerial biomass of coffee seedlings.
The low natural yield during the development phase of the coffee plant results in less competition between the vegetative and reproductive structures [34]. This became evident as 91% of all P in the aerial parts was concentrated in vegetative structures, with the same distribution observed for biomass increments. As the crop develops, the nutrient distribution and biomass partitioning can change due to increasing competition between vegetative growth and fruit development. For example, in 3-year-old coffee plants with low yield (~23 bags), biomass partitioning in the aerial parts was as follows: 48% in leaves, 26% in orthotropic branches, 18% in plagiotropic branches, and 8% in fruits [37]. In contrast, in an 8-year-old coffee plant with high yield (~130 bags), biomass partitioning was as follows: 21% in leaves, 41% in orthotropic branches, 17% in plagiotropic branches, and 21% in fruits [38].
Although this study did evaluate the root system, competition for biomass during this early developmental phase could also involve root growth. According to Fenilli et al. [39], in a 3-year-old coffee plantation, approximately 57% of the total biomass was concentrated in the root system, distributed down to a 100 cm depth. Based on this ratio, we can estimate the root biomass at approximately 3313.51 kg ha−1, thus indicating that the root system has significant nutrient demands at this stage. An adequate supply of P promotes root growth, increasing root biomass by 43% [12] to 60% [37] under optimal soil nutrient conditions.

5. Conclusions

Among the findings presented in this study, the main results indicate that during the development phase of coffee plants, phosphorus application rates are effective in promoting agronomic responses. P application was effective in promoting increases in biomass and leaf area of the coffee plants, both considered key parameters for proper early plant development. These nutritional and agronomic responses were limited to the P rates of 280 kg ha−1 of P2O5 after 18 months of plant development.
Soil P levels increased only in response to P application rates. The gradual phosphorus supply by blend did not increase soil available P compared to conventional MAP. However, the application of the blend promoted biomass gains in plagiotropic branches.
The average nutrient accumulation in the aerial parts after 18 months of coffee seedling cultivation (in kg ha−1) was as follows: 4 kg of P, 55 kg of N, 46 kg of K, 22 kg of Ca, 7 kg of Mg, and 4 kg of S. The micronutrients accumulated (in g ha−1) were as follows: 628 g of Fe; 160 g of B, 149 g of Mn, 71 g of Cu, and 43 g of Zn. Nutrients were mostly concentrated at an average of 74% in coffee leaves.
The findings of this study highlight the importance of adequate phosphorus fertilization and fertilizers to the development of coffee plants during the first two years after planting, which subsequently promotes greater productive longevity of the plants during the bean production phase (beyond 2 years). These results encourage further long-term field trials to validate information related to coffee crop nutrition and P uptake through the application of enhanced-efficiency fertilizers, providing a scientific basis for their application in coffee environments.

Supplementary Materials

The following supporting information can be downloaded at https://www.mdpi.com/article/10.3390/soilsystems9020047/s1, Figure S1: Growth rate of leaf area (A), plagiotropic branches (C), and plant height (D) of coffee plants as a function of the application of P2O5 doses. In this figure, the letter (B) is equivalent to the general average growth in leaf area for all treatments. Table S1: Chemical and physical properties of soil samples taken from the experimental areas at a 0.00–0.60 m depth.

Author Contributions

Conceptualization, M.P.D., A.A.A.P. and D.G.; methodology, M.P.D. and D.G.; validation, M.P.D. and D.G.; formal analysis, M.P.D.; investigation, M.P.D., L.F.S., D.P.O., H.d.A.S., G.T.d.S.R., M.E.A.d.M., A.B.d.F., C.J.H.L., E.d.S.S., A.d.S.Z., G.H.F.d.L. and J.M.S.; resources, D.G.; data curation, M.P.D., L.F.S., D.P.O., H.d.A.S., G.T.d.S.R., M.E.A.d.M., A.B.d.F., C.J.H.L., E.d.S.S., A.d.S.Z., G.H.F.d.L. and J.M.S.; writing—original draft preparation, M.P.D.; writing—review and editing, A.A.A.P. and D.G.; supervision, D.G.; project administration, D.G.; funding acquisition, D.G. All authors have read and agreed to the published version of the manuscript.

Funding

This scientific research was supported by National Council for Scientific Development and Technology (Process: 311440/2023-1).

Institutional Review Board Statement

Not applicable.

Informed Consent Statement

Not applicable.

Data Availability Statement

The original contributions presented in this study are included in the article. Further inquiries can be directed to the corresponding author(s).

Acknowledgments

The authors also extend their gratitude to Haifa Group and NKG Fazendas Brasileiras Lagoa Farm for their total support during this field trial. Agency for Improvement of Higher-Level Personnel, and the Minas Gerais Research Foundation.

Conflicts of Interest

The authors declare no conflicts of interest.

References

  1. DaMatta, F.M.; Martins, S.C.V.; Ramalho, J.D.C. Ecophysiology of Coffee Growth and Production in a Context of Climate Changes. In Advances in Botanical Research; Elsevier: Amsterdam, The Netherlands, 2024. [Google Scholar]
  2. Guimarães, P.T.G.; Reis, T.H.P.; Guelfi, D.; Mattiello, E.M.; Montanari, M. Correção e adubação de solo em cafeeiros em produção–cultivo de sequeiro. In Cafeicultura do Cerrado; Carvalho, G.R., Ferreira, A.D., Andrade, V.T., Botelho, C.E., Carvalho, J.P.F., Eds.; Epamig: Belo Horizonte, Brazil, 2021; pp. 141–172. (In Portuguese) [Google Scholar]
  3. Vilela, D.J.M.; Sousa Coelho, L.; Ramos Guelfi Silva, D.; Rodrigues Carvalho, G.; Elias Botelho, C.; Dominghetti Ferreira, A. Nutritional Efficiency in Phosphorus of Arabica Coffee Genotypes. Coffee Sci. 2021, 16, 1–9. [Google Scholar] [CrossRef]
  4. Chagas, W.F.T.; Guelfi, D.R.; Emrich, E.B.; Silva, A.L.; Faquin, V. Agronomic Efficiency of Polymer-Coated Triple Superphosphate in Onion Cultivated in Contrasting Texture Soils. Rev. Cienc. Agron. 2016, 47, 439–446. [Google Scholar] [CrossRef]
  5. Laviola, B.G.; Martinez, H.E.P.; de Souza, R.B.; Salomão, L.C.C.; Cruz, C.D. Macronutrient Accumulation in Coffee Fruits at Brazilian Zona Da Mata Conditions. J. Plant Nutr. 2009, 32, 980–995. [Google Scholar] [CrossRef]
  6. Araújo, F.H.V.; Cruz, R.d.S.; Porto, D.W.B.; Machado, C.M.M.; França, A.C. Effects of Mycorrhizal Association and Phosphate Fertilization on the Initial Growth of Coffee Plants. Pesqui. Agropecu. Trop. 2020, 50, e58646. [Google Scholar] [CrossRef]
  7. Pavinato, P.S.; Cherubin, M.R.; Soltangheisi, A.; Rocha, G.C.; Chadwick, D.R.; Jones, D.L. Revealing Soil Legacy Phosphorus to Promote Sustainable Agriculture in Brazil. Sci. Rep. 2020, 10, 15615. [Google Scholar] [CrossRef]
  8. Roy, E.D.; Richards, P.D.; Martinelli, L.A.; Coletta, L.D.; Lins, S.R.M.; Vazquez, F.F.; Willig, E.; Spera, S.A.; VanWey, L.K.; Porder, S. The Phosphorus Cost of Agricultural Intensification in the Tropics. Nat. Plants 2016, 2, 16043. [Google Scholar] [CrossRef]
  9. de Lima, T.M.; Weindorf, D.C.; Curi, N.; Guilherme, L.R.G.; Lana, R.M.Q.; Ribeiro, B.T. Elemental Analysis of Cerrado Agricultural Soils via Portable X-Ray Fluorescence Spectrometry: Inferences for Soil Fertility Assessment. Geoderma 2019, 353, 264–272. [Google Scholar] [CrossRef]
  10. Favarin, J.L.; Souza, L.T.; Mazzafera, P.; Dimenstein, L. Correção de solo e adubação do cafeeiro irrigado em produção. In Cafeicultura do Cerrado; Carvalho, G.R., Ferreira, A.D., Andrade, V.T., Botelho, C.E., Carvalho, J.P.F., Eds.; Epamig: Belo Horizonte, Brazil, 2021; pp. 173–208. (In Portuguese) [Google Scholar]
  11. dos Reis, R.A., Jr.; Pazzetti, G.; Guelfi, D.R. Enhanced Efficiency Phosphorus Fertilizer Impact on Physiological Characteristics of Coffee Seedlings. Adv. Biosci. Biotechnol. 2023, 14, 492–504. [Google Scholar] [CrossRef]
  12. Neto, A.P.; Favarin, J.L.; Hammond, J.P.; Tezotto, T.; Couto, H.T.Z. Analysis of Phosphorus Use Efficiency Traits in Coffea Genotypes Reveals Coffea Arabica and Coffea canephora Have Contrasting Phosphorus Uptake and Utilization Efficiencies. Front. Plant Sci. 2016, 7, 408. [Google Scholar] [CrossRef]
  13. Voltolini, G.B.; Vilela, M.S.; de Alecrim, A.O.; da Silva, L.C.; José Guimarães, R.; Netto, P.M.; Rezende, T.T. Techniques for Sustainable Coffee Crop Management: Impacts on Growth and Yield. Arch. Agron. Soil Sci. 2022, 69, 2413–2429. [Google Scholar] [CrossRef]
  14. Volf, M.R.; Rosolem, C.A. Soil P Diffusion and Availability Modified by Controlled-Release P Fertilizers. J. Soil Sci. Plant Nutr. 2021, 21, 162–172. [Google Scholar] [CrossRef]
  15. Sanchez, P.A. Properties and Management of Soils in the Tropics, 2nd ed.; Cambridge University Press (Virtual Publishing): Cambridge, UK, 2019; ISBN 9781316814802. [Google Scholar]
  16. Andrade, F.V.; Stauffer, E.; Siman, F.C.; de Sá Mendonça, E. Productivity and Nutrition of Conilon Coffee (Coffea canephora) in Response to Slow-Realease Fertilizers. Commun. Soil Sci. Plant Anal. 2024, 56, 800–810. [Google Scholar] [CrossRef]
  17. Timilsena, Y.P.; Adhikari, R.; Casey, P.; Muster, T.; Gill, H.; Adhikari, B. Enhanced Efficiency Fertilisers: A Review of Formulation and Nutrient Release Patterns: Enhanced Efficiency Fertilizers. J. Sci. Food Agric. 2015, 95, 1131–1142. [Google Scholar] [CrossRef] [PubMed]
  18. Ha, N.M.C.; Nguyen, T.H.; Wang, S.-L.; Nguyen, A.D. Preparation of NPK Nanofertilizer Based on Chitosan Nanoparticles and Its Effect on Biophysical Characteristics and Growth of Coffee in Green House. Res. Chem. Intermed. 2019, 45, 51–63. [Google Scholar] [CrossRef]
  19. Embrapa. Sistema Brasileiro de Classificação de Solos, 15th ed.; Embrapa: Brasília, Brazil, 2018. (In Portuguese) [Google Scholar]
  20. MAPA. Manual de Métodos Analíticos Oficiais Para Fertilizantes e Corretivos; Secretaria de Defesa Agropecuária: Brasília, Brazil, 2017. (In Portuguese) [Google Scholar]
  21. Antunes, W.C.; Pompelli, M.F.; Carretero, D.M.; DaMatta, F.M. Allometric Models for Non-Destructive Leaf Area Estimation in Coffee (Coffea arabica and Coffea canephora). Ann. Appl. Biol. 2008, 153, 33–40. [Google Scholar] [CrossRef]
  22. Bremner, J.M.; Breitenbeck, G.A. A Simple Method for Determination of Ammonium in semimicro-Kjeldahl Analysis of Soils and Plant Materials Using a Block Digester. Commun. Soil Sci. Plant Anal. 1983, 14, 905–913. [Google Scholar] [CrossRef]
  23. Mehlich, A. Rapid Determination of Cation and Anion Exchange Properties and pHe of Soils. J. AOAC Int. 1953, 36, 445–457. [Google Scholar] [CrossRef]
  24. R Core Team. R: A Language and Environment for Statistical Computing; R Foundation for Statistical Computing: Vienna, Austria, 2020; Available online: https://www.R-project.org/ (accessed on 15 June 2024).
  25. Pena, E.A.; Slate, E.H. Global Validation of Linear Model Assumptions. J. Am. Stat. Assoc. 2006, 101, 341–354. [Google Scholar] [CrossRef]
  26. Ferreira, E.B.; Cavalcanti, P.P.; Nogueira, D.A. ExpDes: An R Package for ANOVA and Experimental Designs. Appl. Math. 2014, 05, 2952–2958. [Google Scholar] [CrossRef]
  27. SigmaPlot, Version 12.5; Systat Software, Inc.: San Jose, CA, USA, 2013.
  28. ISO 21263:2017; Slow-Release Fertilizers-Determination of the Release of the Nutrients-Method for Coated Fertilizers. ISO: Geneva, Switzerland, 2017.
  29. Mattiello, E.M.; Pereira, M.G.; Zonta, E.; Mauri, J.; Matiello, J.D.; Meireles, P.G.; Silva, I.R. da Produção de Matéria Seca, Crescimento Radicular e Absorção de Cálcio, Fósforo e Alumínio Por Coffea canephora e Coffea Arabica Sob Influência Da Atividade Do Alumínio Em Solução. Rev. Bras. Cienc. Solo 2008, 32, 425–434. [Google Scholar] [CrossRef]
  30. Lawrencia, D.; Wong, S.K.; Yi, D.; Low, S.; Goh, H.; Goh, J.K.; Ruktanonchai, U.R.; Soottitantawat, A.; Lee, H.; Tang, S.Y.; et al. Controlled Release Fertilizers: A Review on Coating Materials and Mechanism of Release. Plants 2021, 10, 238. [Google Scholar] [CrossRef]
  31. Vejan, P.; Khadiran, T.; Abdullah, R.; Ahmad, N. Controlled Release Fertilizer: A Review on Developments, Applications and Potential in Agriculture. J. Control Release 2021, 339, 321–334. [Google Scholar] [CrossRef]
  32. da Silva, L.; Marchiori, P.E.R.; Maciel, C.P.; Machado, E.C.; Ribeiro, R.V. Fotossíntese, Relações Hídricas e Crescimento de Cafeeiros Jovens Em Relação à Disponibilidade de Fósforo. Pesqui. Agropecu. Bras. 2010, 45, 965–972. [Google Scholar] [CrossRef]
  33. Hawkesford, M.J.; Cakmak, I.; Coskun, D.; Kok, D.; Lambers, L.J.; Schjoerring, H.; White, J.K. Marschner’s Mineral Nutrition of Plants, 4th ed.; Rengel, Z., Cakmak, I., White, P.J., Eds.; Academic Press: Cambridge, MA, USA, 2023. [Google Scholar]
  34. DaMatta, F.M.; Ronchi, C.P.; Maestri, M.; Barros, R.S. Ecophysiology of Coffee Growth and Production. Braz. J. Plant Physiol. 2007, 19, 485–510. [Google Scholar] [CrossRef]
  35. do Amaral, J.A.T.; Rena, A.B.; Amaral, J.F.T. do Crescimento Vegetativo Sazonal Do Cafeeiro e Sua Relação Com Fotoperíodo, Frutificação, Resistência Estomática e Fotossíntese. Pesqui. Agropecu. Bras. 2006, 41, 377–384. [Google Scholar] [CrossRef]
  36. do Amaral, J.F.T.; Martinez, H.E.P.; Laviola, B.G.; Fernandes Filho, E.I.; Cruz, C.D. Eficiência de Utilização de Nutrientes Por Cultivares de Cafeeiro. Cienc. Rural 2011, 41, 621–629. [Google Scholar] [CrossRef]
  37. Fenilli, T.A.B.; Reichart, K.; Bacchi, O.O.S.; Trivelin, P.C.O.; Dourado-Neto, D. The 15N Isotope to Evaluate Fertilizer Nitrogen Absorption Efficiency by the Coffee Plant. An. Acad. Bras. Cienc. 2007, 79, 767–776. [Google Scholar] [CrossRef]
  38. Bruno, I.P.; Unkovich, M.J.; Bortolotto, R.P.; Bacchi, O.O.S.; Dourado-Neto, D.; Reichardt, K. Fertilizer Nitrogen in Fertigated Coffee Crop: Absorption Changes in Plant Compartments over Time. Field Crops Res. 2011, 124, 369–377. [Google Scholar] [CrossRef]
  39. Fenilli, T.A.B.; Reichardt, K.; Favarin, J.L.; Bacchi, O.O.S.; Silva, A.L.; Timm, L.C. Fertilizer 15N Balance in a Coffee Cropping System: A Case Study in Brazil. Rev. Bras. Cienc. Solo 2008, 32, 1459–1469. [Google Scholar] [CrossRef]
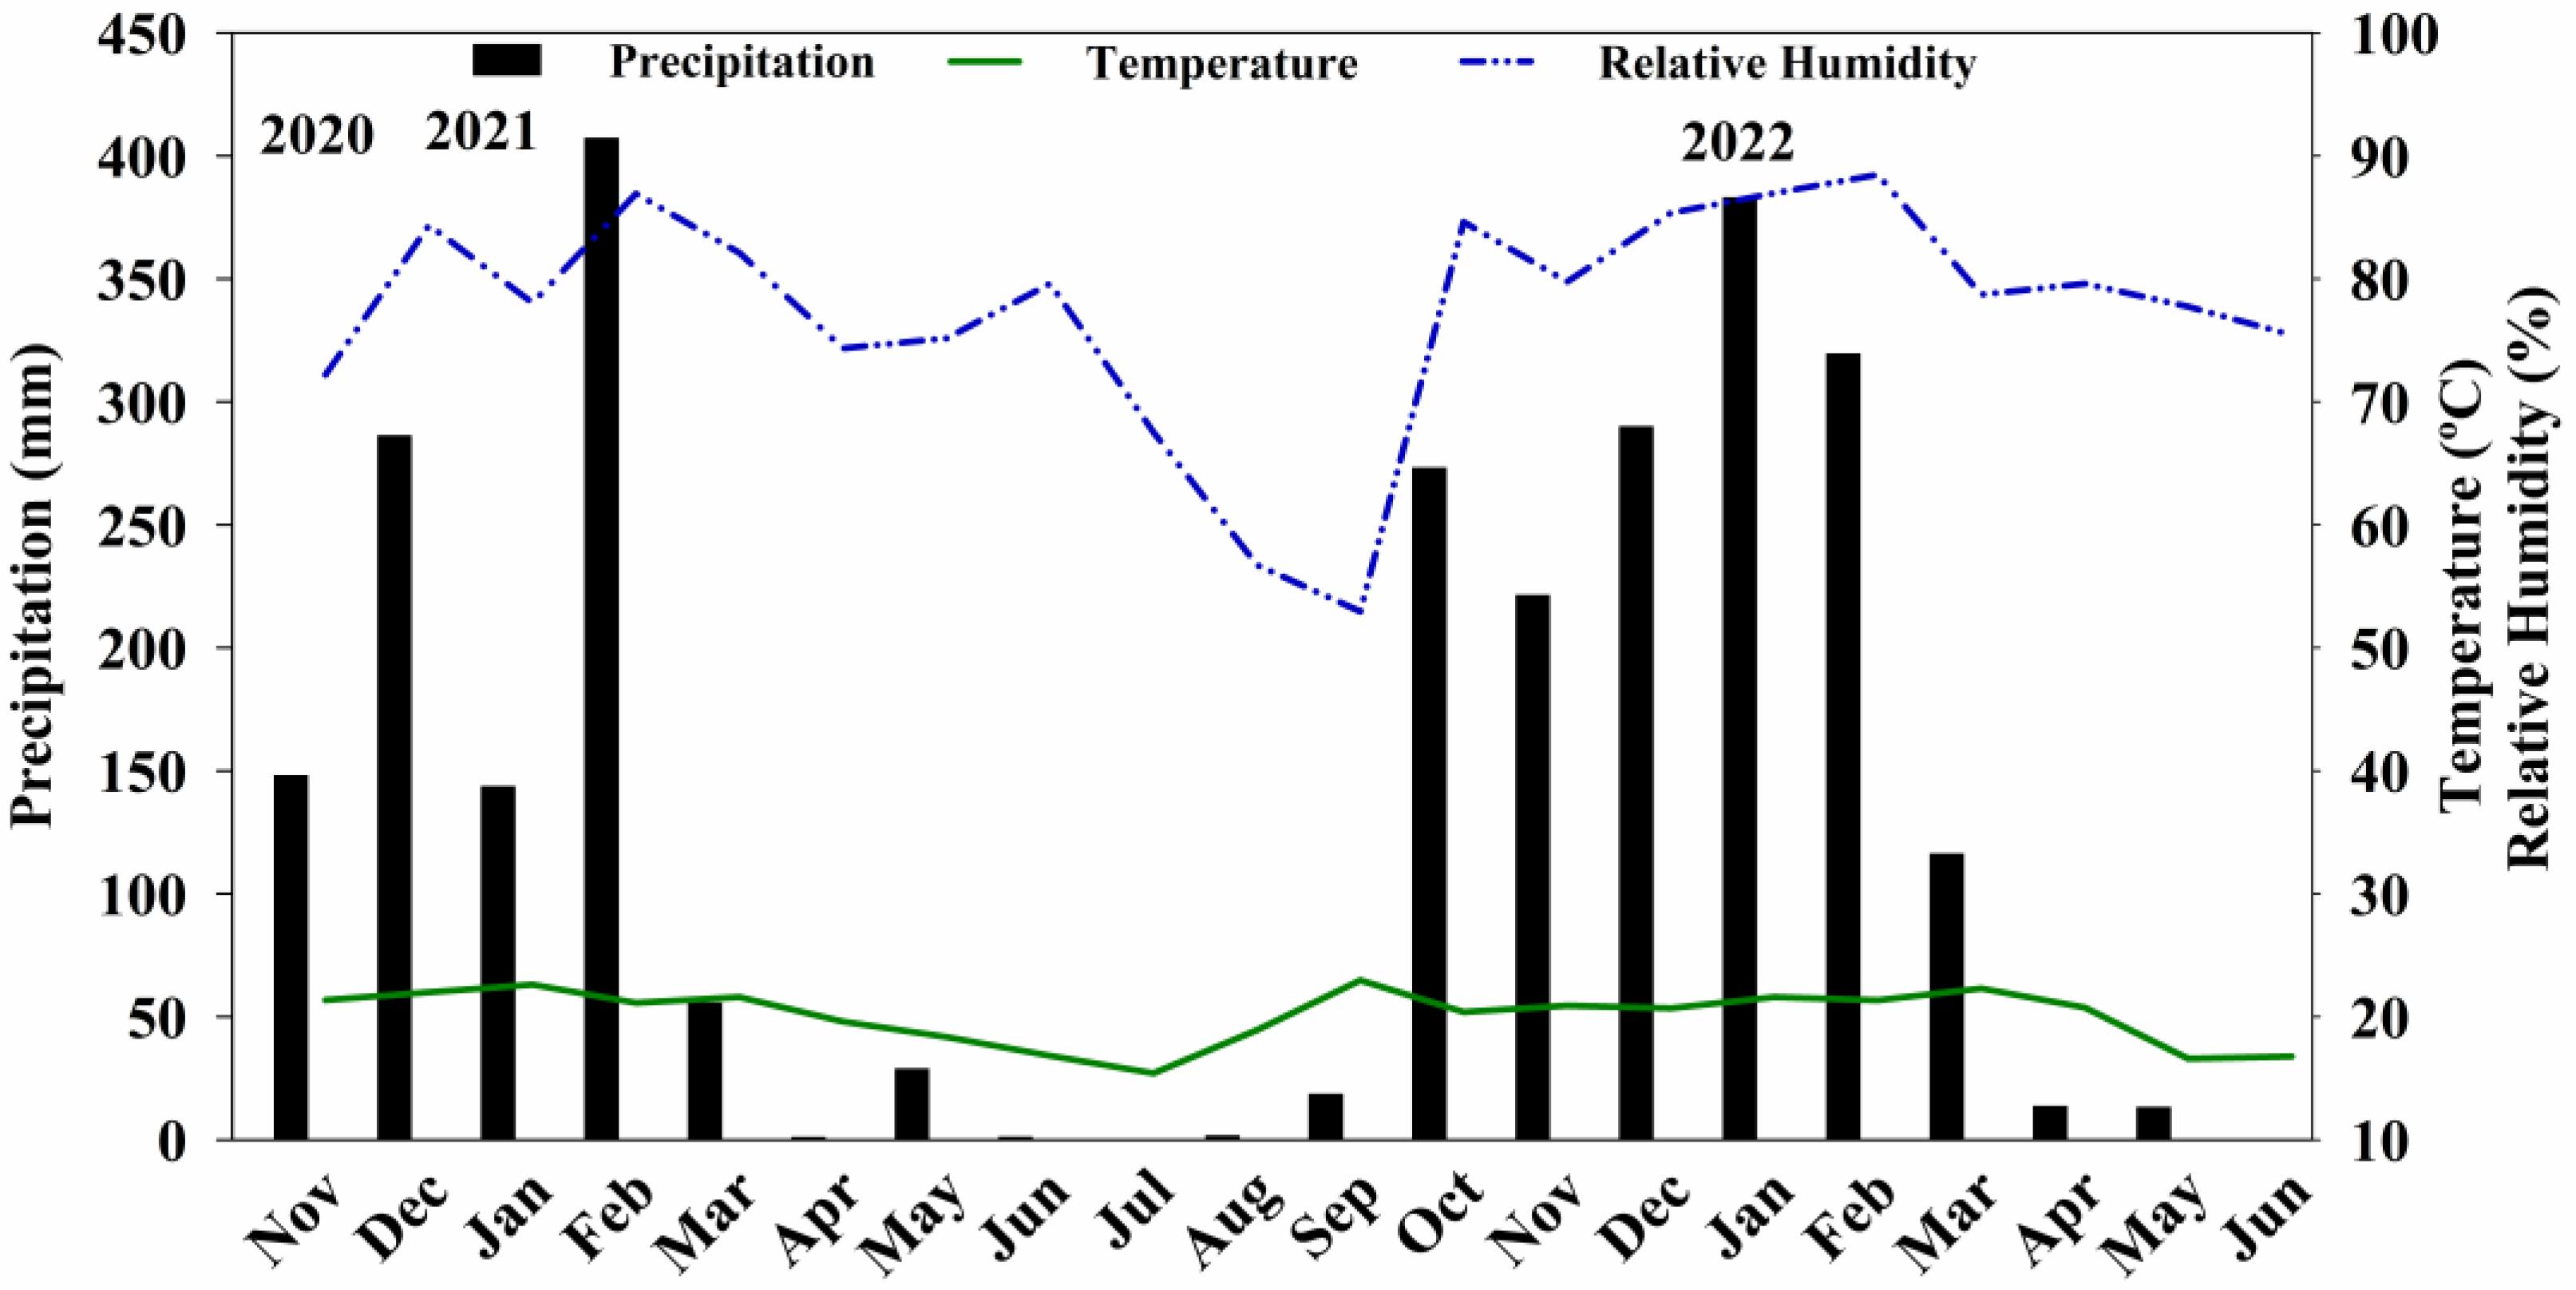
Figure 1. Climatic variables of the coffee plantation area from November 2020 to June 2022.
Soilsystems 09 00047 g001
Figure 2. Scanning electron micrograph (SEM) of polymer-coated phosphate fertilizers and images captured by a stereomicroscope. (A,B) A cross-section of the granule was imaged to observe the thickness and uniformity of the coating under SEM. (C,D) Images captured by a stereomicroscope. ((A,C) Map 4 m and (B,D) map 8 m.)
Soilsystems 09 00047 g002
Figure 3. Fitted nutrient release model for the blend. Data represent mean ± standard error (n = 3).
Soilsystems 09 00047 g003
Figure 4. Increase in coffee leaf area as a function of P2O5 application rates. Letters (AD) represent the time intervals of leaf area increase, corresponding to 90, 180, 340, and 470 days after planting. Data represent mean ± standard error (n = 3).
Soilsystems 09 00047 g004
Figure 5. Biomass production of coffee plant aerial parts as influenced by P2O5 application rates, categorized by vegetative and reproductive structures. Letters (AF) correspond to the following structures: orthotropic branch, plagiotropic branch, leaves, bean yield, husks, and total biomass. Values are presented as mean ± standard error (n = 3). Means sharing the same letters do not differ significantly according to Tukey’s test (p < 0.05).
Soilsystems 09 00047 g005
Figure 6. Phosphorus accumulation in the aerial parts of coffee plants as influenced by P2O5 application rates, categorized by vegetative and reproductive structures. Letters (AF) correspond to the following structures: Orthotropic Branch, Plagiotropic Branch, Leaves, Grains, Husks, and Aerial Part. Values are presented as mean ± standard error (n = 3).
Soilsystems 09 00047 g006
Figure 7. Phosphorus availability (Mehlich-1) in the soil as a function of P2O5 application rates at 0–0.2, 0.2–0.4, and 0.4–0.6 m depths. Data represent mean ± standard error (n = 3).
Soilsystems 09 00047 g007
Figure 8. Spearman’s correlation between the variables: leaf area, dry biomass, phosphorus accumulation, and available phosphorus levels in the soil. P_cum corresponds to phosphorus accumulated in the following structures: orthotropic branch (Orto), plagiotropic branch (Plag), leaves, husks, beans, and aerial parts (AerialP). DM_ refers to the dry biomass of the following structures: orthotropic branches (Orto), plagiotropic branches (Plag), leaves, husks, beans, and aerial parts (AerialP). Leaf_area represents the increase in leaf area at 90, 180, and 340 DAP, respectively. P_available_soil refers to available phosphorus in soil at a 0.20 m depth.
Soilsystems 09 00047 g008
Table 1. Fitted models for determining nutrient release for the blend in the development and post-development phases.
NutrientsEquationsR2
Development
N CR   ( % ) = 38.28 + 67.06 1 + ( N 62.86 )   1.70 0.97
P2O5 CR   ( % ) = 216.11 + 208.94 ( lnP 2 O 5 )     54.27 ( lnP 2 O 5 ) 2 + 4.91 ( lnP 2 O 5 ) 3 0.97
K2O CR   ( % ) =   890.20 + 1023.94 1 + ( K 2 O 0.008 )   0.328 0.97
Post-development
N CR   ( % ) = 13.56 + 71.78 1 + e N     88.04 21.77 0.99
P2O5 CR   ( % ) =   48.64 + 131.03 1 + e P 2 O 5     30.82 51.15 0.99
K2O CR   ( % ) =   5.19 + 93.17 1 + e K 2 O     63.20 43.34 0.99
CR = cumulative release.
Table 2. Accumulated macro- and micronutrients in the aerial parts of 18-month-old coffee plants.
Rates of P2O5
(kg ha−1)
Orthotropic Branch
kg ha−1g ha−1
NKCaMgSBCuFeMnZn
04.664.541.600.410.2310.968.6060.115.714.95
1434.653.181.530.460.228.649.7574.395.815.34
2685.043.921.750.490.249.7511.6868.878.905.84
4035.833.831.580.420.2310.5211.2076.827.395.70
Plagiotropic Branch
04.495.481.730.820.318.178.8035.949.047.18
1434.765.811.740.750.288.288.4341.148.969.49
2684.825.921.790.750.299.579.2736.569.927.89
4034.835.411.830.820.318.529.1043.709.428.96
Leaves
036.0224.4014.584.042.6494.8038.62338.31132.2920.39
14338.7829.8616.284.433.00128.1143.30452.41115.3324.48
26843.4729.7917.934.952.83132.0345.33353.22124.6624.40
40343.5331.5217.054.802.74130.4443.29471.0695.9824.43
Husks
00.780.980.140.040.071.780.9415.980.710.58
1432.122.680.330.120.185.362.6552.081.811.78
2682.333.150.360.130.206.092.6359.481.981.91
4032.673.250.360.140.215.282.8456.572.012.47
Beans
01.130.770.040.110.070.730.873.860.890.47
1432.781.700.090.230.162.121.847.531.710.87
2683.252.080.110.280.202.242.109.212.141.09
4033.402.130.100.290.211.752.208.852.121.03
Aerial Parts
047.0736.1618.095.433.32116.4557.83454.20148.6433.58
14353.0943.2319.985.993.84152.5065.96627.56133.6141.96
26858.9144.8621.946.603.77159.6871.01527.34147.6041.12
40360.2646.1420.916.473.70156.5168.63657.00116.9142.59
Mean54.8342.6020.236.123.66146.2865.86566.53136.6939.81
StructureProportion of the Nutrients in the Aerial Parts (%)
Orthotropic9.209.087.997.316.296.8115.6512.365.0813.70
Plagiotropic8.6213.288.7612.818.175.9013.516.946.8321.05
Leaves73.7767.8381.3674.3976.6782.9564.7471.2785.6458.84
Husk3.605.901.471.784.483.163.448.131.194.23
Beans4.813.920.423.714.391.172.661.301.252.17
Disclaimer/Publisher’s Note: The statements, opinions and data contained in all publications are solely those of the individual author(s) and contributor(s) and not of MDPI and/or the editor(s). MDPI and/or the editor(s) disclaim responsibility for any injury to people or property resulting from any ideas, methods, instructions or products referred to in the content.