Article

Conservation Reserve Program Soils Show Potential as a Soil Health Benchmark—A Southern Minnesota Case Study

1
School of Environment and Natural Resources, The Ohio State University, Columbus, OH 43210, USA
2
Soil and Crop Science Department, Colorado State University, Fort Collins, CO 80523, USA
3
Faribault County Soil and Water Conservation District, Blue Earth, MN 56013, USA
*
Author to whom correspondence should be addressed.
Soil Syst. 2025, 9(2), 46; https://doi.org/10.3390/soilsystems9020046
Submission received: 1 March 2025 / Revised: 17 April 2025 / Accepted: 8 May 2025 / Published: 12 May 2025
(This article belongs to the Special Issue Research on Soil Management and Conservation: 2nd Edition)

Abstract

:
Soil health is an important concept in promoting sustainable agriculture and food security, yet the absence of universally accepted benchmarks limits its utility in assessing soil function. This study explored the use of Conservation Reserve Program (CRP) soils as a potential benchmark to quantify the soil health gap (SHG) in Faribault County, Minnesota. Using the Soil Management Assessment Framework (SMAF), we evaluated physical, chemical, biological, and nutrient soil health indicators to derive a combined overall score that was used to quantify the SHG (i.e., benchmark soil minus test soil) between CRP and corn-based agricultural production (AP). Three paired farms were assessed, each consisting of CRP tall grass prairie established in 2001 and adjacent long-term AP. The results showed higher overall SMAF scores in CRP soils, with a mean SHG of 0.09. Land use had a strong influence on overall scores, largely driven by biological indicators such as soil organic carbon, microbial biomass carbon, and β-glucosidase activity. However, the SMAF demonstrated limited applicability in CRP systems, potentially under-representing their soil health status due to the SMAF’s agricultural emphasis and lack of ecosystem-specific factors such as pH.

1. Introduction

Agriculture plays a critical role in producing food, feed, fuel, and fiber to meet the needs of a growing population. However, innovations in agricultural production in the early and mid-20th century have often compromised environmental quality [1]. In recent decades, special interest has been placed on the disagreement between conventional agricultural production and environmental protection, with soil health emerging as a promising tool for bridging the gap between them [2]. While soil health monitoring and management is recognized as a tool to bridge crop production and environmental stewardship, the scientific foundation of the topic is lagging behind its widespread implementation [3]. Traditionally, soil health indicators and frameworks have been focused on row crop agricultural systems despite the growing interest in frameworks that apply to other land uses [4]. This highlights the need for updated soil health quantification tools that are regionally applicable and accurate across diverse land uses [5,6]. Concurrently, the inclusion of context-appropriate soil health benchmarks, standards against which soils of interest can be compared to, have the potential to provide more relevant assessments of soil health status. With such benchmarks, soil health testing and management can be applied more effectively to build resilient agroecosystems that may currently be degraded.
Soil degradation, which we consider the soil health gap (SHG) in the context of this paper, is simply the benchmark soil minus the test soil. Identifying the SHG must start with quantification as it attempts to understand where on a holistic functionality scale any given soil is placed (i.e., fully degraded to fully functional). Attempts to minimize the SHG are rooted within the four principles of soil health promoted by the United States Department of Agriculture—Natural Resources Conservation Service [7], which are to (1) maximize the presence of living roots; (2) minimize soil disturbance; (3) maximize soil cover; and (4) maximize biodiversity through crops and livestock. Quantifying the effects of implementing the previously listed soil health principles is rooted in soil health frameworks.
The Soil Management Assessment Framework (SMAF) is an internationally utilized soil health framework that interprets soil health testing data to deliver site-specific soil health scores [8]. Despite widespread usage of the framework, several studies have criticized its limited ability to derive relevant soil health scores when applied to various land uses and soil types [9,10]. Furthermore, the SMAF is not fully accepted internationally as the framework is most relevant to agricultural systems and soil types in the United States [9,11]. Despite these limitations, the SMAF contains interpretations that make the framework site-specific and has been proven to show sensitivity to agricultural management changes [10,12,13,14]. A framework such as the SMAF is critical to understanding the degree to which soils have been degraded as it accounts for soil physical, chemical, biological, and nutrient properties. However, benchmark soils hosting the full suite of soil health principles are also necessary in quantifying soil degradation as they can serve as a localized reference state.
Native ecosystems have been proposed as a reference point for quantifying the SHG, but due to extensive conversion to agricultural and urban uses, identifying true native soils can be challenging and occasionally impossible for regions of the U.S. [15]. As an alternative to using native soils as a benchmark, we propose the option of utilizing the Conservation Reserve Program (CRP) as a benchmark. CRP lands can be found across the entire U.S. and conserves environmentally sensitive land by restoring a semi-native ecosystem. The goals of the program as outlined by the NRCS are to improve water quality, prevent erosion, and reduce wildlife habitat loss [16]. As of 2023, 9.3 million hectares were enrolled in the CRP, spanning all 50 U.S. states but predominantly in the upper Midwest and high plains (for information on how the CRP operates, see [16]). Utilizing the CRP as a soil health benchmark may provide a widely distributed 6and regionally relevant reference for assessing soil health across diverse landscapes.
CRP soils serve as a unique middle ground between undisturbed native soils and intensively managed agricultural systems. Although CRP lands have been under agricultural management previously, they are managed with the intent of long-term conservation, incorporating all USDA-NRCS soil health principles. Previous studies of CRP systems have validated the goals associated with the program, and demonstrated improvements in soil biological, physical, and chemical properties [17,18,19]. While CRP fields vary in age and vegetation type, their shared goal of ecological restoration offers a semi-standardized condition of improved soil function. Therefore, CRP soils show potential to serve as a benchmark, especially in regions where native prairie or forest systems are limited or not present. The broad geographic presence and regionally relevant management makes CRP sites valuable proxies for evaluating the SHG.
Here, we propose the use of the CRP as a national soil health benchmark, along with raising awareness of the lack of universal applicability behind the quantification of soil health. To our knowledge, proposing the CRP as a potential soil health benchmark is a novel concept, and CRP soils have not been explicitly tested or analyzed with the SMAF protocol. We designed a case study in Southern Minnesota that quantified soil health in CRP and agricultural production (AP) systems using the Soil Management Assessment Framework (SMAF) and used those values to evaluate the soil health gap (SHG = CRP − AP). It was hypothesized that CRP systems would have consistently higher SMAF scores than the AP systems and that the CRP would show potential to serve as a soil health benchmark by delivering consistent and replicable SMAF scores.

2. Materials and Methods

2.1. Site Description

Three paired farms (H, S, and E) were selected in central Faribault County, Minnesota, each consisting of an AP field adjacent to a CRP field. The mean annual temperature is 7.4 °C, with summer (i.e., July) and winter (i.e., January) temperatures averaging 22.8 °C and −9.0 °C, respectively [20]. The mean annual precipitation is 914 mm, with a wet period between May and September, averaging greater than 80 mm of precipitation each month [20]. The main crops in this county are rainfed corn and soybeans, and in 2022 accounted for 91% of agricultural land, which makes up 90% of the total area [21].
The AP fields ranged from 6 to 7 hectares and were selected to reflect real-world variability in management, ranging from minimal to multiple soil health principles. While each has a unique management history, all AP fields can be characterized by historically aggressive tillage (i.e., moldboard plow) and field corn production since the mid-1800s.
From 1996 to 2021, site H-AP used aggressive and frequent tillage, typically consisting of 3 to 4 passes per year beginning in the fall with a moldboard plow followed by spring passes using a disc ripper, field cultivator, and occasionally a vertical tillage implement. This field also historically lacked crop rotation, typically following a corn-on-corn system with soybeans planted every 5 to 10 years.
From 2016 to 2020, site S-AP used moderately aggressive tillage with two passes per year of discing ripping while following a corn–soybeans rotation. However, in 2020, the field changed ownership, and along with this change came new management focused on soil health practices (Table 1). The staple cover crop used was cereal rye, one of the few cover crops that can over-winter the harsh MN winters. Before crop planting in the spring, the cover crops were sprayed with herbicide, roller-crimped, and then drilled directly into the cover. In the fall of 2023, cattle manure was spread on the field at a rate of 9 Mg ha−1.
Site E utilized 1 to 2 strip tillage passes per year for corn and no-till for soybeans. A cereal rye cover crop was used before corn and terminated via an herbicide in the spring and roller-crimped, and then soybeans were planted into the residue. Buckwheat was interseeded mid-season into soybeans and terminated via winter kill. Site E-AP had been practicing several soil health practices for 15 years before sampling (Table 1). Although farm E implemented all four soil health principles, they did so to a slightly lesser degree than site S-AP as they did not add manure nor use continuous no-till.
The CRP sites were used as a benchmark as they incorporated all soil health principles: no disturbance (physical or chemical), living roots year-round, higher biodiversity (including observations of animal presence), and soil cover year-round. The CRP sites range from 4 to 6 ha in size, had been enrolled in the program for a minimum of 20 years (since 2001), and were previously farmed using conventional practices (Table 1). The H-CRP site was enrolled in CRP, while the E-CRP and S-CRP sites were enrolled in the Conservation Reserve Enhancement Program (CREP). The CRP and CREP programs are fundamentally the same in terms of restoring the semi-native ecosystem, with the only difference being that the CREP receives state funding along with federal. Additional information regarding all AP and CRP sites is presented in Table 1.

2.2. Soil Sampling and Processing

Soil samples were collected between 12 and 14 August 2023. Forty total composite soil samples were collected: five samples from farms E and S for both the CRP and AP, while ten samples were collected at farm H as it was the pilot study. During soil sampling, H-AP was growing soybeans, E-AP was growing corn, and S-AP was in an early-stage cover crop post field pea harvest. Soil samples were taken using a 1.5 cm diameter soil probe to a depth of 15 cm. Approximately 30–40 cores were collected within a 3 m radius centered around a GPS-located sampling point, composited in a 5-gallon bucket, transferred to a plastic bag, sealed and placed in a cooler on ice. Within this sampling radius, an additional soil core was collected to 15 cm, carefully transferred to a tin can, and immediately weighed for analysis of bulk density.
All soil was then transferred to a refrigerator on the same day, and within a week, transported on ice to the Colorado State University—Soil Health and Environmental Quality Laboratory for processing and analysis. Bulk density (Bd) and gravimetric moisture content were determined on soils in tin cans by using the in-field moist core weight and oven-drying at 105 °C for 24 h, followed by weighing again. The composite samples were passed through an 8 mm sieve to remove coarse rocks and plant debris. Approximately 150 g of field-moist, 8 mm sieved soil was stored at 4 °C prior to microbial biomass carbon (MBC) analysis, which was analyzed within one week of sample collection. An additional 500 g of soil was passed through a 2 mm sieve and air-dried, while the remainder of the 8 mm sieved soil was also air-dried, for further analysis.

2.3. Soil Mangement Assessment Framework

The Soil Management Assessment Framework (SMAF [8]) is a Microsoft Excel-based tool designed to evaluate and interpret soil health measurements. The SMAF utilizes non-linear curve modeling to transform raw indicator values into unitless scores ranging from 0 to 1 (0 being “poor” and 1 being “optimal”). The scoring of each indicator is based on the cropping system and select inherent or soil forming factors (i.e., texture [22], climate, and taxonomic suborder driving SOC accrual), identified by the SMAF as factor classes, that determine the non-linear scoring curves. Indicators are split into four broad categories: soil physical indicators (Bd and water-stable aggregation [WSA] [23]), soil chemical indicators (pH [pH1:1] [24] and electrical conductivity [EC1:1] [25]), soil nutrient indicators (plant-available P and K [26]), and soil biological indicators (β-glucosidase activity [BG] [27], potentially mineralizable N [PMN] [28], soil organic C [SOC] [29,30], and MBC [31]). Additionally, the SMAF uses scoring curves based on “more is better” (i.e., SOC), “less is better” (i.e., Bd), and “optimal range” (i.e., plant-available P) that represent the scientific understanding of where beneficial or detrimental values lie. These indicator scores were then pooled and averaged to derive a physical soil health index (SHI), chemical SHI, nutrient SHI, biological SHI, and overall SHI, which is simply the conglomerated scores. The indicators listed above were selected by Andrews et al. [8] due to representation of key soil ecosystem services and sensitivity to land management changes [32]. More detailed information and analyses for SMAF indicators can be found in the Supplementary Materials and are outlined by Andrews et al. [8], Trimarco et al. [14], and Ippolito et al. [33].

2.4. Statistical Analysis

Non-parametric statistical analysis was performed as much of the data violated the assumption of homogeneity of variance. The Mann–Whitney test was performed when comparing raw values and scores for treatment (i.e., AP vs. CRP). The Kruskal–Wallis test was used when comparing raw values and scores within the treatment (i.e., H-CRP to E-CRP to S-CRP) with a Dunn post hoc analysis. All data wrangling and statistical analysis were performed in RStudio (Build 369) using R (v 4.4.0) and the dplyr package (Version 1.1.4), tidyr package (Version 1.3.1), stats package (Version 4.4.2), and FSA package (Version 0.9.6). The statistical analysis was evaluated at an α of ≤0.05.

3. Results and Discussion

3.1. Soil Management Assessment Framework Indicators

Numerous SMAF indicators were sensitive to land use (AP vs. CRP) and are reported in Table 2 and Table 3. The measured values indicated more optimal values in CRP plots for physical (WSA) and biological (SOC, MBC, PMN, and BG) indicators, each of which proved significant (Table 2). The less optimal physical indicator values in the AP plots likely resulted from tillage and less crop residue remaining on the field, reducing aggregation. Lower biological indicator values in AP fields were likely driven by reduced carbon inputs, limited crop diversity, decreased presence of living roots, less diverse carbon sources, and increased soil disturbance compared to CRP fields. The more optimal biological indicator values found in the CRP systems are corroborated by Li et al. [34], where they found increased microbial biomass in Texas CRP systems, and Tyler et al. [35], where they observed greater values for MBC and BG in Mississippi CRP plots. However, these findings are contradicted by a study conducted by De et al. [36] in Southwest MN and Northwest IA, where they found that the CRP, even after 40 years, had relatively minor impacts on soil health indicators (SOC, Bd, PMN, and minimum water holding capacity). Although the measured values for SMAF indicators of chemical (EC) and nutrient (plant-available P) soil health were significant, they provided little insight given the contrasting goals between the two systems, along with the fact that there is little concern for EC in this region of the U.S. due to typical EC values being far below the 4 dS m−1 threshold and precipitation leaching salts from soil profile (Table 2).

3.2. Soil Management Assessment Framework Scores

The interpretation and transformation of individual measured SMAF indicators to scores provided less insightful results despite the normalization of values utilizing site-specific information (i.e., texture, climate, crop, and organic matter class). Only biological indicator scores for SOC, MBC, and BG were significantly greater in CRP as compared to AP (Table 3). Although WSA and PMN measured values indicated significantly greater values in CRP (Table 2), the SMAF interpretation process transformed WSA and PMN to optimal scores of 1.00, potentially limiting our ability to detect differences for these indicators (Table 3, [6]). This finding highlights a potential limitation of the SMAF and is corroborated by Nunes et al. [10]. Despite the potential limited ability for detection of differences for WSA and PMN along with minimal insights from individual scores, the SMAF scores did appear to effectively normalize soil chemical (i.e., EC) and nutrient (i.e., plant-available P and K), thereby reducing discrepancies observed in the measured values (Table 3). The SMAF is also necessary for assessing the conglomerated physical SHI, chemical SHI, nutrient SHI, biological SHI, and overall SHI (Table 4). With SMAF standardization of scores for soil properties, the SHG can be quantified and assessed between the two systems, creating a more reasonable comparison.

3.3. The Soil Health Gap: AP vs. CRP

Understanding the SHG between conservation and agricultural systems requires consideration of the contrasting management practices that define them. In agricultural systems, soil conditions are anthropogenically controlled to optimize functions relevant to crop production. In contrast, conservation and natural systems are largely governed by natural processes and minimal management that supports a broader range of ecosystem services, which may not align with agricultural goals. This distinction is important as the SMAF was developed with an emphasis on agricultural soil functions, potentially limiting its applicability in evaluating the diverse functions present in natural systems [2].
The mean overall SHI for the AP systems was 0.73, while the mean overall SHI for the CRP systems was 0.85, a significant difference producing a mean SHG of 0.12 as interpreted by the SMAF (Table 4). This gap was driven primarily by the difference in soil biological indicators (namely SOC, BG, and MBC; Table 3) leading to a significant difference between the AP (0.47) and CRP (0.71) biological SHI (Table 4). Soil physical properties, although not significant, did influence the SHG through the mean Bd SHI of 0.71 in AP and 0.84 in CRP (Table 4). Soil biological, physical, and overall properties indicated improved overall soil health, less compaction, and increased microbial abundance. Soil chemical and nutrient properties contributed little to the overall SHG and indicated similarities between CRP and AP systems (Table 3). The SMAF scores may be helpful in addressing more general characteristics of soil health and allow for a SHG analysis; however, potential limitations of the SMAF reduce our confidence in the accuracy of the SHG.
As previously stated, the scores for WSA and PMN were potentially limited in their abilities to detect changes as a direct result of SMAF interpretation, which inflated the AP overall SHI. In a similar light, the contextual differences between the two land uses call for interpretations that are also context-dependent [4]. Therefore, when addressing the required SMAF indicators, four potentially limiting indicators arise: plant-available P and K, EC, and pH. Within natural systems, nutrients tend to be tied up in organic forms and are continuously transformed to be taken by plants, leaving less plant-available P and K adsorbed to soil particles [37,38]. Soil pH, similar to P and K, is managed in agricultural systems due to its importance for crop yields, whereas in natural systems, soil pH is adjusted by natural processes, and improved yields are not a consideration. Issues with EC are typically associated with arid, irrigated, or localized high-salinity regions, a context that does not apply to Southern MN, making EC a context-dependent indicator. These examples highlight the importance of contextually relevant soil health frameworks, as the SHG determined the via SMAF may not fully capture the diverse functions of natural systems [5]. Despite the potential limitations, the SMAF did produce relevant SHGs in this study, which were particularly insightful when in conjunction with measured values. Together, the findings provide a more comprehensive understanding of soil functionality. When addressing the SHG in the context of AP vs. CRP as a whole, CRP shows potential to serve as an effective soil health benchmark despite potential SMAF limitations.

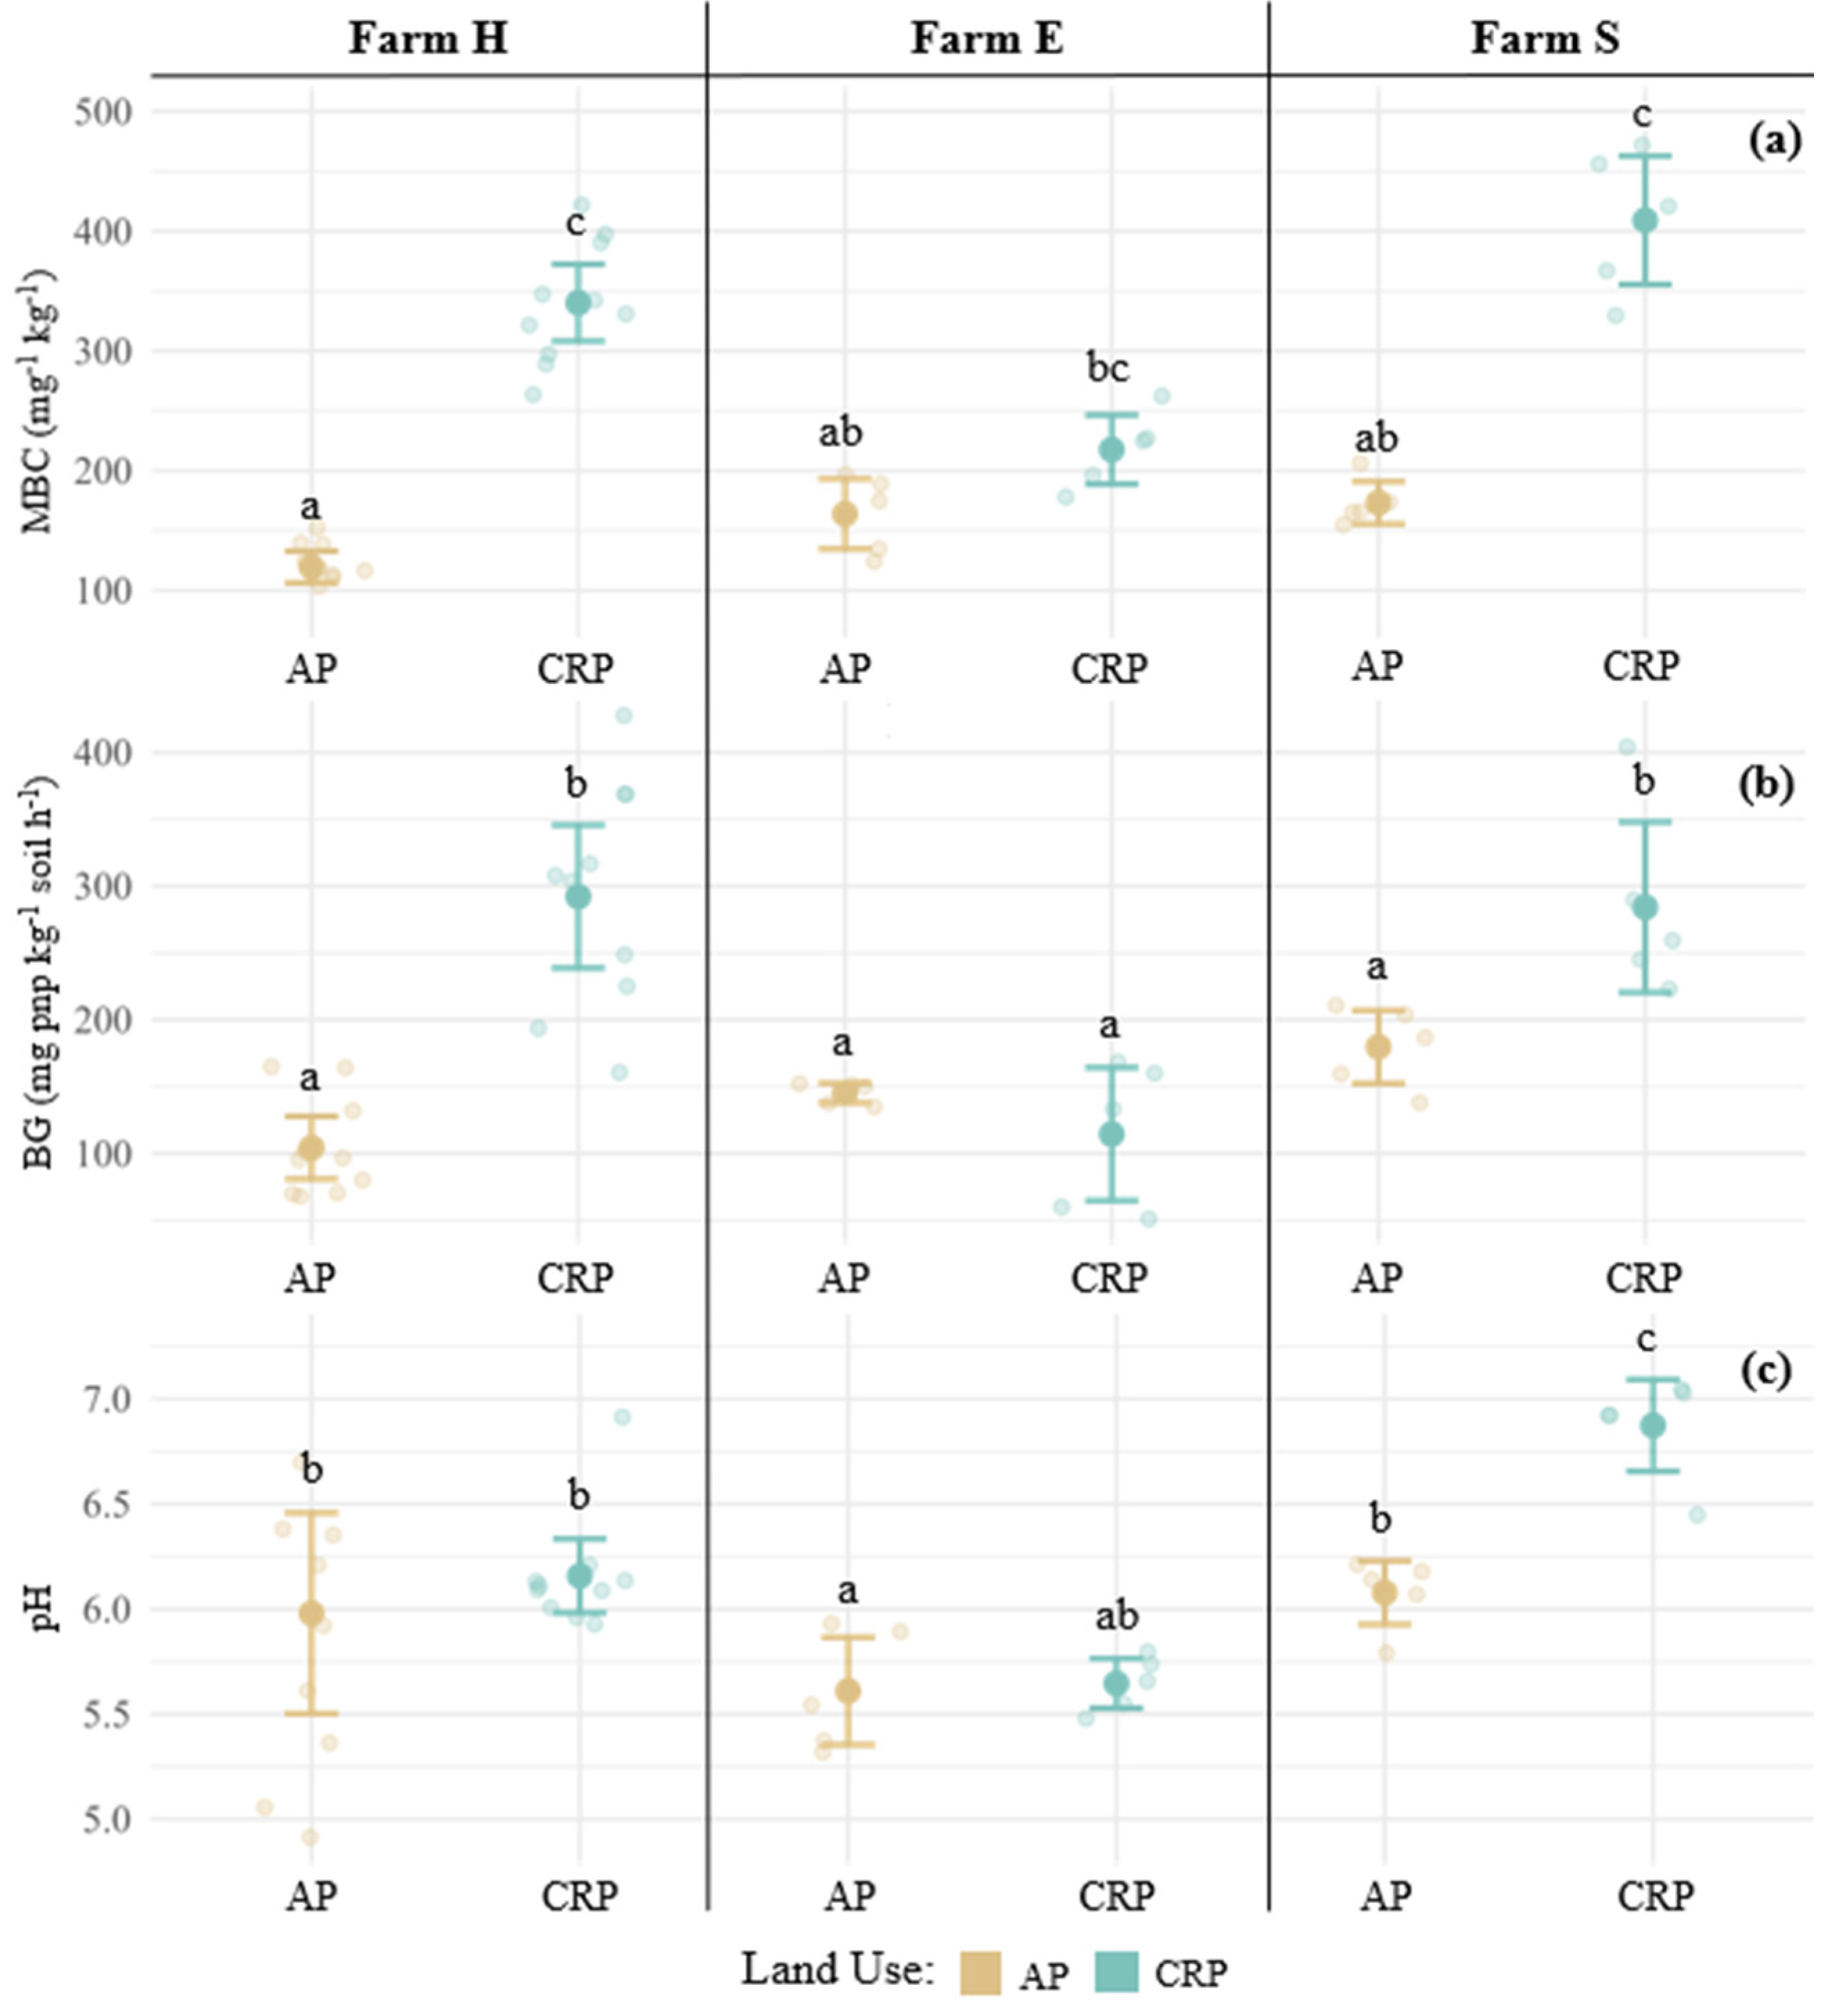
3.4. Individual Farm Pairs—Soil Health Comparison

The SHG at each farm pair varied, ranging from 0.01 to 0.18 (Table 4), highlighting a lack of consistency among pairs. Farm H had the largest SHG of 0.18 and a significant difference between AP and CRP plots (Table 4). The SHG found here was primarily driven by biological and physical indicators, both of which were significantly greater in the CRP site (Table 3). Averaged across all three farms, this was likely a result of aggressive tillage reducing soil aggregation, lack of crop rotation and biodiversity, the lack of biomass diversity returned to the soil, and fertilizers altering the microbial community structure [39,40,41]. This finding is also corroborated by measured values for Bd, WSA, SOC, MBC, PMN, and BG (Table 2).
Farm H had the largest SHG. However, as stated in the previous section, the SHG was likely under-reported due to a potential misrepresentation of WSA and PMN.
The SHG for farm S was 0.09, and primarily driven by biological SMAF indicators (Table 3 and Table 4). In general, measured values for biological, physical, and nutrient indicators were greater in AP and CRP on farm S as compared to the other two farms within their respective land uses (Table 2). This was likely a product of the significantly greater clay content and more soil health practices implemented on farm S compared to farms H and E (Table 2). We observed this despite the SMAF adjusting scoring curves that in theory account for differences in clay content; this raises questions as to the effectiveness of the SMAF clay content curve adjustments.
Farm E was of particular interest as the results were contrary to our hypothesis that CRP sites would have substantially larger soil health scores than AP. The overall SMAF score on the AP site was 0.78, while the CRP site was 0.79, yielding a SHG of 0.01 (Table 4). Contrary to farms H and S, farm E exhibited insignificant differences for biological indicators, which was a driving factor for soil health gaps observed at the other two farms. Specifically, the measured values for MBC, PMN, and BG were significantly lower at this site as compared to the other two sites (Table 2). Furthermore, the overall SHI for site E-CRP was significantly lower than sites H-CRP and S-CRP, indicating site E-CRP was inconsistent among the CRP sites (Table 3). Field E-AP utilized all four NRCS soil health principles, although to a lesser extent than farm S, by not using manure and using strip tillage rather than no-till (Table 1). Given the management practices implemented on this field, a decreased SHG was expected, but not to the degree observed. While management likely influenced the SHG, other factors such as pH and tillage influencing soil biology may have played a larger role in reducing the SHG on this farm.

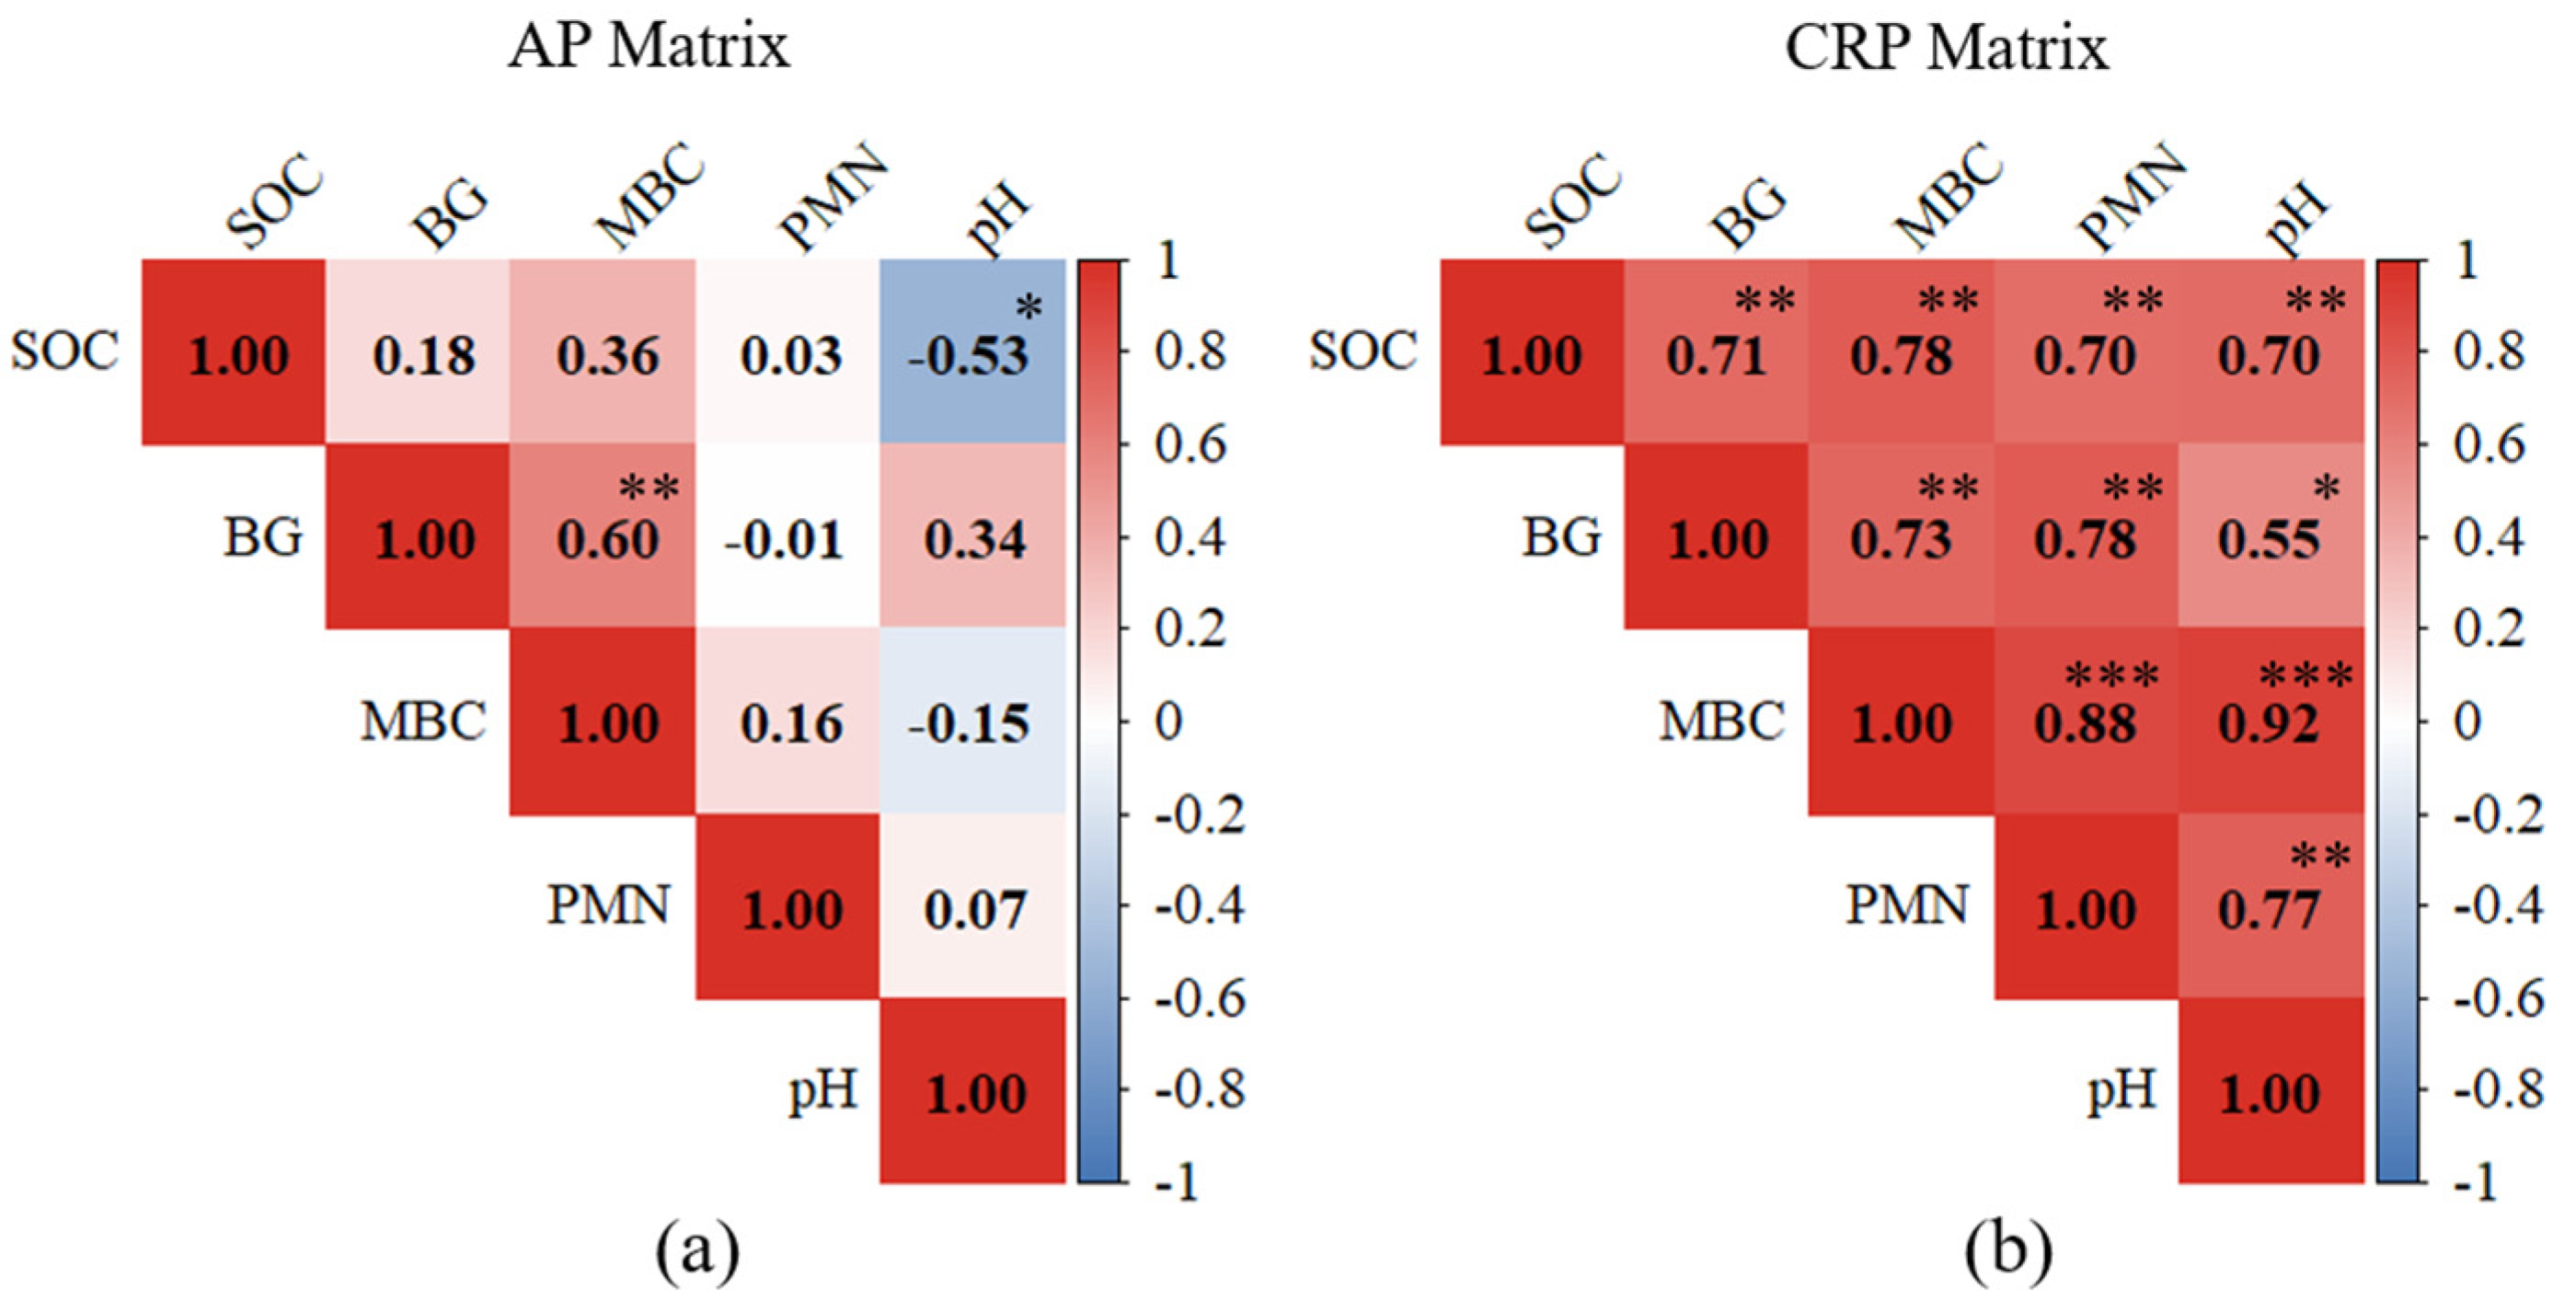
3.5. Effect of pH and Tillage on Biological Soil Health Indicators

Biological soil health indicators have been proven to be sensitive and timely soil health indicators, especially for various tillage methods, and this appears to be corroborated in the current study [10,42]. Given the two systems and their respective goals presented in this case study, the AP sites will inherently have more disturbance. Therefore, it was hypothesized that the measured values for biological soil health indicators in AP systems would be lower than those of the CRP, where disturbance is minimal. Both farms H and S supported this hypothesis, whereas the results from biological soil health indicators for farm E were contrary to this hypothesis (Table 2).
When the values for MBC and BG are separated by land use, trends begin to appear. Both indicators for the AP sites follow a trend of tillage intensity: the H-AP site had the lowest MBC and BG values and highest disturbance; the S-AP site had the highest MBC and BG values and the least disturbance (Figure 1a,b). However, in the CRP site, the measured values for MBC and BG activity in H-CRP and S-CRP were notably greater than E-CRP (Figure 1a,b). The acidity at site E-CRP may explain this inconsistency among the CRP fields.
Farm E had an acidic pH compared to the other farms, with the CRP site measuring 5.65 and the AP site measuring 5.60 (Figure 1c). The previous literature indicates that soil biology is heavily influenced by soil pH, especially under more acidic conditions where microbial community structure and function is altered [43,44,45]. The data presented in Figure 1 suggests that pH played a role in decreased values for BG and MBC at farm E, a finding supported by others who focused attention on enzyme activity and microbial biomass [46,47]. Utilizing a Spearman correlation matrix (Figure 2), the data suggest that the AP sites showed minimal correlation between pH and soil biological indicators (Figure 2a). In contrast, the biological indicators at the CRP sites were strongly and more consistently correlated with pH (Figure 2b). The effect of pH on soil biological indicators, specifically in CRP systems, was likely the factor that influenced the relatively low SHG found on farm E.
Soil pH has been proven to have a significant influence on soil biology, yet the SMAF biological indicators do not utilize pH as a factor class for interpreting scores [43,44,45,48]. In agricultural systems, soil pH is often actively managed to optimize crop production. Conversely, in conservation systems, pH is shaped by environmental processes, reflecting natural ecosystem dynamics rather than direct management decisions. These contrasting drivers highlight the differing goals between agricultural and natural systems and underscore the need for context-appropriate soil health frameworks [4]. In this context, incorporating pH as a factor class, similar to how the SMAF accounts for texture or climate, would enhance its use in the interpretation step rather than treating it as a direct score, thereby improving the relevance of soil health frameworks across diverse land uses.

4. Conclusions

Soil health is a promising tool for addressing food security in a changing climate, yet effectively evaluating it requires both a robust framework and a context-appropriate benchmark for comparison, components that are currently missing. A report by Stott [49] outlined the USDA-NRCS soil health testing methods and studies by Nunes et al. [50,51] released the selected biological indicators for the Soil Health Assessment Protocol and Evaluation (SHAPE). However, neither report nor papers fully address the effect of soil pH on biological soil health indicators. Despite the effect of pH on biological soil health indicators in this study, we found biological indicators to be most sensitive and informative when comparing soil health between land uses.
The CRP shows potential to serve as a soil health benchmark for Southern Minnesota. However, three questions remain: (1) How does the CRP fare as a soil health benchmark in other areas of the U.S., and how long must soils be in the CRP to show maximum soil health benefits? (2) Should pH be utilized as a factor class when assessing soil health in natural systems? Moreover (3), should the CRP serve as a benchmark, or should they be more regionally specific, such as native systems when present and accessible? The concept of soil health is still somewhat theoretical, with scientists varying in their interpretations and producers falling into ideological boxes regarding its role in their operations. We recommend that future research (1) assesses CRP systems in multiple climatically different areas of the U.S. and (2) investigates the effect of pH on biological soil health indicators over time to maximize practical understanding and implementation of soil health practices.

Supplementary Materials

The following supporting information can be downloaded at: https://www.mdpi.com/article/10.3390/soilsystems9020046/s1, The Soil Management Assessment Framework Analysis including Soil Physical Indicators, Soil Biological Indicators, Soil Chemical Indicators and Soil Nutrient Indicators.

Author Contributions

Conceptualization, O.H., C.E.C., and J.A.I.; methodology, O.H. and J.A.I.; software, O.H. and T.T.; validation, O.H., C.B., C.E.C., T.T., and J.A.I.; formal analysis, O.H. and T.T.; investigation, O.H., N.C., C.E.C., and C.B.; resources, J.A.I.; data curation, O.H.; writing—original draft preparation, O.H., T.T., and J.A.I.; writing—review and editing, O.H., T.T., C.E.C., C.B., and J.A.I.; visualization, O.H. and T.T.; supervision, O.H., C.B., and J.A.I.; project administration, O.H., N.C., and J.A.I. All authors have read and agreed to the published version of the manuscript.

Funding

This research received no external funding.

Institutional Review Board Statement

Not applicable.

Informed Consent Statement

Not applicable.

Data Availability Statement

Data available upon request.

Conflicts of Interest

The authors declare no conflicts of interest.

Abbreviations

The following abbreviations are used in this manuscript:
SMAFSoil Management Assessment Framework
SHGSoil health gap
CRPConservation Reserve Program
SHISoil health index
APAgricultural production

References

  1. Jain, H.K. Transition to Twenty-First Century Agriculture: Change of Direction. Agric. Res. 2012, 1, 12–17. [Google Scholar] [CrossRef]
  2. Karlen, D.L.; Veum, K.S.; Sudduth, K.A.; Obrycki, J.F.; Nunes, M.R. Soil Health Assessment: Past Accomplishments, Current Activities, and Future Opportunities. Soil Tillage Res. 2019, 195, 104365. [Google Scholar] [CrossRef]
  3. Lehmann, J.; Bossio, D.A.; Kögel-Knabner, I.; Rillig, M.C. The Concept and Future Prospects of Soil Health. Nat. Rev. Earth Environ. 2020, 1, 544–553. [Google Scholar] [CrossRef] [PubMed]
  4. Fierer, N.; Wood, S.A.; Bueno De Mesquita, C.P. How Microbes Can, and Cannot, Be Used to Assess Soil Health. Soil Biol. Biochem. 2021, 153, 108111. [Google Scholar] [CrossRef]
  5. Wade, J.; Culman, S.W.; Gasch, C.K.; Lazcano, C.; Maltais-Landry, G.; Margenot, A.J.; Martin, T.K.; Potter, T.S.; Roper, W.R.; Ruark, M.D.; et al. Rigorous, Empirical, and Quantitative: A Proposed Pipeline for Soil Health Assessments. Soil Biol. Biochem. 2022, 170, 108710. [Google Scholar] [CrossRef]
  6. Norris, C.E.; Bean, G.M.; Cappellazzi, S.B.; Cope, M.; Greub, K.L.H.; Liptzin, D.; Rieke, E.L.; Tracy, P.W.; Morgan, C.L.S.; Honeycutt, C.W. Introducing the North American Project to Evaluate Soil Health Measurements. Agron. J. 2020, 112, 3195–3215. [Google Scholar] [CrossRef]
  7. USDA-NRCS Soil Health Page. Available online: https://www.nrcs.usda.gov/conservation-basics/natural-resource-concerns/soils/soil-health (accessed on 7 May 2025).
  8. Andrews, S.S.; Karlen, D.L.; Cambardella, C.A. The Soil Management Assessment Framework: A Quantitative Soil Quality Evaluation Method. Soil Sci. Soc. Am. J. 2004, 68, 1945–1962. [Google Scholar] [CrossRef]
  9. Apesteguía, M.; Virto, I.; Orcaray, L.; Bescansa, P.; Enrique, A.; Imaz, M.J.; Karlen, D.L. Tillage Effects on Soil Quality after Three Years of Irrigation in Northern Spain. Sustainability 2017, 9, 1476. [Google Scholar] [CrossRef]
  10. Nunes, M.R.; Karlen, D.L.; Veum, K.S.; Moorman, T.B. A SMAF Assessment of U.S. Tillage and Crop Management Strategies. Environ. Sustain. Indic. 2020, 8, 100072. [Google Scholar] [CrossRef]
  11. Jiménez, L.; Jiménez, W.; Felicito, D.; Fierro, N.; Quichimbo, P.; Sánchez, D.; Capa-Mora, D. Rediscovering the edaphic knowledgee of smallholder farmers in southern Ecuador. Geoderma 2022, 406, 115468. [Google Scholar] [CrossRef]
  12. Cherubin, M.R.; Karlen, D.L.; Franco, A.L.C.; Cerri, C.E.P.; Tormena, C.A.; Cerri, C.C. A soil management assessment framework (SMAF) evaluation of sugarcane expansion on soil quality. Soil Sci. Soc. Am. J. 2016, 80, 215–226. [Google Scholar] [CrossRef]
  13. Shawver, C.; Ippolito, J.A.; Brummer, J.; Ahola, J.; Rhoades, R. Soil health changes following transition from an annual cropping to perennial management-intensive grazing agroecosystem. Agro. Geosci. Environ. 2021, 4, e20181. [Google Scholar] [CrossRef]
  14. Trimarco, T.; Brummer, J.E.; Buchanan, C.; Ippolito, J.A. Tracking Soil Health Changes in a Management-Intensive Grazing Agroecosystem. Soil Syst. 2023, 7, 94. [Google Scholar] [CrossRef]
  15. Maharjan, B.; Das, S.; Acharya, B.S. Soil Health Gap: A Concept to Establish a Benchmark for Soil Health Management. Glob. Ecol. Conserv. 2020, 23, e01116. [Google Scholar] [CrossRef]
  16. Stubbs, M. Conservation Reserve Program (CRP): Status and Issues; Library of Congress, Congressional Research Service: Washington, DC, USA, 2014. [Google Scholar]
  17. Karlen, D.L.; Rosek, M.J.; Gardner, J.C.; Allan, D.L.; Alms, M.J.; Bezdicek, D.F.; Flock, M.; Huggins, D.R.; Miller, B.S.; Staben, M.L. Conservation Reserve Program effects on soil quality indicators. J. Soil Water Conserv. 1999, 54, 439–444. [Google Scholar] [CrossRef]
  18. Johnson, K.A.; Dalzell, B.J.; Donahue, M.; Gourevitch, J.; Johnson, D.L.; Karlovits, G.S.; Keeler, B.; Smith, J.T. Conservation Reserve Program (CRP) lands provide ecosystem service benefits that exceed land rental payment costs. Ecosys. Serv. 2016, 18, 175–185. [Google Scholar] [CrossRef]
  19. Dunn, C.P.; Stearns, F.; Guntenspergen, G.R.; Sharpe, D.M. Ecological benefits of the Conservation Reserve Program. Conserv. Biol. 1993, 7, 132–139. [Google Scholar] [CrossRef]
  20. GLISA Albert Lea Page. Available online: https://glisa.umich.edu/station/albert-lea-3-se/ (accessed on 7 May 2025).
  21. Faribault County Minnesota; County Profile; 2022 Census of Agriculture; USDA-NASS: Washington, DC, USA, 2022. Available online: https://www.nass.usda.gov/Publications/AgCensus/2022/Online_Resources/County_Profiles/Minnesota/cp27043.pdf (accessed on 5 May 2025).
  22. Ashworth, J.; Keyes, D.; Kirk, R.; Lessard, R. Standard procedure in the hydrometer method for particle size analysis. Commun. Soil Sci. Plant Anal. 2001, 32, 633–642. [Google Scholar] [CrossRef]
  23. Kemper, W.D.; Rosenau, R.C. Aggregate Stability and Size Distribution. In Methods of Soil Analysis: Part 1 Physical and Mineralogical Methods; SSSA Book Series; Klute, A., Ed.; Soil Science Society of America, American Society of Agronomy: Madison, WI, USA, 1986; pp. 425–442. [Google Scholar] [CrossRef]
  24. Thomas, G.W. Soil pH and Soil Acidity. In Methods of Soil Analysis: Part 3 Chemical Methods; SSSA Book Series; Sparks, D.L., Page, A.L., Helmke, P.A., Loeppert, R.H., Soltanpour, P.N., Tabatabai, M.A., Johnston, C.T., Sumner, M.E., Eds.; Soil Science Society of America, American Society of Agronomy: Madison, WI, USA, 1996; pp. 475–490. [Google Scholar] [CrossRef]
  25. Rhoades, J.D. Salinity: Electrical Conductivity and Total Dissolved Solids. In Methods of Soil Analysis: Part 3 Chemical Methods; SSSA Book Series; Sparks, D.L., Page, A.L., Helmke, P.A., Loeppert, R.H., Soltanpour, P.N., Tabatabai, M.A., Johnston, C.T., Sumner, M.E., Eds.; Soil Science Society of America, American Society of Agronomy: Madison, WI, USA, 1996; pp. 417–435. [Google Scholar] [CrossRef]
  26. Mehlich, A. Mehlich 3 Soil Test Extractant: A Modification of Mehlich 2 Extractant. Commun. Soil Sci. Plant Anal. 1984, 15, 1409–1416. [Google Scholar] [CrossRef]
  27. Green, V.; Stott, D.; Cruz, J.; Curi, N. Tillage Impacts on Soil Biological Activity and Aggregation in a Brazilian Cerrado Oxisol. Soil Tillage Res. 2007, 92, 114–121. [Google Scholar] [CrossRef]
  28. Mulvaney, R.L. Nitrogen-Inorganic Forms. In Methods of Soil Analysis: Part 3 Chemical Methods; SSSA Book Series; Sparks, D.L., Page, A.L., Helmke, P.A., Loeppert, R.H., Soltanpour, P.N., Tabatabai, M.A., Johnston, C.T., Sumner, M.E., Eds.; Soil Science Society of America, American Society of Agronomy: Madison, WI, USA, 1996; pp. 1123–1184. [Google Scholar] [CrossRef]
  29. Nelson, D.W.; Sommers, L.E. Total Carbon, Organic Carbon, and Organic Matter. In Methods of Soil Analysis: Part 3 Chemical Methods; SSSA Book Series; Sparks, D.L., Page, A.L., Helmke, P.A., Loeppert, R.H., Soltanpour, P.N., Tabatabai, M.A., Johnston, C.T., Sumner, M.E., Eds.; Soil Science Society of America, American Society of Agronomy: Madison, WI, USA, 1996; pp. 961–1010. [Google Scholar] [CrossRef]
  30. Sherrod, L.A.; Dunn, G.; Peterson, G.A.; Kolberg, R.L. Inorganic Carbon Analysis by Modified Pressure-Calcimeter Method. Soil Sci. Soc. Am. J. 2002, 66, 299–305. [Google Scholar] [CrossRef]
  31. Beck, T.; Joergensen, R.G.; Kandeler, E.; Makeschin, F.; Nuss, E.; Oberholzer, H.R.; Scheu, S. An Inter-Laboratory Comparison of Ten Different Ways of Measuring Soil Microbial Biomass C. Soil Biol. Biochem. 1997, 29, 1023–1032. [Google Scholar] [CrossRef]
  32. Stott, D.E.; Andrews, S.S.; Liebig, M.A.; Wienhold, B.J.; Karlen, D.L. Evaluation of β-Glucosidase Activity as a Soil Quality Indicator for the Soil Management Assessment Framework. Soil Sci. Soc. Am. J. 2010, 74, 107–119. [Google Scholar] [CrossRef]
  33. Ippolito, J.A.; Ducey, T.F.; Diaz, K.; Barbarick, K.A. Long-Term Biosolids Land Application Influences Soil Health. Sci. Total Environ. 2021, 791, 148344. [Google Scholar] [CrossRef]
  34. Li, C.; Fultz, L.M.; Moore-Kucera, J.; Acosta-Martínez, V.; Kakarla, M.; Weindorf, D.C. Soil Microbial Community Restoration in Conservation Reserve Program Semi-Arid Grasslands. Soil Biol. Biochem. 2018, 118, 166–177. [Google Scholar] [CrossRef]
  35. Tyler, H.L.; Locke, M.A.; Moore, M.T.; Steinriede, R.W. Impact of Conservation Land Management Practices on Soil Microbial Function in an Agricultural Watershed. J. Soil Water Conserv. 2016, 71, 396–403. [Google Scholar] [CrossRef]
  36. De, M.; Riopel, J.A.; Cihacek, L.J.; Lawrinenko, M.; Baldwin-Kordick, R.; Hall, S.J.; McDaniel, M.D. Soil Health Recovery after Grassland Reestablishment on Cropland: The Effects of Time and Topographic Position. Soil Sci. Soc. Am. J. 2020, 84, 568–586. [Google Scholar] [CrossRef]
  37. Schlesinger, W.H. Some Thoughts on the Biogeochemical Cycling of Potassium in Terrestrial Ecosystems. Biogeochemistry 2021, 154, 427–432. [Google Scholar] [CrossRef]
  38. Schoenau, J.J.; Stewart, J.W.B.; Bettany, J.R. Forms and Cycling of Phosphorus in Prairie and Boreal Forest Soils. Biogeochemistry 1989, 8, 223–237. [Google Scholar] [CrossRef]
  39. Kasper, M.; Buchan, G.D.; Mentler, A.; Blum, W.E.H. Influence of Soil Tillage Systems on Aggregate Stability and the Distribution of C and N in Different Aggregate Fractions. Soil Tillage Res. 2009, 105, 192–199. [Google Scholar] [CrossRef]
  40. Dincă, L.C.; Grenni, P.; Onet, C.; Onet, A. Fertilization and Soil Microbial Community: A Review. Appl. Sci. 2022, 12, 1198. [Google Scholar] [CrossRef]
  41. Kim, N.; Zabaloy, M.C.; Guan, K.; Villamil, M.B. Do Cover Crops Benefit Soil Microbiome? A Meta-Analysis of Current Research. Soil Biol. Biochem. 2020, 142, 107701. [Google Scholar] [CrossRef]
  42. Zuber, S.M.; Villamil, M.B. Meta-Analysis Approach to Assess Effect of Tillage on Microbial Biomass and Enzyme Activities. Soil Biol. Biochem. 2016, 97, 176–187. [Google Scholar] [CrossRef]
  43. Fierer, N. Embracing the Unknown: Disentangling the Complexities of the Soil Microbiome. Nat. Rev. Microbiol. 2017, 15, 579–590. [Google Scholar] [CrossRef]
  44. Lauber, C.L.; Hamady, M.; Knight, R.; Fierer, N. Pyrosequencing-Based Assessment of Soil pH as a Predictor of Soil Bacterial Community Structure at the Continental Scale. Appl. Environ. Microbiol. 2009, 75, 5111–5120. [Google Scholar] [CrossRef]
  45. Tripathi, B.M.; Stegen, J.C.; Kim, M.; Dong, K.; Adams, J.M.; Lee, Y.K. Soil pH Mediates the Balance between Stochastic and Deterministic Assembly of Bacteria. ISME J. 2018, 12, 1072–1083. [Google Scholar] [CrossRef]
  46. Acosta-Martínez, V.; Tabatabai, M.A. Enzyme Activities in a Limed Agricultural Soil. Biol. Fertil. Soils 2000, 31, 85–91. [Google Scholar] [CrossRef]
  47. Malik, A.A.; Puissant, J.; Buckeridge, K.M.; Goodall, T.; Jehmlich, N.; Chowdhury, S.; Gweon, H.S.; Peyton, J.M.; Mason, K.E.; Van Agtmaal, M.; et al. Land Use Driven Change in Soil pH Affects Microbial Carbon Cycling Processes. Nat. Commun. 2018, 9, 3591. [Google Scholar] [CrossRef]
  48. Delgado-Baquerizo, M.; Oliverio, A.M.; Brewer, T.E.; Benavent-González, A.; Eldridge, D.J.; Bardgett, R.D.; Maestre, F.T.; Singh, B.K.; Fierer, N. A Global Atlas of the Dominant Bacteria Found in Soil. Science 2018, 359, 320–325. [Google Scholar] [CrossRef]
  49. Stott, D.E. Recommended Soil Health Indicators and Associated Laboratory Procedures; Soil Health Technical Note 450-03; USDA-NRCS: Washington, DC, USA, 2019. Available online: https://www.naptprogram.org/files/napt/publications/method-papers/2019-nrcs-technote-450-03.pdf (accessed on 7 May 2025).
  50. Nunes, M.R.; Veum, K.S.; Parker, P.A.; Holan, S.H.; Amsili, J.P.; Van Es, H.M.; Wills, S.A.; Seybold, C.A.; Karlen, D.L. SHAPEv1.0 Scoring Curves and Peer Group Benchmarks for Dynamic Soil Health Indicators. Soil Sci. Soc. Am. J. 2024, 88, 858–875. [Google Scholar] [CrossRef]
  51. Nunes, M.R.; Veum, K.S.; Parker, P.A.; Holan, S.H.; Karlen, D.L.; Amsili, J.P.; Van Es, H.M.; Wills, S.A.; Seybold, C.A.; Moorman, T.B. The Soil Health Assessment Protocol and Evaluation Applied to Soil Organic Carbon. Soil Sci. Soc. Am. J. 2021, 85, 1196–1213. [Google Scholar] [CrossRef]
Figure 1. (a) Microbial biomass C (MBC) by site, (b) β-glucosidase (BG) activity by site, and (c) pH values by farm and land use (AP and CRP). Each panel shows mean values with error bars representing standard error of the mean for error bars. Lowercase letters indicate significant differences across farms and land uses, determined using the Kruskal–Wallis test followed by a Dunn’s post hoc test with a Bonferroni adjusted p-value.
Soilsystems 09 00046 g001
Figure 2. Spearman correlation matrices for (a) AP and (b) CRP systems, showing relationships between soil organic C (SOC), β-glucosidase (BG) activity, microbial biomass C (MBC), potentially mineralizable N (PMN), and pH. Correlation coefficients are displayed, with significance indicated by asterisks (* = 0.05, ** = 0.01, *** = <0.001, and NS = no significance).
Soilsystems 09 00046 g002
Table 1. Site descriptions for coordinates (latitude, longitude), dominant soil series, measured texture, site size, crop at sampling, tillage level, soil health principles utilized, soil health practices implemented, CRP type, and year established. Data are categorized by land use (AP and CRP) and farm (H, E, and S).
DescriptorFarm HFarm EFarm S
AP-
Longitude−93.860312−93.942425−94.071673
Latitude43.58129443.63902043.635242
Dominant Soil SeriesSpillville LoamTruman Silt LoamShorewood Silty Clay Loam
World Reference Base Soil GroupCumulic PhaeozemCalcaric PhaeozemStagnc Luvic Stagnosol
Measured TextureClay LoamClay LoamClay
Size (ha)6.76.05.0
Crop at SamplingSoybeanCornCover Crop
Tillage LevelAggressiveMinimalNone
a Soil Health Principles UtilizedNone1, 2, 3, and 41, 2, 3, and 4
Soil Health Practices ImplementedNoneReduced tillage and cover cropsNo-till, cover crops, third crop, and manure
Crop Rotationb C-Cc C-Sd C-S-P
CRP-
Latitude−93.865420−93.941628−94.074464
Longitude43.58172443.63672143.635062
Dominant Soil SeriesSpillville LoamTruman Silt LoamColand Clay Loam
Measured Soil TextureClay LoamSandy Clay LoamClay
World Reference Base Soil GroupCumulic PhaeozemCalcaric PhaeozemGleyic Cumulic Phaeozem
Size (ha)3.65.33.6
CRP TypeCRPCREPCREP
Establishment Year200120012001
Seeding Mixe MN CP25 Standard (643)e MN CP25 Standard (643)e MN CP25 Standard (643)
a Soil health principles utilized: (1) minimized disturbance, (2) maximize living roots, (3) maximize soil cover, and (4) maximize biodiversity. b C-C = continuous field corn. c C-S = field corn–soybeans. d C-S-P = field corn–soybeans–field peas. e MN CP25 Standard (643) = Albert Lea Seed, seeding mix with 60% grass (9 species) and 40% forbs (17 species).
Table 2. Mean measured values for Soil Management Assessment Framework (SMAF) indicators, including physical [clay%, bulk density (Bd), and water-stable aggregates (WSA)], chemical [pH and electrical conductivity (EC)], nutrient [plant-available phosphorus (P) and potassium (K)], and biological [soil organic C (SOC), potentially mineralizable N (PMN), microbial biomass C (MBC), and β-glucosidase activity (BG)]. Values are shown for each farm (H, E, and S) and land use (AP and CRP). Parentheses indicate the standard error of the mean (n = 5 for farms E and S, n = 10 for farm H). Different lowercase letters following an indicator denote significant differences based on Dunn’s post hoc test with Bonferroni adjusted p-value.
Land UseFarmPhysical IndicatorsChemical IndicatorsNutrient IndicatorsBiological Indicators
Clay
%
Bd
g cm−1
WSA
%
pHEC
dS m−1
M-3P
mg kg −1
M-3K
mg kg −1
SOC
%
MBC
mg kg −1
PMN
mg kg −1
BG
mg pnp a kg−1 soil h−1
APH30 (2) a1.36 (0.04) b67 (3) a6.0 (0.2) 0.07 (0.02) a34 (5) a101 (24) a2.48 (0.17) a120 (7) a37 (2) 104 (12) a
E29 (2) a1.23 (0.02) b83 (2) b5.6 (0.1) 0.36 (0.05) b55 (4) ab232 (22) ab3.16 (0.21) b164 (15) b38 (3) 145 (4) ab
S46 (2) b1.03 (0.04) a83 (1) b6.1 (0.1) 0.32 (0.04) b92 (23) b459 (168) b2.98 (0.10) ab173 (9) b40 (2) 180 (14) b
p-value0.0040.0020.0050.250<0.0010.0300.0040.0400.0050.5300.010
CRPH31 (1) a1.18 (0.02) 90 (1) 6.2 (0.1) b0.09 (0.02) b29 (4) 126 (10) 3.41 (0.16) a340 (16) b67 (5) b292 (27) b
E28 (2) a1.21 (0.01) 92 (1) 5.7 (0.1) a0.03 (0.00) a19 (2) 201 (31) 2.96 (0.26) a218 (14) a35 (3) a115 (25) a
S41 (3) b1.16 (0.06) 90 (1) 6.9 (0.1) c0.20 (0.05) c43 (9) 229 (38) 4.24 (0.36) b409 (27) b72 (7) b284 (32) b
p-value0.0400.5000.230<0.001<0.0010.0600.0600.0200.0020.0040.006
AP 34 (2) 1.25 (0.04) 75 (2) 5.9 (0.1) 0.21 (0.04) 54 (8) 223 (53) 2.77 (0.12) 144 (8) 38 (1) 133 (10)
CRP 33 (1) 1.18 (0.02) 90 (0.5) 6.2 (0.1) 0.10 (0.02) 30 (3) 170 (16) 3.51 (0.17) 327 (19) 60 (4) 246 (24)
p-value0.6500.080<0.0010.1500.0300.0100.780<0.001<0.001<0.001<0.001
a pnp = p-nitrophenol.
Table 3. Mean Soil Management Assessment Framework (SMAF) scores for physical [bulk density (Bd) and water-stable aggregation (WSA)], chemical [pH and electrical conductivity (EC)], nutrient [plant-available phosphorus (P) and potassium (K)], and biological [soil organic C (SOC), microbial biomass C (MBC), and β-glucosidase activity (BG)] indicators for each farm (H, E, and S) under different land uses (AP and CRP). Values inside parentheses represent the standard error of the mean (n = 5 for farms E and S, n = 10 for farm H). Different lowercase letters following an indictor score denote significant differences as determined by Dunn’s post hoc test with Bonferroni adjusted p-value.
Land UseFarmPhysical IndicatorsChemical IndicatorsNutrient IndicatorsBiological Indicators
BdWSApHECPlant-Available PPlant-Available KSOCMBCPMNBG
APH0.55 (0.07) a1.00 (0.00) 0.93 (0.02) 1.00 (0.00) 0.92 (0.05) 0.69 (0.05) a0.50 (0.05) a0.12 (0.01) a1.00 (0.00) 0.09 (0.01) a
E0.80 (0.07) ab1.00 (0.00) 0.94 (0.02) 1.00 (0.00) 1.00 (0.00) 0.97 (0.03) b0.74 (0.04) b0.22 (0.05) ab1.00 (0.00) 0.13 (0.01) ab
S0.97 (0.03) b1.00 (0.00) 0.99 (0.01) 1.00 (0.00) 1.00 (0.00) 0.98 (0.02) b0.66 (0.03) ab0.20 (0.02) b1.00 (0.00) 0.19 (0.03) b
p-value0.005N/A0.120N/A0.1900.0040.0200.010N/A0.010
CRPH0.82 (0.04) 1.00 (0.00) 0.99 (0.00) b1.00 (0.00) 0.93 (0.05) 0.86 (0.03) 0.77 (0.04) a0.67 (0.04) b1.00 (0.00) 0.51 (0.08) b
E0.91 (0.05) 1.00 (0.00) 0.97 (0.01) a1.00 (0.00) 0.87 (0.08) 0.89 (0.05) 0.74 (0.06) a0.43 (0.04) a1.00 (0.00) 0.11 (0.03) a
S0.82 (0.07) 1.00 (0.00) 0.97 (0.01) a1.00 (0.00) 0.93 (0.07) 0.95 (0.05) 0.91 (0.03) b0.82 (0.05) b1.00 (0.00) 0.47 (0.09) b
p-value0.440N/A0.004N/A0.7600.1700.0400.004N/A0.006
AP 0.71 (0.06) 1.00 (0.00) 0.95 (0.01) 1.00 (0.00) 0.96 (0.02) 0.83 (0.04) 0.60 (0.04) 0.16 (0.02) 1.00 (0.00) 0.12 (0.01)
CRP 0.84 (0.03) 1.00 (0.00) 0.98 (0.00) 1.00 (0.00) 0.92 (0.04) 0.89 (0.02) 0.80 (0.03) 0.65 (0.04) 1.00 (0.00) 0.40 (0.06)
p-value0.120N/A0.170N/A0.4200.610<0.001<0.001N/A<0.001
Table 4. Mean Soil Management Assessment Framework (SMAF) soil health index (SHI) for physical, chemical, nutrient, and biological categories along with the soil health gap (SHG; CRP − AP) for each farm (H, E, and S) under different land uses (AP and CRP). Values inside parenthesis represent the standard error of the mean (n = 5 for farms E and S, n = 10 for farm H). Different lowercase letters following an indictor score denote significant differences as determined by Dunn’s post hoc test with Bonferroni adjusted p-value.
Land Use FarmPhysical SHIChemical SHINutrient SHIBiological SHIOverall SHI
APH0.77 (0.03) a0.96 (0.01) 0.80 (0.04) a0.43 (0.01) a0.68 (0.01) a
E0.90 (0.04) ab0.97 (0.01) 0.98 (0.02) b0.52 (0.01) b0.78 (0.01) b
S0.98 (0.01) b1.00 (0.00) 0.99 (0.01) b0.51 (0.01) b0.80 (0.01) b
p-value 0.0040.1200.0040.001<0.001
CRPH0.91 (0.02) 1.00 (0.00) b0.89 (0.04) 0.74 (0.04) b0.86 (0.02) b
E0.96 (0.03) 0.99 (0.00) a0.88 (0.06) 0.57 (0.03) a0.79 (0.01) a
S0.91 (0.04) 0.98 (0.00) a0.94 (0.06) 0.80 (0.04) b0.89 (0.03) b
p-value 0.4400.0040.1400.0200.040
APAll0.86 (0.03) 0.97 (0.01) 0.90 (0.03) 0.47 (0.01) 0.73 (0.01)
CRPAll0.92 (0.02) 0.99 (0.00) 0.90 (0.03) 0.71 (0.03) 0.85 (0.01)
p-value 0.1200.1700.860<0.001<0.001
Soil Health GapH0.140.040.090.310.18
E0.060.02−0.100.050.01
S−0.07−0.02−0.050.290.09
All0.060.020.000.240.12
Disclaimer/Publisher’s Note: The statements, opinions and data contained in all publications are solely those of the individual author(s) and contributor(s) and not of MDPI and/or the editor(s). MDPI and/or the editor(s) disclaim responsibility for any injury to people or property resulting from any ideas, methods, instructions or products referred to in the content.

