Article

Soil Chemical Variation Along a Four-Decade Time Series of Reclaimed Water Amendments in Northern Idaho Forests

1
Ethiopian Institute of Agricultural Research, National Soil Research Center, Addis Ababa P.O. Box 2003, Ethiopia
2
Environmental Science Program, Trinity College, Hartford, CT 06105, USA
3
Department of Environmental Science and Technology, College of Agriculture and Natural Resources, University of Maryland, College Park, MD 20742, USA
4
Department of Soil and Water Systems, University of Idaho, Moscow, ID 83844, USA
5
Department of Forest, Rangeland, and Fire Sciences, College of Natural Resources, University of Idaho, Moscow, ID 83844, USA
*
Author to whom correspondence should be addressed.
Soil Syst. 2025, 9(2), 32; https://doi.org/10.3390/soilsystems9020032
Submission received: 15 February 2025 / Revised: 18 March 2025 / Accepted: 29 March 2025 / Published: 3 April 2025
(This article belongs to the Special Issue Soil Bioremediation)

Abstract

:
Application of municipal reclaimed water to forests for water reclamation is a pragmatic approach that provides water and nutrients to soil and lowers the liability of reclaimed water disposal, yet little is known about the long-term impacts of reclaimed water amendment on forest soil chemical properties. We hypothesized that reclaimed water constituents will increase plant nutrient availability in soil with the magnitude of response depending on the facility establishment date. We collected samples from three mineral soil depths to 75 cm from treated and control plots at five water reuse facilities that represent a four-decade time series. Depth explained most of the observed variation. Several plant nutrients increased in soil at the different sites in response to reclaimed water treatments, including N, Ca, Fe, S, and B concentration as well as B content, while P was not significantly affected. Increases in cation concentrations positively correlated with pH and salinity. The treatment response was significantly greater at all facilities for total N, B and Na. However, the treatment response only occurred at long-established facilities for NO3-N and Ca concentrations and for Fe and S content. The outcomes of this study are useful for guiding future management of soil at forest water reclamation facilities and for limiting the risk of downstream environmental impacts.

1. Introduction

As population growth and development require more freshwater resources, reclaiming wastewater is a critical approach for addressing water scarcity [1]. Because agriculture consumes the great majority of fresh water globally, reclaimed water, i.e., effluent from wastewater treatment plants, is a viable option for irrigation [2]. Land application of reclaimed water offers an inexpensive method of reformation through natural nutrient filtering [3]. The bulk of nutrients in reclaimed water are in forms that plants can easily absorb [4]. Consequently, land application of reclaimed water supports plant growth by supplying both water and nutrient resources [5] and thereby protects surface and groundwater from contamination [6]. Reclaimed water has been used to irrigate and increase crop yield for decades [7]. Likewise, forest water reclamation (FWR) is known to significantly boost tree growth and stand development by retaining the majority of the constituent nutrients within the forest ecosystem [8,9].
Short-term irrigation with reclaimed water has not been shown to have a significant impact on soil physicochemical properties [10]; however, long-term application may alter numerous soil chemical variables. The long-term effects vary depending on the class of effluent [11], soil types [12], duration of irrigation, and local climate [4,6]. For instance, pH responds to long-term amendment, but the direction of response depends on soil depth [13]. While salinity may rise due to constituent salts and surface evaporation [14], it can be managed with increased irrigation duration and frequency or water pretreatment [15,16]. Still, salinity is more of a concern in arid regions [17] than in forests that typically have significant drainage. Long-term irrigation with reclaimed water has been shown to increase soil organic matter 1.5–2.5-fold [18,19,20] with corresponding increases in N. However, increases are lower in coarse soils than in fine-textured soils [21,22]. Nutrient elements in surface soil may increase due to elevated levels in applied reclaimed water including N, P, K, Ca, Mg, B and Na [23]. Many of these elements stimulate plant production, although excess levels of B and Na can be detrimental [24,25]. While N can substantially increase forest production [26,27], the impact of added N can also decrease the soil carbon-to-nitrogen (C/N) ratio and stimulate organic matter mineralization [28,29]. Thus, while reclaimed water amendment can positively increase organic matter, the narrowing of the C/N ratio can result in a proportional decrease in carbon in the soil [24,30].
The long-term reclaimed water studies described above are typically snapshots for single locations following a specific treatment period, but they do not provide predictive capabilities. In contrast, long-term monitoring of N addition studies that are designed to simulate N deposition [31,32], or large-scale monitoring of polluted regions [33,34,35] provide predictive capabilities. However, these long-term N addition or deposition monitoring sites are not useful for predicting long-term impacts of reclaimed water where a balance of plant nutrients is applied in basic, often saline solutions. Additionally, long-term monitoring is costly and difficult to sustain. The time-series study that we report here offers an alternative, cost-effective approach for looking at long-term impacts of reclaimed water treatments with the capacity to forecast the consequences over realistic periods of service.
Northern Idaho FWR facilities have been operating for decades. However, no attempts have been made to evaluate facility-specific long-term impacts of reclaimed water on soil chemical characteristics with consequences for soil health and environmental quality. Our study provides a unique opportunity to analyze the effects of irrigation with reclaimed water using a four-decade time series of regional FWR facilities. Each facility is in mixed coniferous forests representative of the region and has similar soil and climatic characteristics. Through regulatory oversight, the facilities receive reclaimed water subject to similar secondary sewage treatment, and thus the major difference among sites besides the location is time since establishment. We have already reported on the impacts of FWR on vegetation, hydrology and nutrient leaching at these facilities [8,36,37]. Here, we report on the long-term responses of soil chemical variables sampled at different depths in both treated and control areas at the five facilities representing the timeline. Our objectives were to assess facility-specific impacts of irrigation with reclaimed water on soil chemical properties. We considered essential plant macro- and micronutrients concentrations and content. We also consider diagnostic parameters including soil pH, organic C, nutrient retention, P saturation and salinity. These nutrient and diagnostic features are indicators of forest soil health conditions. A further objective was to compare the impacts of FWR at facilities with varying dates of establishment. We tested two general hypotheses: First, the added constituents in reclaimed water would increase concentration and content of plant nutrients used as forest growth resources and not cause detrimental effects to diagnostic soil health parameters. Second, we hypothesized that responses of nutrient and other soil chemical variables to treatment would be greatest for facilities with the earliest establishment date and there would be little to no treatment effect at the most recently established facilities. Such information is necessary to predict the long-term consequences of FWR for soil health and environmental quality and expand our understanding of the ecological impacts of adding nutrients to forest ecosystems.

2. Materials and Methods

2.1. Description of Sites

We evaluated soil chemical characteristics of five northern Idaho FWR facilities, established from 1978 to 2013 (Figure 1). Facilities have similar elevation (708 ± 40 m) mean annual precipitation (658 ± 83 mm) and mean annual temperature (7.8 ± 0.5 °C) (Table 1). Dominant tree species include ponderosa pine (Pinus ponderosa Douglas ex C. Lawson), Douglas-fir (Pseudotsuga menziesii var. glauca (Mirb.) Franco), grand fir (Abies grandis (Douglas ex D. Don) Lindl.), western red cedar (Thuja plicata Donn ex D. Don), western larch (Tsuga heterophylla (Raf.) Sarg.), western hemlock (Tsuga heterophylla (Raf.) Sarg.), and paper birch (Betula papyrifera Marsh). Detailed species composition and tree and stand metrics are presented by Joshi and Coleman [37]. The primary forests of this region were subject to extractive logging and natural regeneration throughout the 20th century resulting in the mixed-species uneven-aged forests currently growing at these facilities. The one exception was the Heyburn State Park facility where a ponderosa pine forest was established in 1980. Each of the facilities applied Class C reclaimed water using overhead impact sprinklers. Class C reclaimed water is the product, i.e., effluent resulting from secondary treatment (settling, oxidation and disinfection). The average hydraulic loading rate at the FWR facilities was 22.7 ± 4.8 cm yr−1. Cumulative N and P loading at the longest established facility is estimated to be more than ten times greater than that applied at the most recently established facility with the average nutrient loading rates of 37.96 ± 5.9 kg N ha−1 yr−1 and 13.4 ± 1.5 kg P ha−1 yr−1 [8].
Soils at each FWR facility have similar texture and are derived from glacial till, basalt or loess parent material with surficial deposits of either volcanic ash (Andisols or having andic properties, [38]) or loess (Table 2). Soils at Garfield Bay, Bottle Bay, and Ellisport Bay contained the same Pend Oreille soil series, which is well-drained and formed from volcanic ash over glacial till derived from granite and metamorphic rock with frigid ecological site class. Soils at the Cave Bay and Heyburn facilities are moderately well drained and derived from some amount of loess either as the base layer or a surficial deposit with warm ecological site class.

2.2. Experimental Design

The experiment was designed as a time series or a space-for-time substitution study [40] where five FWR facilities were included to represent various establishment years ranging from 1987 to 2013 (Table 1). The study included a total of 50, 0.04 ha circular measurement plots distributed equally among the five FWR facilities. Within each facility, we installed five comparable plots in both treated and control areas using timber-cruise data collected both in management units receiving reclaimed water and in adjacent untreated control units. We selected control plots based on similar existing forest composition and structure relative to amended plots at respective facilities (for details see [37]). Control plots had received no reclaimed water amendments, were hydraulically isolated from treatment units, and contained similar soils and existing forest composition and structure as the amended plots at respective facilities. All plots had slopes of less than 5%.
Soil samples were taken for soil chemical analysis from three random locations within each plot. The forest floor was quantitatively removed and auger samples were collected from three depth layers: 0–15 cm, 15–45 cm and 45–75 cm. Samples for each depth layer in each plot were composited, air dried, and passed through a 2-mm sieve and subsamples were sent to an analytical lab for chemical analysis (AgSource, Lincoln, NE, USA) that used standard laboratory procedures described below [41].

2.3. Analysis of Soil Chemical Properties

Total C and N were analyzed by combustion (EA-IRMS system Costech ECS 4010 with a Thermo DELTA V Advantage isotope ratio mass spectrometer, Costec Analytical Technology, Valencia, CA, USA) and soil pH-water was determined by electrode in a 1:1 (w/v) soil-water ratio [42]. Pwas extracted using a Bray-1 solution (0.03 N NH4F, 0.025 N HCl) and colorimetrically assessed [43], while Al was extracted with CaCl2 [44] and B with hot water [45]. K, Mg, Ca, and Na were extracted with ammonium acetate [46]. Total P was extracted with H2SO4 after incineration. S was extracted using monocalcium phosphate [47]. Cu, Fe, Mn and Zn were extracted using diethylene triamine pentaacetate (DTPA, [48]). Each of these elements was analyzed using inductively coupled plasma optical emission spectroscopy (ICP-OES). Cation exchange capacity (CEC) was determined by summation of equivalent concentrations of K, Ca, Mg, Na and Al [49]. Exchangeable acidity for soils having buffer pH < 7 was calculated [50]. Percentage base saturation (BS) was computed as the proportion of CEC occupied by K, Mg, Ca, and Na [51]. Sodium adsorption ratio (SAR) was calculated as Na+/√(Ca + Mg)/2 [52]. Phosphorus saturation ratio (PSR) was computed as the molar ratio of P to Al plus Fe [53]. Our pragmatic use of typical commercial extractions to calculate PSR was checked against ammonium oxalate in the dark P, Al and Fe to calculate degree of P saturation (DPS, [54]) using soils from the Bottle Bay facility.

2.4. Soil Bulk Density and Nutrient Content

Soil bulk density was measured for the purpose of converting nutrient concentrations to content. Bulk density of mineral soil was determined as the average of two random locations in each plot by collecting soil samples of known volume using a soil core sampler (AMS, American Falls, ID, USA), measuring total dry mass, separating and weighing rock fragments after passing the fine fraction through a 2-mm sieve, and expressing each depth layer on a fine fraction basis [55,56]. Rock bulk density was assumed to be 2.65 g cm−3 [57]. The volumetric content of each layer was calculated as the product of nutrient concentration and bulk density. Volumetric content was multiplied by the depth of each layer to determine the content on an area basis (kg or Mg per hectare). Total mineral soil nutrient content to the full sampling depth of 75 cm was calculated as the sum of nutrient content for each of the three depth layers.

2.5. Statistical Analysis

Three-way repeated measures analysis of variance (ANOVA) was used to determine the response of dependent soil chemical variables to the independent experimental effects. Proc Mixed (Statistical software, v 9.4, SAS Institute, Inc., Cary, NC, USA) was used for the repeated measures analysis and mean comparisons [58]. Independent experimental effects included treatments, soil depth layers and FWR facilities for a total of 150 samples (Table 3). Turkey’s test was applied to separate means. A weight factor accounted for variable soil depth layers with marginal means calculated using the “obsmargins” option in SAS Proc Mixed. F-tests for independent experimental factors were considered significantly different at p < 0.05, although marginally significant p < 0.10 is also noted. All variables were tested for normality and homoscedasticity to meet ANOVA assumptions, and where necessary, data were transformed using Box-Cox power functions (SAS Proc Transreg, statistical software, v 9.4, SAS Institute, Inc., Cary, NC, USA). Optimal covariate structure for repeated measures and inclusion of random effects variable was selected based on lowest corrected Akaike information criteria (AICC).
An analysis of covariance (ANCOVA) (SAS Proc Mixed) was used to test the effect of facility establishment date and determine the time-series effect. The ANCOVA model included facility establishment year as a continuous variable to test the dependence of effluent treatment response on the time since establishment. A time-series effect was indicated by a significant interaction between treatment and facility establishment year. The time-series effect was further demonstrated by showing that a greater treatment response occurred at the long-established facilities than at recently established facilities. For dependent variables without any two- or three-way interactions in the ANCOVA, the interactions were removed from the model. An insignificant interaction confirmed parallel treatment and depth responses with respect to establishment date and validated use of the ANCOVA test for differences between the treatment elevations. Regression lines and 95% confidence intervals for scatter plots of treated and control plots were prepared using Prism (v 7.05, Graph Pad, Boston, MA, USA).

3. Results

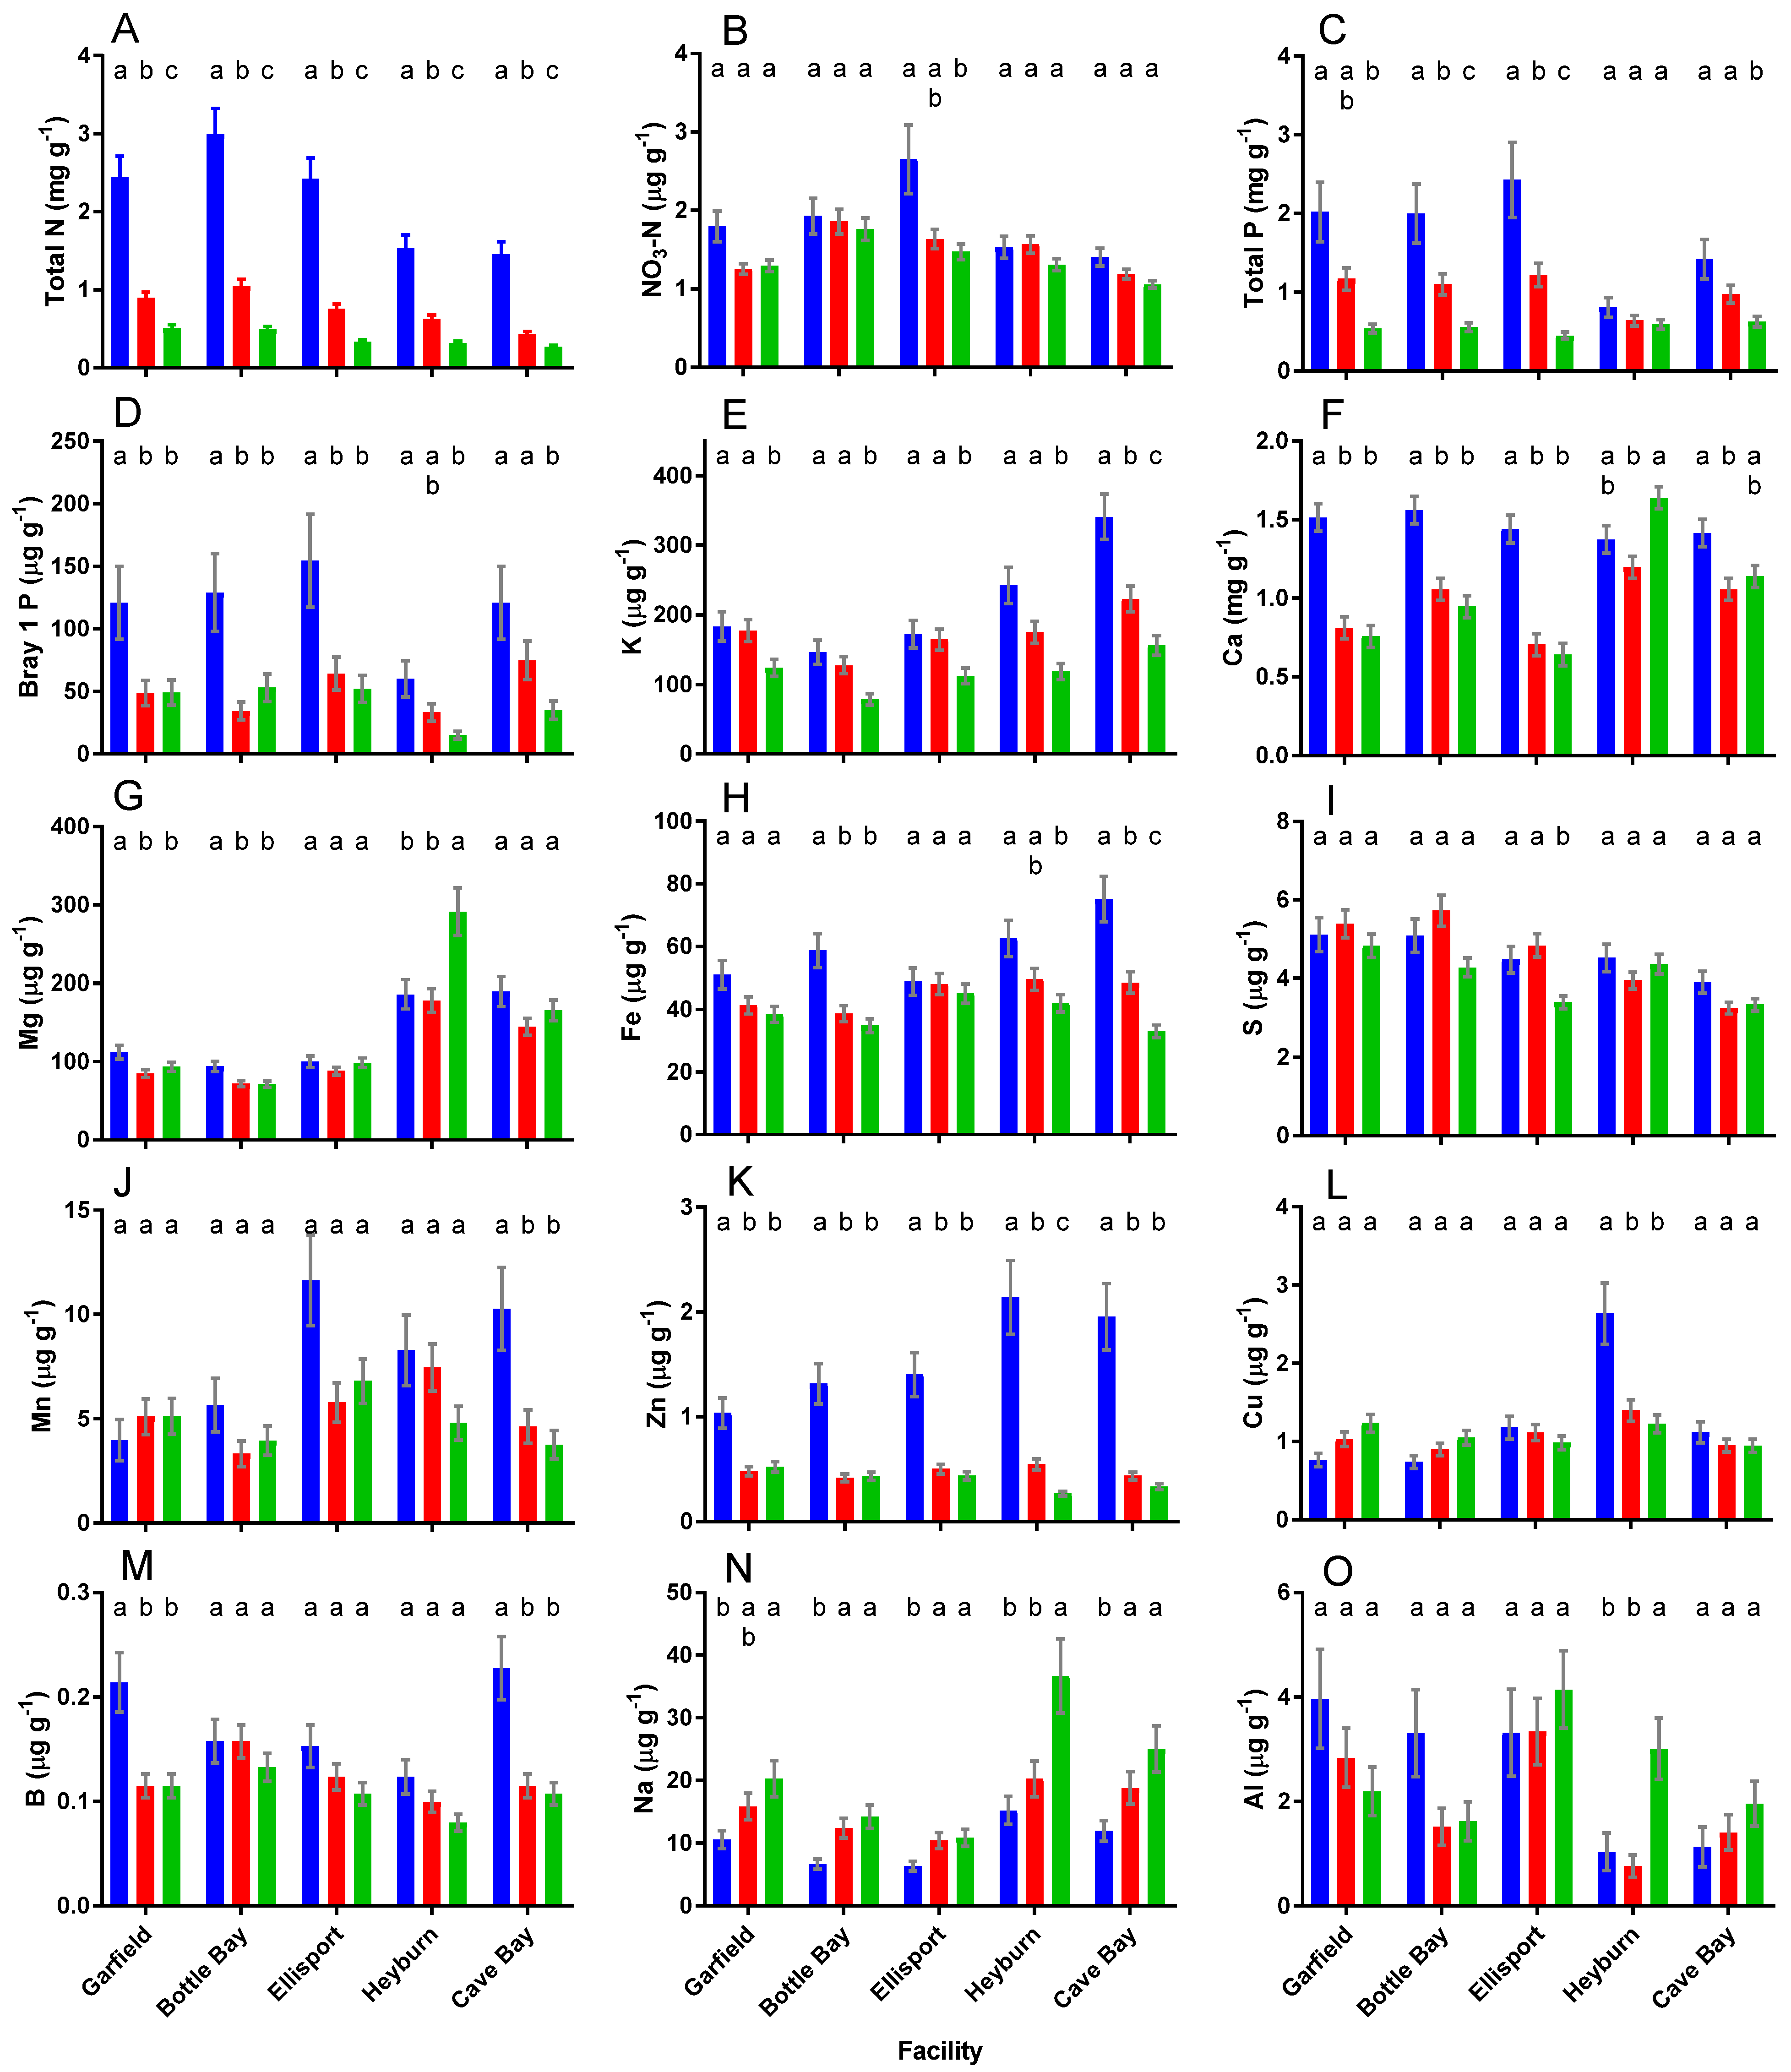
3.1. Response of Soil Chemical Variables to FWR Facility and Depth

Soil chemical variables largely depended on the facility and depth at which samples were collected, or the effect of depth varied by facility (Table 4, D and F × D). With few exceptions, the depth factor explained the greatest amount of variation among the nutrient and diagnostic variables tested (average Depth F-stat = 70 which was 6 times that of Facility). The stratified nature of forest soils caused many variables to be higher at the surface. Soil total C progressively decreased with depth (Table 4, D, p < 0.01). Many other essential plant nutrients also progressively decreased, especially total N, NO3-N, total P, PO4, K, Fe, Zn and B (Figure 2). However, Na was lower in the surface horizon and increased with depth (Figure 2N). For other macro- (Ca, Mg) and micro-nutrients (S, Mn, Cu), the direction of the depth effect varied among facilities. While CEC largely decreased with depth (Figure S1G), the response of exchangeable (ex) nutrients was more variable. For example, the moderate (15–45 cm) depth had a relatively low proportion of exCa (Figure S1I) and a relatively high proportion of exH (Figure S1M) at each facility.

3.2. Response of Soil Chemical Variables to Effluent Treatment

The response of soil chemical variables to effluent treatment is first considered with facilities (F) as an independent categorical variable (Table 4). Effluent treatment modified soil chemical variables by increasing concentrations of several plant nutrients, raising soil pH and salinity, and changing nutrient portions on the cation exchange complex (Table 4, Figure S2). Overall, nutrient concentrations increased significantly in effluent treated plots compared with the controls for total N (16.6%), NO3-N (32.1%), Ca (23.3%), Mg (20.7%), S (13.8%) and B (34.5%) (Table 4, T, p < 0.01). Notably, there were no effects of treatment on total soil carbon concentration (p = 0.32), concentrations of the macronutrients PO4 and K (p > 0.14), and several micronutrient elements (Fe, Mn, Zn, Cu, p > 0.12). The lack of, or marginal treatment effect on PO4, Fe and Al resulted in a similar lack of response in the derived PSR. Additionally, Na increased dramatically (351%) along with parallel increases in salinity (20.2%) and SAR (324%) in the treated plots. The C/N ratio declined by 6.6% in response to effluent treatment. Soil pH increased an average of 6.4% (0.37 pH units).
The shifts in nutrient concentrations and pH were matched by changes in the proportions of cations on the exchange complex. While CEC did not change significantly in response to treatment, the overall average proportions of nutrients occupying the exchange sites did (Figure S2). Exchangeable Ca increased from 45% in control plots to 56% in effluent plots, exMg increased from 9% to 10% and exH decreased from 38% to 23% resulting in an overall increase in base saturation from 59% to 73%, or an increase of 22.4%. Other cations also changed significantly but were minor in comparison to exCa and exH (Table 3).
The dependence of the effluent treatment response on FWR facilities was apparent for several soil chemical variables. Although there was a strong treatment main effect for each of the variables described above, the magnitude of difference varied among facilities (Table 4, T × F, p < 0.01). Notably, several soil chemical variables displayed a greater response for at least one of the facilities that had been operating for over 20 years, but not in either of the recently established facilities. For Na, SAR and exNa there were significant responses at each of the facilities, regardless of when they were established (Table 4, T × F, p > 0.10).
The effect of effluent treatment also depended upon both depth and facility for PO4, K, Fe, Zn, Na, Al and exNa (Table 4, T × F × D, p < 0.01). This three-way interaction was strongly expressed for Na where significant treatment effects were observed at some depth by facility combinations but not at others (Figure S3).

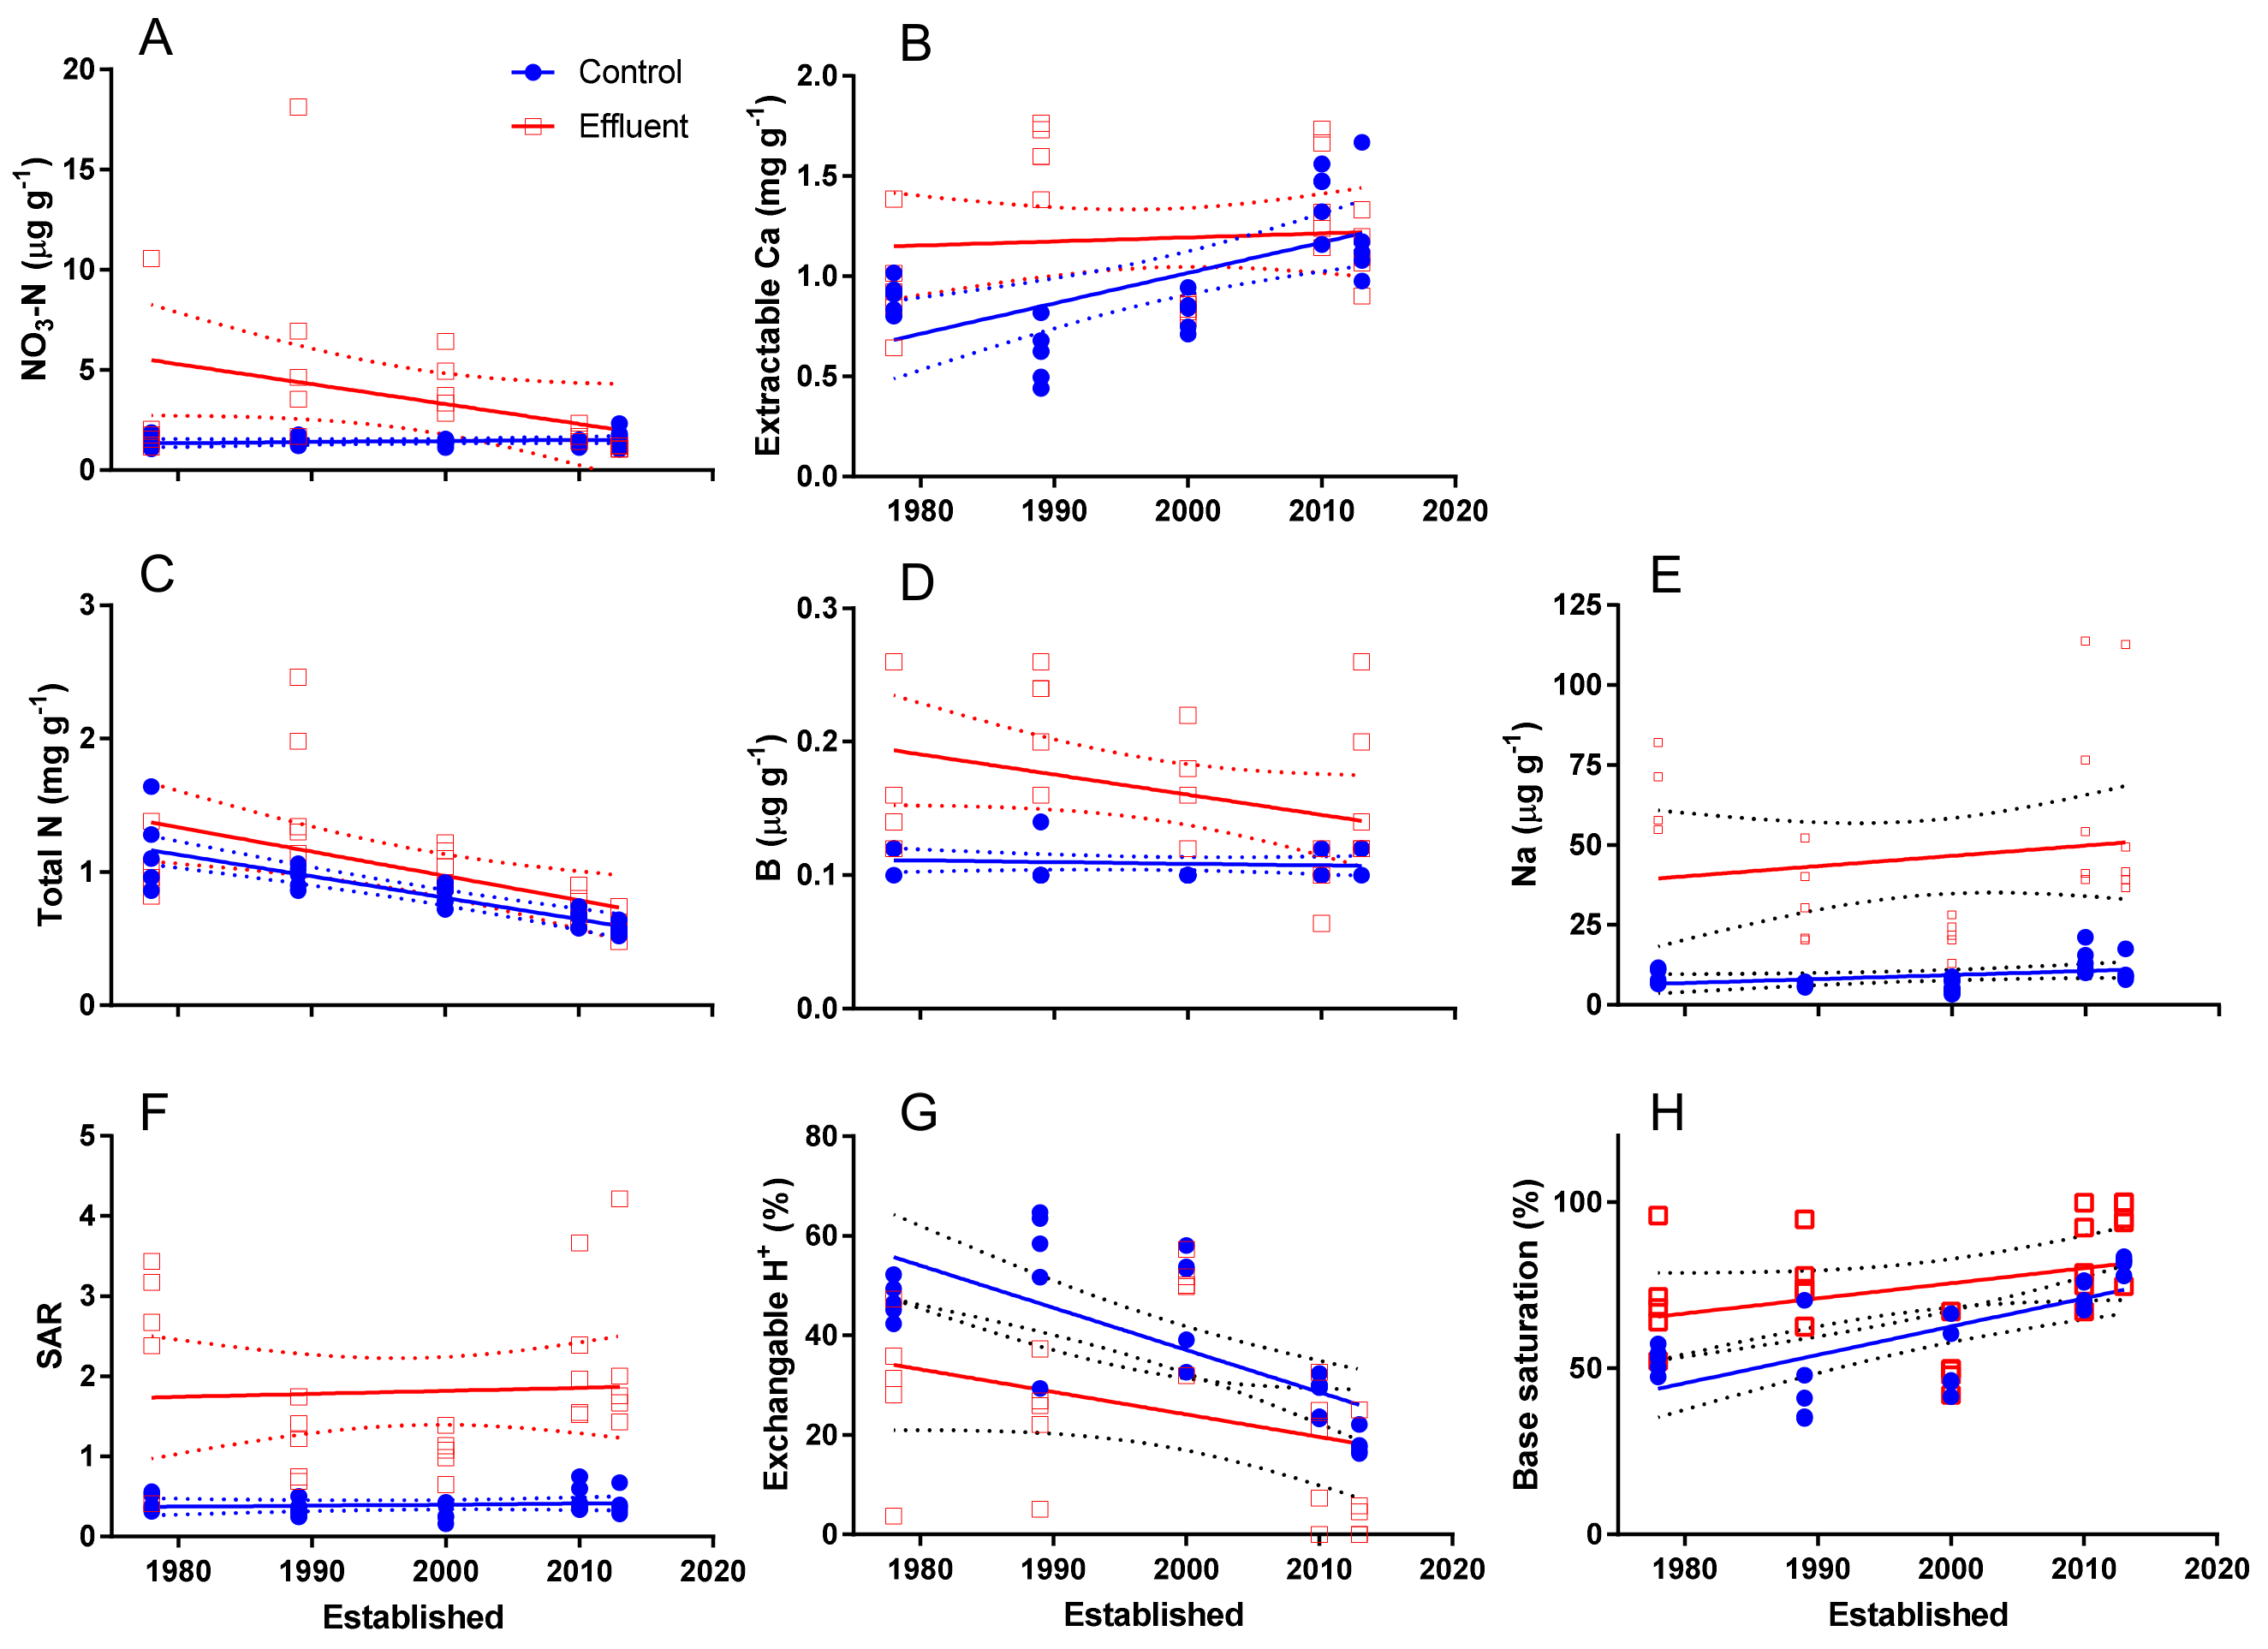
3.3. Time-Series Effect

To examine if there was a time-series effect, facility establishment date was included in the analysis of covariance models as a continuous variable. Most chemical variables responded significantly to establishment date (Table 5, E, p < 0.01), which identifies natural gradients along the time series. Treatment response was significantly dependent upon facility establishment date for extractable NO3-N and Ca concentration (T × E, Table 5, p = 0.05). In these two cases, there was a differential separation of treatments along the time series where the separation between treatments is greatest for the long-established facilities and least for the recently established facilities (Figure 3A,B). Based on the distance between control and treated lines within the 75 cm of mineral soil sampled, NO3-N concentration increased in treated plots at a rate of 0.088 μg g−1 yr−1, while the extractable Ca concentration increased 7.6 μg g−1 yr−1.
Significant treatment differences (Table 5, T, p < 0.01) that were independent of facility establishment date (T × E, p > 0.10) occurred for total N, B, Na, SAR, exCa, exH and BS (Figure 3C–H). These results show that the slopes of the lines were statistically parallel for the control and the effluent treatments, and the elevations were significantly different. Overall, we observed mean increases of 22% for total N, 50% for B, 359% for SAR and 22% for base saturation, while exH declined 35%.
The treatment response to the time series also varied by depth (Table 5, T × E × D, p < 0.10) for five variables (Figure S4). For NO3-N, the time-series effect occurred in the surface 15 cm, while treatment differences were independent of establishment date for lower depths. For phosphate and Zn, a time-series effect occurred only in the 45–75 cm depth layer and for Fe, it occurred only in the 15–45 cm layer. For pH, the explanation for this three-way interaction was ambiguous.

3.4. Soil Nutrient Content

The treatment response of total soil nutrient content significantly responded to facility for all nutrients examined (Table 6, F, p < 0.01) except for total P. This result follows from the dependence of concentration on these same experimental factors as described above, and because nutrient content is the product of nutrient concentration, bulk density and soil depth. Soil bulk density was also highly dependent on facility and depth (p < 0.01) but not treatment (T, T × F, p > 0.36). While including facility in the ANOVA model, we found significant responses of nutrient content to effluent treatment for 7 of the 16 nutrients examined (Table 6, T, T × F). The test for a time-series effect using the ANCOVA model demonstrated that treatment depended on facility establishment date for content of soil NO3-N, Fe, and S (Table 7, T × E, p < 0.05), while Ca was marginally significant (T × E, p = 0.06) and each of these variables had a greater difference between control and effluent treatment at the long-established facilities compared to those more recently established facilities (Figure 4A–D). Based on the distance between control and treated lines over time, NO3-N content accumulates at a rate of 0.54 kg ha−1 yr−1 within the 75 cm of mineral soil sampled. The S content accumulation rate was of similar magnitude (0.32 kg ha−1 yr−1), while the Fe content accumulation rate (3.3 kg ha−1 yr−1) was an order of magnitude higher, and that for Ca content (60 kg ha−1 yr−1) was two orders of magnitude higher. The response of total N, B and Na content to effluent treatment did not show a time-series response with establishment date (Table 7, T × E p > 0.1) indicating that the response magnitude was consistent regardless of establishment date (Figure 4E–G). The average difference among facilities in total N was 1265 kg ha−1 while that for B was 0.40 kg ha−1 and Na was 308 kg ha−1.

4. Discussion

Amendments with reclaimed water improved several of the soil chemical properties with respect to forest soil quality. On average, concentrations of the plant nutrients NO3-N, Ca, Mg, S and B increased while soil became less acidic with a concomitant increase in base saturation. This more favorable soil environment caused higher plant growth because it alleviated summer drought and nitrogen limitations common to the region [37]. While these results are encouraging, land application does bear some environmental risks, such as nutrient leaching, groundwater pollution and surface water eutrophication [8,59,60] and accumulation of salt, which can be harmful for both soil sustainability and plant health [61,62].

4.1. Plant Nutrient Concentrations and Management

4.1.1. Nitrogen

Nitrogen-limited forest ecosystems in northern Idaho typically have extractable soil NO3-N concentrations below 1 mg kg−1 [63]. Our results confirm that control plots consistently had low average NO3-N, and we observed equivalent values for effluent treated plots at recently established facilities; however, continued reclaimed water N inputs at long-established facilities resulted in elevated extractable soil NO3-N concentrations (Figure 3A). Chronic N inputs in N-limited forests can, over time, result in elevated NO3-N concentrations due to high availability of NH4-N substrate, increased abundance of ammonium oxidizing bacteria, increased nitrification rates and greater risk of NO3-N leaching when N inputs exceed ecosystem demand [31,64]. Although there was substantial scatter about the time-series response curves, it is unlikely that the time-series effect for NO3-N is the result of random variation. Indeed, we observed that excess NO3-N leaching at the long-established facilities in this study occurred in parallel with increases in nitrification rates, and higher abundance of ammonium oxidizing bacteria compared with control plots [8]. Similar responses are observed with reclaimed water applications [65], chronic N amendments [32], or large-scale monitoring of polluted regions with high N deposition [33,34,35]. Thus, our results appear to confirm that continuous effluent applications at permitted rates to N-limited forests over decades of service can result in increased NO3-N concentrations, saturated ecosystem demand, and leaching losses, which indicates that they are in Stage 1 of N saturation [31].
Approaches to avoiding N saturation can be accomplished by monitoring and adjusting the annual loading rates so that they will not exceed the critical load over which leaching occurs [66]. Facilities and regulators can monitor nitrifier abundance and nitrification rates [8]. Such information would be an inexpensive approach for evaluating and predicting when N saturation may occur. An economical approach to decreasing loading rates would be to supply reclaimed water to adjacent forest landowners. If reclaimed water is offered as a resource to stimulate tree growth it would increase demand among neighboring forest land managers and conceptually shift the perspective from the liability of disposing reclaimed water toward the utilization of reclaimed water as an asset to enhance forest production [37]. Higher loading rates may also be achieved by including fast-growing, high-value species native to the region such as Douglas-fir or western white pine in FWR facilities, or incorporating poplar and willow energy crop, all of which require higher plant growth resources [8,67].

4.1.2. Phosphorous

Soil P is added to these facilities at average rates of 13 kg P ha−1 yr−1 annually, so as with N, we expected to see evidence of elevated P accumulation, at least at the long-established facilities, in agreement with our first hypothesis. Yet, total P, PO4, and PSR were unaffected by treatment except at the lowest depth. The lack of PO4 response may have been due to the Bray-1 extraction approach, which can underestimate phosphorus content in the soil since it is used to extract available soil phosphorus, while oxalate extraction is often used to extract Fe- and Al-bound phosphorus from soils [68]; consequently, we conducted an oxalate extraction for the long-established Bottle Bay soils and again found no treatment effect (p > 0.10). We also compared our pragmatic use of typical commercial P, Al and Fe extraction for calculating PSR with the oxalate extracted P, Al and Fe to calculate degree of phosphorous saturation (DPS) [54]. Our pragmatic approach to calculate PSR yielded equivalent results to that of DPS (Figure S5). Thus, we concluded that there was no treatment distinction for either measure of phosphorous saturation in Bottle Bay soils, and PSR is an acceptable approach for experimental comparisons. Furthermore, we did not see treatment differences in litter P concentration or content in Bottle Bay soils (Figure S6), nor differences in leaching loss, although there were elevated P concentrations attributed to preferential flow paths [8]. In fact, our leaching results indicate that >99% of the applied P is retained by the forest ecosystem. Our failure to locate added P in possible soil pools and fluxes draws us to hypothesize that the applied P has been acquired by the vegetation. Regardless, we can safely conclude that P applied in these FWR facilities at current loading rates is not likely to result in negative environmental impacts from P leaching during at least four decades of service. Predictions from other studies estimate 100-year capacity to retain P [24].

4.1.3. Other Nutrients and Exchange Capacity

Although Ellisport Bay demonstrated increased soil CEC and an associated increase in soil total carbon (Figure S2) in treated plots compared to controls, there was no overall effect of treatment on CEC and C among FWR facilities examined. The concomitant rise in CEC and C at Ellisport Bay is expected due to the positive correlations between CEC and soil organic matter [69]. High cation exchange capacity or increased soil organic matter is often reported for reclaimed water irrigation studies [18,19,20,70,71,72]. However, in coarse soils the increases are less than occurred in in fine textured soils [21,22]. Additionally, declines in soil organic C in response to reclaimed water have been reported [65], which may be due to increased microbial activity [72]. The lack of soil organic matter and CEC response to reclaimed water in the FWR time series suggests that over the long-term, increased inputs of organic matter in the reclaimed water may be compensated by adjustments to the microbial community structure favoring decomposition and mineralization.
We observed an overall increase in soil pH (Figure S4E), as well as increased exCa, Na, and a decrease in exH (Figure 3), all of which resulted in overall increased base saturation (Figure 3), which is in agreement with other reclaimed water studies [13,73,74,75,76]. Increased pH, higher base saturation and amendments with basic cations in response to reclaimed water amendments allow more base-forming cations to occupy the exchange sites [77], which promotes tree development and overall forest productivity by improving nutrient availability [64,78].
Other plant nutrients that responded to reclaimed water treatment include the micronutrients S and B. S and B are effective in forest fertilization amendments [79,80] because they occur in very low concentrations and can be deficient in some soils within the region [80,81]. While B can be toxic with excess application rates, the levels applied with FWR permitted loading rates are well below the toxic range [82]. It is likely that the lack of micronutrient accumulation could be due to uptake by vegetation. Such filtering is one of the main objectives of reclaimed water land application [83]. Macro- and micronutrient cations could also have been subject to leaching losses. Additions of N through N fixation or deposition can cause substantial losses of cation as they are paired with the leaching of nitrate anions to maintain electroneutrality [84]. The lack of response by some cations may indicate that any leaching losses of cations are equivalent to reclaimed water inputs. In total, FWR appeared to improve the soil environment for plants, not just for N, but also provides other required nutrients in stoichiometric balance, and avoids N-only fertilizer-induced imbalance [85,86,87].

4.2. Increased Salinity

Detrimental responses to reclaimed water treatment included increased Na concentration, salinity, proportion of exchangeable Na and SAR. Na concentration increased an average of 5-fold across all facilities regardless of establishment date (Figure 3E). This consistent response across facility establishment date with no indication of accumulation at long-established facilities shows that applied Na is poorly retained due to low affinity on the cation exchange sites because of its low valence and large hydrated radius compared to other cations [88]. Increased electrical conductivity, SAR, or Na concentrations are common responses to reclaimed water amendment [73,89,90,91]. Salinity caused by irrigation water can be especially detrimental in arid regions when loading is limited and there is insufficient precipitation to flush the salts from the surface soils. Under these conditions, constituents may increase to toxic levels [92]. High salt concentrations of recycled water may be especially problematic for land application in arid regions and require preventative measures [70].
SAR is used to determine the alkali hazard where high levels can disperse and in turn negatively affect permeability and the rate of water infiltration [93]. Yet there is little risk when SAR is below 7.0 [52]. The low average of 0.4 in control plots to a maximum of 4.2 in treated plots at FWR facilities (Figure 3F) are well below levels of concern. High drainage during the wet season in temperate forests is likely to leach excess Na and avoid toxic accumulation. Consistently elevated Na and SAR values (Figure 3) across the studied FWR facilities allow us to conclude there is not a time-series effect for these variables. These time-independent salinity responses indicated that salt loading is high from the start of treatment, and it does not build over time, suggesting that no management interventions are required.

4.3. Depth Response

Several soil chemical variables demonstrated significant depth gradients in the forest study plots. Variables that have higher values at the surface and progressively decline include plant nutrients that are required in higher amounts than the soil can supply such as N, P and K [94]. Stratification of plant nutrients can be attributed to the accumulation from deposition on the surface through litter fall and from within the soil profile as higher concentration of roots occur in the upper soil horizons [95]. Our results confirm this principle for several essential plant nutrients (Figure 2). Other soil chemical variables associated with plant activity at the surface, such as organic carbon (Figure S1O) and cation exchange capacity (Figure S1G) also demonstrated higher values at the surface. Non-essential elements are largely independent of biological cycling and subject to leaching processes, and tend to accumulate at depth as they are depleted from the surface horizons [95], just as we observed for Na (Figure 2N). For NO3-N, PO4, Fe, and Zn the appearance of a time-series effect at only one of the depth layers (Figure S4) suggests that important interactions occur in response to reclaimed water treatment with depth-related soil properties. In the case of NO3-N, the greatest magnitude of response and a relatively strong time-series effect occurred at the surface, which demonstrates that such microbial transformation requires abundant ammonium and oxygen resources [96]. For PO4, Fe and Zn, treatment responses occur as a time-series effect at depth, suggesting that material transport of these elements are associated with the treatment response. We document the importance of preferential hydraulic flow through these FWR soils [36] and enhanced movement of P through these preferential flow paths [8], which allow suspended or dissolved constituent nutrients to percolate downwards through a soil profile and deposit at lower depths. Mobilization of Fe and Al from surface organic horizons followed by deposition within the B-horizon is commonly described in pedogenic models [97,98]. While further confirmation is required, manifestation of reclaimed water treatment effects below the surface horizon is consistent with these pedogenic and P weathering and transport models.

4.4. Soil C/N Ratio

The soil C/N ratio of the organic horizon (Control, 40 ± 1.3; Effluent, 34 ± 1.3) was higher than the surface mineral horizon (Control 23 ± 0.8; Effluent 21 ± 0.8) which declined further with depth (Figure S1A). This commonly observed progressive decline in the C/N ratio [99], results from a greater loss of C than N during oxidation and the cumulative impacts of organic matter decomposition with depth. The C/N ratio plays a significant role in organic matter status in forest soils [30,100] with the higher ratio indicating greater N limitation, decreased decomposition and organic matter accumulation [101]. The result can be beneficial because the remaining organic matter can improve soil water storage capacity [102] and carbon sequestration [103]. N mineralization occurs when C/N is low (<25), while immobilization occurs when C/N > 35 [100]. Reclaimed water amendments typically increase soil organic matter content [18,19,20]. This response may result from increased organic matter decomposition in the organic horizon [104]. The organic byproducts of decomposition are then deposited in the mineral horizons. A proportionally greater loss of C through decomposition exceeding the loss of N, narrows the C/N ratio [65]. In our study, the relatively high C/N ratio of the soil organic horizon of control plots listed above is consistent with regional native forests [105] and indicates that the forests within FWR facilities are nitrogen-limited and capable of retaining N. Retention of N from reclaimed water treatment and continued decomposition of organic matter resulted in some relief from N limitations as indicated by lower organic horizon C/N ratio, a subtle decrease in the mineral soil C/N ratio (Figure S2B) and increased tree growth [37].

4.5. Soil Chemical Characteristics Along the Time Series

Time-series analysis helps to distinguish trends and recognizes the underlying patterns throughout time, allowing for more accurate forecasting of soil nutrient parameters. A potential time series effect is indicated when treatment response is significantly dependent on facility establishment date in the ANCOVA model (T × E, Table 5), which must then be shown to have a greater treatment response at the long-established facilities than at recently established facilities. We observed a time-series response for Soil NO3-N and Ca (extractable and exchangeable). Soil NO3-N displayed a time-series effect overall (Figure 3A) and for the 0–15 cm depth layer when depth layers were examined separately (Figure S4A). Higher pH (Figure S2C) and increased nitrification [8] in treated plots, promoted an increase of NO3-N in the 0–15 cm soil layer. Greater P availability and pH through reclaimed water amendments can also facilitate nitrification and increases nitrate concentration by enhancing microbial activities [106,107]. Since soil nitrate is increasing at long-established facilities (Figure 3A), special emphasis should be given to manage nitrate leaching (see Section 4.1 and [8]).
Ca response to the time series at long-established facilities (Garfield Bay and Bottle Bay) (Figure 3B) is related to an increase in soil pH (Figure S2C), as well as the silt loam texture soils, which aids in Ca retention [108]. On the other hand, Na did not respond to the time series as silt loam soils do not hold sodium as strongly as heavier clay soils because monovalent sodium ions have a relatively large, hydrated radius, which inhibits their adsorption and enhances their mobility in soil [109]. Thus, Na ions can be leached easily from silt loam soils when sufficient water is applied and this leads to the leaching of excess Na deeper into the soil profile during high drainage season [110,111], explaining the increased Na concentration in the lower profile (45–75 cm) (Figure 2N).
This time series study allowed us to infer temporal changes in soil chemical variables by examining reclaimed water treated and non-treated soils at FWR facilities of varying operating times. While some facility-specific factors were correlated with the time series (Table 5, E, p < 0.05), they were uniform for both control and reclaimed water treated plots, so these factors were controlled at each facility. Identifying natural gradients by including control plots and defining correlations with dependent variables along the time series allows for controlled treatment comparison and discovery of soil chemical responses to reclaimed water amendments that are either dependent upon or independent of facility establishment date (Figure 3 and Figure 4). Although such space-for-time substitution experiments are not without concerns [40], this approach is particularly useful for understanding long-term ecological processes without waiting for those changes to manifest over time at a single site with tighter experimental controls. Using the time-series of FWR facilities, it was possible to assess the implications of long-term reclaimed water amendments on soil chemical responses, ecosystem health and to forecast increased environmental risk.

4.6. Applicable Regional Responses

The principles of N saturation are proving to be consistent among studies of regional forest N deposition, chronic forest N amendments and annual agricultural fertilization [31,32,64,112]. Thus, the principles of nitrifier abundance in relation to N additions and nitrification are applicable beyond Idaho FWR facilities. Reclaimed water amendments demonstrate the principles of balanced nutrition where a fertilizer blend is added in stoichiometric balance with other nutrients as compared with N-only fertilizer applications [85,86,87]. FWR facilities also apply nutrients in reclaimed water at regular intervals throughout the growing season which is applicable to split application studies where nutrients are regularly applied in concentrations at which plants can assimilate [113,114]. Although the salinity responses that we observed are more narrowly applicable to forested regions where precipitation exceeds evaporation and soluble salts are flushed from surface soils to lower horizons and into ground water. Our results concerning base saturation and C/N ratio are most applicable to temperate coniferous forests due to the impacts that different forest types have on such soil chemical factors [30,77].

5. Conclusions

Long-term soil amendment with reclaimed water affected soil chemical properties, which in turn had positive impacts on soil health. This work explored the effect of reclaimed water on soil chemical properties by hypothesizing that long-term amendment of soil with reclaimed water will increase soil nutrients. We partially confirmed this hypothesis by showing that continued application of nutrient constituents in reclaimed water at FWR facilities increased the content and concentration of some plant nutrients used as growth resources by forest trees including N, Ca, Fe, S and B. However, P, K, Mg and several micronutrients did not increase in response to reclaimed water amendments as hypothesized. Future research is necessary to quantify the extent to which these nutrients were acquired by and accumulated in the forest trees and understory vegetation. The lack of positive response by some cations might also include leaching losses that offset additions in reclaimed water.
A time-series effect was demonstrated for NO3-N, Ca, Fe and S, which confirms our second hypothesis for these plant nutrients. Our results suggest that continuous reclaimed water applications to N-limited forests over decades of service can result in increased NO3-N concentrations, indicating that they are at risk of N saturation. It is unlikely that this response is due to random variation or natural gradients because we see parallel responses in nitrification and nitrifier abundance indicating a syndrome of responses associated with N saturation. This raises the question about what the critical N loading rate for these forests is that can avoid NO3-N leaching.
In contrast with our second hypothesis, some nutrients, and especially Na, increased dramatically at all facilities regardless of establishment date. Increased concentrations of Na and Ca and the associated rise in salinity are not a concern for mesic forested sites because high drainage rates during wet seasons will likely cause leaching of excess Na. Additionally, Ca is maintained through natural forest ecosystem processes such as soil weathering and recycling from decaying organic matter. Nevertheless, salinity may pose a risk for land application of reclaimed water at facilities located in more arid regions that do not experience significant precipitation and drainage.
While we concluded that FWR improves soil productivity, this work suggests that important questions remain in the response of forests to long-term land application of reclaimed water. Including the fate and transport of applied P, the role of uptake by vegetation, critical N loading rates to avoid leaching losses, and the relative magnitude of other N transformation processes such as gross mineralization, denitrification and the efflux of gaseous N.

Supplementary Materials

The following supporting information can be downloaded at: https://www.mdpi.com/article/10.3390/soilsystems9020032/s1. Figure S1. Diagnostic soil chemical variables in response to depth and facility. Each column is the least squares mean, and bars are standard error (n = 10). Columns within each facility having the same letter above are not significantly different. Abbreviations: carbon to nitrogen C/N), sodium adsorption ratio (SAR), phosphorous saturation ratio (PSR), cation exchange capacity (CEC). Figure S2. Select nutrient and diagnostic soil chemical variables in response to reclaimed water treatment (control vs. effluent) and facility. Each column is the least squares depth weighted mean and bars are standard error (n = 15). Columns within each facility having the same letter above are not significantly different based on Tukey’s test (α = 0.10). Abbreviations: sodium adsorption ratio (SAR), cation exchange capacity (CEC). Figure S3. Soil chemical variables where the treatment effect was significantly dependent upon both facility and depth (Table 4, T × F × D, p < 0.05). Each column is the least squared mean and standard error (n = 15). Significant (*) or non-significant (ns) treatment differences are indicated within each facility. Figure S4. Scatter plots where the treatment effect was significantly dependent upon both facility and depth (Table 5, T × E × D, p < 0.05). Tests for significant differences between slope and intercept are shown. No test for the intercept is possible when the slopes are significantly different. Highly significant, ***, p-values ≤0.01; Significant **, 0.01 > p-value ≤ 0.05; Marginally significant, *, 0.05 < p-value ≤0.10; Not significant, ns, p-value >0.10. Figure S5. The relationship between (A) different phosphate extraction procedures (p < 0.001, r-squared = 0.52) and (B) different P saturation ratios for Bottle Bay (p < 0.001, r-squared = 0.60). Abbreviations: oxalate extractable P (Pox), Bray-1 extractable P (Bray-1), degree of P saturation (DPS), P saturation ratio (PSR). Slopes and intercepts were not statistically different between treatments so a single line could be plotted for each graph. Figure S6. Litter P extraction compared between treatments for samples collected at Bottle Bay FWR facility expressed as concentration (A) and content (B). Treatments were not significantly different in either comparison.

Author Contributions

Methodology, T.G.W., E.J., M.D.C., R.H. and D.G.S.; formal analysis, T.G.W. and M.D.C.; resources, M.D.C. and D.G.S.; data curation, T.G.W. and M.D.C.; writing—original draft preparation, T.G.W. and M.D.C.; writing—review and editing, T.G.W., E.J., M.D.C., R.H. and D.G.S.; project administration, M.D.C. and D.G.S.; funding acquisition, M.D.C. and D.G.S. All authors have read and agreed to the published version of the manuscript.

Funding

This research was funded by United States Department of Agriculture-National Institute of Food and Agriculture, award numbers 2020-67020-31174 and 2023-67020-39699.

Data Availability Statement

Acknowledgments

The authors of this article express their gratitude to Michael Cook and Matthew Plaisted at Idaho Department of Environmental Quality; Ron Hise, Chris Hoosick and Nathan Blackburn at Heyburn State Park; Dex Vogel and Trecy Carpenter at Ellisport Bay Sewer District; Bob Hansen, Don Moore, Stephen Miller and William Valentine at Garfield Bay Water & Sewer District and Bottle Bay Recreational Water & Sewer District; Leanord Johnson and Jeremy Polk at Cave Bay Community Services; Norris Booth from Coeur d’Alene Tribe and Ray Entz from Kalispell Tribe of Indians; and Dale and Gary Vanstone (Ellisport Bay landowners), without whose support, this project would not have been possible.

Conflicts of Interest

The authors declare no conflicts of interest.

References

  1. Shevah, Y. Water Resources, Water Scarcity Challenges, and Perspectives. ACS Symp. Ser. 2015, 1206, 10–185. [Google Scholar] [CrossRef]
  2. Wallace, J.S. Increasing agricultural water use efficiency to meet future food production. Agric. Ecosyst. Environ. 2000, 82, 105–119. [Google Scholar] [CrossRef]
  3. Fito, J.; Van Hulle, S.W.H. Wastewater reclamation and reuse potentials in agriculture: Towards environmental sustainability. Environ. Dev. Sustain. 2021, 23, 2949–2972. [Google Scholar] [CrossRef]
  4. Chen, W.; Lu, S.; Jiao, W.; Wang, M.; Chang, A.C. Reclaimed water: A safe irrigation water source? Environ. Dev. 2013, 8, 74–83. [Google Scholar] [CrossRef]
  5. Asano, T. Irrigation with Treated Sewage Effluents. In Management of Water Use in Agriculture. Advanced Series in Agricultural Sciences; Tanji, K.K., Yaron, B., Eds.; Springer: Berlin, Germany, 1994; pp. 199–228. [Google Scholar] [CrossRef]
  6. Wang, Z.; Li, J.; Li, Y. Using Reclaimed Water for Agricultural and Landscape Irrigation in China: A Review. Irrig. Drain. 2017, 66, 672–686. [Google Scholar] [CrossRef]
  7. Radcliffe, J.C. Current status of recycled water for agricultural irrigation in Australia, potential opportunities and areas of emerging concern. Sci. Total Environ. 2022, 807, 151676. [Google Scholar] [CrossRef]
  8. Joshi, E.; Schwarzbach, M.R.; Briggs, B.; Coats, E.R.; Coleman, M.D. Nutrient leaching potential along a time series of forest water reclamation facilities in northern Idaho. J. Environ. Manag. 2024, 366, 121729. [Google Scholar] [CrossRef]
  9. Magesan, G.N.; Wang, H. Application of municipal and industrial residuals in New Zealand forests: An overview. Soil Res. 2003, 41, 557–569. [Google Scholar] [CrossRef]
  10. Guedes, P.; Martins, C.; Couto, N.; Silva, J.; Mateus, E.P.; Ribeiro, A.B.; Pereira, C.S. Irrigation of soil with reclaimed wastewater acts as a buffer of microbial taxonomic and functional biodiversity. Sci. Total Environ. 2022, 802, 149671. [Google Scholar] [CrossRef]
  11. Heidarpour, M.; Mostafazadeh-Fard, B. The effects of treated wastewater on soil chemical properties using subsurface and surface irrigation methods. Agric. Water Manag. 2007, 90, 87–94. [Google Scholar] [CrossRef]
  12. Leogrande, R.; Pedrero, F.; Nicolas, E.; Vitti, C.; Lacolla, G.; Stellacci, A.M. Reclaimed Water Use in Agriculture: Effects on Soil Chemical and Biological Properties in a Long-Term Irrigated Citrus Farm. Agronomy 2022, 12, 1317. [Google Scholar] [CrossRef]
  13. Gu, X.; Xiao, Y.; Yin, S.; Liu, H.; Men, B.; Hao, Z.; Qian, P.; Yan, H.; Hao, Q.; Niu, Y.; et al. Impact of long-term reclaimed water irrigation on the distribution of potentially toxic elements in soil: An in-situ experiment study in the North China plain. Int. J. Environ. Res. Public Health 2019, 16, 649. [Google Scholar] [CrossRef] [PubMed]
  14. Sonmez, S.; Buyuktas, D.; Okturen, F.; Citak, S. Assessment of different soil to water ratios (1:1, 1:2.5, 1:5) in soil salinity studies. Geoderma 2008, 144, 361–369. [Google Scholar] [CrossRef]
  15. Gohil, M.B. Land Treatment of Waste Water; New Age International: New Delhi, India, 2000. [Google Scholar]
  16. Stewart, H.T.L.; Hopmans, P.; Flinn, D.W.; Hillman, T.J. Nutrient accumulation in trees and soil following irrigation with municipal effluent in Australia. Environ. Pollut. 1990, 63, 155–177. [Google Scholar] [CrossRef]
  17. Norton-Brandao, D.; Scherrenberg, S.M.; van Lier, J.B. Reclamation of used urban waters for irrigation purposes—A review of treatment technologies. J. Environ. Manag. 2013, 122, 85–98. [Google Scholar] [CrossRef]
  18. Bowden, R.D.; Wurzbacher, S.J.; Washko, S.E.; Wind, L.; Rice, A.M.; Coble, A.E.; Baldauf, N.; Johnson, B.; Wang, J.J.; Simpson, M. Long-term nitrogen addition decreases organic matter decomposition and increases forest soil carbon. Soil Sci. Soc. Am. J. 2019, 83, S82–S95. [Google Scholar] [CrossRef]
  19. Friedel, J.K.; Langer, T.; Siebe, C.; Stahr, K. Effects of long-term waste water irrigation on soil organic matter, soil microbial biomass and its activities in central Mexico. Biol. Fertil. Soils 2000, 31, 414–421. [Google Scholar]
  20. Sánchez–González, A.; Chapela–Lara, M.; Germán–Venegas, E.; Fuentes-García, R.; Río-Portilla, F.d.; Siebe, C. Changes in quality and quantity of soil organic matter stocks resulting from wastewater irrigation in formerly forested land. Geoderma 2017, 306, 99–107. [Google Scholar] [CrossRef]
  21. Cusack, D.F.; Silver, W.L.; Torn, M.S.; Burton, S.D.; Firestone, M.K. Changes in microbial community characteristics and soil organic matter with nitrogen additions in two tropical forests. Ecology 2011, 92, 621–632. [Google Scholar] [CrossRef]
  22. Tsigoida, A.; Argyrokastritis, I. The effect of sub-irrigation with untreated and treated municipal wastewater on organic matter and nitrogen content in two different soils. Glob. NEST J. 2019, 1, 389–398. [Google Scholar]
  23. Lu, S.; Wang, J.; Pei, L. Study on the effects of irrigation with reclaimed water on the content and distribution of heavy metals in soil. Int. J. Environ. Res. Public Health 2016, 13, 298. [Google Scholar] [CrossRef] [PubMed]
  24. Brockway, D.G.; Urie, D.H.; Nguyen, P.V.; Hart, J.B. Wastewater and sludge nutrient utilization in forest ecosystems. In The Forest Alternative for Treatment and Utilization of Municipal and Industrial Wastes; Cole, D.W., Henry, C.L., Nutter, W.L., Eds.; University of Washington Press: Seattle, WA, USA, 1986; pp. 221–245. [Google Scholar]
  25. NRC. Use of Reclaimed Water and Sludge in Food Crop Production; NRC: Ottawa, ON, Canada, 1996; p. 178. [Google Scholar]
  26. Coleman, M.D.; Shaw, T.M.; Kimsey, M.J.; Moore, J.A. Nutrition of Douglas-fir in the inland northwest. Soil Sci. Soc. Am. J. 2014, 78, S11–S22. [Google Scholar]
  27. Parent, D.R.; Coleman, M.D. Grand fir nutrient management in the Inland Northwestern USA. Forests 2016, 7, 261. [Google Scholar] [CrossRef]
  28. Guo, W.; Andersen, M.N.; bin Qi, X.; Li, P.; yang Li, Z.; yang Fan, X.; Zhou, Y. Effects of reclaimed water irrigation and nitrogen fertilization on the chemical properties and microbial community of soil. J. Integr. Agric. 2017, 16, 679–690. [Google Scholar] [CrossRef]
  29. Angst, G.; Messinger, J.; Greiner, M.; Husler, W.; Hertel, D.; Kirfel, K.; Kgel-Knabner, I.; Leuschner, C.; Rethemeyer, J.; Mueller, C.W. Soil organic carbon stocks in topsoil and subsoil controlled by parent material, carbon input in the rhizosphere, and microbial-derived compounds. Soil Biol. Biochem. 2018, 122, 19–30. [Google Scholar] [CrossRef]
  30. Lovett, G.M.; Weathers, K.C.; Arthur, M.A. Control of nitrogen loss from forested watersheds by soil carbon:Nitrogen ratio andtree species composition. Ecosystems 2002, 5, 712–718. [Google Scholar] [CrossRef]
  31. Aber, J.; Nadelhoffer, K.; Steudler, P.; Melillo, J. Nitrogen saturation in northern forest ecosystems-hypotheses and implications. BioScience 1989, 39, 378–386. [Google Scholar]
  32. Magill, A.H.; Aber, J.D.; Currie, W.S.; Nadelhoffer, K.J.; Martin, M.E.; McDowell, W.H.; Melillo, J.M.; Steudler, P. Ecosystem response to 15 years of chronic nitrogen additions at the Harvard Forest LTER, Massachusetts, USA. For. Ecol. Manag. 2004, 196, 7–28. [Google Scholar] [CrossRef]
  33. Reynolds, B.; Wilson, E.J.; Emmett, B.A. Evaluating critical loads of nutrient nitrogen and acidity for terrestrial systems using ecosystem-scale experiments (NITREX). For. Ecol. Manag. 1998, 101, 81–94. [Google Scholar] [CrossRef]
  34. Xie, D.; Duan, L.; Du, E.; de Vries, W. Chapter 14—Indicators and thresholds for nitrogen saturation in forest ecosystems. In Atmospheric Nitrogen Deposition to Global Forests; Du, E., de Vries, W., Eds.; Academic Press: New York, NY, USA, 2024; pp. 249–261. [Google Scholar]
  35. Nilsson, J. Critical Loads for Sulphur and Nitrogen. In Proceedings of the Air Pollution and Ecosystems; Springer: Dordrecht, The Netherlands, 1988; pp. 85–91. [Google Scholar]
  36. Schwarzbach, M.; Brooks, E.S.; Heinse, R.; Joshi, E.; Coleman, M.D. Estimating Drainage from Forest Water Reclamation Facilities Based on Drain Gauge Measurements. Hydrology 2024, 11, 87. [Google Scholar] [CrossRef]
  37. Joshi, E.; Coleman, M.D. Tree Growth and Vegetation Diversity in Northern Idaho Forest Water Reclamation Facilities. Forests 2023, 14, 266. [Google Scholar] [CrossRef]
  38. McDaniel, P.A.; Wilson, M.A.; Burt, R.; Lammers, D.; Thorson, T.D.; McGrath, C.L.; Peterson, N. Andic Soils of the Inland Pacific Northwest, USA: Properties and Ecological Significance. Soil Sci. 2005, 170, 300–311. [Google Scholar] [CrossRef]
  39. Soil Survey Staff. Official Soil Series Descriptions. Available online: https://websoilsurvey.nrcs.usda.gov/app/ (accessed on 8 February 2025).
  40. Pickett, S.T.A. Space-for-time substitution as an alternative to long-term studies. In Long-Term Studies in Ecology; Likens, G.E., Ed.; Springer: New York, NY, USA, 1989; pp. 110–135. [Google Scholar]
  41. Peters, J. Lab Procedures and Methods. Available online: https://uwlab.soils.wisc.edu/about-us/lab-procedures-and-methods/ (accessed on 14 February 2025).
  42. Miller, R.O.; Kissel, D.E. Comparison of Soil pH Methods on Soils of North America. Soil Sci. Soc. Am. J. 2010, 74, 310–316. [Google Scholar] [CrossRef]
  43. Eik, K.; Hanway, J.J. Simultaneous extraction of P and K from IOWA soils with bray 1 solution containing NH4Cl. Commun. Soil Sci. Plant Anal. 1986, 17, 1203–1225. [Google Scholar] [CrossRef]
  44. Shuman, L.M. Comparison of exchangeable Al, extractable Al, and Al in soil fractions. Can. J. Soil Sci. 1990, 70, 263–275. [Google Scholar] [CrossRef]
  45. Bingham, F.T. Boron. In Methods of Soil Analysis: Part 2 Chemical and Microbiological Properties; Wiley: New York, NY, USA, 1982; Volume 9, pp. 431–447. [Google Scholar]
  46. Schollenberger, C.J.; Simon, R.H. Determination of exchange capacity and exchangeable bases in soil—Ammonium acetate method. Soil Sci. 1945, 59, 13–24. [Google Scholar] [CrossRef]
  47. Singh, R.; Bhumbla, D.K.; Keefer, R.F. Recommended soil sulfate-S tests. Recommended soil testing procedures for the northeastern United States. Northeast Reg. Bull. 1995, 493, 46–51. [Google Scholar]
  48. Lindsay, W.L.; Norvell, W. Development of a DTPA soil test for zinc, iron, manganese, and copper. Soil Sci. Soc. Am. J. 1978, 42, 421–428. [Google Scholar] [CrossRef]
  49. Sumner, M.E.; Miller, W.P. Cation exchange capacity and exchange coefficients. In Methods of soil analysis: Part 3 Chemical Methods; Wiley: New York, NY, USA, 1996; Volume 5, pp. 1201–1229. [Google Scholar]
  50. Ross, D.S.; Ketterings, Q. Recommended methods for determining soil cation exchange capacity. Publication No. 493. In Recommended Soil Testing Procedures for the Northeastern United States, 3rd ed.; University of Delaware: Newark, DE, USA, 2011; pp. 75–85. [Google Scholar]
  51. Guo, J.-H.; Zhang, X.-S.; Vogt, R.D.; Xiao, J.-S.; Zhao, D.-W.; Xiang, R.-J.; Luo, J.-H. Evaluating controlling factors to Al i/(Ca+ Mg) molar ratio in acidic soil water, Southern and Southwestern China: Multivariate approach. Environ. Monit. Assess. 2007, 129, 321–329. [Google Scholar]
  52. USSL. Determination of the properties of saline and alkali soils. In Diagnosis and Improvement of Saline and Alkali Soils; Volume Agriculture Handbook No. 60; USDA ARS: Washington, DC, USA, 1954; pp. 7–33. [Google Scholar]
  53. Nair, V.D. Soil phosphorus saturation ratio for risk assessment in land use systems. Front. Environ. Sci. 2014, 2, 6. [Google Scholar] [CrossRef]
  54. Schoumans, O.F. Determination of the degree of phosphate saturation in noncalcareous soils. In Methods of Phosphorus Analysis for Soils, Sediments, Residuals, and Waters, 2nd ed.; Kovar, J., Pierzynski, G., Eds.; Southern Cooperative Series Bulletin; Southern Extension and Research Activity (SERA); North Carolina State University: Raleigh, NC, USA, 2009; pp. 29–32. [Google Scholar]
  55. Andraski, B.J. Balloon and core sampling for determining bulk density of alluvial desert soil. Soil Sci. Soc. Am. J. 1991, 55, 1188–1190. [Google Scholar]
  56. Meiwes, K.J.; Khanna, P.K.; Ulrich, B. Parameters for describing soil acidification and their relevance to the stability of forest ecosystems. For. Ecol. Manag. 1986, 15, 161–179. [Google Scholar]
  57. Blake, G.R. Particle density. In Encyclopedia of Soil Science; CRC Press: Boca Raton, FL, USA, 2008; pp. 504–505. [Google Scholar]
  58. Littell, R.C.; Milliken, G.A.; Stroup, W.W.; Wolfinger, R.D. SAS for Mixed Models, 2nd ed.; SAS Institute, Inc.: Cary, NC, USA, 2006; p. 633. [Google Scholar]
  59. Eveborn, D.; Kong, D.G.; Gustafsson, J.P. Wastewater treatment by soil infiltration: Long-term phosphorus removal. J. Contam. Hydrol. 2012, 140, 24–33. [Google Scholar] [CrossRef] [PubMed]
  60. Tzanakakis, V.A.; Paranychianakis, N.V.; Londra, P.A.; Angelakis, A.N. Effluent application to the land: Changes in soil properties and treatment potential. Ecol. Eng. 2011, 37, 1757–1764. [Google Scholar] [CrossRef]
  61. Zalacin, D.; Bienes, R.; Sastre-Merln, A.; Martnez-Prez, S.; Garca-Daz, A. Influence of reclaimed water irrigation in soil physical properties of urban parks: A case study in Madrid (Spain). Catena 2019, 180, 333–340. [Google Scholar]
  62. Rahman, M.M.; Shahrivar, A.A.; Hagare, D.; Maheshwari, B. Impact of Recycled Water Irrigation on Soil Salinity and Its Remediation. Soil Syst. 2022, 6, 13. [Google Scholar] [CrossRef]
  63. Shan, S.; Coleman, M.a. Soil Soluble Nitrogen Availability across an Elevation Gradient in a Cold-Temperate Forest Ecosystem. Soil Sci. Soc. Am. J. 2014, 78, S217–S224. [Google Scholar]
  64. Högberg, P.; Lucas, R.W.; Högberg, M.N.; Skyllberg, U.; Egnell, G.; Larson, J.; Binkley, D. What happens to trees and soils during five decades of experimental nitrogen loading? For. Ecol. Manag. 2024, 553, 121644. [Google Scholar] [CrossRef]
  65. Polglase, P.J.; Tompkins, D.; Stewart, L.G.; Falkiner, R.A. Mineralization and leaching of nitrogen in an effluent-irrigated pine plantation. J. Environ. Qual. 1995, 24, 911–920. [Google Scholar] [CrossRef]
  66. Du, E.; de Vries, W. (Eds.) Atmospheric Nitrogen Deposition to Global Forests; Academic Press: New York, NY, USA, 2024; pp. 169–182. [Google Scholar]
  67. Stanton, B.; Gantz, C.; Coleman, M.D.; Comnick, J.; Cooke, A.; Rogers, L.; Espinoza, J.; Heppenstall, M.; Shuren, R.; Kallestad, J.C.; et al. Growing Hybrid Poplar for Bioenergy in the PNW, EM123; Agriculture and Natural Resources Extension, Washington State University: Pullman, WA, USA, 2023; p. 116. [Google Scholar]
  68. Wuenscher, R.; Unterfrauner, H.; Peticzka, R.; Zehetner, F. A comparison of 14 soil phosphorus extraction methods applied to 50 agricultural soils from Central Europe. Plant Soil Environ. 2015, 61, 86–96. [Google Scholar] [CrossRef]
  69. Gruba, P.; Mulder, J. Tree species affect cation exchange capacity (CEC) and cation binding properties of organic matter in acid forest soils. Sci. Total Environ. 2015, 511, 655–662. [Google Scholar] [CrossRef] [PubMed]
  70. Bedbabis, S.; Rouina, B.B.; Boukhris, M.; Ferrara, G. Effect of irrigation with treated wastewater on soil chemical properties and infiltration rate. J. Environ. Manag. 2014, 133, 45–50. [Google Scholar]
  71. Abegunrin, T.P.; Awe, G.O.; Idowu, D.O.; Adejumobi, M.A. Impact of wastewater irrigation on soil physico-chemical properties, growth and water use pattern of two indigenous vegetables in southwest Nigeria. Catena 2016, 139, 167–178. [Google Scholar] [CrossRef]
  72. Tarchouna, L.G.; Merdy, P.; Raynaud, M.; Pfeifer, H.-R.; Lucas, Y. Effects of long-term irrigation with treated wastewater. Part I: Evolution of soil physico-chemical properties. Appl. Geochem. 2010, 25, 1703–1710. [Google Scholar]
  73. Qian, Y.; Lin, Y. Comparison of soil chemical properties prior to and five to eleven years after recycled water irrigation. J. Environ. Qual. 2019, 48, 1758–1765. [Google Scholar] [CrossRef]
  74. Andrews, D.M.; Robb, T.; Elliott, H.; Watson, J.E. Impact of long-term wastewater irrigation on the physicochemical properties of humid region soils:“The Living Filter” site case study. Agric. Water Manag. 2016, 178, 239–247. [Google Scholar]
  75. Krause, S.M.B.; Dohrmann, A.B.; Gillor, O.; Christensen, B.T.; Merbach, I.; Tebbe, C.C. Soil properties and habitats determine the response of bacterial communities to agricultural wastewater irrigation. Pedosphere 2020, 30, 146–158. [Google Scholar]
  76. Hu, Y.; Schmidhalter, U. Drought and salinity: A comparison of their effects on mineral nutrition of plants. J. Plant Nutr. Soil Sci. 2005, 168, 541–549. [Google Scholar]
  77. Ahrends, B.; Fortmann, H.; Meesenburg, H. The Influence of Tree Species on the Recovery of Forest Soils from Acidification in Lower Saxony, Germany. Soil Syst. 2022, 6, 40. [Google Scholar] [CrossRef]
  78. Rice, A.M.; Perdrial, N.; Treto, V.; D’Amato, A.W.; Smith, G.A.; Richardson, J.B. Influence of parent material mineralogy on forest soil nutrient release rates across a nutrient richness gradient. Geoderma 2024, 451, 117081. [Google Scholar] [CrossRef]
  79. Garrison, M.T.; Moore, J.A.; Shaw, T.M.; Mika, P.G. Foliar nutrient and tree growth response of mixed-conifer stands to three fertilization treatments in northeast Oregon and north central Washington. For. Ecol. Manag. 2000, 132, 183–198. [Google Scholar]
  80. Brockley, R.P. Effects of 12 years of repeated fertilization on the foliar nutrition and growth of young lodgepole pine in the central interior of British Columbia. Can. J. For. Res. 2007, 37, 2115–2129. [Google Scholar] [CrossRef]
  81. Moore, J.A.; Kimsey, M.J.; Garrison-Johnston, M.; Shaw, T.M.; Mika, P.; Poolakkal, J. Geologic soil parent material influence on Forest surface soil chemical characteristics in the inland northwest, USA. Forests 2022, 13, 1363. [Google Scholar] [CrossRef]
  82. Lehto, T.; Ruuhola, T.; Dell, B. Boron in forest trees and forest ecosystems. For. Ecol. Manag. 2010, 260, 2053–2069. [Google Scholar]
  83. EPA. Guidelines for Water Reuse; US Environmental Protection Agency: Washington, DC, USA, 2012; p. 643. [Google Scholar]
  84. Homann, P.S.; Van Miegroet, H.; Cole, D.W.; Gordon, V.W. Cation Distribution, Cycling, and Removal from Mineral Soil in Douglas-Fir and Red Alder Forests. Biogeochemistry 1992, 16, 121–150. [Google Scholar]
  85. Hüttl, R.F.; Wisniewski, J. Fertilization as a tool to mitigate forest decline associated with nutrient deficiencies. Water Air Soil Pollut. 1987, 33, 265–276. [Google Scholar] [CrossRef]
  86. Lugo, A.; Snchez, M.J.; Betancourt, L.S.; Ramos, O.; Vicens, I. A Stoichiometric Comparison of Primary and Secondary Forest Stands on Acid Soils. Caribb. Nat. 2023, 89, 1–32. [Google Scholar]
  87. Ågren, G.I.; Wetterstedt, J.Å.M.; Billberger, M.F.K. Nutrient limitation on terrestrial plant growth–modeling the interaction between nitrogen and phosphorus. New Phytol. 2012, 194, 953–960. [Google Scholar] [CrossRef]
  88. Strawn, D.; Bohn, H.L.; O’Connor, G.A. Soil Chemistry, 5th ed.; Wiley Blackwell: Hoboken, NJ, USA, 2020. [Google Scholar]
  89. Chen, W.; Lu, S.; Pan, N.; Jiao, W. Impacts of long-term reclaimed water irrigation on soil salinity accumulation in urban green land in Beijing. Water Resour. Res. 2013, 49, 7401–7410. [Google Scholar]
  90. Adrover, M.; Farrús, E.; Moyà, G.; Vadell, J. Chemical properties and biological activity in soils of Mallorca following twenty years of treated wastewater irrigation. J. Environ. Manag. 2012, 95, S188–S192. [Google Scholar]
  91. Klay, S.; Charef, A.; Ayed, L.; Houman, B.; Rezgui, F. Effect of irrigation with treated wastewater on geochemical properties (saltiness, C, N and heavy metals) of isohumic soils (Zaouit Sousse perimeter, Oriental Tunisia). Desalination 2010, 253, 180–187. [Google Scholar] [CrossRef]
  92. Tarolli, P.; Luo, J.; Park, E.; Barcaccia, G.; Masin, R. Soil salinization in agriculture: Mitigation and adaptation strategies combining nature-based solutions and bioengineering. iScience 2024, 27, 108830. [Google Scholar] [CrossRef] [PubMed]
  93. Levy, G.J. Sodicity. In: Handbook of Soil Sciences. In Resource Management and Environmental Impacts, 2nd ed.; Huang, P., Li, Y., Sumner, M., Eds.; CRC Press: Boca Raton, FL, USA, 2012. [Google Scholar]
  94. Jobbagy, E.G.; Jackson, R.B. The distribution of soil nutrients with depth: Global patterns and the imprint of plants. Biogeochemistry 2001, 53, 51–77. [Google Scholar] [CrossRef]
  95. Hynicka, J.D.; Pett-Ridge, J.C.; Perakis, S.S. Nitrogen enrichment regulates calcium sources in forests. Glob. Change Biol. 2016, 22, 4067–4079. [Google Scholar] [CrossRef]
  96. Prosser, J.I. Soil Nitrifiers and Nitrification. In Nitrification; Ward, B.B., Arp, D.J., Klotz, M.G., Eds.; Wiley: New York, NY, USA, 2011; pp. 347–383. [Google Scholar]
  97. de Francisco, M.; Romeiro, A.; Dures, L.; lvarez-Torrellas, S.; Ibaez, M.A.; Almendros, P. Environmental Behaviour of Synthesized and Commercial Agricultural Zinc Products: Leaching, Migration, and Availability in Soils. J. Soil Sci. Plant Nutr. 2024, 24, 5293–5308. [Google Scholar] [CrossRef]
  98. Johnson, D.L.; Watson-Stegner, D. Evolution model of pedogenesis. Soil Sci. 1987, 143, 349–366. [Google Scholar] [CrossRef]
  99. Marty, C.; Houle, D.; Gagnon, C.; Courchesne, F. The relationships of soil total nitrogen concentrations, pools and C:N ratios with climate, vegetation types and nitrate deposition in temperate and boreal forests of eastern Canada. Catena 2017, 152, 163–172. [Google Scholar] [CrossRef]
  100. Chapin, F.S.; Matson, P.A.; Vitousek, P.M. Principles of terrestrial ecosystem ecology, 2nd ed.; Springer: New York, NY, USA, 2011; p. xv. 529p. [Google Scholar]
  101. Hadas, A.; Rawitz, E.; Etkin, H.; Margolin, M. Short-term variations of soil physical properties as a function of the amount and C/N ratio of decomposing cotton residues. I. Soil Aggreg. Aggreg. Tensile Strength. Soil Tillage Res. 1994, 32, 183–198. [Google Scholar]
  102. Abdallah, A.M.; Jat, H.S.; Choudhary, M.; Abdelaty, E.F.; Sharma, P.C.; Jat, M.L. Conservation agriculture effects on soil water holding capacity and water-saving varied with management practices and agroecological conditions: A Review. Agronomy 2021, 11, 1681. [Google Scholar] [CrossRef]
  103. Christopher, S.F.; Lal, R. Nitrogen management affects carbon sequestration in North American cropland soils. Crit. Rev. Plant Sci. 2007, 26, 45–64. [Google Scholar] [CrossRef]
  104. Richenderfer, J.L.; Sopper, W.E. Effect of spray irrigation of treated municipal sewage effluent on the accumulation and decomposition of the forest floor. In Utilization of Municipal Sewage Effluent and Sludge on Forest and Disturbed Land; Sopper, W.E., Kerr, S.N., Eds.; Pennsylvania State University Press: University Park, PA, USA, 1979; pp. 163–177. [Google Scholar]
  105. Page-Dumroese, D.S.; Jurgensen, M.F. Soil carbon and nitrogen pools in mid- to late-successional forest stands of the northwestern United States: Potential impact of fire. Can. J. For. Res. 2006, 36, 2270–2284. [Google Scholar] [CrossRef]
  106. Xia, S.; Jiang, J.; Liu, F.; Chang, Z.; Yu, M.; Liu, C.; Wang, Y.-P.; Yan, J. Phosphorus addition promotes plant nitrogen uptake mainly via enhancing microbial activities: A global meta-analysis. Appl. Soil Ecol. 2023, 188, 104927. [Google Scholar]
  107. DeForest, J.L.; Otuya, R.K. Soil nitrification increases with elevated phosphorus or soil pH in an acidic mixed mesophytic deciduous forest. Soil Biol. Biochem. 2020, 142, 107716. [Google Scholar]
  108. Phogat, V.K.; Tomar, V.S.; Dahiya, R. Soil physical properties. In Soil Science: An Introduction; Indian Society of Soil Science: New Delhi, Indian, 2015; pp. 135–171. [Google Scholar]
  109. Panhwar, Q.A.; Ali, A.; Naher, U.A.; Memon, M.Y. Fertilizer management strategies for enhancing nutrient use efficiency and sustainable wheat production. In Organic Farming; Woodhead Publishing: Cambridge, UK, 2019; pp. 17–39. [Google Scholar]
  110. Bauder, J.W.; Brock, T.A. Irrigation water quality, soil amendment, and crop effects on sodium leaching. Arid Land Res. Manag. 2001, 15, 101–113. [Google Scholar] [CrossRef]
  111. Hamza, J.N. Investigation on using magnetic water technology for leaching high saline-sodic soils. Environ. Monit. Assess. 2019, 191, 519. [Google Scholar]
  112. Di, H.J.; Cameron, K.C. Nitrate leaching in temperate agroecosystems: Sources, factors and mitigating strategies. Nutr. Cycl. Agroecosystems 2002, 64, 237–256. [Google Scholar] [CrossRef]
  113. Bergh, J.; Linder, S.; Lundmark, T.; Elfving, B. The effect of water and nutrient availability on the productivity of Norway spruce in northern and southern Sweden. For. Ecol. Manag. 1999, 119, 51–62. [Google Scholar] [CrossRef]
  114. Van Miegroet, H.; Norby, R.J.; Tschaplinski, T.J. Nitrogen fertilization strategies in short-rotation sycamore. For. Ecol. Manag. 1994, 64, 13–24. [Google Scholar]
Figure 1. Study area: Five regional forest water reclamation facilities (labeled points) in northern Idaho, USA. Shaded area is the state of Idaho.
Soilsystems 09 00032 g001
Figure 2. Concentration of plant nutrients in soil in response to facility and depth. (A) Total N, (B) NO3-N, (C) Total P, (D) Bray 1 P, (E) K, (F) Ca, (G) Mg, (H) Fe, (I) S, (J) Mn, (K) Zn, (L) Cu, (M) B, (N) Na, (O) Al. Each column is the least squares mean, and bars are standard error (n = 10). Columns within each facility having the same letter above are not significantly different.
Soilsystems 09 00032 g002
Figure 3. Scatter plots for soil chemical variables where (A,B) the treatment effect was dependent upon facility establishment date or (CH) the treatment effect was independent of establishment date. Each point represents the average of three depth increments. Solid lines are least-squares linear regression fitted to each treatment (n = 25) and dotted lines are 95% confidence interval. Some overlapping points are not distinguishable.
Soilsystems 09 00032 g003
Figure 4. Scatter plots for soil nutrient content where (AD) the treatment effect depended on facility establishment date and (EG) the treatment effect was consistent for all establishment dates. Each point represents the sum of three depth increments. Solid lines are least-squares linear regression fitted to each treatment (n = 25) and dotted lines are 95% confidence interval. Some overlapping points are not distinguishable.
Soilsystems 09 00032 g004
Table 1. Location and climate characteristics of study facilities.
Reclamation FacilityLatitudeLongitudeYear EstablishedMAP
(mm)
MAT
(°C)
Precipitation
Nov–Mar (%)
Cave Bay47.4703° N116.8803° W20105348.457
Heyburn47.3462° N116.7821° W20136638.260
Ellisport Bay48.2159° N116.2696° W20006337.755
Bottle Bay 48.2018° N116.4207° W19897527.457
Garfield Bay 48.2287° N116.4384° N19787097.457
Abbreviations: Mean annual precipitation (MAP), mean annual temperature (MAT).
Table 2. Soil description for study facilities.
Reclamation FacilityTextureParent MaterialSurficial DepositsEcological Site ClassSoil Series
Cave BayGravelly loamBasaltLoess (thin)Warm-mesic, xericLacy
HeyburnSilt loamLoessVolcanic ashWarm-frigid, xericCarlinton
Ellisport BaySilt loamGlacial tillVolcanic ashFrigid, udicPend Oreille
Bottle BaySilt loamGlacial tillVolcanic ashFrigid, udicPend Oreille
Garfield BaySilt loamGlacial tillVolcanic ashFrigid, udicPend Oreille
Source: Web Soil Survey [39].
Table 3. Experimental factors included for the statistical analysis.
EffectLevelsDescription
Treatment2Control, Effluent
Depth30–15, 15–45, 45–75 cm
Facilities5See Table 1 and Table 2
Replicate plots5
Total sample plots150
Subsamples per plot3Soil chemical analyses
2Bulk density
Table 4. Significance levels from analysis of variance (ANOVA) for soil chemical variables in response to experimental factors (Effect). In these statistical models, facility is included as a categorical variable.
EffectCNNO3PPO4KCaMgFeSMnZnCuBNa
T ****** ***** *** ******
F*********************** ****** *********
D************************************ ******
T × F ****** *** ***
T × D * ****** ***********
F × D * ****** ***********************
T × F × D ***** *** *** ***
EffectAlpHBpHC:NSaltSARPSRCECexCaexMgexKexNaexHexAlBS
T ************** ************ ***
F*******************************************
D*********************************************
T × F *** ********** ***
T × D***** *** ****** *
F × D********* ************************
T × F × D** * **** *
Abbreviations: Experimental factors included treatment (T), facility (F), and depth (D) with their two- and three-way interactions. Buffer pH (BpH), salinity (Salt), sodium adsorption ratio (SAR), phosphorus saturation ratio (PSR), cation exchange capacity (CEC), exchangeable nutrients (ex), base saturation (BS). Symbols indicate significance level: Highly significant, ***, p-values ≤ 0.01; Significant **, 0.01 > p-value ≤ 0.05; Marginally significant, *, 0.05 < p-value ≤ 0.10; Not significant, blanks, p-value > 0.10. Nutrients variables are represented by their elemental symbols or formulas.
Table 5. Significance levels from analysis of covariance (ANCOVA) for soil chemical variables in response to experimental factors (Effect). In these statistical models, facilities are included as a continuous co-variate based on establishment date.
EffectCNNO3PPO4KCaMgFeSMnZnCuBNa
T ***** ** ******
E********* ************** ******
D****** ********************************
T × E--** ** --
T × D--* ** ** *** --
E × D-- **************************--
T × E × D--* ** ** *** --
EffectAlpHBpHC:NSaltSARPSRCECexCaexMgexKexNaexHexAlBS
T *** *** *** ***
E*** ***** * *****************
D*** ************************************
T × E - - -- - -
T × D ** - - -- *- -
E × D*** **-***-******--****-**-
T × E × D ** - - -- *- -
The “-“ indicates that the interactions were removed from the analysis of covariance models for response variables when none of the interactions were significant. Symbols indicate significance level: Highly significant, ***, p-values ≤ 0.01; Significant **, 0.01 > p-value ≤ 0.05; marginally significant, *, 0.05 < p-value ≤ 0.10; Not significant, blanks, p-value > 0.10.
Table 6. Significance levels from ANOVA for soil chemical content in response to experimental factors (Effect).
EffectCNNO3PPO4KCaMgFeSMnZnCuBNaAl
T******* ********** ******
F******** ************************************
T × F ***** **** * **
Experimental factors included treatment (T) and facility (F) and their two-way interaction. Symbols indicate significance level: Highly significant, ***, p ≤ 0.01; Significant **, 0.01 > p ≤ 0.05; Marginally significant, *, 0.05 < p ≤ 0.10; Not significant, blanks, p > 0.10. Nutrients are represented by their elemental symbols or formulas.
Table 7. Significance levels from ANCOVA for soil chemical content in response to experimental factors (Effect).
EffectCNNO3PPO4KCaMgFeSMnZnCuBNaAl
T ****** * ** ******
E****** ********** ***************
T × E--***---*-*****------
Note: The “-“ indicates that the interaction was removed from the analysis of covariance models when it was not significant. Abbreviations: Experimental factors included treatment (T) and facility establishment (E) date as the co-variate, with their two-way interactions. Symbols indicate significance level: Highly significant, ***, p-values ≤ 0.01; Significant **, 0.01 > p-value ≤ 0.05; Marginally significant, *, 0.05 < p-value ≤ 0.10; Not significant, blanks, p-value > 0.10. Nutrients are represented by their elemental symbols or formulas.
Disclaimer/Publisher’s Note: The statements, opinions and data contained in all publications are solely those of the individual author(s) and contributor(s) and not of MDPI and/or the editor(s). MDPI and/or the editor(s) disclaim responsibility for any injury to people or property resulting from any ideas, methods, instructions or products referred to in the content.

