Article

Spatiotemporal Variability of Soil Water Repellency in Urban Parks of Berlin

Institute of Geographical Sciences, Freie Universität Berlin, Malteserstraße 74-100, 12449 Berlin, Germany
*
Author to whom correspondence should be addressed.
Soil Syst. 2025, 9(2), 31; https://doi.org/10.3390/soilsystems9020031
Submission received: 22 January 2025 / Revised: 13 March 2025 / Accepted: 20 March 2025 / Published: 2 April 2025

Abstract

:
Urban green spaces are important components of city spaces that are vulnerable to degradation in soil–water–climate processes. This vulnerability is exacerbated by current climate change and park usage density. This study examines the dynamics of soil water repellency in the topsoils of selected urban parks in Berlin, aiming to assess the relationships between weather conditions, soil water content, and soil water repellency. This study is based on monthly sampled soils from spots originating from three selected parks—Fischtal Park, Stadtpark Steglitz, and Rudolph-Wilde Park—between September 2022 and October 2023; two of the parks are exclusively rainwater fed, and one is irrigated during summer months. For each sample soil, water repellency persistence and severity were analyzed. Time series analysis was conducted including soil water content. In addition, the total organic carbon content (TOC) and sample texture were analyzed. The results show that the rainfall amount, number of dry days, and maximum temperature during different time intervals prior to the sampling date predominantly control the variation in the soil water repellency via the soil water content. Soil water repellency variations observed appear more event-related than monthly or seasonal, as rainfall is evenly distributed through the years without a distinct dry or wet season in Berlin. The non-repellency of the soil samples was usually observed when the associated water content was increased, which is linked to high cumulative rainfall and short dry periods. Low rainfall amounts and long dry periods in summer result in the re-establishment of the soil water repellency, possibly affecting increased runoff generation and soil erosion risk. Spatially, the repellency properties were observed at locations under healthy vegetation cover, while soils located on the upper slope locations and on the pathways lacked repellency characteristics.

1. Introduction

Urban green spaces such as parks and allotments are important components of city spaces as they compensate for built-up and sealed areas. They provide a multitude of benefits that are often taken for granted [1]. Healthy soils in these areas act as a natural filter, removing pollutants from the air and infiltrating water [2]. Urban parks support a diverse range of plants and animals that contribute to a healthy urban environment [3]. Urban parks, gardens, and green spaces provide a much-needed respite from the urban heat island effect [4,5], regulating temperatures and offering cool environs during summer heat [6,7]. Beyond, the benefit of urban green spaces on human well-being is generally recognized [8], as access to green spaces can significantly improve mental health, reduce stress, and even boost cognitive function [8,9,10].
The future of urban parks is under threat [11] as climate change is accelerating soil degradation [12] due to an increase in climatic extreme events including prolonged and more frequent drought periods [13,14,15]. Triggered processes include a reduction in water retention potential [16,17,18]. In addition, prolonged droughts during summer significantly increase the soil water repellency extent and severity, which in turn induces increased surface runoff, thereby increasing soil loss [19,20,21,22,23]. When high-intensity rainfall appears after a long dry spell, the soil water repellency prevents or decreases infiltration and the penetration of rainwater, resulting in induced runoff and erosion [19,23]. All of these processes exacerbate the degradation of urban green spaces, particularly via a decrease in soil fertility, biomass production, and soil moisture content, and they coincide with an increase in soil erosion and nutrient loss [21,24]. The degraded soils lose their ability to support diverse plant life, jeopardizing the complex web of life within urban ecosystems [25,26,27]. This disrupts the vital services that urban green spaces provide, impacting everything from air quality to mental health [28].
Soil water repellency (SWR) refers to soil’s resistance to water infiltration, influencing water distribution and retention and results in soils having reduced water absorption [29,30]. This phenomenon is attributed to soil characteristics such as organic compounds, hydrophobic substances, and microbial activities [29,30,31]. In soil–water dynamics, water distribution refers to the spatial arrangement of water within the soil, which is influenced by texture and structure. Water retention is the soil’s ability to hold water against gravity, impacting plant availability, while water absorption describes the process of water entering the soil via infiltration. Permeability governs the rate of infiltration, and water-holding capacity is the amount of water retained by the soil. These processes are interrelated with soil properties like texture and organic matter playing key roles in determining retention, absorption, and distribution. The causes of soil water repellency encompass plant-derived waxes, decomposed organic matter, and by-products from microbial processes. Environmental implications include diminished water retention capacity, which increases surface runoff and disrupts ecosystem dynamics, impacting plant growth, soil microorganisms, and overall biodiversity [20]. According to [32], water repellency is the state in which the cohesive forces of water molecules are stronger than the adhesive forces between the water molecules and the soil particles, causing the water to ball up at the soil’s surface. This reduction in soil wetting and the retention of water due to hydrophobic soil particle coats is known as soil water repellency [33]. Severity and persistence are two common criteria measured for the determination of soil water repellency. Persistence is the estimated time duration required to break down the repellency characteristic of soil when attached to water [23]. Severity is a measure of soil tension, indicating the strength of the repellency between soil and water [23]. The short-term temporal variation in soil water repellency is primarily influenced by weather conditions like rainfall distribution, the number of successive dry days, and temperature [20,34,35]. On the other hand, the soil organic carbon content [30,36,37,38], soil texture [39], and vegetation covering the soil [40] influence the inherent properties of soil water repellency in the long term [41]. The degree of soil water repellency and the wetting–drying process have a considerable influence on soils’ water retention functions and the unsaturated hydraulic conductivity functions and thus interrupt soil infiltration [42]. During summer, soil water repellency decreases flow beneath the organic layer up to two thirds to less than 30% of the total area of its winter capacity, causing preferential flow. This reduces water storage in the root zone, making it difficult to remoisten during the growth period and lowering the seasonal storage significance of the organic layer [43]. In their research on the influence of soil water repellency on surface runoff, the authors of [44] conclude that the increase in soil water repellency from hydrophilic conditions in winter to extreme water-repellent conditions in summer results in a decrease in infiltration capacity and an increase in surface runoff.
All these interactions between weather, soil water repellency and soil degradation processes emphasize that an effective management of urban greens requires the understanding of factors controlling soil water repellency [45]. The objective of this study is to investigate the dynamics of soil water repellency (in terms of both severity and persistence) and soil water content in the topsoils of selected urban parks in Berlin. Specifically, the study aims to examine how these factors relate to the duration of dry spells, antecedent rainfall patterns, and maximum temperatures recorded over 3- to 28-day periods preceding the sampling dates. The following hypothesis were tested:
  • An increase in soil water content reduces both the persistence and severity of soil water repellency, as hydrophobic compounds become more soluble or are displaced by water films.
  • The persistence and severity of soil water repellency increase with increasing soil organic carbon content (TOC), particularly in topsoils of urban parks in Berlin, due to the accumulation of hydrophobic compounds.
  • The amount and distribution of rainfall control the seasonal dynamics of soil water repellency with prolonged dry periods intensifying repellency and frequent wetting events mitigating it.
  • In the topsoils of urban parks in Berlin, soil water repellency fluctuates with temperature variations, where higher maximum temperatures (e.g., during summer dry spells) enhance the volatilization and subsequent reformation of hydrophobic compounds. This process influences the short-term dynamics of repellency, particularly in response to preceding rainfall patterns and soil moisture conditions.

2. Material and Methods

2.1. Study Area

The Berlin city area spreads over 899 km2 and hosts about 3.8 million inhabitants [46]. While forests (18.3% of the city area) and water (6.7% of the city area) provide extended free space and recreational areas especially in the suburban area, toward the city center, parks and allotments provide green recreational areas [46,47]. The number of public greens and recreational facilities all over Berlin amounts to more than 2500 with a total area of 5246 ha (5.9% of the city area) exclusive of the forest areas [46]. Based on the local population density—which has impact and causes pressure on urban green spaces [48]—we selected three different parks in the southwest of Berlin as case studies to represent varying levels of park use intensity: Fischtal Park for low, Stadtpark Steglitz for intermediate, and Rudolph Wilde Park for high use intensity (Figure 1).
The bedrock underlying all three park areas consists of Pleistocene deposits of glacial, fluvio-glacial or aeolian origin; correspondingly, soil texture is dominated by sandy material with varying portions of silt and clay [49]. According to the WRB classification, the predominant soil types are Luvisols, Podzoluvisols, Cambisols, Dystric Cambisols, Spodo-dystric Cambisols, Podzols, Gleysols, and Histosols. These soils have developed over time under the region’s specific climatic and geological conditions [50].
The overall climate is temperate with Berlin being located in the transition zone between maritime and continental climate. Annual mean precipitation averages ∼ 590 mm and temperature averages 9.5 °C [51]. Annual rainfall is evenly distributed between the seasons with the summers being dominated by high-intensity convectional storms while winters are characterized by low intensity, frontal rain [51].

2.2. Soil Sampling

Prior to soil sampling, a site evaluation was conducted considering the field evidence of visitor pressure, erosion spots, and vitality and cover of vegetation to delineate the soil sampling locations in the selected parks. In total, 44 soil sampling locations assigned to 14 sites—for Fischtal Park (10 ha), we have 5 sampling sites, i.e., F1, F2, F3, F4 and F5; for Stadtpark Stiglitz (13 ha), we have 4 sampling sites, i.e., S1, S2, S3 and S4; and for Rudolph-Wilde Park (7 ha), we have 5 sampling sites, i.e., R1, R2, R3, R4 and R5 and representing various locational conditions such as upper slope position (3 sites), pathway (3 sites), and 38 locations of varying vegetation cover (Table 1).
In Fischtal Park, five sites were selected for sampling: F1—soils located under grass and trees, F2—well-drained soils without waterlogging, F3—diverse soils influenced by pathways and slope dynamics, F4—pathways where compacted bare soil spots appear and F5—soils from upper slope locations with increased erosion dynamics affecting compacted bare soils. The characteristics of the sampling sites in Stadtpark Steglitz were different: S1—high compacted soils under trees, S2—moderate compacted soils under trees, S3—areas covered by bushes with lush vegetation of shrubs support diverse vegetation and S4—the compacted bare soil located on pathways. From Rudolph-Wilde Park, samples were collected from the following: R1—compacted spots on grass patches caused by high foot traffic, R2—compacted spots under trees with poor grass growth, R3—soils located near the pathways and slope, R4—pathways with compacted bare soil spots, and R5—upper slope locations with eroded bare soil spots. The sampling sites of Stadtpark Steglitz and Fischtal-Park receive their water from rainfall exclusively, while in Rudolph-Wilde Park, an irrigation management is implemented providing water to the grass-covered lawns. The sites R1 and R2 in Rudolph Wilde Park feature an automated irrigation system that operates three times per week for 10 min in the early morning. During periods of extreme heat, the watering duration may be extended, or irrigation may occur daily. This system employs retractable sprinklers for automatic watering, specifically covering the sites R1 and R2 (Figure 1b).
Since the soil water repellency is highest in the surface soil and decreases with depth [43,52], we monthly collected soil samples from the topsoil (0–2 cm depth) during the period of September 2022 to October 2023 (nine sampling campaigns). From each sampling site, disturbed soil samples (200 g each) were taken and stored in sealed plastic bags for later lab analysis of samples’ soil water repellency at both field moist (actual) and oven-dried (potential) conditions; duplicated soil samples were stored in the fridge at 4 °C until analysis.

2.3. Soil Water Repellency Analysis

Two tests were used to investigate the soil water repellency: water drop penetration time (WDPT) test [53] and molarity of ethanol droplet (MED) test [54]. The WDPT test and MED test were used to analyze the persistence and severity of soil water repellency in the soil samples. The WDPT’s unit is seconds based, displaying the time of water drop penetration. The MED’s unit is expressed as a percentage (%) based on the concentration of ethanol. The persistence of soil water repellency is the estimated time duration required to breakdown the repellency characteristic of a soil when attached with water. Soil water repellency persistence was measured by dropping 5 drops distilled water (0.05 mL per drop) on a smoothed surface of a soil sample, and the time required for complete penetration (seconds) was recorded as WDPT [54,55]; the WDTP values were classified into five classes following [31] (Table 2). The severity of soil water repellency is a measure of soil tension, indicating the strength of the repellency between soil and water. Soil water repellency severity was measured by dropping ethanol drips with 0, 4, 8, 12, 16, 20, 24, 28, 32 or 36% concentration on the smoothed surface of the soil samples, and the concentration of ethanol (%) that penetrated by 5 s was recorded as an MED test [54]. The degrees or severity of soil water repellency were categorized into five classes (Table 2).
Soil water repellency (both the persistence and the severity) were measured on two different soil samples of the same sampling site in the selected parks: the actual samples which represent field moisture content of the soils and the potential samples where the water content of the soil samples was extracted using an oven at 65 °C for 24 h. Before conducting the WDPTpot test and MEDpot test on the potential soil samples, the water content was extracted, and approximately 100 g of the representatively split soil sample was sieved through 2 mm mesh to ensure uniformity and remove larger particles. This pre-analysis treatment was not conducted on actual soil samples (for WDPTact and MEDact tests). The gravimetric soil water content of the soil samples (approximately 100 g) was measured after 24 h oven-drying of the soil samples at 65 °C. The measured water content as well as measured soil water repellency (at both actual and potential state) of the soil samples were used to separate repellent soils from non-repellent soils. The soils with WDPTact class = 0 or MEDact class = 0 were assigned as non-repellent soil samples.
The dynamics of soil water repellency was ascribed by the proportion of water content at three phases: the wettable lower limit of water content at which the soils are wettable above it, the repellent limit of water content at which the soils became repellent below it, and the transition zone where the soils are wettable or repellent depending on sampling date. To investigate the dynamics of soil water repellency, we calculated the transition zone using the minimum water content of the soils when they were non-repellent and the maximum water content of the soils from the same location when they were repellent. The WDPTact and water content data were used to calculate both the minimum water content of the non-repellent state and maximum water content of the repellent state of the soils from the same location (n = 352).

2.4. Total Organic Carbon and Particle Size Distribution

To analyze the total organic carbon contents (TOC mass-%) and particle size distribution, soil samples were collected from 0–2 cm depth at the 44 sampling sites in the three selected urban green spaces of Berlin in October 2023. We followed the modified method of [56] to prepare the samples for TOC analyses and analyzed the sample suspensions using a Shimadzu TOC-L CPH analyzer (Kyoto, Japan). The particle size distributions of the samples were determined with Beckmann-Coulter LS13 320 laser diffraction particle size analyzers with PIDS according to the procedure described by [56,57]. Prior to the analyses, about 200 mg of the representatively split sample was sieved to receive the < 2 mm fraction [57]. Organic carbon was removed from the samples by adding 30% H2O2 and retaining the samples in a water bath at 50 °C for several days [58]. Two soil samples—R1 and R2 from Rudolph-Wilde Park—had reactions with HCl, and thus their carbonates were removed with 10% HCl [57]. From the prepared sample, two control samples were measured each with three independent runs, and calculated mean values are presented. Exceptionally, the S1 sample from Stadtpark Steglitz was measured once with three independent runs due to the low turbidity and high concentration of sand. Finally, the texture of the soil samples was classified according to USDA standards [59].

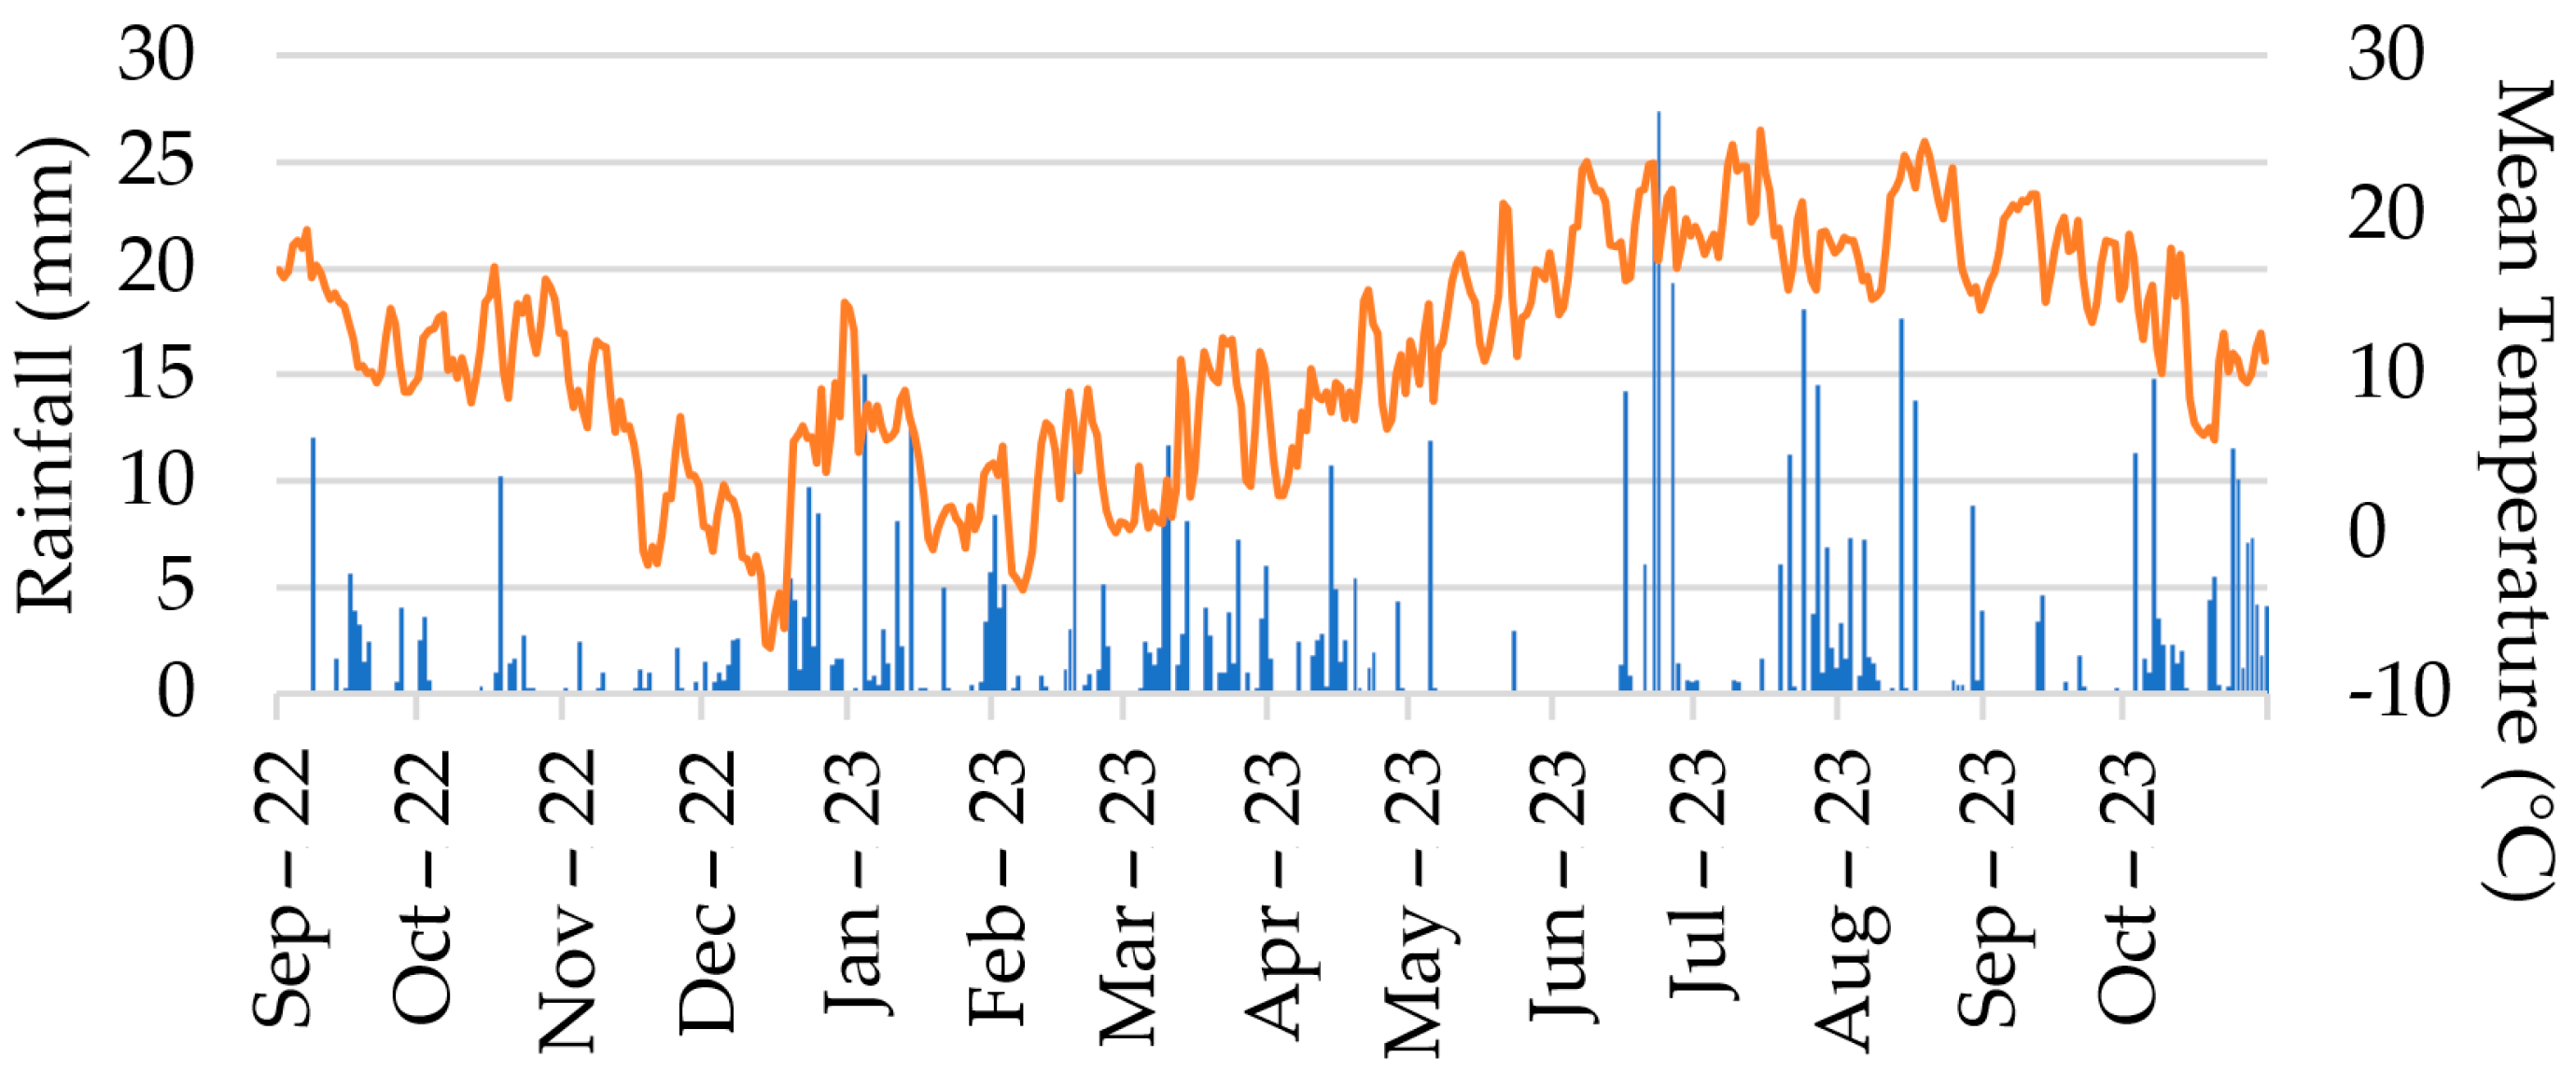
2.5. Antecedent Rainfall, Temperature, and Dry Days

This study employed daily total precipitation and daily maximum air temperature data from the Berlin-Dahlem meteorological station (Station ID: 00403) spanning the time period from September 2022 to October 2023, which were obtained from the German Weather Service [60] (Figure 2). For each sampling date the 3-day, 5-day, 7-day, 14-day, 21-day and 28-day intervals of the measurement periods prior to sampling date were extracted, and for each of these periods, the hydroclimatic metrics, encompassing cumulative rainfall (mm), rainy days (defined as days with rainfall ≥1 mm), and dry days (defined as days with rainfall <1 mm) as well as the length of dry periods (days) were assessed. Additionally, median temperature values for the respective intervals were computed using maximum temperature data.

2.6. Statistical Analysis

Multiple linear regressions were calculated to evaluate the influence of soils’ TOC contents and grain size composition on soil water repellency. Prior to regression analysis, the soil water repellency and data on sand, silt, clay, and TOC contents were log transformed to meet the normality assumption; for the data presentation and for the correlation analysis, the soil water repellency data were classified according to [31,54]. Correlation coefficients were calculated to elucidate the intricate connections between soil water repellency, water content, antecedent rainfall, temperature, and dry days. A Shapiro–Wilk statistical test was employed for checking the normality of the distributions. Since not all the variables followed a normal distribution, the Kruskal–Wallis one-way ANOVA test [61] was employed on WDPTact and MEDact classes as well as the water content of the soil samples to ascertain whether there was a statistically significant relation between sampling dates. A Bonferroni post hoc test was used to compare the monthly sampling sites in pairs to identify which behaved significantly different. The linear association between soil water content (using Pearson’s correlation coefficient), soil water repellency (using Spearman’s correlation coefficient), antecedent rainfall amounts, antecedent number of dry days, and antecedent maximum temperatures was evaluated at a significance level of p < 0.05. Paired t-tests were used to compare the severity (MED) and persistence (WDPT) of soil water repellency among sampling sites, where the significance level was set to 0.05. The statistical analysis was carried out using R Studio (Version 4.3.0.) [62], SPSS (Version 25) [63] and DataTab [64].

3. Results

3.1. Soils’ Water Repellency and Water Content

The persistence of the soil water repellency of the soil samples varied between wettable and extreme depending on the sampling date. Temporally, soils were non-repellent (WDPTact class = 0) in October 2022, August 2023, and October 2023. Beyond, at all sampling sites, soils were repellent (WDPTact class ≥ 1) in September 2022, June 2023, and September 2023 (Figure 3a). In general, at all sampling sites, also the water content of the soil samples was higher in October 2022, August 2023, and October 2023 than in September 2022, June 2023, and September 2023 (Figure 3c).
Figure 3. Time series of soil water conditions and weather conditions in the period prior to sampling for the urban park study sites at (A) Fischtal Park, (B) Stadtpark Steglitz and (C) Rudolph-Wilde Park: the temporal distribution of (a) soil water repellency persistence (WDPTact), (b) soil water repellency severity (MEDact) and (c) water content across the soil sampling date, and associated (d) dry days, (e) rainy days, and (f) cumulative rainfall for the 3-, 5-, 7-, 14-, 21- and 28-day periods before sampling date at Dahlem-Berlin station (after [60]).
Soilsystems 09 00031 g003

3.2. Soils’ Total Organic Carbon Content and Particle Size Distribution

The total organic carbon content (TOC) of the soil samples ranged 1.3–10.1 mass-% (n = 44, µ = 4.5, std. = 1.8). In Fischtal-Park at site F2, the soil samples’ TOC content ranged 4.5–5.8 mass-% (n = 5, µ = 5.2, std. = 0.6). In the Rudolph-Wilde Park, the TOC contents amounted to 6–7.4 mass-% (n = 3, µ = 6.7, std. = 0.7) at site R3, while the TOC contents of soil samples from site R1, being located under the bare spots affected by trampling, amounted to 3.1–4 mass-% (n = 4, µ = 3.6, std. = 0.4). At the site S1 of the Stadtpark Steglitz (soils under trees, compacted soils with bare spots), the TOC contents ranged 2–5 mass-% (n = 6, µ = 3.2, std. = 1.1) (Table 3).
The particle size distribution of the soil samples extracted from the three park areas had sand fractions ranging from 47.1 vol.-% to 95.2 vol.-% (n = 44, µ = 75.3, std. = 0.1). The silt content of the soil samples ranged 1.3–12.3 vol.-% (n = 44, µ = 19.7, std. = 0.1), the clay fraction 3.5–40.6 vol.-% (n = 44, µ = 5.2, std. = 0.02). Based on USDA soil texture classification [54], soil samples from 42 out of total 44 sampling sites were classified as sandy loam or loamy sand; the remaining two samples originating from Fischtal-Park were classified as loam and sand (Table 3).

3.3. Relation Between TOC Content and Soil Particle Size Distribution to Soil Water Repellency

The relationship between total organic carbon content (TOC) and particle size distribution (sand, silt, and clay fractions) to soil water repellency parameters (WDPTpot and MEDpot) is summarized in Table 4 and Table 5. The regression analysis of WDPTpot reveals that the model, incorporating predictors including contents of TOC, sand, silt, and clay, explains 26.1% (R2 = 0.261, n = 43) of the variance in WDPTpot. The overall model is statistically significant (n = 43, F = 3.4, p = 0.017), indicating the influence of at least one predictor on WDPTpot (Table 4). Specifically, TOC content allows to significantly predict WDPTpot (B = 2.4, p = 0.002); also, clay content shows a significant positive effect on WDPTpot prediction (B = 3.1, p = 0.335). The samples’ sand and silt contents did not significantly contribute to predicting WDPTpot (p > 0.05).
The regression model for the analysis of the MEDpot to different soil characters indicates that 36.1% of the variance in MEDpot is explained by the samples’ content of TOC, sand, silt, and clay (R = 0.6, Adj. R = 0.296, SEE = 0.3287, n = 43). The model is significant (F = 5.5, p = 0.001), showing that these predictors contribute to predicting MEDpot (Table 5).

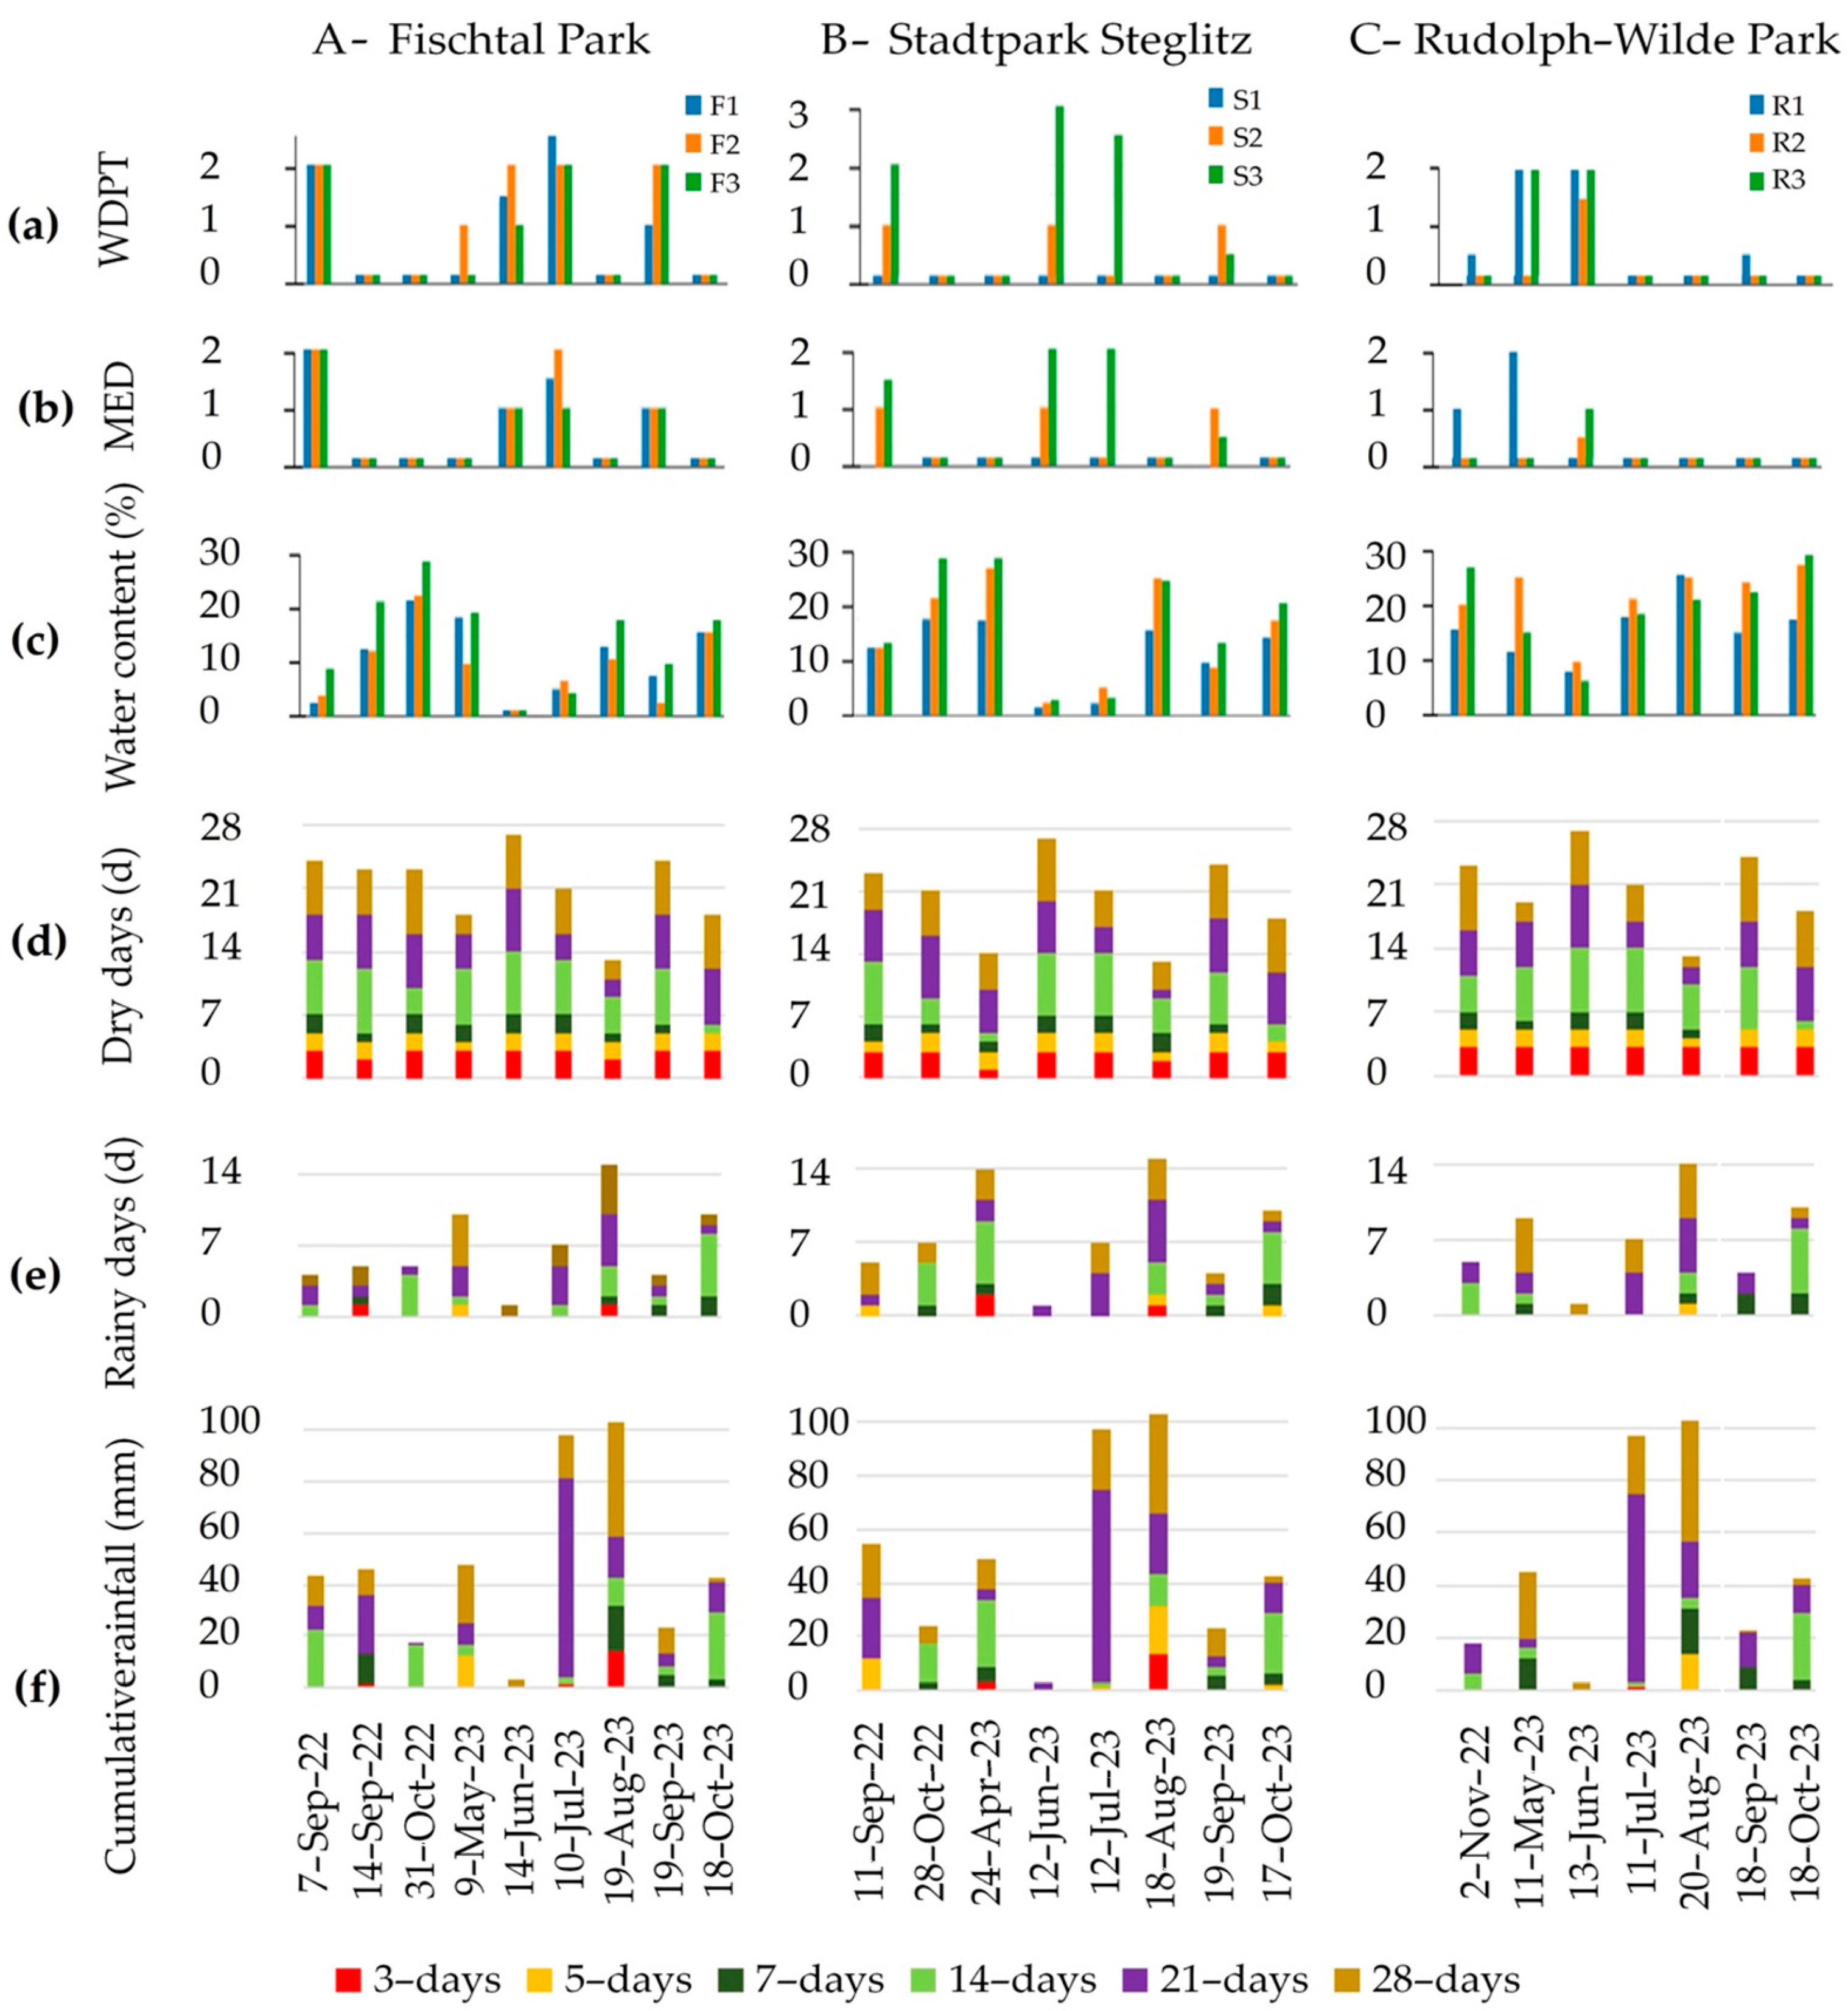
3.4. Spatiotemporal Variations of Soil Water Repellency and Soil Water Content

During the observation period from September 2022 until October 2023, daily rainfall ranged at the Berlin-Dahlem meteorological station between 0 and 27.4 mm (n = 550, µ = 1.6, std. = 3.5) and mean temperature ranged between −7.2 and 27.9 °C (n = 550, µ = 12.6, std. = 7.2) [60] (Figure 2).
Rainfall data for the 28-day periods prior to the sampling dates show fluctuating levels: June 2023 had the lowest antecedent cumulative rainfall with 3 mm, increasing to 97 mm in July 2023 and peaking at 103 mm in August 2023. For the sampling date of September 2023, cumulative rainfall in the 28 days antecedent to sampling amounted to 23 mm and 43 mm for the sampling date in October 2023. The distribution of rainfall during the 28-day period antecedent to the sampling days was uneven; for example, despite the overall high rainfall of 97 mm for the July 2023 sampling date, only 1.1 mm rainfall did fall immediately within 3 days before the sampling date, and 1.7 mm rainfall did fall during the 11 days before the sampling date. The temporal distribution of the number of rainy days (Figure 3e) and the rainfall amount (Figure 3f) at Dahlem-Berlin station for the 3-, 5-, 7-, 14-, 21- and 28-day periods antecedent to the sampling date is displayed in Figure 3.
Dry days were notable during the study period with June 2023 experiencing the longest duration of dry days, counting 27 days without rainfall. July 2023 followed with 21 dry days, while August 2023 had only 13 dry days. For September 2023, 24 dry days were counted, and 18 dry days were counted for October 2023 (Figure 3d).
The spatiotemporal variations of soil water repellency persistence (WDPTact) (Figure 3a), soil water repellency severity (MEDact) (Figure 3b) and water content are displayed in Figure 3. Spatially, during the entire sampling period, the soil water repellency of soils sampled from Fischtal Park was higher than that in the samples from the other two study areas, and that from the samples from Rudolph Wilde Park was lower than those in the other two study areas. The actual soil water repellency was generally low in soils from upper slope locations and from the pathways, and it was high from soils located under dense vegetation cover.
The soils sampled from site S1 (Stadtpark Steglitz), a location characterized by extremely low vegetation cover to bare soil, were wettable during most of the sampling campaigns except for the sampling dates of June and July 2023. Soils extracted from upper slope positions and from the pathways of all three parks were non-repellent most of the time. The actual soil water repellency persistence was as high as extreme repellent (WDPTact class = 3) in soil beneath the lawn (site S3 in Stadtpark Steglitz) during June and July 2023 (Figure 3a).
The severity of soil water repellency was hydrophilic (MEDact class = 0) in all soil samples taken in October 2022 (n = 44) and April 2023 (n = 14). The degree of repellency in all samples starts to increase starting from May 2023 (n = 44) and peaks in June 2023 (n = 44), reaching the extremely repellent class (class 3), and it continues in high levels of repellency in July 2023 (n = 44). In August 2023, it again dropped to wettable conditions (n = 44). In due course, there occurred another increase of repellency properties in September 2023 (n = 44) which then broke down to the non-repellent states in October 2023 (n = 44). Temporally, the severity of soil water repellency in Stadtpark Steglitz and Rudolph-Wilde Park highly fluctuated, increasing between May and July 2023, decreasing from July to September 2023 and dropping to class 0 (non-repellent) in October 2023 (Figure 3b).
All over the observation period, the water content of the soil samples taken from Fischtal-Park ranged between 0.2 and 38 mass-% (n = 135, µ = 10, std. = 8.6), being comparable to those of the soil samples taken from Stadtpark Steglitz (0.5–33.5 mass-%; n = 112; µ = 12.9, std. = 8.5) and Rudolph-Wilde Park (1.7–38 mass-%; n = 105, µ = 18.3, std. = 9.1). Temporally, the water content of the soil samples was overall highest during October 2022 (µ = 21.0 mass-%, n = 27, std. = 6), November (µ = 22.0 mass-%, n = 15, std. = 7) and April 2023 (µ = 21.6 mass-%, n = 14, std. = 6.8), and it showed the lowest levels in June 2023 (µ = 3.5 mass-%, n = 43, std. = 4.3) and July 2023 (µ = 8.7 mass-%, n = 44, std. = 7.7) (Figure 3c).
The potential soil water repellency (WDPTpot and MEDpot) of the soil samples was higher than that of the actual soil water repellency (WDPTact and MEDact) at almost all locations, while its spatial distribution followed the same patterns as actual soil water repellency (Figure 4 and Figure 5). The maximum potential of soil water repellency was severely repellent (WDPTpot class = 3) in soil samples of the Rudolph-Wilde Park at sites R1 and R2 in September 2023 (n = 2). The maximum potential of soil water repellency was extremely repellent (WDPTpot class = 4) in the soil samples of Fischtal Park at site F1 in July 2023 (n = 1) and September 2023 (n = 2), at site F2 in September 2023 (n = 1) and October 2023 (n = 1), and at site F3 in September 2023 (n = 1). Also, the soil samples of the Stadtpark Steglitz at site S2 and site S3 in September 2023 (n = 2) showed extremely repellent characteristics (WDPTpot class = 4). The potential soil water repellency was non-repellent (WDPTpot class = 0) in 68 (n = 68) and showed no repellency characters even after 24 h of oven drying at 65 ° C. These soil samples are located in Stadtpark Steglitz at site S1 (n = 29; highly compacted bare spots location), site S2 (n = 5; compacted locations), and site S4 (n = 7; pathways location), in Fischtal-Park at site F4: (n = 9; pathways location) and site F5 (n = 8; upslope position); and in Rudolph-Wilde Park at site R3 (n = 1), site R4 (n = 4; pathway location) and site R5 (n = 5; upslope location) (Figure 4 and Figure 5).
The results of the one-way ANOVA test for the water content and the results of the Kruskal–Wallis test for WDPTact and MEDact classes along with the Bonferroni post hoc test show that there are significant differences between the sampling dates in which soils were repellent (September 2022, May 2023, June 2023, July 2023 and September 2023) and the sampling dates of October 2022, November 2022, April 2023, August 2023 and October 2023 in which the soils were non-repellent (see Appendix A). According to the variable WDPTact classes, the sampling site F2 is significantly different (Kruskal–Wallis test, p < 0.05) from the sampling sites F5, R2, R5 and S1 (see Appendix B). Considering the water content of the soil samples, the differences of sampling site S1 from sites R2 and R3 is significant (one-way ANOVA test, p < 0.05).

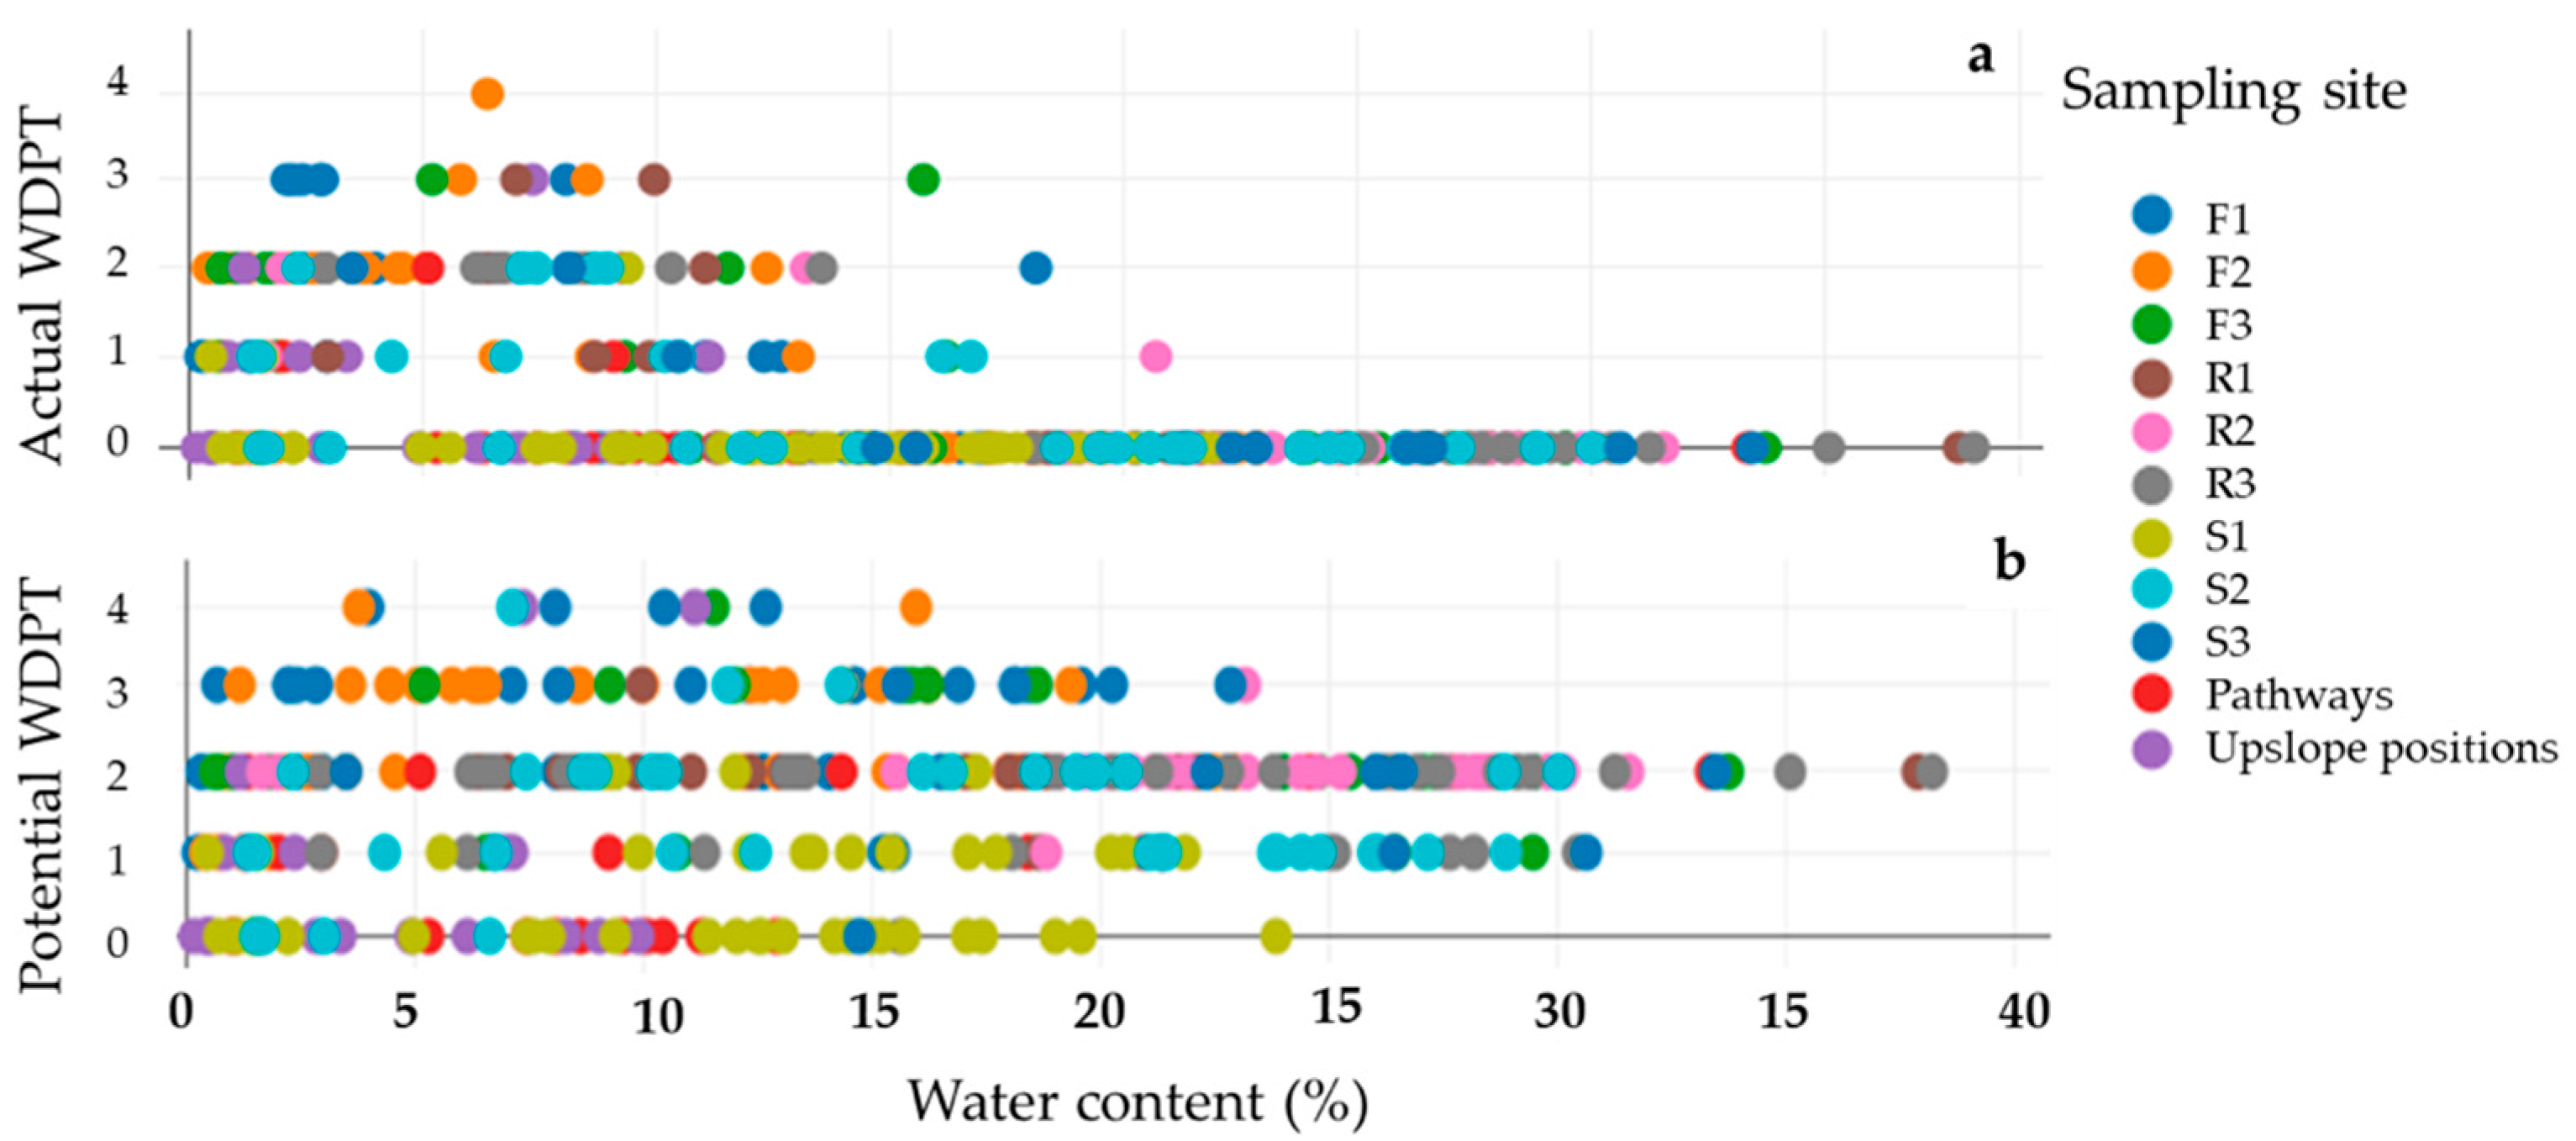
3.5. Dynamics of Soil Water Repellency and Its Interaction with Water Content

The transition zone of the soil samples, the range of water content where soils are either wettable or repellent, varies locally depending on the sampling site and the sampling date. The transition zone of site F1/Fischtal Park ranged 6.7–14.6 mass -% water content (n = 36). The collected soil samples from selected parks showed non-repellent characteristics when the water content was more than 15 mass-% (n = 146). Some soil samples with a water content of 15 mass-% or more (n = 6) showed repellent characteristics; these samples were collected from Stadtpark Steglitz (n = 3), Fischtal Park (n = 2), and Rudolph-Wilde Park (n = 1). The samples with less than 15 mass-% water content (n= 198) showed in almost half of the cases non-repellent characteristics (n = 91) and repellent characteristics in the remaining cases (n = 107) (Figure 6). In comparison to the samples originating from sites covered by vegetation, the soil samples originating from compacted or eroded sites such as being under the influence of intense trampling tend to have shorter transition zones and lower water content levels (Figure 6).

3.6. The Correlation Between Soil Water Repellency, Water Content and Weather

Spearman’s rank correlation test was applied to analyze the relationships between the soil samples’ water content and the persistence and severity of soil water repellency at both actual (WDPTact, MEDact) and potential (WDPTpot and MEDpot) conditions (Table 6). The WDPTact of the soil samples significantly correlated with MEDact (r = 0.58 to 1; p < 0.01, n = 305). The water content of the soil samples (excluding samples of the site S1, n = 48) significantly correlated with the WDPTact (from r = −0.52 at sampling site S2 to r = −0.85 at site S3, n = 257) and MEDact (r = −0.48 at sampling site R2 to r = −0.76 at sampling site F1, n = 257) of the same samples (Table 6). Soil samples originating from compacted or eroded sites were predominantly non-repellent (Figure 5 and Figure 6). The predominantly non-repellent soil samples (n = 68) were not included in the correlation analysis.
There was no significant correlation observable between the samples’ potential soil water repellency and the weather factors (dry days, precipitation antecedent to sampling, temperature), while a significant correlation between samples’ actual soil water repellency and different weather factors could be observed (n = 305): The antecedent rainfall over a 14-day period prior to sampling date significantly correlated with samples’ WDPTact (r = −0.83, n = 16, p < 0.01) and MEDact (r = −0.75, n = 16, p < 0.01) at the Stadtpark-Steglitz site S3 (n = 16). The correlation of the median temperature (for different antecedent periods to the sampling date) with samples’ WDPTact and MEDact varied locally. When comparing different time periods, we found that the median of the maximum temperature over a 28-day period (antecedent to sampling date) showed the strongest correlation coefficients to the soil samples’ MEDact and WDPTact, The correlation coefficients of 28-day temperature are 0.73 (n = 36, p < 0.01) with MEDact and 0.72 (n = 36, p < 0.01) with WDPTact at the site F1/Fischtal-Park (n = 36). The total number of dry days (days with rainfall < 1 mm) over a 21-day period prior to sampling date significantly correlates with the samples’ WDPTact (r = −0.65, n = 34, p < 0.01) and MEDact (r = −0.55, n = 34, p < 0.01) at R3/Rudolph-Wilde Park (Table 7 and Table 8).

3.7. Relation Between Samples’ Water Content to the Occurrence of Dry Days, Temperature, and Rainfall Antecedent to the Sampling

Comparing weather data of the different time periods antecedent to the sampling dates with water content of the topsoils, the highest and most significant correlation coefficients observed are those for the cumulative rainfall data of the 14 days period preceding sampling at all of the sampling sites (Table 9). The correlation between soil samples’ water content and temperature was significantly correlated for most of the sampling sites except for the Rudolph-Wilde Park sites R1 and site R2 (p > 0.05, n = 56). The number of dry days of the 21-day period preceding the sampling date was significantly correlated to soil moisture for most of the sampling sites except for the Fischtal-Park site F3 (n = 27, r = −0.37, p > 0.05).

4. Discussion

4.1. Spatiotemporal Changes in Soil Water Repellency

The findings indicate significant spatiotemporal variations in soil water repellency depending on the site characteristics and sampling date as well as the related antecedent weather conditions. Data clearly document a close inverse relationship of soil water repellency to rainfall and soil moisture in the days antecedent to the sampling date [65]. The frequent occurrence of wetting and drying events as it is common under the temperatures of continental climate is associated with seasonal changes of soil water repellency [52]. In the selected urban parks of Berlin, soil water repellency variations appear more event-related than monthly or seasonal, because rainfall is evenly distributed throughout the year without a distinct dry or wet season [51]. Specific sampling months exhibiting dry (September 2022, May 2023, June 2023, July 2023 and September 2023) or wet (October 2022, November 2022, April 2023, August 2023 and October 2023) characters are attributable to the general weather conditions. However, the results of previous research [35,65] show variations of soil water repellency mainly to distinct dry and wet seasonal attributes.
Depending on the antecedent weather conditions and the site characteristics, the soil water repellency class of the urban park soils varies; these variations are comparable to the findings reported for forest soils [43] and vegetation-free soils in Berlin [44]. The soil samples lacking repellent characters (always with penetration time <5 s) were located on eroded, compacted or bare soil areas, which were characterized also by degraded vegetation cover and corresponding low TOC contents of these soils [30,66]. Our results are consistent with the findings of [44] conducted on vegetation-free plots of different substrates in Berlin. In contrast, repellent soils sampled underneath healthy vegetation and only slightly compacted surface had higher soil water repellency values than soils located on eroded, compacted or bare soil areas; these findings are consistent with the results reported for forest soils of Grunewald in Berlin [43].
Varying water content in the transition zone has been repeatedly reported [43,52,67,68,69,70,71], which is a finding that might be due to the quality and quantity of the TOC content of the soil as it might hold hydrophobic compounds [72]. Positive relationships between TOC and soil water repellency were confirmed by many authors [66,73,74,75]. Sampled soils with TOC more than 4% were repellent, which agrees with the results of Kawamoto [66] and [30]. Beyond, the transition zone of the sampled soils is narrow in soils with a short range of TOC content (Site F1 TOC ranges 3.5 to 6) and wide in site F3 soils containing a long range of TOC content (1.7 to 10.1). Our results are consistent with the findings of [68]. In addition, the influence of vegetation cover and the impact of soil compaction on the soil water content and formation of the transition zones are highly evident [76,77,78,79,80]. Soils sampled from sites with poor or lacking vegetation cover and originating from sites being characterized either by active soil erosion or strong soil compaction have shorter transition zones and associated lower water content levels than soils under healthy vegetation.
Temporally, the soil has more potential to increase the water repellency level in summer than in winter [34,35]. During winter months due to the low temperatures, short day duration and dormancy, the water content of the soils evapotranspirates slowly, thus causing a slow transition of the soils from wettable status to repellent status [34,35]. In contrast, during summer, the high temperatures are exacerbated by the long duration of the days and growing season, and the associated evapotranspiration is high [20]. Thus, in case of dry periods, the soil reaches its maximum repellency such as that documented for June 2023, and the required time for the rainwater to penetrate the soil is increasing depending on the repellency level [34]. As soon as rainfall appears after such a dry spell, soils become wettable again; after rainfall ceases, coming along with the loss of soil water via evapotranspiration, repellency again reappears [20,34,81]. The authors of [81] observed a rapid transition of soils from wettable to repellent states, predominantly persisting in a repellent state during summer. They noted that soil repellency can be reinstated within one week under hot and dry weather conditions. This susceptibility of soils can significantly impact processes such as infiltration, runoff generation, and subsequently soil erosion [72,82,83,84,85].

4.2. Factors Controlling Soil Water Repellency

The changes in soil water repellency over time are mainly influenced by weather conditions like the amount and pattern of rainfall, the number of dry days, and the maximum temperatures in the period antecedent to the sampling date. These factors affect how much water evaporates from the soil, which in turn determines the soil’s moisture level [20,34,35]. However, soil organic carbon [30,36,37,38], soil texture [39] and vegetation cover [40] influence the inherent properties of soil water repellency [41]. When soil water content decreases below a critical level, the hydrophobic compounds coat the soil particles and affect that the soil becomes repellent to water [36]. In the urban parks of Berlin, direct rainfall is the major source of water to the vegetation. In consequence, soils’ water content is directly controlled by rainfall and thus also soil water repellency dynamics [29,30,34]. The temporal distribution and the magnitude of total rainfall during the 3- to 28-day time intervals prior to the sampling date, along with the maximum temperature across various time scales, directly influenced soils’ water content and soil water repellency [34]. The correlation between antecedent rainfall, water content and soil water repellency (both WDPTact, MEDact) was found to be significant after a 14-day period, because the repellency is re-established after 7 to 9 consecutive dry days [35,81]. In contrast, rainfall within 10 days before sampling can break down the repellency of the soils (e.g., sampling date: May 2023) [35,81].
The correlations of maximum temperature (Tmax) with soils’ MEDact, WDPTact and water content in Fischtal-Park and Stadtpark Steglitz increase the longer the time period prior to the sampling date used to average the daily maximum temperatures is [34]. However, in Rudolph-Wilde Park, summer irrigation management leads to no significant correlation between maximum temperature, soil water repellency, and soil water content. This is likely because regular summer irrigation increases the water content of the soil that results in reduced soil’s repellent properties. Consequently, the samples collected during summer show a weak and insignificant correlation between maximum temperature and soil water repellency.
The parks’ user activities are concentrated on pathways, playing fields, and community-gathering spots like picnic areas. These areas experience more frequent and intense foot traffic, which compacts the soil, decreases soil infiltration and results in induced runoff and soil erosion [86]. Additionally, the deposition of organic matter and other residues from human activities further exacerbate soil water repellency [87,88]. The soils’ organic carbon content (TOC) influences the soil water repellency, as we could point out that soils with TOC of more than 4 mass % were repellent, and these findings are in agreement with the results of [30,66]. This pattern negatively affects several crucial ecosystem services, including rainwater infiltration, groundwater recharge, and vegetation health [89,90].

5. Conclusions

This study investigated the dynamics of soil water repellency, focusing on its severity and persistence, and the relationship with soil water content in the topsoils of urban parks in Berlin. The analysis revealed that the persistence and severity of soil water repellency are strongly influenced by soil water content, organic carbon content (TOC), antecedent rainfall patterns, and temperature fluctuations.
Increased soil water content was found to reduce both the persistence and severity of soil water repellency. As moisture levels rise, hydrophobic compounds become more soluble or are displaced by water films, effectively reducing repellency. This effect was particularly noticeable after rainfall events, where higher soil moisture led to a significant decrease in hydrophobicity.
The results also demonstrate that higher TOC content intensifies soil water repellency. Soils with elevated organic carbon showed increased repellency, which is likely attributable to the accumulation of hydrophobic compounds derived from plant roots and microbial activity. This relationship underscores the role of organic matter in modulating hydrophobicity in urban park soils.
Rainfall distribution and the frequency of wetting events were identified as key factors in the seasonal dynamics of soil water repellency. Prolonged dry periods significantly enhanced repellency, while more frequent wetting events helped to reduce it. These findings highlight the critical role of rainfall patterns in governing the temporal variability of soil water repellency with dry spells exacerbating hydrophobic conditions and wetting events providing relief.
Temperature fluctuations also influenced soil water repellency although to a lesser extent than moisture content and organic carbon. Elevated temperatures were observed to enhance the volatilization and reformation of hydrophobic compounds, contributing to temporal changes in repellency. However, moisture levels and organic carbon were more significant in driving the persistence and severity of repellency than temperature alone.

Author Contributions

Conceptualization, E.R. and B.S.; methodology, E.R.; software, E.R.; validation, S.M., E.R. and B.S.; formal analysis, E.R.; investigation, E.R. and S.M.; data curation, E.R.; writing—original draft preparation, E.R.; writing—review and editing, E.R., S.M. and B.S.; visualization, E.R.; supervision, B.S. and S.M.; project administration, B.S. All authors have read and agreed to the published version of the manuscript.

Funding

This research was part of a PhD scholarship (EH) supported by the German Academic Exchange Service (DAAD). The research was also supported by the Einstein Research Unit (ERU) CliWaC—Climate and Water under Change and funded by the Einstein Foundation Berlin and the Berlin University Alliance. The Article Processing Charges (APC) were funded by Freie Universität Berlin’s Open Access fund.

Data Availability Statement

The data supporting the findings of the study are available from the corresponding author upon reasonable request.

Acknowledgments

We acknowledge the support of Moritz Nykamp and Michaela Scholz (Freie Universität Berlin, Germany) with the method development, sample preparation, and measurements and acknowledge the support of Mohammad Dawude Temory (Justus-Liebig-Universität Gießen, Germany) with the statistical analysis of data. We appreciate the help of Lena Schimmel and Robert Busch (Freie Universität Berlin, Germany) for data collection and data sharing. The daily rainfall and temperature data was accessed from German Meteorological Service (DWD) website https://opendata.dwd.de/climate_environment/CDC/observations_germany/climate/daily/more_precip/recent/ (accessed on 15 November 2023).

Conflicts of Interest

The authors declare no conflicts of interest.

Appendix A

Table A1. Significant differences in WDPTact classes and MEDact classes (Kruskal–Wallis test, p < 0.05), and water content (one-way ANOVA, p < 0.05) across different soil sampling dates. Sampling dates were categorized into wet periods, when soils exhibited non-repellent characteristics, and dry periods, when soils displayed repellent properties. Dry sampling dates include D1 to D5, and wet sampling dates include W1 to W5.
Sampling DateWDPTactMEDactWater Content
Significantly Different from the Sampling Date of:
Dry sampling date (d)
September 2022 (d1)w1, w3, w4, w5w1, w3, w4, w5w1, w2, w3, w4, w5, d3
May 2023 (d2)w1, w3, w4, w5w1, w4, w5d3, d4
June 2023 (d3)w1, w2, w3, w4, w5w1, w2, w3, w4, w5w1, w2, w3, w4, w5, d1, d2, d5
July 2023 (d4)w1, w4, w5w1, w4, w5w1, w2, w3, w4, w5, d2
September 2023 (d5)w1, w4, w5w1, w4, w5w1, w2, w3, w4, w5
Wet sampling date (w)
October 2022 (w1)d1, d2, d3, d4, d5d1, d2, d3, d4, d5d1, d3, d4, d5
November 2022 (w2)d3d3d1, d3, d4, d5
April 2023 (w3)d1, d2, d3d1, d3d1, d3, d4, d5
August 2023 (w4)d1, d2, d3, d4, d5d1, d2, d3, d4, d5d1, d3, d4, d5
October 2023 (w5)d1, d2, d3, d4, d5d1, d2, d3, d4, d5d1, d3, d4, d5

Appendix B

Table A2. Differences in WDPTact classes and MEDact classes (Kruskal–Wallis test, p < 0.05) and water content (one-way ANOVA test, p < 0.05) of the soils across different sampling sites.
Soil Sampling SiteWDPTactMEDactWater Content
Significantly Different from the Sampling Site of:
S1F1, F2, F3F1, F2, F3R2, R3
F2S1, R2, F5, R5,R2R2, R3
R2F2F2S1, S2, F1, F2, F3, F4, R4, F5, R5,
R3--S1, F1, F2, F4, R4, F5, R5,
F4 and R4--S2, S3, F3, R1, R2, R3

References

  1. Angelo, H. How Green Became Good: Urbanized Nature and the Making of Cities and Citizens; University of Chicago Press: Chicago, IL, USA, 2021. [Google Scholar]
  2. Pereira, P.; Inácio, M.; Karnauskaitė, D.; Bogdzevič, K.; Gomes, E.; Kalinauskas, M.; Barcelo, D. Nature-based solutions impact on urban environment chemistry: Air, soil, and water. In Nature-Based Solutions for Flood Mitigation: Environmental and Socio-Economic Aspects; Pereira, P., Ed.; Springer: Cham, Switzerland, 2021; pp. 79–137. [Google Scholar]
  3. Sadler, J.; Bates, A.D.; Hale, J.A.; James, P.H. Bringing cities alive: The importance of urban green spaces for people and biodiversity. In Urban Ecology; Sadler, J., Bates, A.D., Hale, J.A., James, P.H., Eds.; Springer: Dordrecht, The Netherlands, 2010; pp. 230–260. [Google Scholar]
  4. Elderbrock, E.M. No Walk in the Park: Urban Green Space Planning for Health Equity and Environmental Justice. Doctoral Dissertation, University of Oregon, Eugene, OR, USA, 2023. [Google Scholar]
  5. Khanna, R.; Gahletia, S.; Prusty, A. Improving urban health in India: Promising solutions for rapid urbanization. Int. J. Sustain. Infrastruct. Cities Soc. 2023, 8, 22–37. [Google Scholar]
  6. Koriesh, E.M.; Abo-Soud, I.H. Facing climate change: Urban gardening and sustainable agriculture. In Climate Change Impacts on Agriculture and Food Security in Egypt: Land and Water Resources—Smart Farming—Livestock, Fishery, and Aquaculture; Koriesh, E.M., Abo-Soud, I.H., Eds.; Springer: Cham, Switzerland, 2020; pp. 345–419. [Google Scholar]
  7. Al-Kodmany, K. Greenery-covered tall buildings: A review. Buildings 2023, 13, 2362. [Google Scholar] [CrossRef]
  8. Reyes-Riveros, R.; Altamirano, A.; De La Barrera, F.; Rozas-Vásquez, D.; Vieli, L.; Meli, P. Linking public urban green spaces and human well-being: A systematic review. Urban For. Urban Green. 2021, 61, 127105. [Google Scholar]
  9. Enssle, F.; Kabisch, N. Urban green spaces for the social interaction, health, and well-being of older people—An integrated view of urban ecosystem services and socio-environmental justice. Environ. Sci. Policy 2020, 109, 36–44. [Google Scholar]
  10. Palliwoda, J.; Priess, J.A. What do people value in urban green? Linking characteristics of urban green spaces to users’ perceptions of nature benefits, disturbances, and disservices. Ecol. Soc. 2021, 26, 28. [Google Scholar] [CrossRef]
  11. Colding, J.; Gren, Å.; Barthel, S. The incremental demise of urban green spaces. Land 2020, 9, 162. [Google Scholar] [CrossRef]
  12. Upadhyay, R.K. Markers for global climate change and its impact on social, biological, and ecological systems: A review. Am. J. Clim. Change 2020, 9, 159. [Google Scholar]
  13. Strzepek, K.; Yohe, G.; Neumann, J.; Boehlert, B. Characterizing changes in drought risk for the United States from climate change. Environ. Res. Lett. 2010, 5, 044012. [Google Scholar]
  14. Kim, C.J.; Park, M.J.; Lee, J.H. Analysis of climate change impacts on the spatial and frequency patterns of drought using a potential drought hazard mapping approach. Int. J. Climatol. 2014, 34, 61–80. [Google Scholar]
  15. Bouabdelli, S.; Zeroual, A.; Meddi, M.; Assani, A. Impact of temperature on agricultural drought occurrence under the effects of climate change. Theor. Appl. Climatol. 2022, 148, 191–209. [Google Scholar]
  16. Lal, R. Restoring soil quality to mitigate soil degradation. Sustainability 2015, 7, 5875–5895. [Google Scholar] [CrossRef]
  17. Menzies Pluer, E.G.; Schneider, R.L.; Morreale, S.J.; Liebig, M.A.; Li, J.; Li, C.X.; Walter, M.T. Returning degraded soils to productivity: An examination of the potential of coarse woody amendments for improved water retention and nutrient holding capacity. Water Air Soil Pollut. 2020, 231, 15. [Google Scholar] [CrossRef]
  18. Liu, S.; Lei, Y.; Zhao, J.; Yu, S.; Wang, L. Research on ecosystem services of water conservation and soil retention: A bibliometric analysis. Environ. Sci. Pollut. Res. 2021, 28, 2995–3007. [Google Scholar]
  19. Lowe, M.A.; McGrath, G.; Leopold, M. The impact of soil water repellency and slope upon runoff and erosion. Soil Tillage Res. 2021, 205, 104756. [Google Scholar] [CrossRef]
  20. Sandor, R.; Iovino, M.; Lichner, L.; Alagna, V.; Forster, D.; Fraser, M.; Fodor, N. Impact of climate, soil properties, and grassland cover on soil water repellency. Geoderma 2021, 383, 114780. [Google Scholar] [CrossRef]
  21. Müller, K.; Mason, K.; Strozzi, A.G.; Simpson, R.; Komatsu, T.; Kawamoto, K.; Clothier, B. Runoff and nutrient loss from a water-repellent soil. Geoderma 2018, 322, 28–37. [Google Scholar] [CrossRef]
  22. Ruthrof, K.X.; Hopkins, A.J.; Danks, M.; O’Hara, G.; Bell, R.; Standish, R.; Tibbett, M.; Howieson, J.; Burgess, T.; Harper, R. Rethinking soil water repellency and its management. Plant Ecol. 2019, 220, 977–984. [Google Scholar] [CrossRef]
  23. Zavala, L.M.; González, F.A.; Jordán, A. Intensity and persistence of water repellency in relation to vegetation types and soil parameters in Mediterranean SW Spain. Geoderma 2009, 152, 361–374. [Google Scholar] [CrossRef]
  24. Rhodes, C.J. Soil erosion, climate change and global food security: Challenges and strategies. Sci. Prog. 2014, 97, 97–153. [Google Scholar] [CrossRef]
  25. Ooi, Q.E.; Nguyen, C.T.T.; Laloo, A.; Bandla, A.; Swarup, S. Urban soil microbiome functions and their linkages with ecosystem services. In Soils in Urban Ecosystem; Springer Singapore: Singapore, 2022; pp. 47–63. [Google Scholar]
  26. Rate, A.W. Urban ecosystems: Soils and the rise and fall of cities. In Urban Soils: Principles and Practice; Springer: Singapore, 2022; pp. 1–15. [Google Scholar]
  27. Pedrinho, A.; Mendes, L.W.; de Araujo Pereira, A.P.; Araujo, A.S.F.; Vaishnav, A.; Karpouzas, D.G.; Singh, B.K. Soil microbial diversity plays an important role in resisting and restoring degraded ecosystems. Plant Soil 2024, 500, 325–349. [Google Scholar] [CrossRef]
  28. Davern, M.; Farrar, A.; Kendal, D.; Giles-Corti, B. Quality Green Space Supporting Health, Wellbeing, and Biodiversity: A Literature Review; The National Heart Foundation of Australia: Melbourne, Australia, 2017; pp. 1–61. [Google Scholar]
  29. Doerr, S.H.; Thomas, A.D. The role of soil moisture in controlling water repellency: New evidence from forest soils in Portugal. J. Hydrol. 2000, 231–232, 134–147. [Google Scholar] [CrossRef]
  30. Fu, Z.; Hu, W.; Beare, M.H.; Müller, K.; Wallace, D.; Chau, H.W. Contributions of soil organic carbon to soil water repellency persistence: Characterization and modelling. Geoderma 2021, 401, 115312. [Google Scholar] [CrossRef]
  31. Bisdom, E.B.A.; Dekker, L.W.; Schoute, J.T. Water repellency of sieve fractions from sandy soils and relationships with organic material and soil structure. In Soil Structure/Soil Biota Interrelationships; Elsevier: Amsterdam, The Netherlands, 1993; pp. 105–118. [Google Scholar]
  32. Kidron, G.J.; Yaalon, D.H.; Vonshak, A. Two causes for runoff initiation on microbiotic crusts: Hydrophobicity and pore clogging. Soil Sci. 1999, 164, 18–27. [Google Scholar] [CrossRef]
  33. Hallett, P.D.; Gaskin, R.E. An introduction to soil water repellency. In Proceedings of the 8th International Symposium on Adjuvants for Agrochemicals (ISAA 2007), Wageningen, The Netherlands, 6–9 August 2007; Volume 6, pp. 1–10. [Google Scholar]
  34. Benito Rueda, E.; Rodríguez-Alleres, M.; Varela Teijeiro, E. Environmental factors governing soil water repellency dynamics in a Pinus pinaster plantation in NW Spain. Land Degrad. Dev. 2016, 27, 719–728. [Google Scholar]
  35. Rodríguez-Alleres, M.; Benito, E. Spatial and temporal variability of surface water repellency in sandy loam soils of NW Spain under Pinus pinaster and Eucalyptus globulus plantations. Hydrol. Process. 2011, 25, 3649–3658. [Google Scholar]
  36. Diehl, D. Soil water repellency: Dynamics of heterogeneous surfaces. Colloids Surf. A Physicochem. Eng. Asp. 2013, 432, 8–18. [Google Scholar]
  37. Hermansen, C.; Moldrup, P.; Müller, K.; Jensen, P.W.; van den Dijssel, C.; Jeyakumar, P.; de Jonge, L.W. Organic carbon content controls the severity of water repellency and the critical moisture level across New Zealand pasture soils. Geoderma 2019, 338, 281–290. [Google Scholar] [CrossRef]
  38. Jiménez-Morillo, N.T.; González-Pérez, J.A.; Jordán, A.; Zavala, L.M.; de la Rosa, J.M.; Jiménez-González, M.A.; González-Vila, F.J. Organic matter fractions controlling soil water repellency in sandy soils from the Doñana National Park (Southwestern Spain). Land Degrad. Dev. 2016, 27, 1413–1423. [Google Scholar]
  39. De Gryze, S.; Jassogne, L.; Bossuyt, H.; Six, J.; Merckx, R. Water repellence and soil aggregate dynamics in a loamy grassland soil as affected by texture. Eur. J. Soil Sci. 2006, 57, 235–246. [Google Scholar]
  40. Lichner, L.; Felde, V.J.; Büdel, B.; Leue, M.; Gerke, H.H.; Ellerbrock, R.H.; Sándor, R. Effect of vegetation and its succession on water repellency in sandy soils. Ecohydrology 2018, 11, e1991. [Google Scholar]
  41. Vogelmann, E.S.; Reichert, J.M.; Prevedello, J.; Consensa, C.O.B.; Oliveira, A.É.; Awe, G.O.; Mataix-Solera, J. Threshold water content beyond which hydrophobic soils become hydrophilic: The role of soil texture and organic matter content. Geoderma 2013, 209, 177–187. [Google Scholar] [CrossRef]
  42. Diamantopoulos, E.; Durner, W.; Reszkowska, A.; Bachmann, J. Effect of soil water repellency on soil hydraulic properties estimated under dynamic conditions. J. Hydrol. 2013, 486, 175–186. [Google Scholar] [CrossRef]
  43. Wessolek, G.; Schwärzel, K.; Greiffenhagen, A.; Stoffregen, H. Percolation characteristics of a water-repellent sandy forest soil. Eur. J. Soil Sci. 2008, 59, 14–23. [Google Scholar] [CrossRef]
  44. Lemmnitz, C.; Kuhnert, M.; Bens, O.; Güntner, A.; Merz, B.; Hüttl, R.F. Spatial and temporal variations of actual soil water repellency and their influence on surface runoff. Hydrol. Process. 2008, 22, 1976–1984. [Google Scholar] [CrossRef]
  45. DeBano, L.F. Water repellency in soils: A historical overview. J. Hydrol. 2000, 231, 4–32. [Google Scholar] [CrossRef]
  46. Berlin.de. Environmental Atlas. Available online: https://www.berlin.de/umweltatlas/ (accessed on 8 December 2022).
  47. Realty-Germany. Berlin’s Parks and Green Spaces. Available online: https://www.realty-germany.com (accessed on 15 June 2023).
  48. Wang, H.; Lin, C.; Ou, S.; Feng, Q.; Guo, K.; Xie, J.; Wei, X. Evolutionary Characteristics and Driving Forces of Green Space in Guangzhou from a Zoning Perspective. Forests 2024, 15, 135. [Google Scholar] [CrossRef]
  49. Stackebrandt, W.; Franke, D. Geologie von Brandenburg; Springer Vieweg: Berlin, Germany, 2015; ISBN 978-3-510-65295-2. [Google Scholar]
  50. Berlin Senate Department for Urban Development and the Environment. Environmental Atlas of Berlin: Soil Associations and Characteristics. Berlin Senate. 2020. Available online: https://www.berlin.de/umweltatlas/en/soil/soil-associations/2020/map-description (accessed on 1 March 2025).
  51. Marx, C.; Tetzlaff, D.; Hinkelmann, R.; Soulsby, C. Isotope hydrology and water sources in a heavily urbanized stream. Hydrol. Process. 2021, 35, e14377. [Google Scholar] [CrossRef]
  52. Hewelke, E.; Oktaba, L.; Gozdowski, D.; Kondras, M.; Olejniczak, I.; Górska, E.B. Intensity and persistence of soil water repellency in pine forest soil in a temperate continental climate under drought conditions. Water 2018, 10, 1121. [Google Scholar] [CrossRef]
  53. Doerr, S.H.; Llewellyn, C.T.; Douglas, P.; Morley, C.P.; Mainwaring, K.A.; Haskins, C.; Diamantis, J. Extraction of compounds associated with water repellency in sandy soils of different origin. Soil Res. 2005, 43, 225–237. [Google Scholar] [CrossRef]
  54. Letey, J.; Carrillo, M.L.K.; Pang, X.P. Approaches to characterize the degree of water repellency. J. Hydrol. 2000, 231, 61–65. [Google Scholar] [CrossRef]
  55. Doerr, S.H. On standardizing the ‘water drop penetration time’ and the ‘molarity of an ethanol droplet’ techniques to classify soil hydrophobicity: A case study using medium textured soils. Earth Surf. Process. Landf. 1998, 23, 663–668. [Google Scholar]
  56. Nykamp, M.; Becker, F.; Hoelzmann, P. Total organic carbon quantification in soils and sediments: Performance test of a modified sample preparation method. MethodsX 2024, 13, 102934. [Google Scholar] [CrossRef] [PubMed]
  57. Vogel, S.; Märker, M.; Rellini, I.; Hoelzmann, P.; Wulf, S.; Robinson, M.; Seiler, F. From a stratigraphic sequence to a landscape evolution model: Late Pleistocene and Holocene volcanism, soil formation and land use in the shade of Mount Vesuvius (Italy). Quat. Int. 2016, 394, 155–179. [Google Scholar]
  58. Nykamp, M.; Hoelzmann, P.; Heeb, B.S.; Szentmiklosi, A.; Schütt, B. Holocene sediment dynamics in the environs of the fortification enclosure of Corneşti-Iarcuri in the Romanian Banat. Quat. Int. 2016, 415, 190–203. [Google Scholar] [CrossRef]
  59. USDA-Natural Resources Conservation Service. Soil Survey Staff; USDA-Natural Resources Conservation Service: Washington, DC, USA, 2010. [Google Scholar]
  60. Deutscher Wetterdienst (DWD). Climate-Data-Center (CDC). Available online: https://opendata.dwd.de/climate_environment/CDC/observations_germany/climate/daily/more_precip/recent/ (accessed on 22 November 2023).
  61. Kruskal, W.H.; Wallis, W.A. Use of ranks in one-criterion variance analysis. J. Am. Stat. Assoc. 1952, 47, 583–621. [Google Scholar] [CrossRef]
  62. R Core Team. R: A Language and Environment for Statistical Computing; R Foundation for Statistical Computing: Vienna, Austria, 2016; Available online: http://www.R-project.org (accessed on 12 December 2023).
  63. IBM Corp. IBM SPSS Statistics for Windows, Version 25.0; IBM Corp: Armonk, NY, USA, 2017. [Google Scholar]
  64. DATAtab Team. DATAtab: Online Statistics Calculator; DATAtab e.U.: Graz, Austria, 2023; Available online: https://datatab.net (accessed on 12 December 2023).
  65. Müller, K.; Deurer, M.; Jeyakumar, P.; Mason, K.; van den Dijssel, C.; Green, S.; Clothier, B. Temporal dynamics of soil water repellency and its impact on pasture productivity. Agric. Water Manag. 2014, 143, 82–92. [Google Scholar]
  66. Kawamoto, K.; Moldrup, P.; Komatsu, T.; de Jonge, L.W.; Oda, M. Water repellency of aggregate size fractions of a volcanic ash soil. Soil Sci. Soc. Am. J. 2007, 71, 1658–1666. [Google Scholar]
  67. Dekker, L.W.; Doerr, S.H.; Oostindie, K.; Ziogas, A.K.; Ritsema, C.J. Water repellency and critical soil water content in a dune sand. Soil Sci. Soc. Am. J. 2001, 65, 1667–1674. [Google Scholar]
  68. Täumer, K.; Stoffregen, H.; Wessolek, G. Determination of repellency distribution using soil organic matter and water content. Geoderma 2005, 125, 107–115. [Google Scholar] [CrossRef]
  69. Oostindie, K.; Dekker, L.W.; Wesseling, J.G.; Ritsema, C.J.; Geissen, V. Development of actual water repellency in a grass-covered dune sand during a dehydration experiment. Geoderma 2013, 204, 23–30. [Google Scholar] [CrossRef]
  70. Yi, L.; Xin, R.; Robert, H.; Ying, Z. Characteristics of water infiltration in layered water-repellent soils. Pedosphere 2018, 28, 775–792. [Google Scholar]
  71. Leighton-Boyce, G.; Doerr, S.H.; Shakesby, R.A.; Walsh, R.P.; Ferreira, A.J.; Boulet, A.K.; Coelho, C.O. Temporal dynamics of water repellency and soil moisture in eucalypt plantations, Portugal. Soil Res. 2005, 43, 269–280. [Google Scholar] [CrossRef]
  72. Mao, J.; Nierop, K.G.; Dekker, S.C.; Dekker, L.W.; Chen, B. Understanding the mechanisms of soil water repellency from nanoscale to ecosystem scale: A review. J. Soils Sediments 2019, 19, 171–185. [Google Scholar]
  73. Zheng, W.; Morris, E.K.; Lehmann, A.; Rillig, M.C. Interplay of soil water repellency, soil aggregation, and organic carbon. A meta-analysis. Geoderma 2016, 283, 39–47. [Google Scholar] [CrossRef]
  74. Atanassova, I.; Banov, M.; Shishkov, T.; Petkova, Z.; Hristov, B.; Ivanov, P.; Harizanova, M. Relationships between soil water repellency, physical and chemical properties in hydrophobic technogenic soils from the region of Maritsa-Iztok coal mine in Bulgaria. Bulg. J. Agric. Sci. 2018, 2, 10–17. [Google Scholar]
  75. Atanassova, I.; Ivanov, P.L.; Shishkov, T.; Dimitrov, E.; Banov, M.; Simeonova, T.S.; Kirilov, I. Further insights in the relationships between soil water repellency and soil characteristics in mine soils in Bulgaria. J. Environ. Prot. Ecol. 2021, 22, 1861–1869. [Google Scholar]
  76. Brutsaert, W. Hydrology: An Introduction; Cambridge University Press: Cambridge, UK, 2005. [Google Scholar]
  77. Gomez-Plaza, A.; Alvarez-Rogel, J.; Albaladejo, J.; Castillo, V.M. Spatial patterns and temporal stability of soil moisture across a range of scales in a semi-arid environment. Hydrol. Process. 2001, 15, 3069–3082. [Google Scholar]
  78. Hamza, M.A.; Anderson, W.K. Soil compaction in cropping systems: A review of the nature, causes, and possible solutions. Soil Tillage Res. 2005, 82, 121–145. [Google Scholar]
  79. Batey, T. Soil compaction and soil management—A review. Soil Use Manag. 2009, 25, 335–345. [Google Scholar] [CrossRef]
  80. Crockford, H.; Topalidis, S.; Richardson, D. Water repellency in a dry sclerophyll eucalypt forest—Measurements and processes. Hydrol. Process. 1991, 5, 405–420. [Google Scholar]
  81. Shakesby, R.A.; Doerr, S.H.; Walsh, R.P.D. The erosional impact of soil hydrophobicity: Current problems and future research directions. J. Hydrol. 2000, 231, 178–191. [Google Scholar] [CrossRef]
  82. Ritsema, C.J.; Dekker, L.W. Soil moisture and dry bulk density patterns in bare dune sands. J. Hydrol. 1994, 154, 107–131. [Google Scholar] [CrossRef]
  83. Ritsema, C.J.; Dekker, L.W. Preferential flow in water repellent sandy soils: Principles and modeling implications. J. Hydrol. 2000, 231, 308–319. [Google Scholar] [CrossRef]
  84. Nguyen, H.V.; Nieber, J.L.; Ritsema, C.J.; Dekker, L.W.; Steenhuis, T.S. Modeling gravity-driven unstable flow in a water repellent soil. J. Hydrol. 1999, 215, 202–214. [Google Scholar] [CrossRef]
  85. Nir, N.; Stahlschmidt, M.; Busch, R.; Lüthgens, C.; Schütt, B.; Hardt, J. Footpaths: Pedogenic and geomorphological long-term effects of human trampling. Catena 2022, 215, 106312. [Google Scholar] [CrossRef]
  86. Weil, R.R.; Magdoff, F. Significance of soil organic matter to soil quality and health. In Soil Organic Matter in Sustainable Agriculture; CRC Press: Boca Raton, FL, USA, 2004; pp. 1–43. [Google Scholar]
  87. Sarah, P.; Zhevelev, H.M. Effect of visitors’ pressure on soil and vegetation in several different micro-environments in urban parks in Tel Aviv. Landsc. Urban Plan. 2007, 83, 284–293. [Google Scholar] [CrossRef]
  88. Siteur, K.; Mao, J.; Nierop, K.G.; Rietkerk, M.; Dekker, S.C.; Eppinga, M.B. Soil water repellency: A potential driver of vegetation dynamics in coastal dunes. Ecosystems 2016, 19, 1210–1224. [Google Scholar] [CrossRef]
  89. Mao, J.; Nierop, K.G.; Damsté, J.S.S.; Dekker, S.C. Roots induce stronger soil water repellency than leaf waxes. Geoderma 2014, 232, 328–340. [Google Scholar] [CrossRef]
  90. Müller, K.; Deurer, M. Review of the remediation strategies for soil water repellency. Agric. Ecosyst. Environ. 2011, 144, 208–221. [Google Scholar] [CrossRef]
Figure 1. Overview on the location of the study areas in the Berlin city area. (a) Location of the study areas and the regional DWD weather station in Berlin City; thin gray lines show the margins of the administrative districts; (b) Rudolph-Wilde Park, (c) Fischtal Park, and (d) Stadtpark Steglitz. Maps (bd) show the soil sampling sites in the parks and the population density (person per ha) in its direct neighborhood. adopted from FIS Broker, https://fbinter.stadt-berlin.de/fb/index.jsp (accessed on 13 December 2023).
Soilsystems 09 00031 g001
Figure 2. Daily rainfall total in mm (blue bars) and mean daily temperature in °C (orange lines) at Berlin-Dahlem meteorological station during the sampling period (September 2022 to Oct 2023) (data source: DWD [60]).
Soilsystems 09 00031 g002
Figure 4. The persistence of soil water repellency (WDPT classes) of the soils from selected urban parks in Berlin between September 2022 and October 2023. Actual WDPT is the field moist state of the soil samples (a), and potential WDPT is the oven-dried state of the soil samples at 65 °C for 24 h (b). WDPT classes include Class 0: wettable, Class 1: slightly water repellent, Class 2: strongly water repellent, Class 3: severely water repellent, and Class 4: extremely water repellent (Table 1) [31].
Soilsystems 09 00031 g004
Figure 5. Severity of soil water repellency (MED classes) of the soils from selected urban parks in Berlin between September 2022 and October 2023. Actual MED is the field moist state of the soil samples (a), and potential MED is the oven-dried state of the soil samples at 65 °C for 24 h (b). MED classes include Class 0: hydrophilic, Class 1: slightly hydrophobic, Class 2: strongly hydrophobic, Class 3: severely hydrophobic, and Class 4: extremely hydrophobic (Table 1) [54].
Soilsystems 09 00031 g005
Figure 6. The transition zone of the soil samples surveyed from Fischtal Park, Stadtpark Steglitz, and Rudolph-Wilde Park with associated water content limits (in mass -%) where soils were observed either wettable or repellent (n = 274).
Soilsystems 09 00031 g006
Table 1. Soil sampling sites: description of soil sampling sites located in Berlin’s selected parks—Fischtal Park (F1 to F5), Rudolph-Wilde Park (R1 to R5) and Stadtpark Steglitz (S1 to S4)—and associated sampling frequency of soil samples between September 2022 and October 2023 as well as the soil cover, usage, and ecosystem service categories.
Soil Sampling Sites and Distinct CharacteristicsNumber of SitesNumber of Soil Samples ExtractedSoil CoverUsageESS Category(s)
F1: Soils under grass and trees436Grass and treesRecreational, Urban Green SpaceCultural ESS (urban green space for recreation)
Supporting ESS (biodiversity, habitat, and carbon sequestration)
F2: Well-draining soil, prevents waterlogging545Grass and lawnRecreational, LandscapingRegulating ESS (water regulation, preventing waterlogging)
Supporting ESS (soil formation, plant support)
F3: Diverse soil, influenced by pathways and slope dynamics327Mixed soil with grass patchesMixed-use, Pedestrian InfluenceSupporting ESS (biodiversity support, soil nutrient cycling)
Cultural ESS (recreational areas, aesthetic value)
F4: Pathway: compacted bare soil spots19Bare soilHigh Foot TrafficCultural ESS (high foot traffic, recreation, and movement)
Regulating ESS (soil compaction affects water infiltration and erosion)
F5: Upper slope location: eroded bare soil spots218Bare soilErosion-Prone, Minimal UseRegulating ESS (soil erosion control, water regulation)
Supporting ESS (soil formation, preventing further erosion)
R1: Compacted spots: soil compaction due to foot traffic428Bare soil with compacted areasPedestrian, Walking PathRegulating ESS (soil compaction impacts water infiltration and air quality)
Cultural ESS (pedestrian pathways, recreation)
R2: Under trees: compacted soil affecting grass growth428Sparse grass, compacted soilShaded, Low Vegetation GrowthSupporting ESS (soil fertility, vegetation support)
Cultural ESS (shaded areas, aesthetic value)
R3: Diverse soil, influenced by pathways and slope dynamics535Mixed soil, some vegetation patchesMixed-use, Pedestrian InfluenceSupporting ESS (biodiversity, nutrient cycling)
Cultural ESS (mixed-use, recreational influence)
R4: Pathway; compacted bare soil spots17Bare soilHigh Foot TrafficCultural ESS (high foot traffic, pedestrian use)
Regulating ESS (compaction impacts water infiltration)
R5: Upper slope location: eroded bare soil spots17Bare soilErosion-Prone, Minimal UseRegulating ESS (soil erosion, water retention)
Supporting ESS (nutrient cycling, soil structure)
S1: Under trees: high soil compaction, resulting in bare spots648Bare soil with tree coverShaded, Minimal VegetationSupporting ESS (biodiversity, habitat for trees)Regulating ESS (soil compaction affecting water flow)
S2: Under trees: moderate soil compaction540Sparse grass with tree coverShaded, Partial VegetationSupporting ESS (vegetation support, biodiversity)
Cultural ESS (shaded areas for recreation)
S3: Bushes: varied soil, supporting diverse vegetation216Bushes, ShrubsBiodiversity SupportSupporting ESS (biodiversity, habitat for species)
Cultural ESS (nature experience, aesthetic value)
S4: Pathway: compacted bare soil spots18Bare soilHigh Foot TrafficCultural ESS (high foot traffic, movement paths)
Regulating ESS (soil compaction impacts water infiltration)
Total44352
Table 2. The classes of soil water repellency persistence measured by water drop penetration time (WDPT) test and soil water repellency severity measured by molarity of ethanol droplets (MED) test (after [31,53,54]).
ClassWater Drop Penetration Time (WDPT)Molarity of Ethanol Droplet (MED)
[seconds] [%]
0WDPT < 5Wettable0%Hydrophilic
15 s < WDPT < 60 sSlightly water repellent5%Slightly hydrophobic
260 s< WDPT < 600 sStrongly water repellent13%Strongly hydrophobic
3600 s < WDPT < 3600 sSeverely water repellent24%Severely hydrophobic
4WDPT > 3600 sExtremely water repellent36%Extremely hydrophobic
Table 3. The texture, particle size distribution and total organic carbon content of the soil samples from Berlin’s parks.
Sampling Site/
Sample
TextureSand
[vol.-%]
Clay
[vol.-%]
Silt
[vol.-%]
TOC
[mass-%]
F1/01loamy sand77.54.218.36.0
F1/02loamy sand81.34.014.73.5
F1/03loamy sand76.94.718.44.7
F1/04loamy sand76.94.618.54.7
F2/05loamy sand79.04.316.74.6
F2/06loamy sand78.34.517.25.8
F2/07loamy sand79.04.316.74.5
F2/08loamy sand81.63.614.85.7
F2/09loamy sand78.05.116.95.3
F3/10loamy sand85.43.011.61.7
F3/11sandy loam74.65.020.46.1
F3/12Loam47.112.340.610.1
F4/13Sand95.21.33.51.5
F5/14loamy sand85.83.410.81.3
F5/15loamy sand77.25.117.72.8
R1/16loamy sand79.34.316.43.5
R1/17loamy sand79.14.816.13.9
R1/18loamy sand79.14.816.13.1
R1/19loamy sand78.44.916.74.0
R2/20loamy sand82.04.313.72.9
R2/21loamy sand82.64.113.34.8
R2/22loamy sand82.53.813.74.8
R2/23loamy sand84.83.411.85.2
R3/24sandy loam68.56.824.76.6
R3/25sandy loam64.67.527.97.4
R3/26sandy loam71.15.723.26.0
R3/27sandy loam74.14.821.16.8
R3/28loamy sand79.84.116.15.6
R4/29loamy sand79.14.416.52.1
R5/30loamy sand75.14.820.11.3
S1/31loamy sand78.93.917.24.9
S1/32loamy sand80.34.415.32.1
S1/33loamy sand81.73.414.92.0
S1/34loamy sand79.63.916.52.6
S1/35sandy loam70.06.024.03.8
S1/36loamy sand78.93.417.73.5
S2/37sandy loam63.07.429.65.7
S2/38sandy loam60.67.731.75.8
S2/39sandy loam65.06.728.35.8
S2/40sandy loam61.17.431.55.1
S2/41sandy loam66.96.626.56.0
S3/42sandy loam62.87.629.65.8
S3/43sandy loam62.27.130.72.3
S4/44sandy loam66.45.927.74.5
Table 4. Multiple linear regression analysis of soil water repellency (WDPTpot) against total organic carbon and soil particle fractions (n = 43). For WDPTpot: water drop penetration time; d.f.: degree of freedom; MS: mean square; SE: standard error.
Dependent Variable: WDPTpot
d.f.MSFR2p
Model residuals42.3063.440.2610.017
390.67
43
VariablesBSEBetat-valuep
(Constant)3.0373.77 0.8060.425
Sand2.8215.810.170.4860.63
Clay3.1143.190.520.9770.335
Silt−2.8552.46−0.55−1.1610.253
TOC2.4310.730.563.3420.002
Table 5. Multiple linear regression analysis of soil water repellency (MEDpot) against total organic carbon and soil particle fractions (n = 43). For MEDpot: molarity of ethanol droplet; d.f.: degree of freedom; MS: mean square; SE: standard error.
Dependent Variable: MEDpot
d.f.MSFR2p
Model residuals40.605.520.3610.001
390.11
43
VariablesBSEBetat-valuep
(Constant)1.6431.51 1.0850.284
Sand1.9432.330.270.8330.41
Clay2.191.280.851.7110.095
Silt−2.1540.99−0.96−2.180.035
TOC1.2150.290.654.160.000
Table 6. Spearman’s correlation coefficients between water content, severity (MED) and persistence (WDPT) of soil water repellency; soil samples were taken from 9 sampling sites of selected urban parks in Berlin under both filed moist (actual) and oven-dried (potential) conditions (n = 305).
Actual WDPT Class at Sampling Site:
F1F2F3R1R2R3S1S2S3
Potential WDPT class0.230.130.10.2600.120.33 *0.41 **0.6 *
Actual MED class0.88 **0.82 **0.87 **0.58 **0.82 **0.84 **1 **0.82 **0.86 **
Soil water content−0.76 **−0.71 **−0.73 **−0.81 **−0.53 **−0.74 **−0.28−0.52 **−0.85 **
Actual MED Class at Sampling Site:
F1F2F3R1R2R3S1S2S3
Soil water content−0.76 **−0.67 **−0.61 **−0.6 **−0.44 *−0.6 **−0.28−0.48 **−0.69 **
Potential MED class−0.24−0.36 *−0.070.03−0.140.090.32 *0.160.29
* Significant at p < 0.05; ** significant at p < 0.01; negative correlation; positive correlation.
Table 7. The Spearman’s correlation coefficients between WDPTact, antecedent rainfall, max temperature and number of dry days in different sampling sites of Berlin’s parks (n = 305).
WDPTact Class at Sampling Site
F1F2F3R1R2R3S1S2S3
Cumulative rainfall3 days−0.060.03−0.1−0.23−0.34−0.32−0.2−0.27−0.32
5 days−0.29−0.01−0.27−0.65 **−0.51 **−0.59 **−0.2−0.1−0.33
7 days−0.51 **−0.22−0.49 **−0.28−0.37−0.33−0.2−0.05−0.53 *
14 days−0.54 **−0.44 **−0.5 **−0.41 *−0.42 *−0.46 **−0.3−0.47 **−0.83 **
21 days−0.09−0.12−0.13−0.68 **−0.52 **−0.49 **−0.3−0.42 **−0.2
28 days−0.060.07−0.07−0.53 **−0.42 *−0.33−0.2−0.21−0.12
Temperature (max)3 days0.53 **0.48 **0.54 **−0.050.110.130.160.220.69 **
5 days0.42 *0.39 **0.41 *0.10.270.330.090.120.45
7 days0.4 *0.36 *0.38 *−0.110.060.030.160.220.69 **
14 days0.4 *0.39 **0.42 *0.10.06−0.030.130.4 *0.39
21 days0.69 **0.57 **0.69 **−0.010.01−0.070.130.54 **0.64 **
28 days0.72 **0.56 **0.71 **−0.060.01−0.070.020.54 **0.47
Dry days3 days0.41 *0.31 *0.49 * 0.150.4 *0.48
5 days0.46 **0.210.48 *0.320.170.240.120.290.5
7 days0.61 **0.41 **0.6 **0.290.340.42 *0.250.39 *0.82 **
14 days0.78 **0.62 **0.73 **0.44 *0.42 *0.55 **0.280.48 **0.89 **
21 days0.52 **0.38 *0.48 *0.63 **0.54 **0.65 **0.36 *0.66 **0.8 **
28 days0.53 **0.33 *0.5 **0.55 **0.42 *0.39 *0.32 *0.62 **0.68 **
* Significant at p < 0.05; ** significant at p < 0.01; negative correlation; positive correlation.
Table 8. The Spearman’s correlation coefficients between MEDact class, antecedent rainfall, max temperature and dry days in different sampling sites of Berlin’s parks (n = 305).
MEDact Class at Sampling Site
F1F2F3R1R2R3S1S2S3
Cumulative rainfall3 days−0.10.06−0.16−0.12−0.29−0.21−0.2−0.23−0.22
5 days−0.35 *−0.08−0.35−0.48 *−0.44 *−0.44 **−0.2−0.18−0.33
7 days−0.49 **−0.25−0.55 **−0.03−0.24−0.32−0.2−0.11−0.5 *
14 days−0.45 **−0.32−0.45 *−0.1−0.3−0.43 **−0.3−0.47 **−0.75 **
21 days−0.22−0.08−0.17−0.43 *−0.41 *−0.37 *−0.3−0.47 **−0.14
28 days−0.160.06−0.12−0.22−0.3−0.27−0.2−0.29−0.11
Temperature (max)3 days0.45 **0.52 **0.48 *−0.240.060.150.160.220.64 **
5 days0.34 *0.44 **0.38−0.20.180.330.090.130.42
7 days0.35 *0.43 **0.39 *−0.280.010.090.160.220.64 **
14 days0.43 **0.46 **0.38−0.190.0100.130.44 **0.38
21 days0.67 **0.59 **0.64 **−0.31−0.050.020.130.55 **0.61 *
28 days0.73 **0.59 **0.67 **−0.39 *−0.050.020.020.51 **0.46
Dry days3 days0.38 *0.230.46 * 0.150.38 *0.43
5 days0.45 **0.240.48 *0.230.140.20.120.33 *0.49
7 days0.53 **0.38 *0.61 **0.210.250.39 *0.250.38 *0.74 **
14 days0.71 **0.56 **0.74 **0.110.330.49 **0.280.45 **0.79 **
21 days0.59 **0.35 *0.51 **0.220.43 *0.55 **0.36*0.63 **0.67 **
28 days0.61 **0.34 *0.54 **0.170.30.35 *0.32*0.62 **0.59 *
* Significant at p < 0.05; ** significant at p < 0.01; negative correlation; positive correlation.
Table 9. Pearson’s correlation for water content values with rainfall, temperature and dry days in different sampling sites of Berlin’s parks (n = 305).
Soil Water Content at Sampling Site
F1F2F3R1R2R3S1S2S3
Cumulative rainfall3 days0.080.040.110.080.020.020.3 *0.51 **0.37
5 days0.310.050.210.53 **0.20.060.3 *0.43 **0.28
7 days0.260.090.260.45 *0.360.040.42 **0.55 **0.42
14 days0.36 *0.38 *0.39 *0.46 *0.56 **0.34 *0.72 **0.86 **0.77 **
21 days00.1−0.040.51 **0.39 *0.260.030.230.04
28 days0.010.02−0.020.53 **0.370.130.060.250.06
Temperature (max)3 days−0.45 **−0.44 **−0.38 *0.09−0.25−0.45 **−0.56 **−0.47 **−0.54 *
5 days−0.5 **−0.49 **−0.42 *0.03−0.37−0.47 **−0.55 **−0.43 **−0.53 *
7 days−0.5 **−0.48 **−0.43 *0.09−0.37−0.42 *−0.69 **−0.58 **−0.7 **
14 days−0.58 **−0.58 **−0.45 *0.12−0.23−0.28−0.58 **−0.62 **−0.63 **
21 days−0.71 **−0.64 **−0.57 **0.03−0.27−0.28−0.65 **−0.73 **−0.74 **
28 days−0.71 **−0.56 **−0.53 **0.11−0.19−0.14−0.59 **−0.69 **−0.7 **
Dry days3 days−0.13−0.13−0.26 −0.44 **−0.67 **−0.55 *
5 days−0.34 *−0.13−0.34−0.51 **−0.19−0.05−0.56 **−0.73 **−0.57 *
7 days−0.35 *−0.23−0.34−0.33−0.57 **−0.34 *−0.7 **−0.76 **−0.72 **
14 days−0.54 **−0.6 **−0.46 *−0.29−0.52 **−0.56 **−0.73 **−0.81 **−0.81 **
21 days−0.47 **−0.47 **−0.37−0.55 **−0.64 **−0.58 **−0.61 **−0.81 **−0.71 **
28 days−0.43 **−0.32 *−0.31−0.54 **−0.57 **−0.31−0.61 **−0.82 **−0.69 **
* Significant at p < 0.05; ** significant at p < 0.01; negative correlation; positive correlation.
Disclaimer/Publisher’s Note: The statements, opinions and data contained in all publications are solely those of the individual author(s) and contributor(s) and not of MDPI and/or the editor(s). MDPI and/or the editor(s) disclaim responsibility for any injury to people or property resulting from any ideas, methods, instructions or products referred to in the content.

