Article

Spatiotemporal Variations Affect DTPA-Extractable Heavy Metals in Coastal Salt-Affected Soils of Arid Regions

1
Drainage Research Institute (DRI), National Water Research Center (NWRC), Cairo 13411, Egypt
2
Soils and Water Department, Faculty of Agriculture, Benah University, Benha 13518, Egypt
3
Division of Scientific Training and Continuous Studies, National Authority for Remote Sensing and Space Sciences (NARSS), Cairo 11769, Egypt
4
Department of Agricultural, Forest, Food and Environmental Sciences, University of Basilicata, Viale dell’Ateneo Lucano 10, 85100 Potenza, Italy
5
Soils, Water and Environment Research Institute (SWERI), Agricultural Research Center (ARC), Giza 12411, Egypt
*
Authors to whom correspondence should be addressed.
Soil Syst. 2025, 9(1), 26; https://doi.org/10.3390/soilsystems9010026
Submission received: 29 October 2024 / Revised: 20 February 2025 / Accepted: 7 March 2025 / Published: 10 March 2025

Abstract

The concept of metal bioavailability in soils is increasingly becoming the key to addressing potential risks. Yet, space–time variations of heavy metal concentrations in salt-affected soils is still vague. The current work, therefore, is the first attempt to address spatial and seasonal analyses of heavy metals in a Mediterranean arid agroecosystem. This study was conducted in a coastal area in northeastern Egypt as an example. The DTPA-extractable concentrations of Cr, Co, Cu, Fe, Pb, Mn, Ni, and Zn in addition to the main properties of 70 georeferenced soil samples (0–30 cm) were determined during the wet (March) and dry (September) seasons. The results revealed that except for Cu, the concentrations of all the determined metals stood below the safe limits. On average, the concentrations of Cu were 4.1- and 5-fold the acceptable limit of 0.20 mg kg−1, respectively. The statistical analysis indicated that seasonal variations greatly affect the concentrations of Mn, Ni, and Zn. Compared with the wet season, significant increases of 1.25, 1.50, and 1.28-fold in the concentrations of these metals occurred during the dry season, respectively. The principal component analysis affirmed that the presence of Cr, Co, Fe, and Ni was closely related to geogenic factors; meanwhile, agronomic practices were likely the main inputs of Cu, Pb, and Zn. The geostatistical analysis illustrated that the geographic variability of Cr, Fe, Mn, and Zn was due to interactions of natural and stochastic processes. Farming practices controlled the spatial variability of Ni, Pb (in the wet period), and Co (in the dry period). The effect of natural processes during the wet period was evident for Cu, which showed strong spatial variability. The kriged maps showed that the concentrations of Co, Fe, and Ni tended to increase seaward and were found to be affected by pH, salt ions, and exchangeable Na+. Moreover, both silt and organic matter content had profound impacts on the spatial distribution of Cr, while the distributions of Cu, Pb, and Zn were linked to that of CaCO3 content. The suggested mechanisms governing metal bioavailability were sorption and complexation with ligands (for Co, Fe, and Ni), redox potential (for Cr), dissolution–precipitation (for Mn), and ion exchange (for Cu, Pb, and Zn). The results of this study affirm that drying–wetting cycles and spatial distribution affect the bioavailability of heavy metals in coastal salt-affected soils of arid regions. These findings imply that seasonality (wet and dry) and spatiality should be considered for monitoring and rehabilitation of degraded soils under similar ecological conditions.

1. Introduction

Heavy metals (HMs) are characterized by their higher atomic numbers (above 20) and densities (exceeding 5 g cm−3) [1]. They play a complex role in the environment, particularly in soil–plant systems. Some of these metals, such as iron (Fe), manganese (Mn), zinc (Zn), copper (Cu), and cobalt (Co), are essential micronutrients for plant growth and metabolic functions. However, others, like cadmium (Cd), chromium (Cr), nickel (Ni), and lead (Pb), have no known biological role and can be harmful. At elevated concentrations, even essential heavy metals can become toxic, leading to adverse effects on crop productivity and pose serious risks to human health through food chains [2]. Once entering the pedosphere, these metals accumulate and their total content persists for long periods since metal pollutants are highly available, very active, and non-biodegradable [3]. Hence, reducing the bioaccessibility of HMs in soils presents a significant environmental challenge.
The ecotoxicity of HMs relies not only on the total content but also on their chemical speciation [4]. Metals in soils occur in several forms, i.e., soluble species, exchangeable ions, structural cations, and insoluble precipitates. The first two species are labile, while others have slower cycles within terrestrial ecosystems [5]. Metal bioaccumulation is primarily related to these bioavailable species in soils [6,7]. Moreover, metals from human activities are often present in labile forms upon entering the ecosystems, while those from geogenic sources exist in more stable forms [8]. Thus, bioavailable species rather than total contents, can more accurately depict the origin, behavior, and severity of HMs in soils.
Metal bioavailability in soils is a dynamic process governed by interactions of metal ions, soil properties, and time of processing [5]. Key factors affecting metal retention and transfer in soils include soil pH, texture, clay mineralogy, organic matter (OM), CaCO3, and redox potential [2,9]. Particularly, soil chemical properties can vary spatially [10]. In addition, seasonal variations in air temperature and rainfall affect these characteristics [11], which may induce short-term fluctuations in metal speciation in soils. However, spatial variations in soil metal bioavailability, along with seasonal changes, have rarely been explored at regional scales.
To interpret local space–time variations, continuous distribution patterns of metals and influential soil factors should be considered [12]. Recently, kriging has been shown as a robust geostatistical technique to analyze the spatial structure of soil data [13,14,15]. Kriging depicts spatial variability based on the regional spatial scale, sampling distance, and spatial pattern of modeling semivariograms [14]. Ordinary kriging achieves optimal and unbiased predictions [16], simulating spatial structure using several variograms to reduce the variance of prediction errors and show numerous map outputs [17]. Hence, screening soil metal bioavailability in space and time based on kriged maps is a promising approach over large areas.
Salt-affected soils are soils with high amounts of dissolved salts and/or sodium ions, which interfere with normal plant growth. They are divided into saline, sodic, and saline-sodic depending on the amount and type of soluble ions. These soils cover 1.3 billion ha worldwide and occupy 8.5% of land area in 118 countries [18]. These soils dominate arid and semi-arid regions due to low rainfall, high evaporation, and irrigation that induce secondary soil salinity and sodicity [19]. Coastal areas are at high risk since salts transported by winds from the sea surface through marine spray can be deposited on the inland ground surface [20]. Seasonal fluctuations in salinity and sodicity are typical in coastal soils due to seawater intrusion in groundwater [21]. Therefore, it is essential to examine how levels of salinity and sodicity affect HMs behavior in soils.
Previous studies have mainly focused on the effect of salinity on metal sorption and retention in small-scale trials. Laboratory experiments [22,23,24] have revealed that increasing salinity level can enhance metal availability. For instance, Acosta et al., [22] studied the effect of salinity induced by CaCl2, MgCl2, NaCl, and Na2SO4 on the mobility of Cd, Cu, Pb, and Zn in semi-arid calcareous soils. They illustrated that competition with salt-derived cations on sorption sites and complexation with salt-derived anions resulted in high metal release from soils. Moreover, Chu et al. [23] reported that increasing soil salinity induced by NaCl addition increased the exchangeable fractions of Cd, Pb, and Zn in wetland soil. However, the effects of geographically and seasonally related factors on soil metal availabilities remain a significant concern [25]. Soil properties affecting metal transformations are interdependent, so a change in one value will also affect the other one [9]. This, in turn, advocates for a deep vision of how metal ions interact with key soil properties in salt-affected areas.
Egypt is one of the most sensitive countries to salinity and sodicity hazards, where one million ha (about 35% of the agricultural lands) in irrigated areas is salt-affected. Most of these soils are mainly located in coastal ecosystems [26]. An increase in metal bioavailability could lead to additional adverse effects, which must be considered for the rehabilitation of these degraded soils. Therefore, the main goal of the current work was to monitor the bioavailability status of eight HMs (Cr, Co, Cu, Fe, Pb, Mn, Ni, and Zn) during wet and dry seasons in a coastal salt-affected zone in Egypt. Additional goals were to specify the potential sources and spatial variability of these metals for future remediation techniques.

2. Materials and Methods

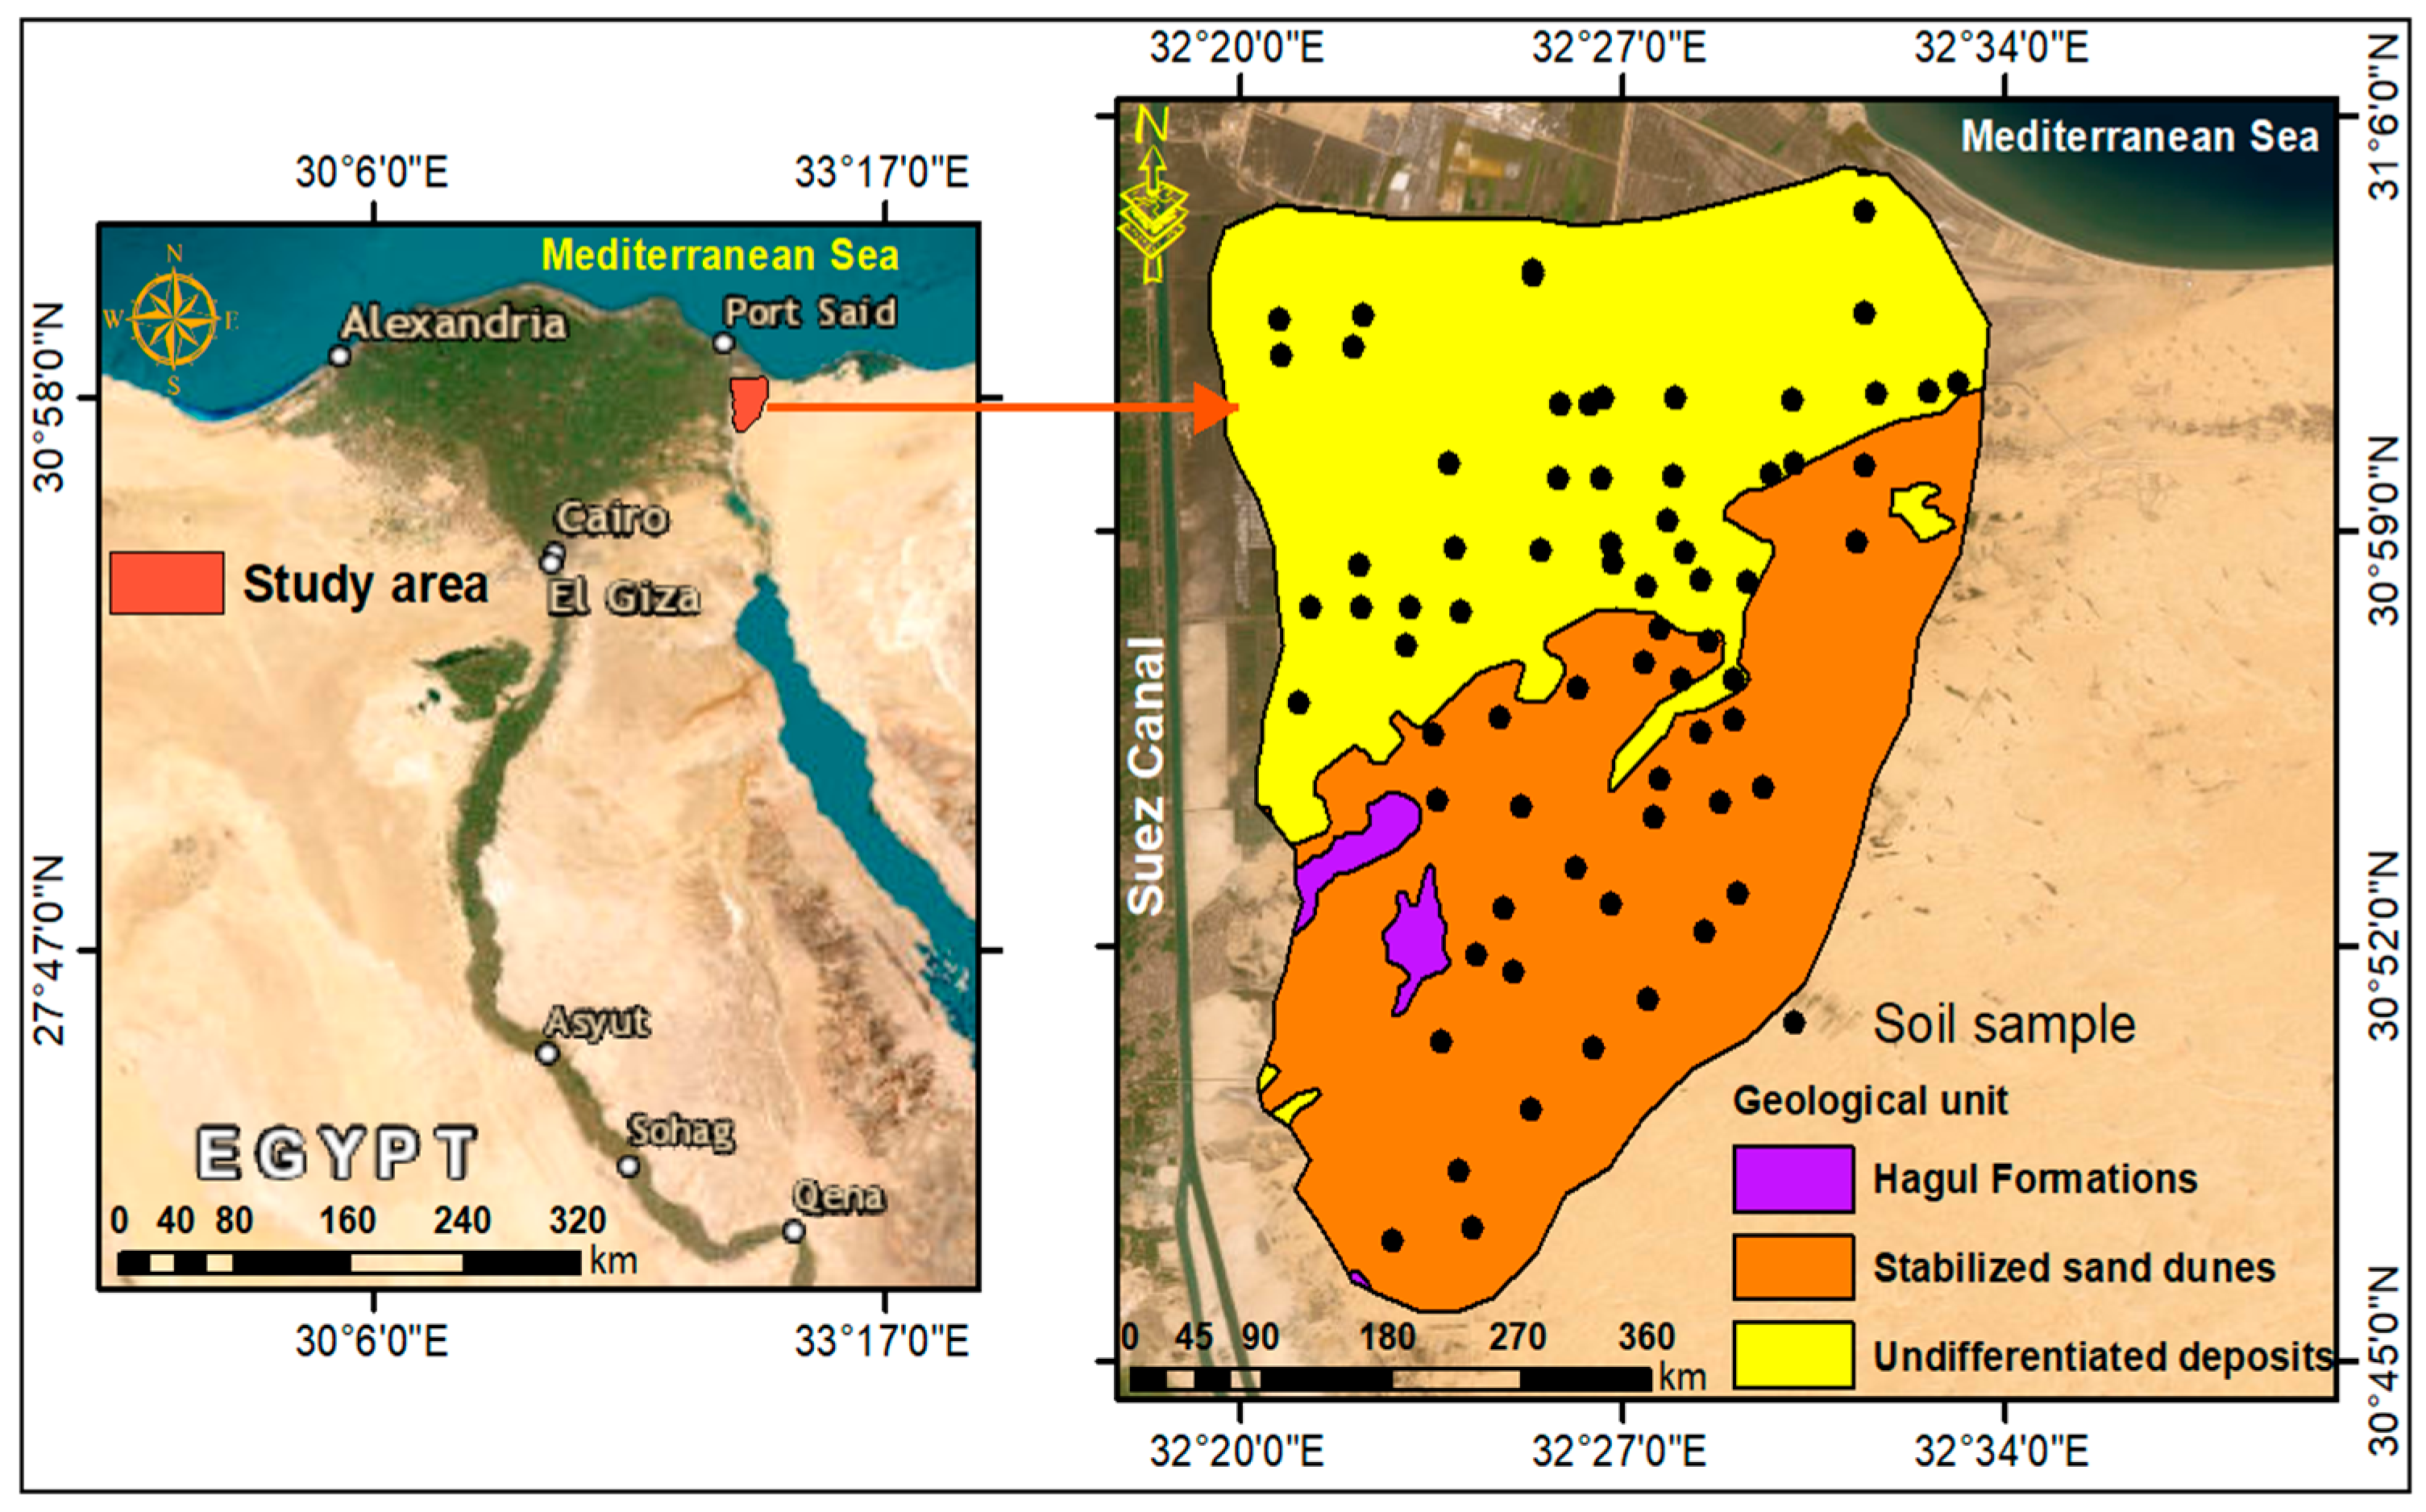
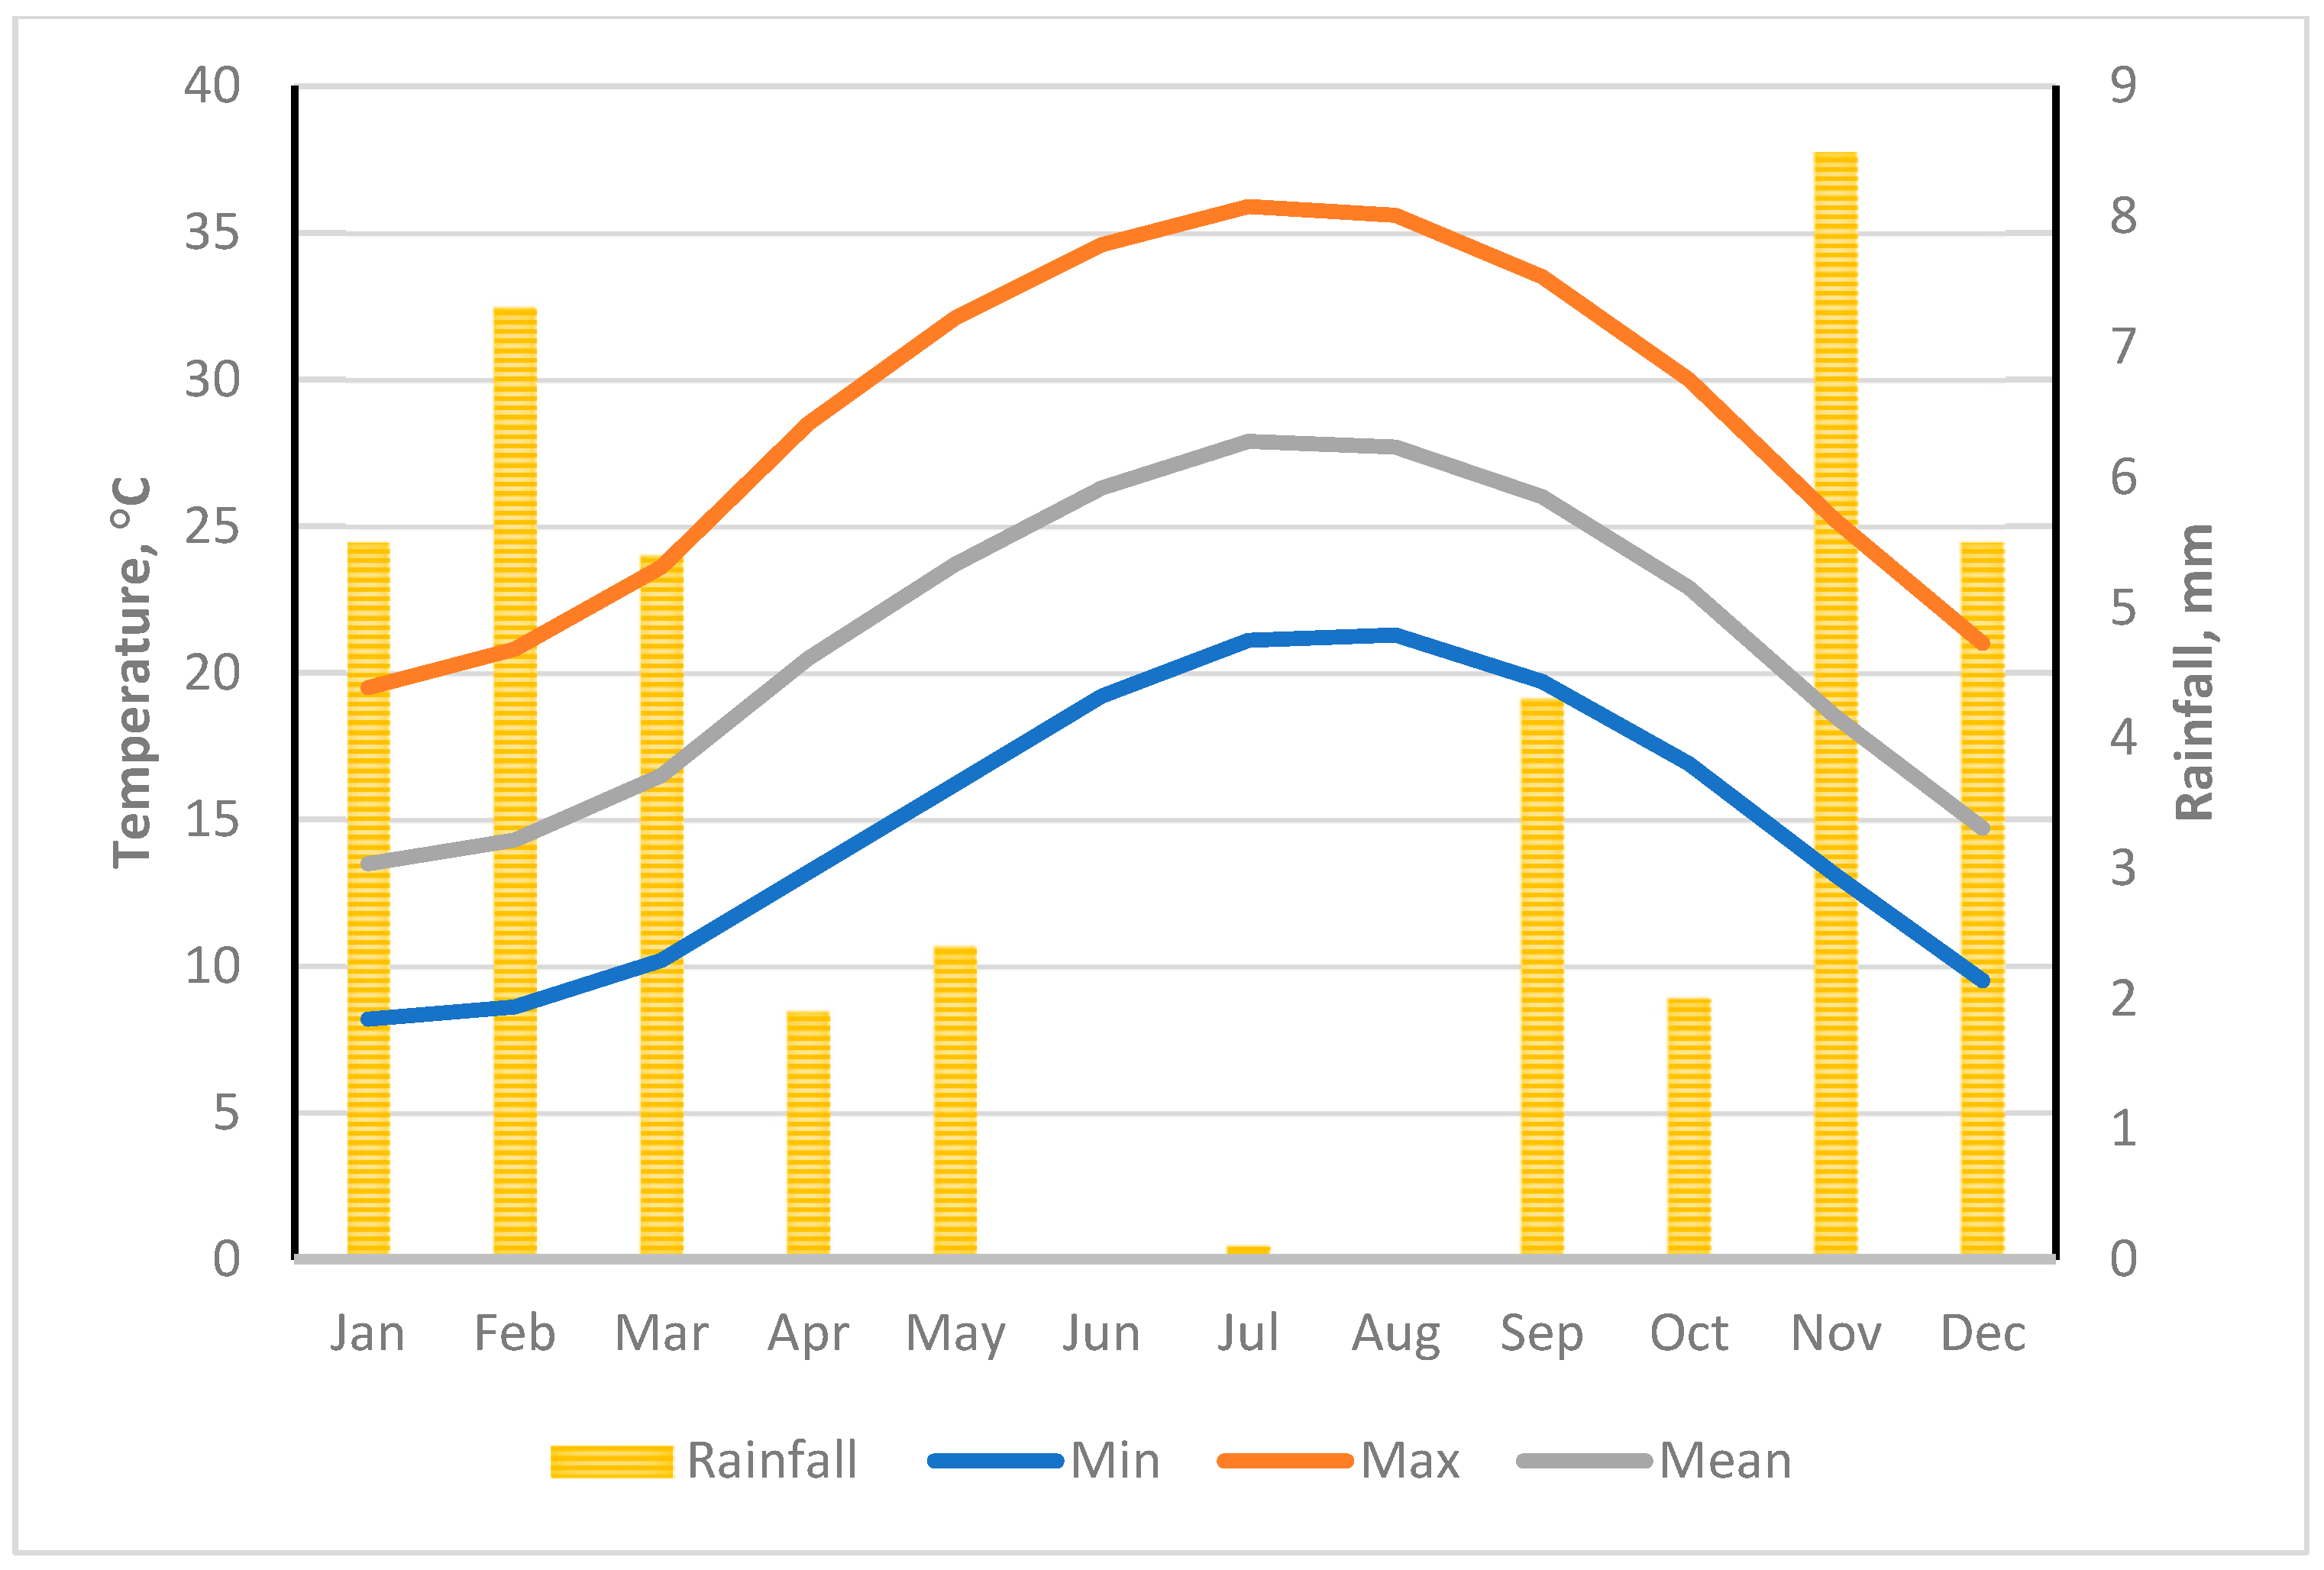
2.1. Description of the Study Area

The study area was located in a northeast part of the Nile Delta in Egypt, between latitudes 30°44′ and 31°04′ N and longitudes 32°20′ to 32°34′ E (Figure 1). The area is bounded by the Mediterranean Sea to the north, the Suez Canal to the west, the Sinai Peninsula to the east, and sandy desert plains to the south. This region is one of the newly established agroecosystems in Egypt, where reclamation projects were launched in the 1950s and have increased rapidly since the 1980s. The Quaternary formations cover about 97% of the study area, including stabilized sand dunes and undifferentiated deposits, mainly wadi and playa deposits. The remaining 3% is covered by the Lower Pliocene Hagul formation (chalky limestone, sandstone, and shale). The soils are classified as Typic Torriorthents (77%), Typic Haplosalids (17%), and Typic Torripsamments (7%) The land use types are barren lands, croplands, and water bodies. The cropping pattern is dominated by alfalfa as a permanent field crop and annual field crops, including wheat, barley, and sugar beet in the winter, and rice in the summer.
The area is dominated by a Mediterranean climate characterized by hot summers and little rain in the winter. As shown in Figure 2, the minimum temperature is 8 °C (in January), while the maximum value is 36 °C (August). The total annual rainfall (R) is 73 mm and occurs mostly during the winter season. The potential evapotranspiration (PET) varies from 1.8 mm day−1 in January to 6.2 mm day−1 in August, with a mean annual value of 4 mm day−1. Therefore, the aridity index (R/PET) is 0.05, indicating an arid environment.

2.2. Field Work and Laboratory Analysis

A total of seventy geo-referenced sampling sites were strategically distributed throughout the investigated area as illustrated in Figure 1. Surface soil samples, taken from a depth of 0–30 cm, were collected during the wet season (March) and dry season (September) of 2023. At each site, five disturbed soil samples were combined to provide a composite sample. These samples were then stored in polyethylene sacks and transported to the laboratory for analyses. The soil analyses were performed a following guidelines outlined by the Soil Survey Staff [27]. Soil pH was measured using a 1:2.5 soil-to-water suspension, while the electrical conductivity (EC) and soluble ions were analyzed from soil paste extracts. Sodium (Na+) and potassium (K+) concentrations were determined using a flamephotometer, whereas calcium (Ca2+), magnesium (Mg2⁺), chloride (Cl), bicarbonate (HCO3), and carbonate (CO32−) concentrations were assessed through titration methods. The exchangeable sodium was quantified using the ammonium acetate method at pH 7.0. The exchangeable sodium percentage (ESP) was calculated using the following Equation (1):
E S P = E x c h a n g e a b l e   s o d i u m C a t i o n   e x c h a n g e   c a p a c i t y × 100
The OM content was determined using the Walkley–Black procedure. The CaCO3 content was determined using the calcimeter method. The soil particle size distribution was determined using the standard pipette method. The available forms of Cr, Co, Cu, Fe, Pb, Mn, Ni, and Zn were extracted using the diethylene triamine pentaacetate acid (DTPA) solution at pH = 7.3 [28]. The DTPA soil test was developed to identify near-neutral and calcareous soils. The extraction consists of DTPA (as a chelating agent that forms complex with HMs), triethanolamine (forms complexes with interfering elements like Al), and CaCl2 (precludes the dissolution of CaCO3). Briefly, 10 g air-dried soil (2-mm) was shaken with 20 mL extraction solution for 2 h. Thereafter, the suspension was filtered through Whatman 42 filter paper. The concentrations of metals were measured in the filtrate using an inductively coupled plasma optical emission (ICP-OES—Perkin Elmer Optima 5300, Markham, ON, Canada). All analyses were conducted in triplicate using analytical grade chemicals, and the results were reported as mean values.

2.3. Statistical Analysis

All statistical analyses were carried out using SPSS 28.0 software (IBM, Armonk, NY, USA). To compare soil properties between the wet and dry seasons, analysis of variance (ANOVA) was performed at a 5% significance level (p < 0.01). The soil dataset was normalized by computing z-scores, a crucial pre-processing step for ecological data, which often exhibit non-normal distribution [29]. Following normalization, Pearson’s correlation analysis was applied to the z-scores to examine relationships among metals in the soils. To identify potential sources of the studied metals, factor analysis was conducted on the correlation matrix using the principal component analysis (PCA) with the Varimax rotation method. Only PCs with eigenvalues greater than 1.0 were retained, and parameters with absolute loading values above 0.6 were considered strongly correlated with the component [30].

2.4. Geostatistical Analysis

The spatial distribution maps were generated using ordinary kriging (OK) geostatistical models in ArcGIS 10.8 software (ESRI, Redlands, CA, USA). The OK estimates the value of a soil property at unsampled sites using number of neighbor points (n), weight of measured data (λi), and measured value (Z(xi) Equation (2) [31]:
Z x 0 = i = 1 n λ i × Z x i
Before applying kriging, data normality was evaluated using the normal quartile–quartile (Q–Q) plots and histograms to identify distribution outliers. The skewed data were transformed using logarithmic and Box–Cox methods to reduce the influence of outliers and fix the non-normality issues [32]. The semivariograms were analyzed to examine spatial autocorrelations of soil and HMs data. The experimental semivariogram (γ(h)) was calculated considering the number of data pairs (n) in a large distance (h), observed value (Z) at the location (xi), and observed value (Z(xi + h)) at a large distance from xi location using the following Equation (3) [31]:
γ h = 1 2 n ( h ) i = 1 n ( h ) Z x i Z ( x i + h ) 2
The spatial variability of soil data is outlined based on three main parameters, including nugget, sill, and range.
Cross-validation based on the calculated prediction errors was conducted to evaluate the accuracy and predictive performance of OK models. Accordingly, the best-fitted semivariogram model should achieve (1) the lowest ME (mean error) and MSE (mean standardized error), (2) similar RMSE (root mean square error) and ASE (average standardized error) values, and (3) RMSSE (root mean square standardized error) close to 1 [32].

3. Results

3.1. Soil Physicochemical Properties

The results in Table 1 indicate that, among soil properties, the coefficient of variation (CV) value was highest for SO42− in the dry season but lowest for pH in the wet season. The CV denotes the degree of variability, where CV values below 20, 20–50, and above 50% indicate low, moderate, and large variability [33]. Accordingly, all the studied soil properties displayed large variabilities, except soil pH that had a low variability in both seasons. Moreover, the sand, CaCO3, and OM content (in the dry season) had moderate variabilities.
The soil pH mean values decreased from 7.83 through the wet season to 7.64 through the dry season, and such a decline was significant. In contrast, the mean soil EC increased from 7.32 dS m−1 in the wet season to 11.44 dS m−1 in the dry season, indicating a significant build-up of 56% in soil salinity. The concentrations of soluble ions Na+, K+, Ca2+, SO42−, and HCO3 exhibited significant increases in the dry season over the wet season, and such increments were 1.6-, 2.06-, 1.84-, 2.43-, and 12.37-fold, respectively. The concentrations of Mg2+ and Cl, in addition to ESP values exhibited slight increases in the dry season compared with the wet season. The mean OM content increased from 7.51 g kg−1 in the wet season to 12.24 g kg−1 in the dry season, indicating a significant rise of 63%. The sand dominated soil particle size distribution with an average of 49.90% followed by clay (34.63%) and silt (15.47%). The dominant textural classes were clay (30 samples), sandy clay loam (12 samples), sandy loam (12 samples), loam (6 samples), sandy clay (5 samples), loamy sand (4 samples), and silt loam (1 samples). The CaCO3 content ranging from 48.0 to 146.7 g kg−1, indicates that the soils are moderately to strongly calcareous [34].

3.2. Soil Metal Bioavailability

The results in Table 2 reveal that with an exception for Cu, the DTPA-extractable concentrations of all the determined metals remained below the maximum allowable content (MAC) in agricultural soils. The Cu mean concentrations were 4.10- and 5.05-fold higher than the MAC in the wet and dry seasons, respectively. The CV values indicate that all the studied metals had high variability during the two seasons, except Ni that had moderate variability in the two seasons. On average, the metal concentration was in the order of Fe ˃ Cu ˃ Mn ˃ Zn ˃ Cr ˃ Ni ˃ Pb ˃ Ni ˃ Co, and this trend was observed during the wet and dry seasons. The statistical analysis reveals that the concentrations of Cr, Co, Cu, Fe, and Pb were similar during the two seasons with slight increases in the dry season. On the other hand, compared with the wet season, significant increases of 1.23-, 1.50-, and 1.28-fold in the concentrations of Mn, Ni, and Zn occurred during the dry season, respectively.

3.3. Metal Relationships in Soils

The correlation between metals and soil properties is given in Table 3. Correlations at p-values of 0.05 and 0.01 were set as significant and highly significant, respectively. The substantial metal relations with pH occurred in the wet season and were positive for Co and Fe but negative for Cr. Co, Fe, and Ni had highly significant positive correlations with EC, Na+, Cl, and ESP in the two seasons. Moreover, in the dry season, the same metals had further positive associations with Ca2+, Mg2+, SO42−, and HCO3. In the wet season, both Co and Fe were positively correlated with Ca2+ and Mg2+ but negatively correlated with HCO3. Both Co and Mn had substantial positive correlations with sand but negative relations with silt in the two seasons. The significant metal correlations with silt occurred during the two seasons and were positive for Cr but negative for Co and Fe. A significant negative correlation occurred between Cr and OM in the wet season, while a positive correlation was observed between Zn and OM content in the dry season. The significant metal correlations with CaCO3 occurred during the two seasons and were negative for Co and Fe but positive for Pb and Zn.
The correlations between metals were generally consistent across the two study seasons. Among the metals analyzed, Cr did not show any significant correlation with other metals. The Pb content demonstrated a highly significant positive correlation with Cu but only weak correlations with the remaining metals. Similarly, Zn showed significant positive correlations with Mn (p ˂ 0.01) and Cu (p ˂ 0.05), while showed weak correlations with the other metals. Four metals, including Co, Fe, Mn, and Ni displayed significant to highly significant positive correlations among each other. Additionally, Cu content exhibited significant positive correlations with both Mn and Zn.

3.4. Potential Sources of Metals in Soils

The results of the principal component analysis (PCA) (Table 4) revealed that seven PCs with eigenvalues above 1.0 explained 77.09 and 84.29% of the total variance in the wet and dry seasons, respectively. The PC1 represented 22.43 and 32.61% of the total variance in the wet and dry seasons, respectively. This PC was strongly correlated to EC, Na+, Mg2+, Cl, and ESP in the wet season. In the dry season, these indicators in addition Ca2+, SO42−, and HCO3 were highly correlated to PC1. PC2 with high loadings of Co, Fe, and Ni explained 11.94 and 12.50% of the total variance in the wet and dry seasons, respectively. PC3 was strongly correlated with sand (positive) and clay (negative) and responsible for 9.23 and 9.18% of the total variance in the wet and dry seasons, respectively. PC4 represented 8.97% of the total variance and was dominated by Cu and Pb in the wet season. This PC with a variance of 8.27% was highly correlated with Pb and Zn in the dry season. PC5 explained 8.79 and 7.64% of the total variance in the wet and dry seasons, respectively. This PC was highly correlated to Ca2+ and SO42− in the wet season, while to silt (negative) and Cu (positive) in the dry season. PC6 accounted for 8.33% of the total variance and was dominated by K+ (positive) and HCO3 (negative) in the wet season; meanwhile, this PC with a variance of 7.19% was highly correlated with only K+ in the dry season. PC7 accounted for 7.39 and 6.90% of the total variance in the wet and dry seasons, respectively. This PC was highly correlated with OM and Cr in the wet season but with OM only in the dry season.

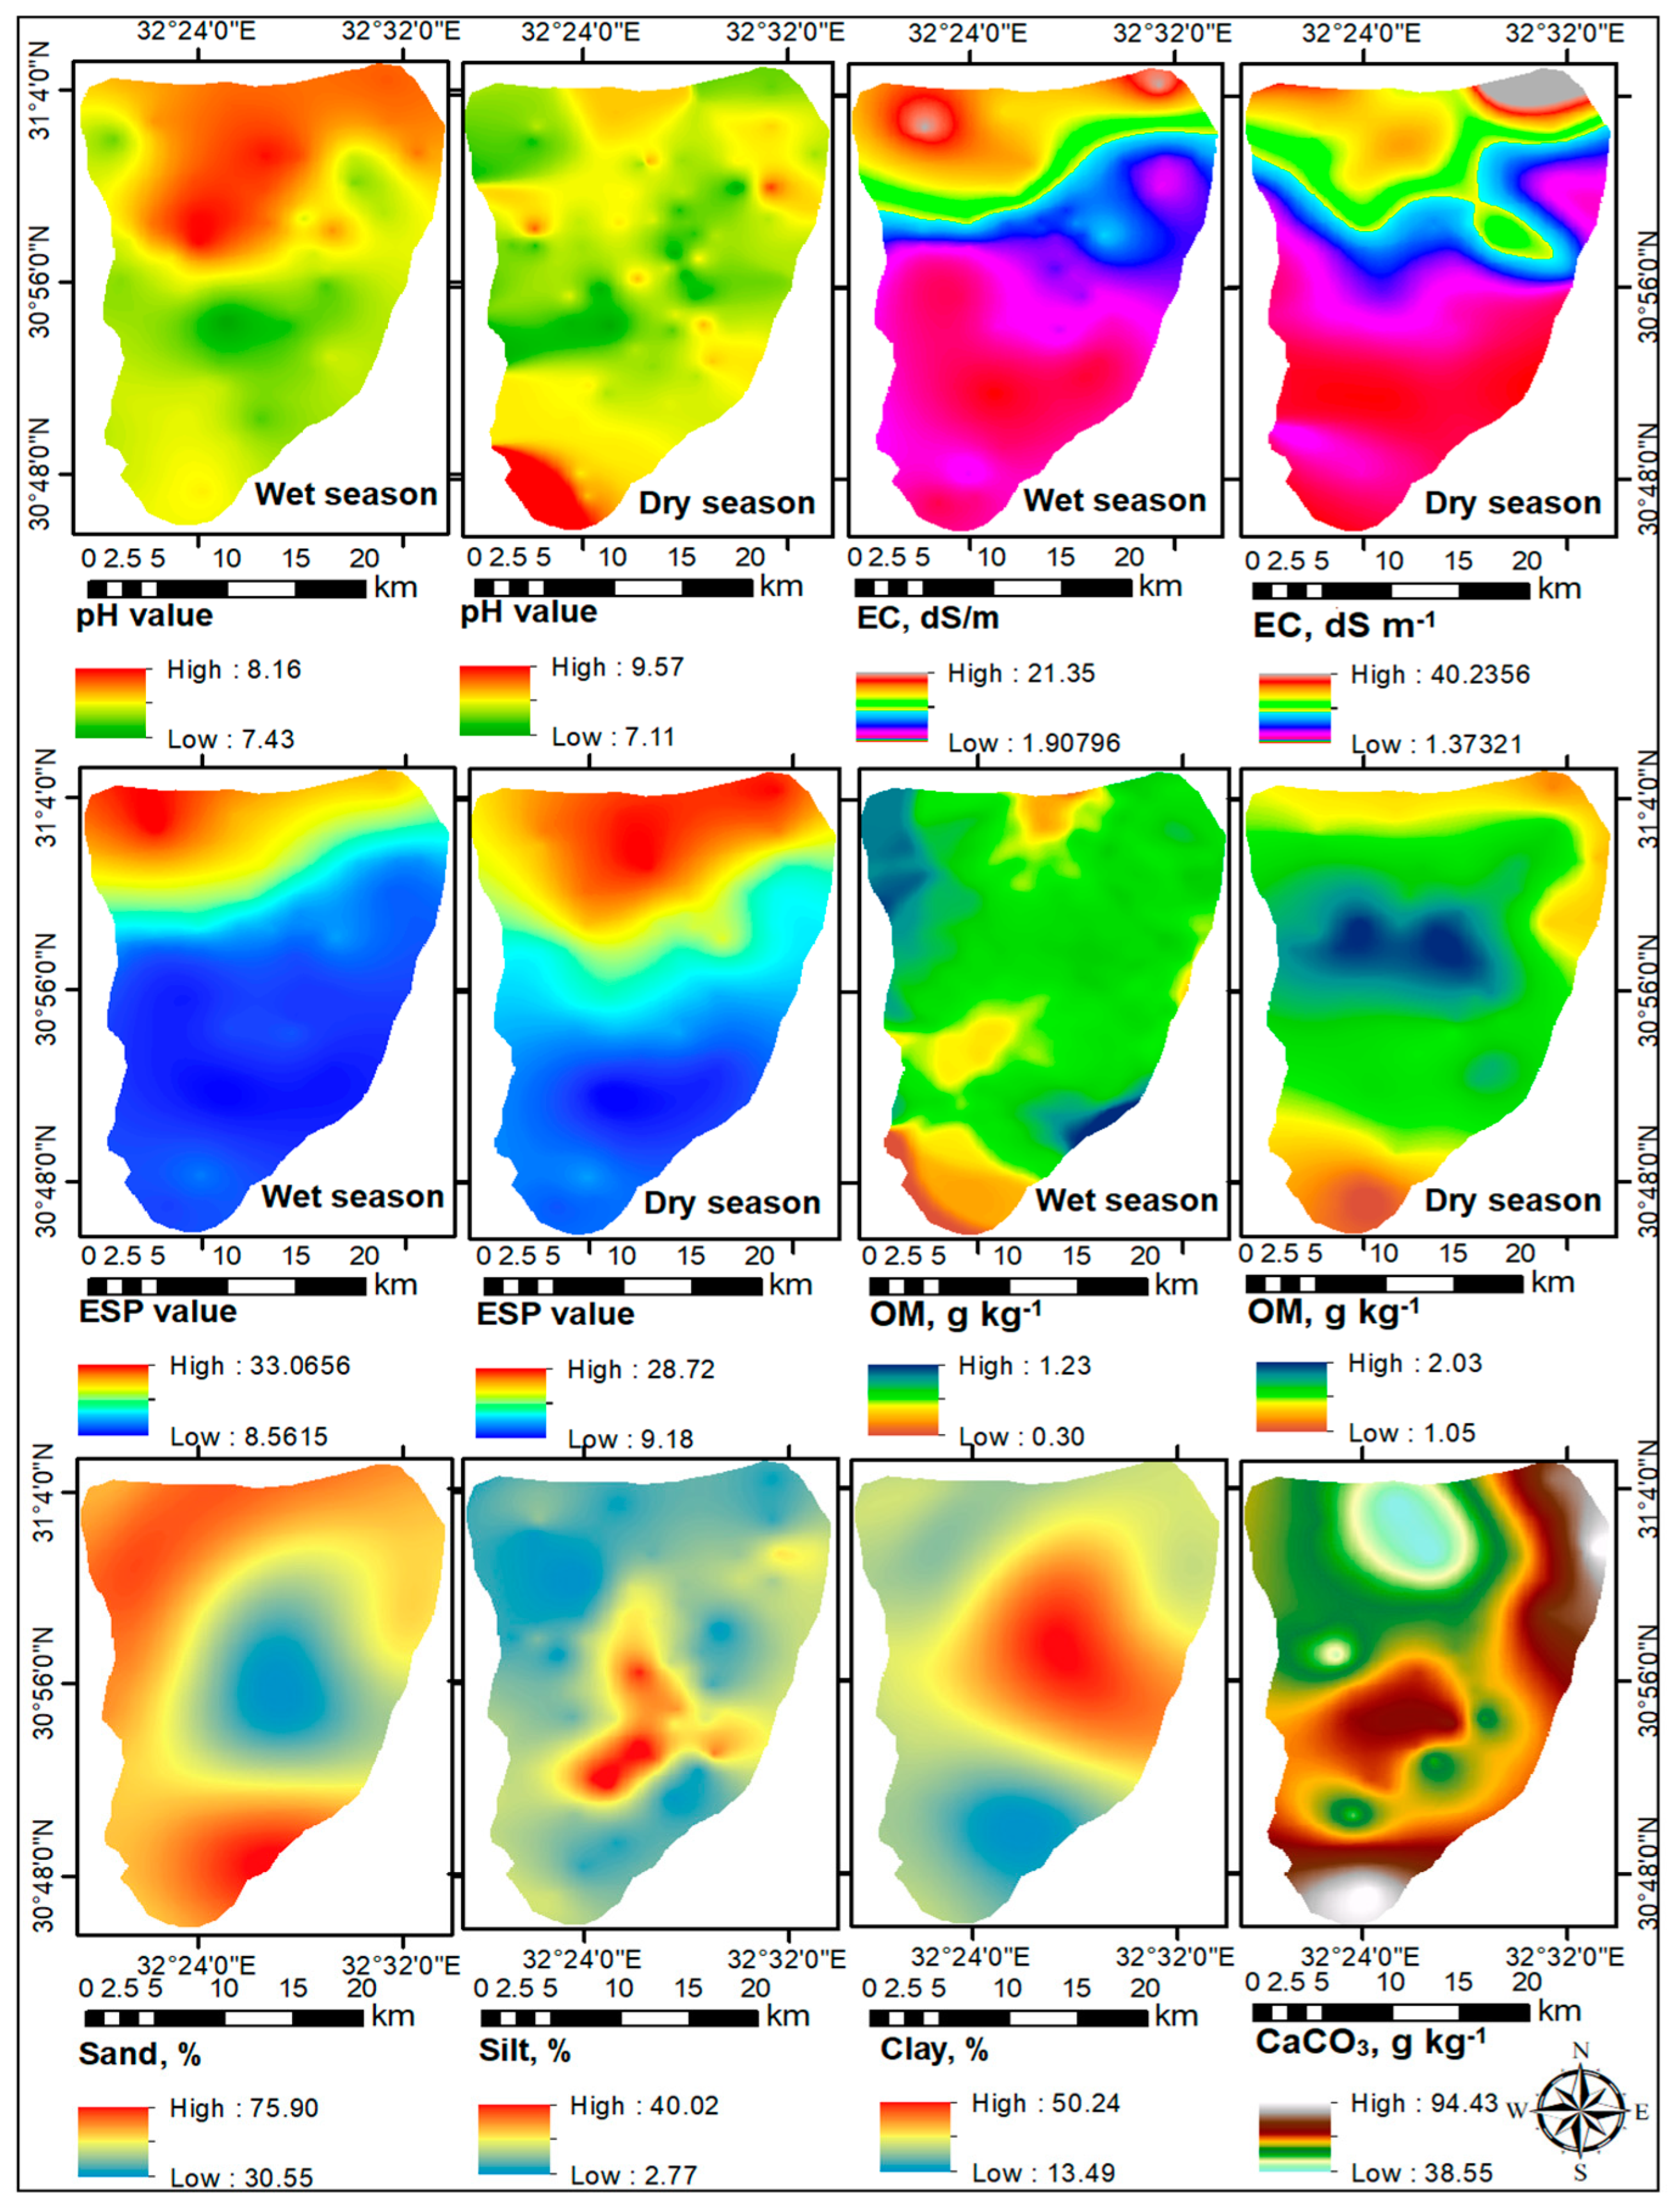
3.5. Spatial Variability of Soil Properties and Heavy Metals

The soil properties spatial distribution and metal contents are depicted through semivariograms (Figures S1 and S2) and their parameters in Table 5. The cross-validation of semivariogram models (Figures S3 and S4) indicated good correlations between the predicted and measured values for all the studied parameters. The prediction errors (Table 5) demonstrated that ME and MSE for all the applied OK models were close to zero, while the RMSSE values were close to unity. Moreover, the values of RMSE and ASE for each of the applied models were similar.
As given in Table 5, the best-fitted semivariogram models applied in the current work achieved positive nugget and sill values. The spatial dependency of data are delineated through the nugget to sill ratio. The spatial correlation is considered as strong, moderate, and low when the nugget/sill ratio is below 0.25, 0.25 to 0.75, and higher than 0.75, respectively [17]. Accordingly, the soil pH (in the dry season) and silt content showed a strong spatial correlation, while EC (in the dry season) and OM content (in the wet season) had a weak spatial correlation. The remaining attributes had a moderate spatial correlation. For HMs, Cu (in the wet season) showed a strong spatial correlation; meanwhile, Co (in the dry season), Pb (in the wet season), and Ni (in the two seasons) had a weak spatial correlation. The remaining metals displayed a moderate spatial correlation during the wet and dry seasons. The ranges of semi-variograms varied considerably from 2.13 km for Pb content in the wet season to 37.57 km for Mn content in the wet and dry seasons.
As shown in Figure 3, in the wet season, the soil pH was high in the northern parts of the studied area. In contrast, in the dry season, the highest pH level was mainly visible in the southern parts. The highest EC and ESP levels during the two seasons were mainly visible in the northern parts and tended to decrease southwards. The highest OM content in the wet season was mainly visible in small areas in the northwestern and southeastern parts. On the other hand, OM content was high in the central parts in the dry season. The sand content in the central parts was lower than in other parts of the region, while the clay and silt contents in the central parts were higher than in other parts. The highest CaCO3 content was mainly observed in the northeastern and southern parts.
The concentrations of each metal displayed a similar spatial pattern during the two seasons of study as shown in Figure 4. The concentrations of Co, Fe, and Ni were mainly high in the northern parts and tended to decrease southwards. The highest concentrations of Pb and Zn were mainly found in scattered patches in the northern, central, and southern parts. Areas with high Cr concentrations were primarily visible in the central parts. The highest concentrations of Mn were predominantly observed in the northern and southern parts of the study area. Similarly, elevated levels of Cu were primarily detected in the northeastern and southwestern areas.

4. Discussion

4.1. Seasonal Variability of Soil Properties and Metal Bioavailability

The arid regions undergo drastic seasonal fluctuations in temperature, PET, and rainfall, resulting in substantial impacts on salt dynamics in soils [37]. The irregular rainfall during the winter might cause partial leaching and downward migration of dissolved ions, leading to relatively lower levels in topsoil [38]. The higher PET in the summer exacerbates the capillary rise and increases the seepage of salt ions to the surface layers [39]. This leads to a significant build-up in soil salinity in the dry season compared with the wet season. The significant decline in soil pH in the dry season might be due to the increase in SO42− level [40]. The remarkable increase in soil OM in the dry season could be attributed to submerged conditions during rice cultivation periods that retards the decomposition of organic carbon [41]. The significant increases in the contents of Mn, Ni, and Zn in the dry season affirm the changing bioavailability of HMs in the studied region. Such seasonal fluctuations also indicate metal-specific differences [42].

4.2. Metal Associations in Soils

The correlation results highlight the significant influence of soil properties on metal behaviors. As supported by previous studies [2,9,30], HMs are often immobilized with increasing soil pH, and in the studied soils, pH rises increased metal availability, particularly affecting Co and Fe during the wet season. The increase in pH enhances the negative charges on soil colloids, thereby improving the soil’s ability to retain alkali and alkaline earth cations [5]. These cations often compete with cationic HMs for sorption sites [25], resulting in greater metal release into the soil. At pH levels above 7, free metal ions tend to form soluble complexes with inorganic anions such as chloride (Cl), sulfate (SO42−), and bicarbonate (HCO3) [43]. These observations could explain the positive relationships observed between Co, Fe, and Ni with major salt ions in the studied soils. Conversely, an increase in negatively charged sites may restrict the adsorption of CrO42− due to the electrostatic repulsion or competition with OH for the adsorption sites [44]. This process promotes the precipitation of Cr rather than its adsorption onto soil colloids.
The positive correlations between Co and Mn with sand content suggest that these metals were bound to heavy minerals (with strong sorption capacity to metal ions) of sand. Mostafa, El-Nady [45] reported that heavy minerals in the sandy beach along the Mediterranean Sea coastline near Arish City, Egypt, serve as a sinks and sources of metal contaminants. This interpretation is further supported by the negative correlations observed between Co, Fe, and Mn with silt content. On the other hand, the positive correlation between Cr and silt suggests the presence of Mn-oxides within the silt-sized aggregates. High Cr availability is often associated with active Mn-oxides, which facilitate the oxidization of stable Cr (III) to labile Cr (VI) as described in the following Equation (4) [46]:
C r O H 3 s + 1.5 M n O 2 + 2 H + H C r O 4 + 1.5 M n 2 + + 2 H 2 O
The positive correlation between soil OM and Zn indicates the presence of organic ligands capable of binding to cationic metals and forming soluble complexes [43]. Conversely, the negative correlation with Cr may indicate that high levels of soil OM enhance microbial activity and render reductive conditions. These conditions indirectly facilitate the biological reduction of labile Cr (VI) to stable Cr (III) as described in the following Equation (5) [47]:
C r O 4 + 4 H 2 O + 3 e C r ( O H ) 3 + 5 O H
The negative influence of CaCO3 on the availability of Co and Fe, suggests the formation of insoluble carbonates [48]. In contrast, the positive correlations with Pb and Zn may be attributed to the forming of weak outer-sphere complexes on the surface of calcite [5].
The inter-metal correlations revealed that the geochemical behavior of Cr in soils differs significantly from those of the remaining metals. In natural systems, Cr exists in two stable valence states, i.e., Cr (III) cations or Cr (VI) oxyanions, with the latter being more available and toxic [44]. The strong correlations among cationic metals indicate a common source or similar geochemical behavior in soils [49]. Positive associations between geogenic metals such as Co, Fe, Mn, and Ni have been reported in similar ecological conditions in Egypt [50].

4.3. Potential Metal Contamination Sources

Due to the high level of human activities in the studied region, the correlation results are not enough to identify potential sources of soil contaminants [12]. Therefore, the PCA was recognized as a powerful tool for detecting potential origins of metal pollutants in ecosystems [30,51]. In the current study, seven PCs were identified, reflecting possible sources and controlling mechanisms during the two studied seasons.
PC1 could represent abundant soluble evaporite minerals, which are common in the marine ecosystems of Egypt [52]. Major ions in the wet season were probably derived from halite (NaCl) and bischofite (MgCl2.6H2O). The seawater intrusion during the dry season might accelerate the contribution of further salts such as calcium chloride (CaCl2), nahcolite (NaHCO3), and thenardite (Na2SO4) [20]. The strong positive associations of Ca2+ and SO42− with PC5 during the wet season suggest the dissolution of less soluble sulfate-rich minerals such as gypsum (CaSO4.2H2O) and anhydrite (CaSO4) [52].
PC2 with strong associations of Co, Fe, and Ni in both seasons, may reflect the presence of labile ferromagnesian minerals [53]. Moreover, as Cr is an immobile and rock-forming element, its occurrence in soils is directly related to mafic and ultramafic rocks [54]. Thus, the strong association of Cr with PC7 during the wet season is likely due to the increased dissolution of Cr-bearing phases, i.e., serpentinites, metasediments, and talc-carbonates [55]. Conversely, the strong association of soil OM with PC7 in the dry season may indicate the influence of organic fertilizers [56]. Furthermore, Cu, Pb, and Zn are rarely associated with a particular bedrock type [55]. Therefore, the strong correlations of these metals with PC4 (in both seasons) and PC5 (in the dry season) may point to agrochemical sources, such as fertilizers and pesticides.
The contribution of Quaternary formations, which dominate the study area [57] was manifested by PC3 and PC6. The positive loading of sand with PC3 is associated with sandstone deposits, while the negative loading of clay to the same PC implies that its origin was completely different from that of sand [53]. The strong association of K with PC6 may indicate the release of K from potash feldspars as described in the following Equation (6) [58]:
K A l S i 3 O 8 + H 2 O H y d r o l y s i s H A l S i 3 O 8 + K O H
The negative correlation of HCO3 with PC6 during the wet season may reflect the contribution of calcite minerals. Normally, rainwater containing dissolved CO2 can react with insoluble CaCO3, forming soluble Ca (HCO3)2 [59].

4.4. Spatial Variability of Soil Properties and HMs

The OK models employed in this study demonstrated reliable predictive accuracy for the unsampled sites. This assumption was affirmed through prediction errors since minimal values for ME and MSE in addition to an ideal value for RMSSE occurred. Moreover, ASE and RMSE for each of the applied models were similar [32]. On the one hand, values of ME and MSE close to zero indicate that the applied OK model could provide unbiased prediction. On the other hand, ME ˃ 0 or ˂ 0 underestimate or overestimate of data variability, respectively [15]. The RMSSE values close to 1 indicate high robust prediction accuracy for the selected models [32].
The semivariogram parameters, including nugget, sill, range, and nugget/sill ratio portray the spatial structure of soil attributes. The random and general variance of spatial parameters is expressed by nugget effect and sill value, respectively [16]. Thus, achieving semivariogram sill values implies that soil data have a spatial structure [60]. The nugget/sill ratio depicts the level of spatial autocorrelation of a soil property [17]. The weak level indicates the substantial impact of stochastic processes like irrigation, fertilization, and cropping patterns on geographic variability. The strong level reveals that natural factors such as climate, soil minerals, and terrain are the primary drivers for geographic variability [61]. The moderate level, in turn, reflects the mutual influence of intrinsic as well as extrinsic causes.
The semivariogram range points to extreme interval of correlation among sampling locations, where high and low range values indicate large and small-scale variabilities, respectively [60]. At regional scales, the high range indicates a potent dual impact of intrinsic and extrinsic factors [17]. Thus, interactions of natural and stochastic processes were more evident for Mn but less important for Pb, which had the largest and lowest range, respectively. Dad and Ul Shafiq [17], reported that the semivariogram range also determines proper sampling density, which should be lower than half of this range. These advocates carrying out further trials in the studied region adopting sampling distances of nearly 4, 2, 3, 13, 1, 19, 2, and 3 km for Co, Cr, Cu, Fe, Pb, Mn, Ni, and Zn, respectively.
The kriged maps provided additional insights into the primary mechanisms and factors affecting metal bioavailability in soils. Concentrations of Co, Fe, and Mn tended to increase seaward following the distributions of pH (in the wet season), EC, and ESP. This suggests that adsorption–desorption processes and complexation with inorganic ligands were the dominant reactions controlling these metals [24]. In contrast, the distributions of Cr and silt were similar and differed from those of OM and pH (during the wet season). Thus, Cr availability might be exclusively regulated by redox reactions dependent on active Mn oxides and OM [54]. The highest Mn concentrations were observed in areas with high sand content but low silt and clay, implies that dissolution–precipitation reactions might govern the reactivity of Mn-bearing minerals, which often occur as small nodules on sand particles [62]. The spatial distributions of Cu, Pb, and Zn closely resembled that of CaCO3, indicating that these metals were bound to carbonate minerals through non-specific adsorption (or ion exchange) reactions [9].

5. Conclusions

This study demonstrates the complex and dynamic interactions between soil properties and HM bioavailability, with a focus on wetting–drying cycles and spatial variability in coastal salt-affected soils under arid conditions. The drastic seasonal fluctuations in temperature, PET, and rainfall significantly influence soil properties (pH, EC, OM, and soluble ions), which in turn impact metal behaviour and availability. Seasonal changes resulted in pronounced differences in HMs bioavailability, with metals such as Mn, Ni, and Zn becoming more bioavailable in the dry season.
The pH rise during the wet season enhances metal availability by increasing negative charges on soil colloids, which affects the sorption Co, Fe, and Ni. Conversely, elevated levels of OM in the dry season can influence the binding of Zn through organic ligands, while promoting the reduction of Cr (VI) to the more stable and less toxic Cr (III) in reductive environments. This study also illustrates how Co and Mn are associated with heavy minerals in sandy soils, while Cr availability is associated with Mn-oxide activity in silt-sized aggregates.
Spatial variability revealed that both natural factors (soil minerals and climate) and anthropogenic activities (irrigation and fertilization) drive the distribution of HMs across the landscape. The spatial structure of soil data indicates that the interaction between intrinsic (natural) and extrinsic (human-induced) factors controls metal variability. Co, Fe, and Mn tend to follow the distribution of pH, salinity, and sodicity, indicating that adsorption–desorption and complexation reactions with inorganic ligands are key processes regulating their behaviours. In contrast, Cr’s unique geochemical behaviours is primarily governed by redox reactions involving Mn-oxides and organic matter. The spatial distribution of Cu, Pb, and Zn is closely associated with carbonate minerals, suggesting non-specific adsorption and ion exchange as primary mechanisms.
Overall, this study underscores the importance of understanding both seasonal and spatial variability when assessing HMs contamination in soils. These results highlight the need for adaptive management strategies that consider dynamic conditions and geochemical processes affecting HMs behaviour to mitigate potential risks. The current study indicates that the high levels of metal contaminants in coastal salt-affected soils impose additional limitations, particularly during the dry season, which should be considered when restoring these soils. However, further studies are essential to expand the conclusions of this study to other environmental conditions.

Supplementary Materials

The following supporting information can be downloaded at: https://www.mdpi.com/article/10.3390/soilsystems9010026/s1, Figure S1: Experimental semivariograms and their best-fitted models for soil properties.; Figure S2: Experimental semivariograms and their best-fitted models for heavy metals.; Figure S3: Cross-validation test of the applied ordinary kriging models for soil properties.; Figure S4: Cross-validation test of the applied ordinary kriging models for heavy metals.

Author Contributions

Conceptualization, M.S.E.-K., A.S.A., M.E.F., M.D., A.S. and M.S.A.-H.; methodology, M.S.E.-K., A.S.A., M.E.F. and M.S.A.-H.; software, M.S.E.-K., A.S.A., M.E.F., M.D. and M.S.A.-H.; validation, M.S.E.-K., A.S.A., M.E.F. and M.S.A.-H.; formal analysis, M.S.E.-K., A.S.A., M.E.F. and M.S.A.-H.; investigation, M.S.E.-K., A.S.A. and M.S.A.-H.; resources, M.S.E.-K., A.S.A., M.E.F., M.D., A.S. and M.S.A.-H.; data curation, M.S.E.-K., A.S.A., M.E.F., M.D., A.S. and M.S.A.-H.; writing—original draft preparation, M.S.E.-K., A.S.A., M.E.F. and M.S.A.-H.; writing—review and editing, M.S.E.-K., A.S.A., M.E.F., M.D., A.S. and M.S.A.-H.; visualization, M.S.E.-K., A.S.A., M.E.F., M.D., A.S. and M.S.A.-H.; supervision, M.S.E.-K., A.S.A., M.E.F., M.D., A.S. and M.S.A.-H.; project administration, M.S.E.-K., A.S.A., M.E.F., M.D., A.S. and M.S.A.-H.; funding acquisition, M.S.E.-K., A.S.A., M.E.F., M.D., A.S. and M.S.A.-H. All authors have read and agreed to the published version of the manuscript.

Funding

This research received no external funding.

Institutional Review Board Statement

Not applicable.

Informed Consent Statement

Not applicable.

Data Availability Statement

Data are contained within the article.

Acknowledgments

The manuscript presented is a scientific collaboration between scientific institutions in two countries (Egypt and Italy). The authors would like to thank Benah University, National Water Research Center (NWRC), Agricultural Research Center (ARC), National Authority for Remote Sensing and Space Science (NARSS), and University of Basilicata for support with the field survey and data analysis.

Conflicts of Interest

The authors declare no conflicts of interest.

References

  1. Adnan, M.; Xiao, B.; Ali, M.U.; Xiao, P.; Zhao, P.; Wang, H.; Bibi, S. Heavy metals pollution from smelting activities: A threat to soil and groundwater. Ecotoxicol. Environ. Saf. 2024, 274, 116189. [Google Scholar] [CrossRef] [PubMed]
  2. Deng, S.; Zhang, X.; Zhu, Y.; Zhuo, R. Recent advances in phyto-combined remediation of heavy metal pollution in soil. Biotechnol. Adv. 2024, 72, 108337. [Google Scholar] [CrossRef]
  3. Akansha, J.; Thakur, S.; Chaithanya, M.S.; Gupta, B.S.; Das, S.; Das, B.; Rajasekar, N.; Priya, K. Technological and economic analysis of electrokinetic remediation of contaminated soil: A global perspective and its application in Indian scenario. Heliyon 2024, 10, e24293. [Google Scholar] [CrossRef] [PubMed]
  4. Lin, G.; Wang, K.; He, X.; Yang, Z.; Wang, L. Characterization of physicochemical parameters and bioavailable heavy metals and their interactions with microbial community in arsenic-contaminated soils and sediments. Environ. Sci. Pollut. Res. 2022, 29, 49672–49683. [Google Scholar] [CrossRef] [PubMed]
  5. Rate, A.W. Inorganic contaminants in urban soils. In Urban Soils: Principles and Practice; Rate, A.W., Ed.; Springer International Publishing: Cham, Switzerland, 2022; pp. 153–199. [Google Scholar]
  6. Yang, Q.F.; Wang, S.L.; Nan, Z.R. Migration, accumulation, and risk assessment of potentially toxic elements in soil-plant (shrub and herbage) systems at typical polymetallic mines in Northwest China. Environ. Sci. Pollut. Res. 2023, 30, 46092–46106. [Google Scholar] [CrossRef]
  7. Abuzaid, A.S.; Bassouny, M.A.; Jahin, H.S.; Abdelhafez, A.A. Stabilization of lead and copper in a contaminated Typic Torripsament soil using humic substances. CLEAN Soil, Air, Water 2019, 47, 1800309. [Google Scholar] [CrossRef]
  8. Li, Z.; Jiao, W.; Li, R.; Yu, Z.; Song, N.; Liu, J.; Zong, H.; Wang, F. Source apportionment and source-specific risk assessment of bioavailable metals in river sediments of an anthropogenically influenced watershed in China. Sci. Total Environ. 2024, 912, 169367. [Google Scholar] [CrossRef]
  9. Alamgir, M. The effects of soil properties to the extent of soil contamination with metals. In Environmental Remediation Technologies for Metal-Contaminated Soils; Hasegawa, H., Rahman, I.M.M., Rahman, M.A., Eds.; Springer: Tokyo, Japan, 2016; pp. 1–19. [Google Scholar]
  10. Abuzaid, A.S.; El-Komy, M.S.; Shokr, M.S.; El Baroudy, A.A.; Mohamed, E.S.; Rebouh, N.Y.; Abdel-Hai, M.S. Predicting dynamics of soil salinity and sodicity using remote sensing techniques: A landscape-scale assessment in the northeastern Egypt. Sustainability 2023, 15, 9440. [Google Scholar] [CrossRef]
  11. Wang, Z.; Han, R.X.; Muhammad, A.; Guan, D.X.; Zama, E.; Li, G. Correlative distribution of DOM and heavy metals in the soils of the Zhangxi watershed in Ningbo city, East of China. Environ. Pollut. 2022, 299, 118811. [Google Scholar] [CrossRef]
  12. Ren, J.; Chen, J.; Han, L.; Wang, M.; Yang, B.; Du, P.; Li, F. Spatial distribution of heavy metals, salinity and alkalinity in soils around bauxite residue disposal area. Sci. Total Environ. 2018, 628–629, 1200–1208. [Google Scholar] [CrossRef]
  13. Zhen, J.; Pei, T.; Xie, S. Kriging methods with auxiliary nighttime lights data to detect potentially toxic metals concentrations in soil. Sci. Total Environ. 2019, 659, 363–371. [Google Scholar] [CrossRef]
  14. Shi, C.; Wang, Y. Non-parametric machine learning methods for interpolation of spatially varying non-stationary and non-Gaussian geotechnical properties. Geosci. Front. 2021, 12, 339–350. [Google Scholar] [CrossRef]
  15. Abuzaid, A.S.; Mazrou, Y.S.A.; El Baroudy, A.A.; Ding, Z.; Shokr, M.S. Multi-Indicator and geospatial based approaches for assessing variation of land quality in arid agroecosystems. Sustainability 2022, 14, 5840. [Google Scholar] [CrossRef]
  16. Golden, N.; Zhang, C.; Potito, A.; Gibson, P.J.; Bargary, N.; Morrison, L. Use of ordinary cokriging with magnetic susceptibility for mapping lead concentrations in soils of an urban contaminated site. J. Soils Sed. 2020, 20, 1357–1370. [Google Scholar] [CrossRef]
  17. Dad, J.M.; Ul Shafiq, M. Spatial variability and delineation of management zones based on soil micronutrient status in apple orchard soils of Kashmir valley, India. Environ. Monit. Assess. 2021, 193, 797. [Google Scholar] [CrossRef]
  18. Dagar, J.C.; Gupta, S.R.; Gaur, A. Tree-based farming systems for improving productivity and ecosystem services in saline environments of dry regions: An overview. Farming Syst. 2023, 1, 100003. [Google Scholar] [CrossRef]
  19. Devkota, K.P.; Devkota, M.; Rezaei, M.; Oosterbaan, R. Managing salinity for sustainable agricultural production in salt-affected soils of irrigated drylands. Agric. Syst. 2022, 198, 103390. [Google Scholar] [CrossRef]
  20. Stavi, I.; Thevs, N.; Priori, S. Soil salinity and sodicity in drylands: A review of causes, effects, monitoring, and restoration measures. Front. Environ. Sci. 2021, 9, 712831. [Google Scholar] [CrossRef]
  21. Kebede, F. Status, drivers, and suggested management scenarios of salt-affected soils in Africa. In Biosaline Agriculture as a Climate Change Adaptation for Food Security; Choukr-Allah, R., Ragab, R., Eds.; Springer International Publishing: Cham, Switzerland, 2023; pp. 259–284. [Google Scholar]
  22. Acosta, J.A.; Jansen, B.; Kalbitz, K.; Faz, A.; Martínez-Martínez, S. Salinity increases mobility of heavy metals in soils. Chemosphere 2011, 85, 1318–1324. [Google Scholar] [CrossRef]
  23. Chu, B.; Chen, X.J.; Li, Q.S.; Yang, Y.F.; Mei, X.Q.; He, B.Y.; Li, H.; Tan, L. Effects of salinity on the transformation of heavy metals in tropical estuary wetland soil. Chem. Ecol. 2015, 31, 186–198. [Google Scholar] [CrossRef]
  24. Palansooriya, K.N.; Shaheen, S.M.; Chen, S.S.; Tsang, D.C.W.; Hashimoto, Y.; Hou, D.; Bolan, N.S.; Rinklebe, J.; Ok, Y.S. Soil amendments for immobilization of potentially toxic elements in contaminated soils: A critical review. Environ. Int. 2020, 134, 105046. [Google Scholar] [CrossRef] [PubMed]
  25. Zhong, X.; Chen, Z.; Li, Y.; Ding, K.; Liu, W.; Liu, Y.; Yuan, Y.; Zhang, M.; Baker, A.J.M.; Yang, W.; et al. Factors influencing heavy metal availability and risk assessment of soils at typical metal mines in Eastern China. J. Hazard. Mater. 2020, 400, 123289. [Google Scholar] [CrossRef]
  26. Ouda, S.; Khalifa, H.; Mohamadin, A.; Zohry, A.E.-H. Sustainable use of soil and water resources to combat degradation. In Global Segradation of Soil and Water Resources: Regional Assessment and Strategies; Li, R., Napier, T.L., El-Swaify, S.A., Sabir, M., Rienzi, E., Eds.; Springer Nature: Singapore, 2022; pp. 61–74. [Google Scholar]
  27. Soil Survey Staff. Soil Survey Field and Laboratory Methods Manual; Soil Survey Investigations Report No. 51, Version 2.0; Burt, R., Soil Survey Staff, Eds.; U.S. Department of Agriculture, Natural Resources Conservation Service: Washington, DC, USA, 2014.
  28. Lindsay, W.L.; Norvell, W.A. Development of a DTPA soil test for zinc, iron, manganese, and copper. Soil Sci. Soc. Am. J. 1978, 42, 421–428. [Google Scholar] [CrossRef]
  29. Abuzaid, A.S.; Jahin, H.S. Combinations of multivariate statistical analysis and analytical hierarchical process for indexing surface water quality under arid conditions. J. Contam. Hydrol. 2022, 248, 104005. [Google Scholar] [CrossRef]
  30. Bai, J.H.; Zhao, Q.Q.; Wang, W.; Wang, X.; Jia, J.; Cui, B.S.; Liu, X.H. Arsenic and heavy metals pollution along a salinity gradient in drained coastal wetland soils: Depth distributions, sources and toxic risks. Ecol. Indic. 2019, 96, 91–98. [Google Scholar] [CrossRef]
  31. Santra, P.; Kumar, M.; Panwar, N.R.; Yadav, R.S. Digital soil mapping: The future need of sustainable soil management. In Geospatial Technologies for Crops and Soils; Mitran, T., Meena, R.S., Chakraborty, A., Eds.; Springer: Singapore, 2021; pp. 319–355. [Google Scholar]
  32. Sebei, A.; Chaabani, A.; Abdelmalek-Babbou, C.; Helali, M.A.; Dhahri, F.; Chaabani, F. Evaluation of pollution by heavy metals of an abandoned Pb-Zn mine in northern Tunisia using sequential fractionation and geostatistical mapping. Environ. Sci. Pollut. Res. 2020, 27, 43942–43957. [Google Scholar] [CrossRef]
  33. Mammadov, E.; Denk, M.; Riedel, F.; Lewinska, K.; Kazmierowski, C.; Glaesser, C. Visible and near-infrared reflectance spectroscopy for assessment of soil properties in the Caucasus Mountains, Azerbaijan. Commun. Soil Sci. Plant Anal. 2020, 51, 2111–2136. [Google Scholar] [CrossRef]
  34. FAO. Guidelines for Soil Description, 4th ed.; Food and Agriculture Organization of the United Nations (FAO): Rome, Italy, 2006. [Google Scholar]
  35. Yang, Z.; Jing, F.; Chen, X.; Liu, W.; Guo, B.; Lin, G.; Huang, R.; Liu, W. Spatial distribution and sources of seven available heavy metals in the paddy soil of red region in Hunan Province of China. Environ. Monit. Assess. 2018, 190, 611. [Google Scholar] [CrossRef]
  36. Rezapour, S.; Kouhinezhad, P.; Samadi, A. Trace metals toxicity in relation to long-term intensive agricultural production in a calcareous environment with different soil types. Nat. Hazards 2020, 100, 551–570. [Google Scholar] [CrossRef]
  37. Jafari, M.; Tavili, A.; Panahi, F.; Zandi Esfahan, E.; Ghorbani, M. Characteristics of arid and desert ecosystems. In Reclamation of arid Lands; Jafari, M., Tavili, A., Panahi, F., Zandi Esfahan, E., Ghorbani, M., Eds.; Springer International Publishing: Cham, Switzerland, 2018; pp. 21–91. [Google Scholar]
  38. Wang, J.; Ding, J.; Yu, D.; Ma, X.; Zhang, Z.; Ge, X.; Teng, D.; Li, X.; Liang, J.; Lizaga, I.; et al. Capability of Sentinel-2 MSI data for monitoring and mapping of soil salinity in dry and wet seasons in the Ebinur Lake region, Xinjiang, China. Geoderma 2019, 353, 172–187. [Google Scholar] [CrossRef]
  39. Jia, P.; Shang, T.; Zhang, J.; Sun, Y. Inversion of soil pH during the dry and wet seasons in the Yinbei region of Ningxia, China, based on multi-source remote sensing data. Geoderma Reg. 2021, 25, e00399. [Google Scholar] [CrossRef]
  40. Hopkins, B.G.; Stark, J.C.; Kelling, K.A. Nutrient management. In Potato Production Systems; Stark, J.C., Thornton, M., Nolte, P., Eds.; Springer International Publishing: Cham, Switzerland, 2020; pp. 155–202. [Google Scholar]
  41. Liang, G.; Reed, S.C.; Stark, J.M.; Waring, B.G. Unraveling mechanisms underlying effects of wetting–drying cycles on soil respiration in a dryland. Biogeochemistry 2023, 166, 23–37. [Google Scholar] [CrossRef]
  42. Weng, N.Y.; Wang, W.X. Seasonal fluctuations of metal bioaccumulation and reproductive health of local oyster populations in a large contaminated estuary. Environ. Pollut. 2019, 250, 175–185. [Google Scholar] [CrossRef]
  43. Buzea, C.; Pacheco, I. Heavy metals: Definition, toxicity, and uptake in plants. In Cellular and Molecular Phytotoxicity of Heavy Metals; Faisal, M., Saquib, Q., Alatar, A.A., Al-Khedhairy, A.A., Eds.; Springer International Publishing: Cham, Switzerland, 2020; pp. 1–17. [Google Scholar]
  44. Yang, Y.; Peng, Y.; Ma, Y.; Chen, G.; Li, F.; Liu, T. Effects of aging and reduction processes on Cr toxicity to wheat root elongation in Cr(VI) spiked soils. Environ. Pollut. 2022, 296, 118784. [Google Scholar] [CrossRef]
  45. Mostafa, M.T.; El-Nady, H.; Gomaa, R.M.; Salman, S.A.; Khalifa, I.H. Contamination and sediment quality evaluation of toxic metals enrichment in heavy mineral-rich beach sands of Arish City, Northeastern Egypt. Euro-Mediter. J. Environ. Integr. 2024, 9, 7–22. [Google Scholar] [CrossRef]
  46. Kong, X.; Wang, Y.; Ma, L.; Li, H.; Han, Z. Impact of δ-MnO2 on the chemical speciation and fractionation of Cr(III) in contaminated soils. Environ. Sci. Pollut. Res. 2022, 29, 45328–45337. [Google Scholar] [CrossRef]
  47. Gonnelli, C.; Renella, G. Chromium and nickel. In Heavy Metals in Soils: Trace Metals and Metalloids in Soils and Their Bioavailability; Alloway, B.J., Ed.; Springer Netherlands: Dordrecht, The Netherlands, 2013; pp. 313–333. [Google Scholar]
  48. He, G.D.; Zhang, Z.M.; Wu, X.L.; Cui, M.Y.; Zhang, J.C.; Huang, X.F. Adsorption of heavy metals on soil collected from Lixisol of typical karst areas in the presence of CaCO3 and soil clay and their competition behavior. Sustainability 2020, 12, 7315. [Google Scholar] [CrossRef]
  49. Abuzaid, A.S.; Bassouny, M.A. Total and DTPA-extractable forms of potentially toxic metals in soils of rice fields, north Nile Delta of Egypt. Environ. Technol. Innov. 2020, 18, 100717. [Google Scholar] [CrossRef]
  50. Abuzaid, A.S.; Jahin, H.S. Profile distribution and source identification of potentially toxic elements in north Nile Delta, Egypt. Soil Sedim. Contam. 2019, 28, 582–600. [Google Scholar] [CrossRef]
  51. Jahin, H.S.; Abuzaid, A.S.; Abdellatif, D.A. Using multivariate analysis to develop irrigation water quality index for surface water in Kafr El-Sheikh Governorate, Egypt. Environ. Technol. Innov. 2020, 17, 100532. [Google Scholar] [CrossRef]
  52. Hamdan, M.A.; Hassan, F.A. Quaternary of Egypt. In The Geology of Egypt; Hamimi, Z., El-Barkooky, A., Frías, J.M., Fritz, H., Abd El-Rahman, Y., Eds.; Springer Nature AG: Cham, Switzerland, 2020; pp. 445–494. [Google Scholar]
  53. Garzanti, E.; Andò, S.; Limonta, M.; Fielding, L.; Najman, Y. Diagenetic control on mineralogical suites in sand, silt, and mud (Cenozoic Nile Delta): Implications for provenance reconstructions. Earth-Sci. Rev. 2018, 185, 122–139. [Google Scholar] [CrossRef]
  54. Zulfiqar, U.; Haider, F.U.; Ahmad, M.; Hussain, S.; Maqsood, M.F.; Ishfaq, M.; Shahzad, B.; Waqas, M.M.; Ali, B.; Tayyab, M.N.; et al. Chromium toxicity, speciation, and remediation strategies in soil-plant interface: A critical review. Front. Plant Sci. 2023, 13, 1081624. [Google Scholar] [CrossRef] [PubMed]
  55. Redwan, M.; Bamousa, A.O. Characterization and environmental impact assessment of gold mine tailings in arid regions: A case study of Barramiya gold mine area, Eastern Desert, Egypt. J. Afr. Earth Sci. 2019, 160, 103644. [Google Scholar] [CrossRef]
  56. Shokr, M.S.; Abdellatif, M.A.; El Behairy, R.A.; Abdelhameed, H.H.; El Baroudy, A.A.; Mohamed, E.S.; Rebouh, N.Y.; Ding, Z.; Abuzaid, A.S. Assessment of potential heavy metal contamination hazards based on GIS and multivariate analysis in some Mediterranean zones. Agronomy 2022, 12, 3220. [Google Scholar] [CrossRef]
  57. Elbasiouny, H.; Elbehiry, F. Geology. In The Soils of Egypt; El-Ramady, H., Alshaal, T., Bakr, N., Elbana, T., Mohamed, E., Belal, A., Eds.; Springer Nature Switzerland AG: Cham, Switzerland, 2019; pp. 93–110. [Google Scholar]
  58. Osman, K.T. Soil as a part of the lithosphere. In Soils: Principles, Properties and Management; Osman, K.T., Ed.; Springer: Dordrecht, The Netherlands, 2013; pp. 9–16. [Google Scholar]
  59. Chhabra, R. Nature and origin of salts, classification, area and distribution of salt-affected soils. In Salt-Affected Soils and Marginal Waters: Global Perspectives and Sustainable Management; Chhabra, R., Ed.; Springer International Publishing: Cham, Switzerland, 2021; pp. 1–47. [Google Scholar]
  60. Abuzaid, A.S.; Jahin, H.S.; Shokr, M.S.; El Baroudy, A.A.; Mohamed, E.S.; Rebouh, N.Y.; Bassouny, M.A. A novel regional-scale assessment of soil metal pollution in arid agroecosystems. Agronomy 2023, 13, 161. [Google Scholar] [CrossRef]
  61. Arumugam, T.; Kinattinkara, S.; Nambron, D.; Velusamy, S.; Shanmugamoorthy, M.; Pradeep, T.; Mageshkumar, P. An integration of soil characteristics by using GIS based Geostatistics and multivariate statistics analysis sultan Batheri block, Wayanad District, India. Urban Clim. 2022, 46, 101339. [Google Scholar] [CrossRef]
  62. Grangeon, S.; Bataillard, P.; Coussy, S. The nature of manganese oxides in soils and their role as scavengers of trace elements: Implication for soil remediation. In Environmental Soil Remediation and Rehabilitation: Existing and Innovative Solutions; van Hullebusch, E.D., Huguenot, D., Pechaud, Y., Simonnot, M.-O., Colombano, S., Eds.; Springer International Publishing: Cham, Switzerland, 2020; pp. 399–429. [Google Scholar]
Figure 1. Location map of the study area.
Soilsystems 09 00026 g001
Figure 2. Mean monthly temperature and rainfall (average from 2010 to 2022) in the studied area.
Soilsystems 09 00026 g002
Figure 3. Spatial distribution maps of soil properties.
Soilsystems 09 00026 g003
Figure 4. Spatial distribution maps of metal concentrations in soils.
Soilsystems 09 00026 g004
Table 1. Descriptive statistics of main soil properties.
PropertyUnitSeasonMinimumMaximumMeanCV, %
pH---Wet7.108.527.83 a3.53
Dry7.109.607.64 b4.74
ECdS m−1Wet0.1731.307.32 b106.31
Dry0.2961.0011.43 a127.29
Na+mmolC L−1Wet1.10270.5852.24 b121.46
Dry1.96478.0083.69 a130.87
K+Wet0.023.740.68 b103.05
Dry0.027.801.41 a101.33
Ca2+Wet0.1049.909.55 b97.95
Dry0.5077.2017.61 a122.96
Mg2+Wet0.1449.5811.07 a100.14
Dry0.2590.8012.49 a131.11
ClWet0.04296.2061.08 a125.92
Dry1.80470.0069.44 a134.74
SO42−Wet0.0076.9910.87 b141.71
Dry0.69137.0026.44 b119.60
HCO3−Wet0.206.001.63 b66.26
Dry0.66112.0020.14 a138.94
ESP---Wet0.8351.1514.14 a83.42
Dry3.3546.1317.98 a63.10
OMg kg−1Wet1.0016.007.51 b56.12
Dry1.0021.0012.24 a42.85
Sand%All16.0088.0049.9042.83
Silt2.0046.0015.4770.05
Clay6.0064.0034.6350.57
CaCO3g kg−148.00146.7067.0229.63
CV, coefficient of variation; EC, electrical conductivity; ESP, exchangeable sodium percentage; OM organic matter. Means with different letters indicate significant difference at the 0.05 probability level.
Table 2. Descriptive statistics of the DTPA-extractable concentrations of heavy metals.
MetalWet Season Dry SeasonMAC
RangeMeanCV, %RangeMeanCV, %
Cr0.04–0.2820.16 a96.040.05–1.10.19 a96.160.50 1
Co0.01–0.030.014 a112.500.01–0.040.016 a99.09NA
Cu0.14–3.120.82 a67.270.17–3.811.01 a67.530.20 1
Fe0.01–39.4514.21 a73.650.01–48.2117.37 a73.65NA
Pb0.01–0.090.031 a73.120.01–0.110.034 a74.0315.0 1
Mn0.01–2.110.70 b60.120.02–2.580.86 a59.8830.0 2
Ni0.02–0.120.04 b42.120.02–0.150.06 a42.501.0 1
Zn0.05–0.560.18 b53.570.07–0.680.23 a53.780.50 1
Means with different letters indicate significant difference at the 0.05 probability level. CV, coefficient of variation; MAC, maximum allowable content, NA, not available. 1 According to Yang et al., 2018 [35]. 2 According to Rezapour et al., 2020 [36].
Table 3. Correlation matrix between metal concentrations and main soil properties.
Wet Season
pHECNa+K+Ca2+Mg2+ClSO42−HCO3ESPSandSiltClayOMCaCO3CrCoCuFePbMnNi
Cr−0.28 *−0.16−0.14−0.08−0.14−0.18−0.14−0.150.12−0.09−0.140.30 *−0.01−0.25 *0.201.00
Co0.36 **0.50 **0.49 **0.100.30 *0.42 **0.51 **−0.03−0.38 **0.51 **0.31 *−0.40 **−0.130.11−0.040 **−0.181.00
Cu0.05−0.04−0.02−0.10−0.13−0.05−0.060.110.240.040.05−0.110.01−0.140.17−0.12−0.121.00
Fe0.28 *0.51 **0.51 **0.120.26 *0.45 **0.53 **−0.04−0.37 **0.52 **0.17−0.32 *−0.010.02−0.41 **−0.140.90 **−0.021.00
Pb0.000.030.070.07−0.13−0.100.05−0.080.130.090.030.05−0.06−0.210.31 *0.17−0.250.43 **−0.191.00
Mn0.170.180.17−0.030.140.160.170.020.140.240.33 **−0.29 *−0.22−0.07−0.05−0.150.43 **0.31 *0.40 **0.221.00
Ni0.210.33 **0.34 **−0.030.140.230.36 **−0.11−0.150.38 **0.14−0.23−0.030.15−0.02−0.030.60 **−0.050.58 **−0.080.310 *1.00
Zn0.11−0.04−0.03−0.07−0.09−0.08−0.03−0.090.090.000.08−0.04−0.080.110.29 *−0.200.050.26 *0.090.230.33 **0.22
Dry season
pHECNa+K+Ca2+Mg2+ClSO42−HCO3−ESPSandSiltClayOMCaCO3CrCoCuFePbMnNi
Cr0.08−0.14−0.14−0.21−0.20−0.09−0.11−0.16−0.22−0.17−0.150.29 *−0.01−0.120.201.00
Co0.070.52 **0.51 **0.190.058 **0.462 **0.48 **0.53 **0.53 **0.54 **0.27 *−0.42 **−0.07−0.12−0.34 *−0.221.00
Cu0.13−0.11−0.10−0.20−0.09−0.13−0.11−0.14−0.03−0.040.05−0.110.01−0.190.17−0.12−0.011.00
Fe0.120.41 **0.40 **0.210.50 **0.322 *0.035 **0.43 **0.53 **0.50 **0.17−0.32 *−0.01−0.16−0.41 **−0.150.90 **−0.021.00
Pb0.200.060.09−0.25−0.050.120.130.04−0.080.040.000.05−0.02−0.070.270.16−0.160.46 **−0.161.00
Mn0.180.190.190.040.150.200.190.180.150.28 *0.33 **−0.29 *−0.22−0.10−0.05−0.150.44 **0.31 *.40 **0.221.00
Ni0.160.36 **0.35 **0.050.35 **0.34 **0.345 **0.35 **0.33 *0.35 **0.18−0.21−0.080.11−0.02−0.040.62 **−0.050.58 **−0.060.33 **1.00
Zn0.18−0.07−0.070.22−0.10−0.06−0.07−0.07−0.06−0.010.09−0.03−0.090.33 *0.30 *−0.200.080.26 *0.090.220.33 **0.24
See footnote of Table 1. * Correlation is significant at the 0.05 level. ** Correlation is significant at the 0.01 level.
Table 4. Varimax rotated component matrix of the studied soil properties.
ParameterWet SeasonParameterDry Season
PC1PC2PC3PC4PC5PC6PC7PC1PC2PC3PC4PC5PC6PC7
Eigenvalue5.162.752.122.062.021.921.70Eigenvalue7.502.882.111.901.761.651.59
Variance, %22.4311.949.238.978.798.337.39Variance, %32.6112.509.188.277.647.196.90
Cumulative, %22.4334.3743.6052.5761.3669.6977.09Cumulative, %32.6145.1154.2962.5670.2077.3984.29
IndicatorEigenvectorsIndicatorEigenvectors
pH0.270.22−0.100.16−0.330.57−0.22pH−0.170.410.360.25−0.120.030.05
EC0.960.190.08−0.060.120.12−0.02EC0.990.120.01−0.010.020.050.00
Na+0.960.190.06−0.02−0.020.10−0.02Na+0.990.100.010.020.020.020.00
K+0.00−0.080.07−0.030.420.690.11K+0.110.010.060.05−0.060.910.17
Ca2+0.560.040.00−0.070.670.10−0.01Ca2+0.850.23−0.03−0.270.100.200.01
Mg2+0.700.220.18−0.210.330.07−0.08Mg2+0.970.030.050.12−0.04−0.070.01
Cl0.960.200.09−0.05−0.040.13−0.03Cl0.980.060.060.070.01−0.01−0.02
SO42−0.00−0.03−0.05−0.050.91−0.040.00SO42−0.990.080.02−0.01−0.030.050.01
HCO3−−0.13−0.21−0.030.320.24−0.720.13HCO3−0.610.36−0.19−0.350.130.280.06
ESP0.930.230.090.08−0.010.050.04ESP0.890.18−0.06−0.040.220.17−0.11
Sand0.210.150.940.050.050.01−0.16Sand0.180.120.910.000.32−0.070.04
Silt−0.30−0.19−0.36−0.14−0.27−0.170.43Silt−0.40−0.13−0.280.10−0.670.180.04
Clay−0.07−0.06−0.930.020.100.08−0.06Clay0.07−0.05−0.93−0.070.08−0.05−0.08
SOM−0.110.070.06−0.18−0.22−0.03−0.68SOM−0.02−0.170.080.00−0.110.010.85
CaCO3−0.32−0.170.290.24−0.19−0.520.18CaCO3−0.42−0.030.270.29−0.08−0.550.36
Cr−0.110.010.00−0.19−0.14−0.170.82Cr−0.17−0.11−0.010.08−0.56−0.30−0.58
Co0.350.800.17−0.090.030.27−0.13Co0.380.800.09−0.210.200.07−0.12
Cu−0.08−0.01−0.080.760.02−0.12−0.09Cu−0.250.03−0.060.370.73−0.02−0.11
Fe0.360.820.03−0.050.000.24−0.07Fe0.160.85−0.01−0.210.120.18−0.27
Pb−0.01−0.220.070.73−0.190.060.35Pb0.11−0.230.030.860.14−0.12−0.06
Mn0.110.540.220.570.14−0.03−0.08Mn0.120.470.170.430.410.15−0.01
Ni0.240.780.050.06−0.08−0.070.01Ni0.250.800.090.08−0.04−0.210.13
Zn−0.160.270.070.51−0.13−0.24−0.24Zn−0.160.310.150.610.040.340.46
See footnote of Table 1. Boldface numbers indicate strong positive loadings (>0.6).
Table 5. Semivariogram parameters of the best-fitted ordinary kriging models.
VariableSeasonModelNugget Partial
Sill
SillNugget/
Sill
SPDRange,
km
Prediction Error
MERMSEMSERMSSEASE
pHWetExponential0.040.050.090.42Moderate14.200.000.240.000.980.25
DryHole effect0.010.070.080.13Strong2.980.000.370.011.160.32
ECWetExponential0.240.580.820.29Moderate37.130.010.660.011.040.62
DryHole effect1.690.342.020.83Weak4.940.021.490.010.961.54
ESPWetK-Bessel0.921.292.220.42Moderate35.840.001.050.011.031.02
DryExponential0.850.781.630.52Moderate37.130.011.030.000.991.05
OMWetTetraspherical0.170.020.180.91Weak6.400.000.450.011.020.44
DryExponential0.310.310.620.51Moderate37.130.010.730.011.130.64
SandAllJ-Bessel2.492.985.470.46Moderate20.56−0.011.970.001.111.74
SiltExponential0.070.490.560.13Strong11.230.059.190.051.099.97
ClayGaussian1.841.803.650.51Moderate12.420.021.610.011.061.52
CaCO3J-Bessel0.030.030.060.52Moderate37.130.061.810.041.281.34
CrWetTetraspherical0.010.020.030.37Moderate10.170.000.150.001.010.15
DryK-Bessel0.020.030.050.43Moderate7.810.000.170.001.010.18
CoWetGaussian0.000.000.000.69Moderate9.060.000.010.010.970.01
DryK-Bessel0.000.000.000.92Weak4.210.000.010.001.010.01
CuWetRational Quadratic0.040.220.270.17Strong5.590.000.530.001.110.46
DryHole Effect0.160.220.380.42Moderate6.270.000.660.001.160.55
FeWetGaussian0.880.431.320.67Moderate26.790.000.950.001.000.99
DryGaussian1.320.651.970.67Moderate26.790.001.170.001.001.21
PbWetJ-Bessel0.000.000.000.79Weak2.310.000.020.030.850.03
DryExponential0.000.000.000.59Moderate3.210.000.020.000.830.03
MnWetExponential0.130.140.270.49Moderate37.570.000.450.001.100.41
DryCircular0.210.260.470.44Moderate37.570.000.550.001.100.50
NiWetGaussian0.000.000.000.75Weak4.070.000.020.011.070.02
DryGaussian0.000.000.000.79Weak4.210.000.030.011.060.03
ZnWetExponential0.000.010.010.30Moderate5.620.000.110.021.080.10
DryExponential0.010.010.020.32Moderate5.530.000.130.021.080.12
SPD, spatial dependence; ME, mean error; RMSE, root mean square error; MSE, mean standardized error; RMSSE; root mean square standardized error; ASE, average standardized error.
Disclaimer/Publisher’s Note: The statements, opinions and data contained in all publications are solely those of the individual author(s) and contributor(s) and not of MDPI and/or the editor(s). MDPI and/or the editor(s) disclaim responsibility for any injury to people or property resulting from any ideas, methods, instructions or products referred to in the content.

