Article

Irrigation Practices and Their Effects on Soil Quality and Soil Characteristics in Arid Lands: A Comprehensive Geomatic Analysis

1
Division of Scientific Training and Continuous Studies, National Authority for Remote Sensing and Space Sciences (NARSS), Cairo 11769, Egypt
2
Department of Soils and Water, Faculty of Agriculture, Al-Azhar University, Assiut 71524, Egypt
3
Geography and GIS Department, Faculty of Arts, Assiut University, Assiut 71526, Egypt
4
National Higher School of Agronomy (ENSA), Department of Agricultural Engineering, El Harrach, Algiers ES 1603, Algeria
5
Scuola di Scienze Agrarie, Forestali, Alimentari ed Ambientali (SAFE), Università degli Studi della Basilicata, Via dell’Ateneo Lucano 10, 85100 Potenza, Italy
*
Authors to whom correspondence should be addressed.
Soil Syst. 2024, 8(2), 52; https://doi.org/10.3390/soilsystems8020052
Submission received: 9 February 2024 / Revised: 2 May 2024 / Accepted: 4 May 2024 / Published: 7 May 2024
(This article belongs to the Special Issue Land Use and Management on Soil Properties and Processes)

Abstract

:
Comprehension of the long-term effects of irrigation on basic soil characteristics and quality is essential for sustainable land management and agricultural production, particularly in arid regions where water availability is limited. This study aimed to investigate long-term irrigation effects on soil quality, soil organic carbon (SOC), and nitrogen (N) stocks in the arid lands of Egypt. Seventy soil samples were collected and analyzed to determine various soil properties. A soil quality index (SQI), SOC, and N stocks were computed. ANOVA and PCA analyses were used to identify significant differences between alluvial soils in the southwest part of the investigated area and coastal marine soils in the northeast of the study area. The results demonstrated that most of the studied soil parameters had significantly greater values in alluvial compared to coastal marine soils. Long-term irrigation led to an 8.00% increase in SOC and 7.22% increase in N stocks compared to coastal marine soils production. Furthermore, a 39.53% increase was found in the SQI upon long-term irrigation practice. These results suggest that shifting from rain-fed in coastal marine areas to irrigated production systems in alluvial fields can improve soil quality, SOC, and N stocks. Therefore, further studies are required to investigate the impact of additional factors, such as irrigation method and salinity status of sub-surface soil layers, to enhance agricultural productivity and sustainable land use.

1. Introduction

The soil system is a vital component of the Earth’s biosphere. Its ability to store, recycle, and regulate nutrients is crucial for the functioning of ecosystems and the sustainability of planet life [1].
The productivity of soils in the drylands of Egypt can vary depending on various factors such as soil type, climate, and management practices. Generally, dryland soils in Egypt tend to have low organic matter (OM) content and are often sandy or loamy, which can affect their fertility and water-holding capacity [2]. In the Nile Valley and Delta, where irrigation is possible, the soils are generally more fertile and productive due to the availability of water and nutrients. These areas are known for their high agricultural productivity, with crops such as cotton, rice, and vegetables being cultivated [3].
A soil quality index is a tool used to assess and quantify the overall health and productivity of soil in agricultural or environmental systems. It provides a comprehensive evaluation of various soil properties and factors that influence soil function and performance, and the soil quality in the drylands of Egypt can vary depending on the specific region and its geological characteristics. Generally, the drylands in Egypt are characterized by arid and semi-arid conditions, which pose challenges for agriculture and soil fertility [4]. The most common soil types found in the drylands of Egypt include sandy soils, loamy sands, and sandy loams. These soils tend to have low OM content and are often deficient in nutrients, making them less fertile for traditional agriculture. Additionally, the arid climate and limited rainfall in the drylands can lead to soil erosion and salinization, further degrading the soil quality [5].
Long-term irrigation practices can have both positive and negative effects on soil quality. On the positive side, irrigation can enhance crop productivity and yield by providing adequate water supply, especially in arid or semi-arid regions [6]. Long-term irrigation practices can have significant effects on basic soil characteristics and irrigation can enhance soil moisture content, leading to increased soil water-holding capacity. This can be beneficial in areas with limited rainfall or arid climates. Additionally, irrigation can improve soil fertility by providing necessary water for nutrient uptake by plants [7].
Continuous cultivation practices have led to soil erosion and a decline in soil fertility. The constant tilling and planting of crops without proper soil conservation measures have accelerated erosion, resulting in the loss of valuable topsoil. This loss of topsoil reduces the availability of essential nutrients for plant growth, ultimately impacting crop productivity.
To maintain long-term agricultural productivity, it is crucial to implement sustainable farming practices that minimize soil erosion and preserve soil fertility [8]. The range of the total nitrogen pool (TNP) in the north Nile Delta region of Egypt, from 0.3 to 7.6 Mg/ha, suggests variability in the nitrogen content of the soil. Total nitrogen is an important indicator of soil fertility and plays a crucial role in supporting plant growth and productivity. Higher levels of total nitrogen generally indicate a higher capacity of the soil to provide essential nutrients for crops, and the soil organic carbon pool (SOC) in the same region, ranging from 0.3 to 76.4 Mg/ha, indicates significant variability in the organic carbon content of the soil. However, agricultural practices, including the use of fertilizers and the type of crops grown, can influence the nitrogen and organic carbon levels in the soil [9]. Studies on global and specific areas have shown that the adoption of irrigation agriculture can lead to changes in soil physicochemical properties. Some of the common changes observed include alterations in soil moisture content, increased salinity, changes in soil pH, and modifications in nutrient availability [10]. Wang et al. found that irrigation can have a positive impact on SOC content by increasing inputs from crop residues, resulting in a 35% annual increment compared to rain-fed production systems, and the irrigated plots generally had higher SOC storage compared to the rain-fed plots, with an average difference of 6% [11]. However, the carbon sequestration efficiency was higher in the rain-fed condition (28%) compared to the irrigated condition (19%). Specifically, the threshold SOC contents for obtaining the highest crop yield were 10.0 g kg−1 for the winter wheat–summer maize system and 8.8 g kg−1 for the winter wheat–summer fallow system. Additionally, the relationship between relative yield (crop productivity) and SOC content indicated that higher SOC levels were required to support high crop productivity in the irrigated system compared to the rain-fed system [12].
The Nile Delta region in Egypt is known for its fertile and populated delta. However, studies on soil carbon and nitrogen pools and their importance in climate change are not a focus in Egypt [9]. Some of the Nile Delta soils are salt-affected, leading to lower levels of carbon and nitrogen compared to non-saline soils. This is due to a decline in net primary production caused by adverse edaphic factors that limit plant growth, such as high concentrations of sodium, magnesium, chloride, and sulfate ions. Excessive salts can lead to toxicity and elemental imbalance, as well as adverse soil physical conditions and waterlogging, all of which inhibit plant growth [13]. Indeed, some studies suggest that irrigation can lead to improved soil quality and increased SOC and nitrogen stocks due to increased nutrient availability and enhanced microbial activity [14]. However, other studies have found negative effects such as increased salinity, waterlogging, and leaching [15].
Finally, the main objectives of this study are to assess the impact of irrigated agriculture on selected soil physicochemical properties and to assess the impact of irrigation agriculture on soil organic carbon stock, total nitrogen stock, and soil quality using different statistical analyses.

2. Materials and Methods

2.1. Description of the Study Area

Damietta Governorate is located in the eastern north part of the Nile Delta region of Egypt. It is bounded by longitudes 32°4′11″–31°28′7″ E, and latitudes 31°32′36.77″–31°9′27.09″ N, as shown in Figure 1.
Damietta Governorate has a Mediterranean climate, characterized by a dry summer season with mild, dry winters. Climatic elements were obtained according to (National Centre for Environmental Information (NOAA), 2023 report; https://www.ncei.noaa.gov/access/monitoring/monthly-report/global/202213, accessed on 21 November 2023), as presented in Table 1.
In terms of temperature, the annual winter temperatures in Damietta Governorate can fall to around 6.4 °C in February, while rising to approximately 33.8 °C in August. The mean annual temperature is around 20 °C. Precipitation in Damietta Governorate is generally low, with an annual average not exceeding 5 mm. Due to its proximity to the Mediterranean Sea, humidity in the region is generally high, with the maximum values occurring during the summer months, reaching up to 76.4%. Significantly higher evaporation than precipitation rates are observed from January to August in Damietta Governorate. The maximum evaporation occurs in June, with a value of 7.8 mm/day. Wind patterns in Damietta Governorate are generally bimodal. Most incoming winds blow from the northwest direction during summer, spring, and autumn, while the other wind direction is from the southwest during winter. According to the UNESCO classification of arid lands, Damietta Governorate falls within the arid zone. The aridity index, which is the annual precipitation divided by the annual evapotranspiration (P/ET), is 1.23 mm/day for Damietta Governorate. The current land use/land cover in the investigated area is represented by natural vegetation, cultivated areas, urban areas, roads, and barren land, and most of the northern coastal areas of the study area are covered by sand dunes (beach area) and urbans. The main land use in the Damietta Governorate area is cultivated areas that are divided into some field crops (wheat, maize alfalfa, and rice), orchards (citrus and banana), and vegetables, which represent the largest areas, including cabbage, tomato, and onion.

2.2. Physiographical Units of Damietta Governorate

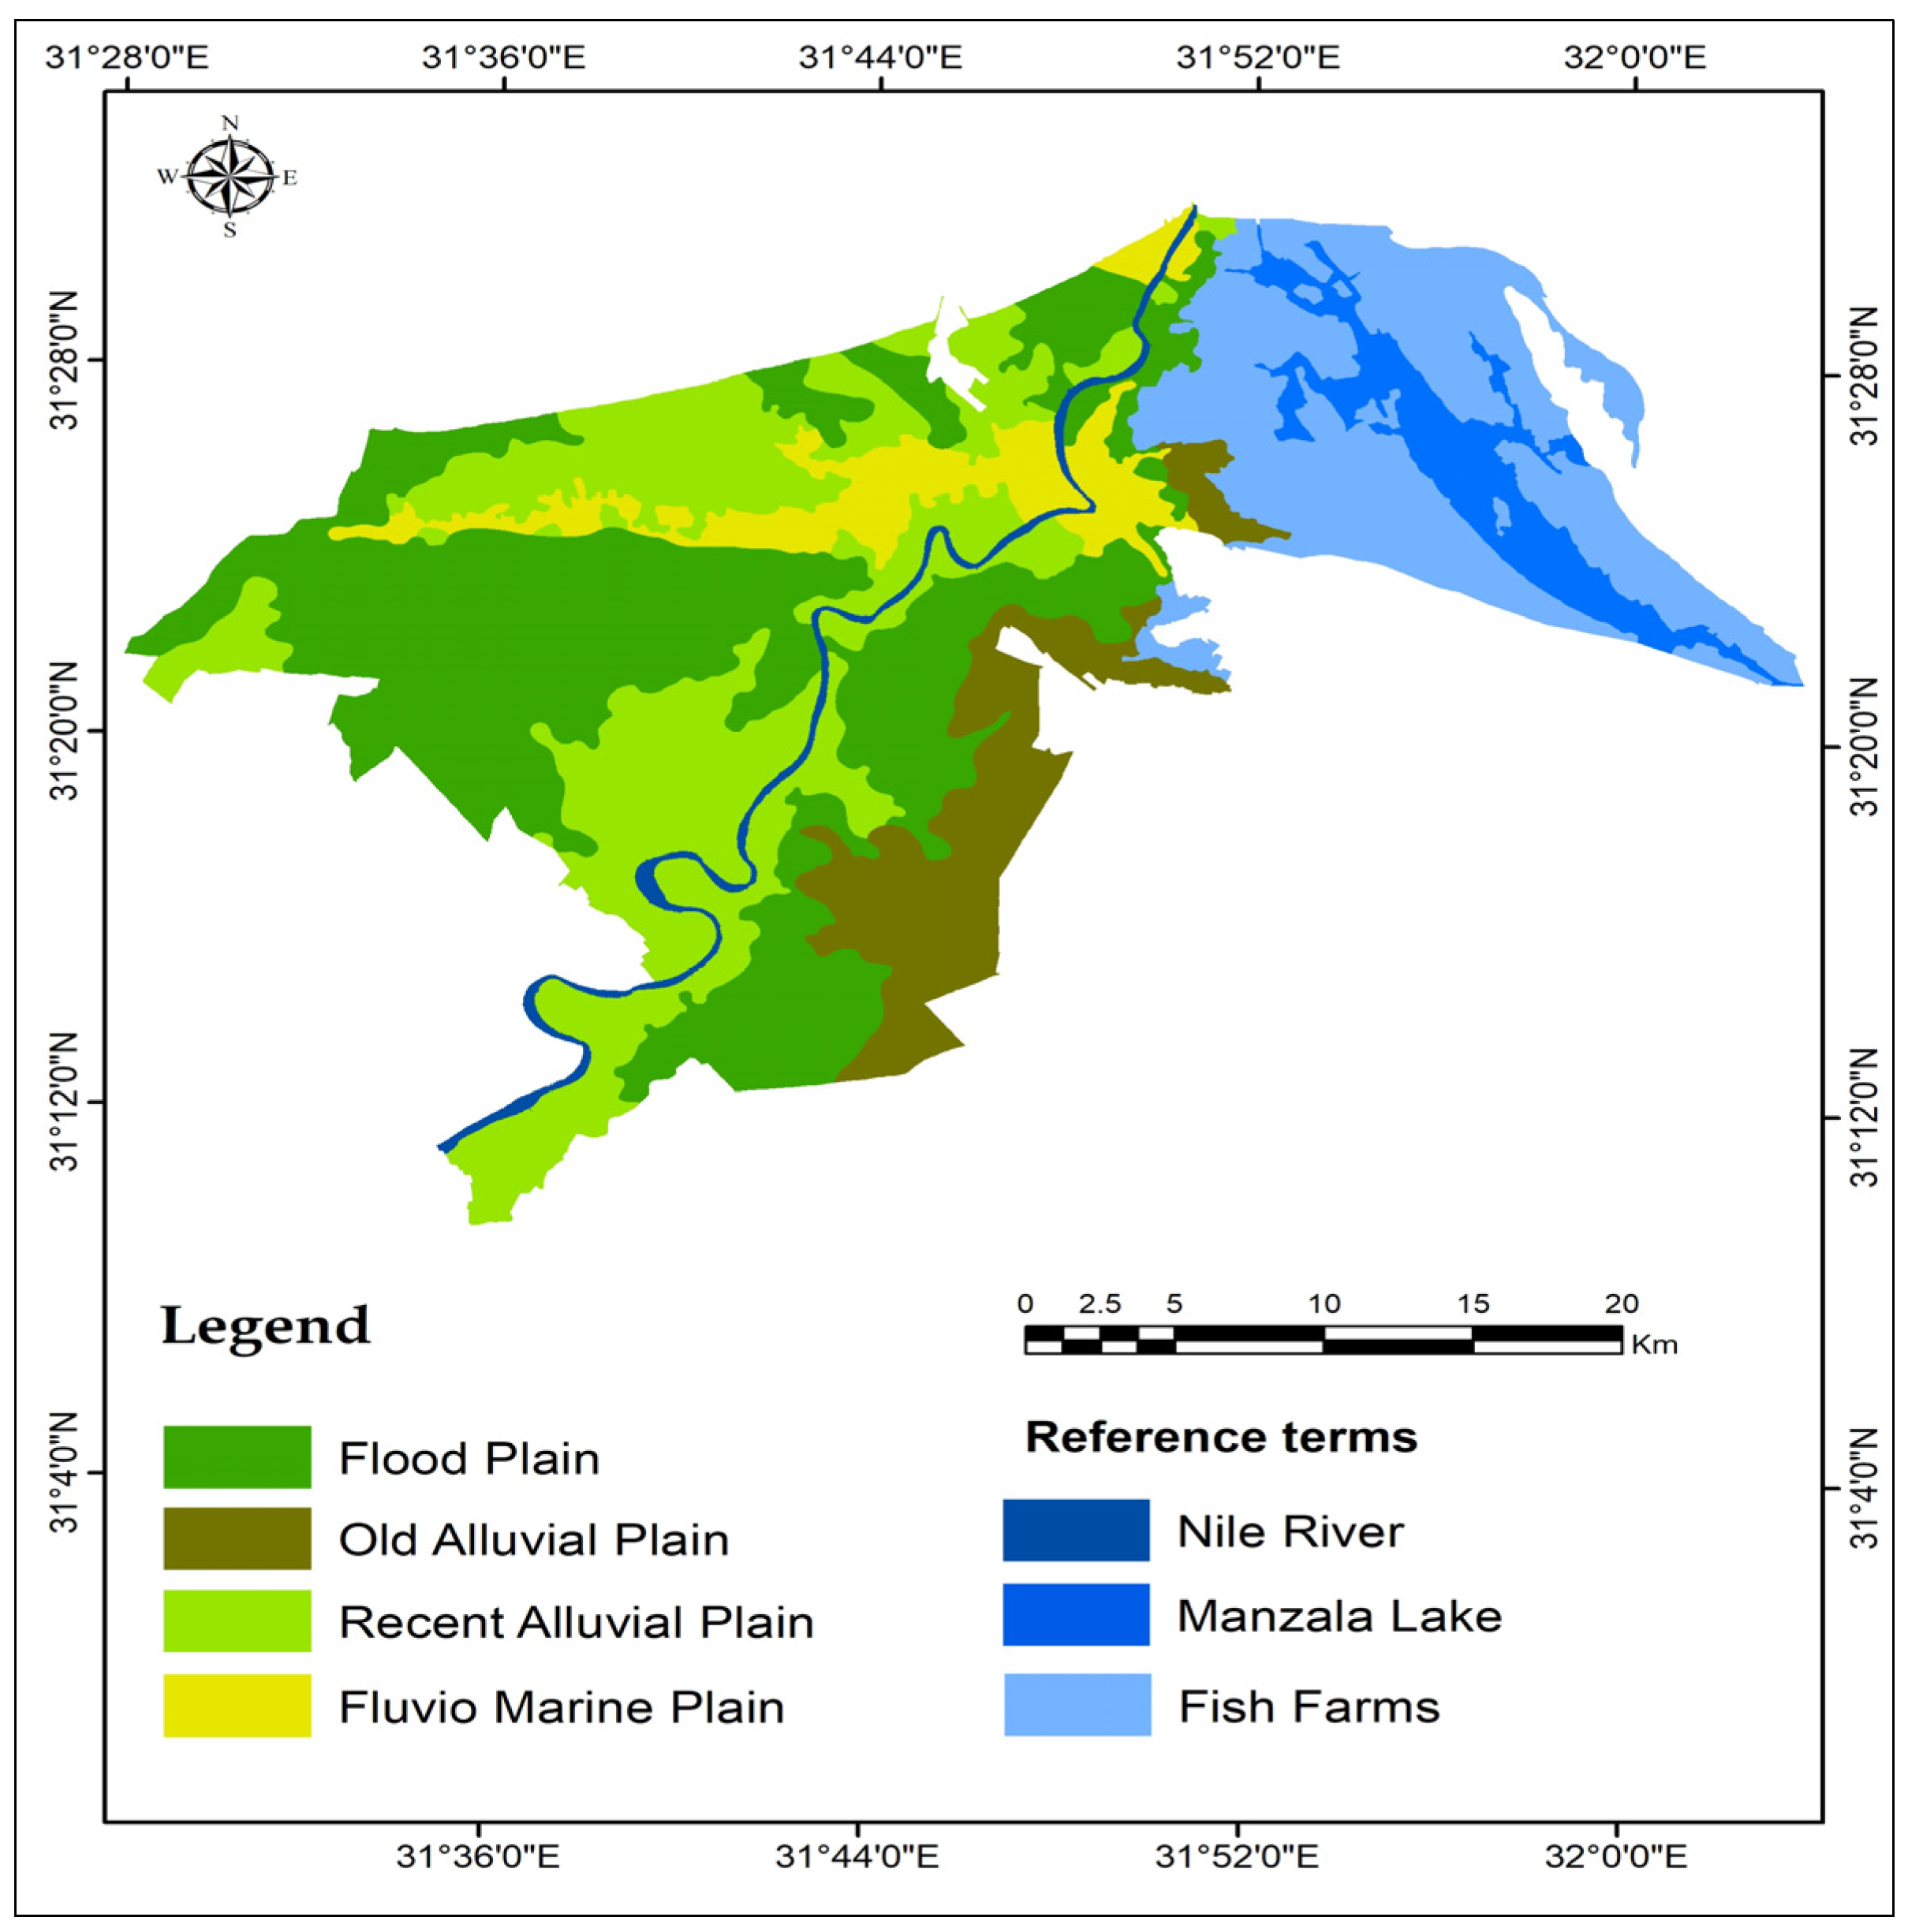
Physiographical units were identified throughout Landsat 8 satellite imagery (Path 176, Row 38, date acquired, 4 March 2023) with an image resolution of 30 m, digital elevation model (DEM) interpreting methods, and field study that affords the reality of ground observation, which are considered advanced techniques. Satellite image interpretation and field study indicated that the study area represent three main landform units and two reference terms as follows: (1) alluvial plain (which is divided into two mapping units, i.e., recent alluvial plain and old alluvial plain); (2) flood plain; (3) fluvio-marine plain; (4) fish farms, and (5) lake, that were, respectively, inputted into the ArcGIS 10.1 software for mapping (Figure 2). The total areas of these physiographical units are shown in Table 2.

2.3. Soil Sampling and Analyses

Seventy composite and intact soil samples were gathered from various land uses at a soil depth of 0 to 130 cm in 2023 for the purpose of analyzing soil characteristics, specifically to measure soil bulk density (BD) using a core sampler, as listed in Table 3.

2.3.1. Soil Structural Stability Index (SSI)

Soil structural stability index (SSI) is a metric utilized to evaluate the durability and adaptability of soil composition, determined by factors such as soil organic carbon content (SOC) and the proportions of clay and silt. The SSI was determined according to the following Equation (1) [24].
S S I = 1.724 S O C ( % )   c l a y ( % ) + s i l t ( % )   × 100

2.3.2. Total Porosity (TP)

Total porosity (TP) refers to the amount of pore space within a soil and is primarily influenced by the structure of the soil. The TP index was calculated according to bulk density ( ρ b , Mg m−3) and particle density ( ρ s , 2.65 Mg m−3) using the following Equation (2) [25].
T P   % = 1 ρ b ρ s × 100 %

2.3.3. SOC and TN Stocks

For each reference soil profile, representative SOC and TN stocks (Mg ha−1) were derived from proxy functions with soil texture as most relevant input parameter, thus allowing the estimation of SOC and TN stocks in the first 35 cm of the soil profile. SOC and TN stocks were calculated using the model developed and proposed by [26], using a volume fraction of coarse fragments > 2 mm (Si), as in the following Equation (3).
S O C   T N = c o n c e n t r a t i o n   % × ρ b   ( M g m 3 ) × s o i l   d e p t h   m × 10,000 m 2 h a × ( 1 S i )

2.3.4. Sodium Adsorption Ratio (SAR)

The sodium adsorption ratio (SAR) is a value representing the relative number of sodium ions to the combined number of calcium and magnesium ions in the soil using the following Equation (4), as suggested by [25]. SAR is important in supporting agricultural crop production, as high SAR values in clay and loam soils will reduce soil permeability, thereby concentrating salts near the surface and inhibiting plant growth.
S A R = N a + ( C a + + + M g + + 2

2.3.5. Exchangeable Sodium Percentage (ESP)

Exchangeable sodium percentage (ESP) is the relative number of sodium ions present on the soil surface. ESP can be estimated by the following empirical Formula (5):
E S P = E x c h a n g e a b l e   N a   C E C × 100 %

2.3.6. Percentage Base Saturation (PBS)

Percentage base saturation (PBS) is determined by dividing the total exchangeable bases (Ca, Mg, K, and Na) by the CEC of the soil and multiplying by 100%. PBS can be estimated by the following Formula (6):
P B S = B a s i c   C a t i o n s   C E C × 100 %

2.3.7. Estimation of Soil Quality Index (SQI)

In this study, a statistical model was used to predict the soil quality index (SQI), which is a tool used to assess and quantify the overall health and productivity of soil in agricultural or environmental systems. It provides a comprehensive evaluation of various soil properties and factors that influence soil function and performance. The development of a soil quality index typically involves the selection and integration of multiple indicators that reflect different aspects of soil health and productivity. The model utilized principal component analysis (PCA) as a method to reduce the dataset and select the most relevant soil parameters for calculating the SQI. PCA is a commonly employed technique to pinpoint the primary variables that have the greatest impact on the overall variation within a dataset. Through the application of PCA, the scientists could pinpoint and include the most significant soil indicators in the SQI calculation [27].
PCA was used to identify soil attributes with high loading factors, enabling the classification of soil characteristics into principal components (PCs). This categorization facilitated the development of a minimal dataset (MDS) by minimizing redundancy in the model and reducing indicator load. During the selection process for the complete dataset, only soil physicochemical indicators that displayed notable distinctions were selected. In essence, only those indicators demonstrating significant variations or differences across samples or treatments were considered for analyses from the total samples or treatments of measured soil properties [28].
In principal component analysis, the principal components (PCs) with eigenvalues exceeding 1 are generally regarded as the most crucial components that explain the majority of the variability present in the data [29].
In PCA, Pearson’s correlation analysis is frequently employed to assess indicator redundancy when multiple indicators are retained within each principal component. Following the completion of PCA and the identification of important PCs, it is possible that several indicators may exhibit strong loadings on the same PC. This suggests a high level of correlation between these indicators, indicating potential redundancy in capturing the underlying data variability. By calculating correlation coefficients between pairs of indicators, high correlations (values near +1 or −1) signify significant redundancy [30].
The process for selecting indicators with assigned scores based on their implications for soil quality in the MDS involved several steps [27]. Initially, the correlation coefficient between pairs of highly loaded indicators was evaluated, and if it was below 0.7, both indicators were retained for the MDS. However, if the correlation coefficient exceeded 0.7, the indicator with the highest weighted load was chosen for inclusion in the MDS, while the other indicator was excluded. Subsequently, scoring functions were applied to the selected indicators based on their soil quality implications. For indicators where higher values signify better soil quality (such as soil organic carbon, nitrogen, and phosphorus), higher scores were assigned to higher values. Conversely, for indicators where lower values indicate improved soil quality (e.g., EC and soil bulk density), higher scores were assigned to lower values. Additionally, for indicators with an optimal soil quality range (e.g., soil pH), higher scores were allocated to values within the optimal range, while lower scores were assigned to values outside that range.
In order to assess soil quality, the ten chosen soil quality indicators were converted into index values on a scale of 0 or 1. These index values reflect the relative significance or contribution of each indicator to the overall soil quality. To determine the soil quality index (SQI) score, the index values of the selected indicators were aggregated by summing up all the individual index values (Table 4). In the PCA analysis, weight-age values were allocated to each principal component (PC) by dividing the variance explained by each PC by the total maximum variation across all PCs. This approach guaranteed that the weight-age values were proportionate to the extent to which each PC contributed to elucidating the overall variability within the dataset. By computing the ratio of the variance explained by each PC to the maximum total variation, weight-age values were derived for each PC, signifying their respective significance in the PCA analysis. Thereafter, soil quality index was computed using Equation (7) [30].
S Q I = ( S o i l   q u a l i t y   i n d i c a t o r s ) 1 / n
where n is the number of selected soil quality indicators.
Before proceeding with statistical analyses to evaluate soil quality differences among various groups or treatments, the gathered soil data underwent a normality check to ascertain if they adhere to a normal distribution. Upon confirming the normality of the data, SPSS software (version 20.0) was employed to perform an analysis of variance (ANOVA) to ascertain the presence of significant disparities in soil quality across distinct categories. In this instance, ANOVA was utilized to examine the discrepancies in soil quality between different types of land use, specifically contrasting irrigated (alluvial fields) and rain-fed land (marine fields) [31].
An independent t-test was conducted to assess whether there were notable variances between the averages of the soil parameters from two distinct land use types [32]. To assess the significance of the differences between means, the least significant difference (LSD) method was used, based on pairwise comparisons between means to determine if the observed differences were at a statistically significant level (5%) [33].
Table 4. Soil quality index and its associated soil property threshold values [34].
Soil Variables
(Indicators)
Soil
Property
Level
Soil Property ThresholdSQ Index
Soil pH<3.00High levels of acidity in the soil can present significant obstacles for plant growth0
3.01 to 4.00In highly acidic conditions where the pH is extremely low, only a select few plant species are able to thrive and tolerate such environments
4.01 to 5.50In moderately acidic soil, the growth of plants that are sensitive to acidity can be impacted, especially depending on the concentrations of extractable aluminum (Al) and other metals present
5.51 to 6.80Slightly acidic soil is often optimal for the growth of many plant species, especially those that are more tolerant to slightly acidic conditions1
6.81 to 7.20Soil that is near neutral pH is generally ideal for the growth of many plant species, except for those that specifically thrive in acidic conditions
7.21 to 7.50Slightly alkaline soil is suitable for the growth of many plant species, although those that prefer acidic conditions may not thrive. In slightly alkaline soil, there may be potential deficiencies of available phosphorus (P) and certain metals such as zinc (Zn)
7.51 to 8.50Plants adapted to moderately alkaline soil pH ranges prefer this environment. However, there may still be potential deficiencies of available phosphorus (P) and certain metals in moderately alkaline soil
>8.50Plants adapted to strongly alkaline soil pH ranges thrive in this environment. However, in strongly alkaline soil, there may be potential issues with boron (B) toxicity and other oxyanion toxicities that can affect plant growth0
Soil EC (dS m−1)<4.00Normal1
4.00 to 8.00Slightly saline
8.00 to 16.00Moderately saline
16.00 to 40.00Strongly saline0
>40.00Very strongly saline
Soil organic carbon
(SOC) (%)
>5.00High organic carbon levels in soil provide excellent benefits for plant growth and soil health1
1.00 to 5.00Moderate—adequate levels
<1.00Low organic carbon levels in soil could indicate a potential loss of organic carbon due to erosion or other processes0
Total Nitrogen
(TN) (%)
>0.50High—excellent reserve of nitrogen1
0.10 to 0.50Moderate—adequate levels
<0.10Low—could indicate loss of organic N0
Phosphorus
(P) (Mg kg−1)
>30.00High levels of available phosphorus (P) in slightly acidic-to-alkaline soils can provide an excellent reserve for plant growth1
10.00 to 30.00Moderate—adequate levels for plant growth
<10.00Low—P deficiencies likely0
Exchangeable
Sodium
Percentage (ESP) (%)
>15.00High-sodic soil with associated problems0
≤15.00Adverse effects unlikely1
Sodium Adsorption
Ratio (SAR)
>13.00High—sodic soil with associated problems0
≤13.00Adverse effects unlikely1
Bulk Density
(BD) (Mg m−3)
>1.50Possible adverse effects0
≤1.50Adverse effects unlikely1
Percentage Base
Saturation (PBS) (%)
<40.00Low soil fertility0
40.00 to 60.00Moderate soil fertility1
>60.00High—fertile soil
Cation Exchange
Capacity (CEC)
(cmolc kg−1)
<25.00Low—high leaching of basic cations0
25.00 to 40.00Moderate levels of basic cations in soil could indicate that there are adequate levels of essential nutrients such as calcium, magnesium, potassium, and sodium available for plant uptake1
>40.00High—excellent reserve of basic cations
Soil Structural
Stability Index
(SSI) (%)
<9%Low levels of basic cations in soil can indicate a high risk of soil structural degradation. Basic cations play a key role in maintaining soil stability and structure by promoting aggregation and reducing soil erosion0
>9%High levels of soil organic carbon (OC) can indicate that there is sufficient organic matter present in the soil to help maintain soil structural stability. Organic matter plays a crucial role in promoting soil aggregation, improving water infiltration and retention, and enhancing overall soil structure1

3. Results and Discussion

3.1. Irrigation System and Soil Type Impact on Soil Physical Characteristics

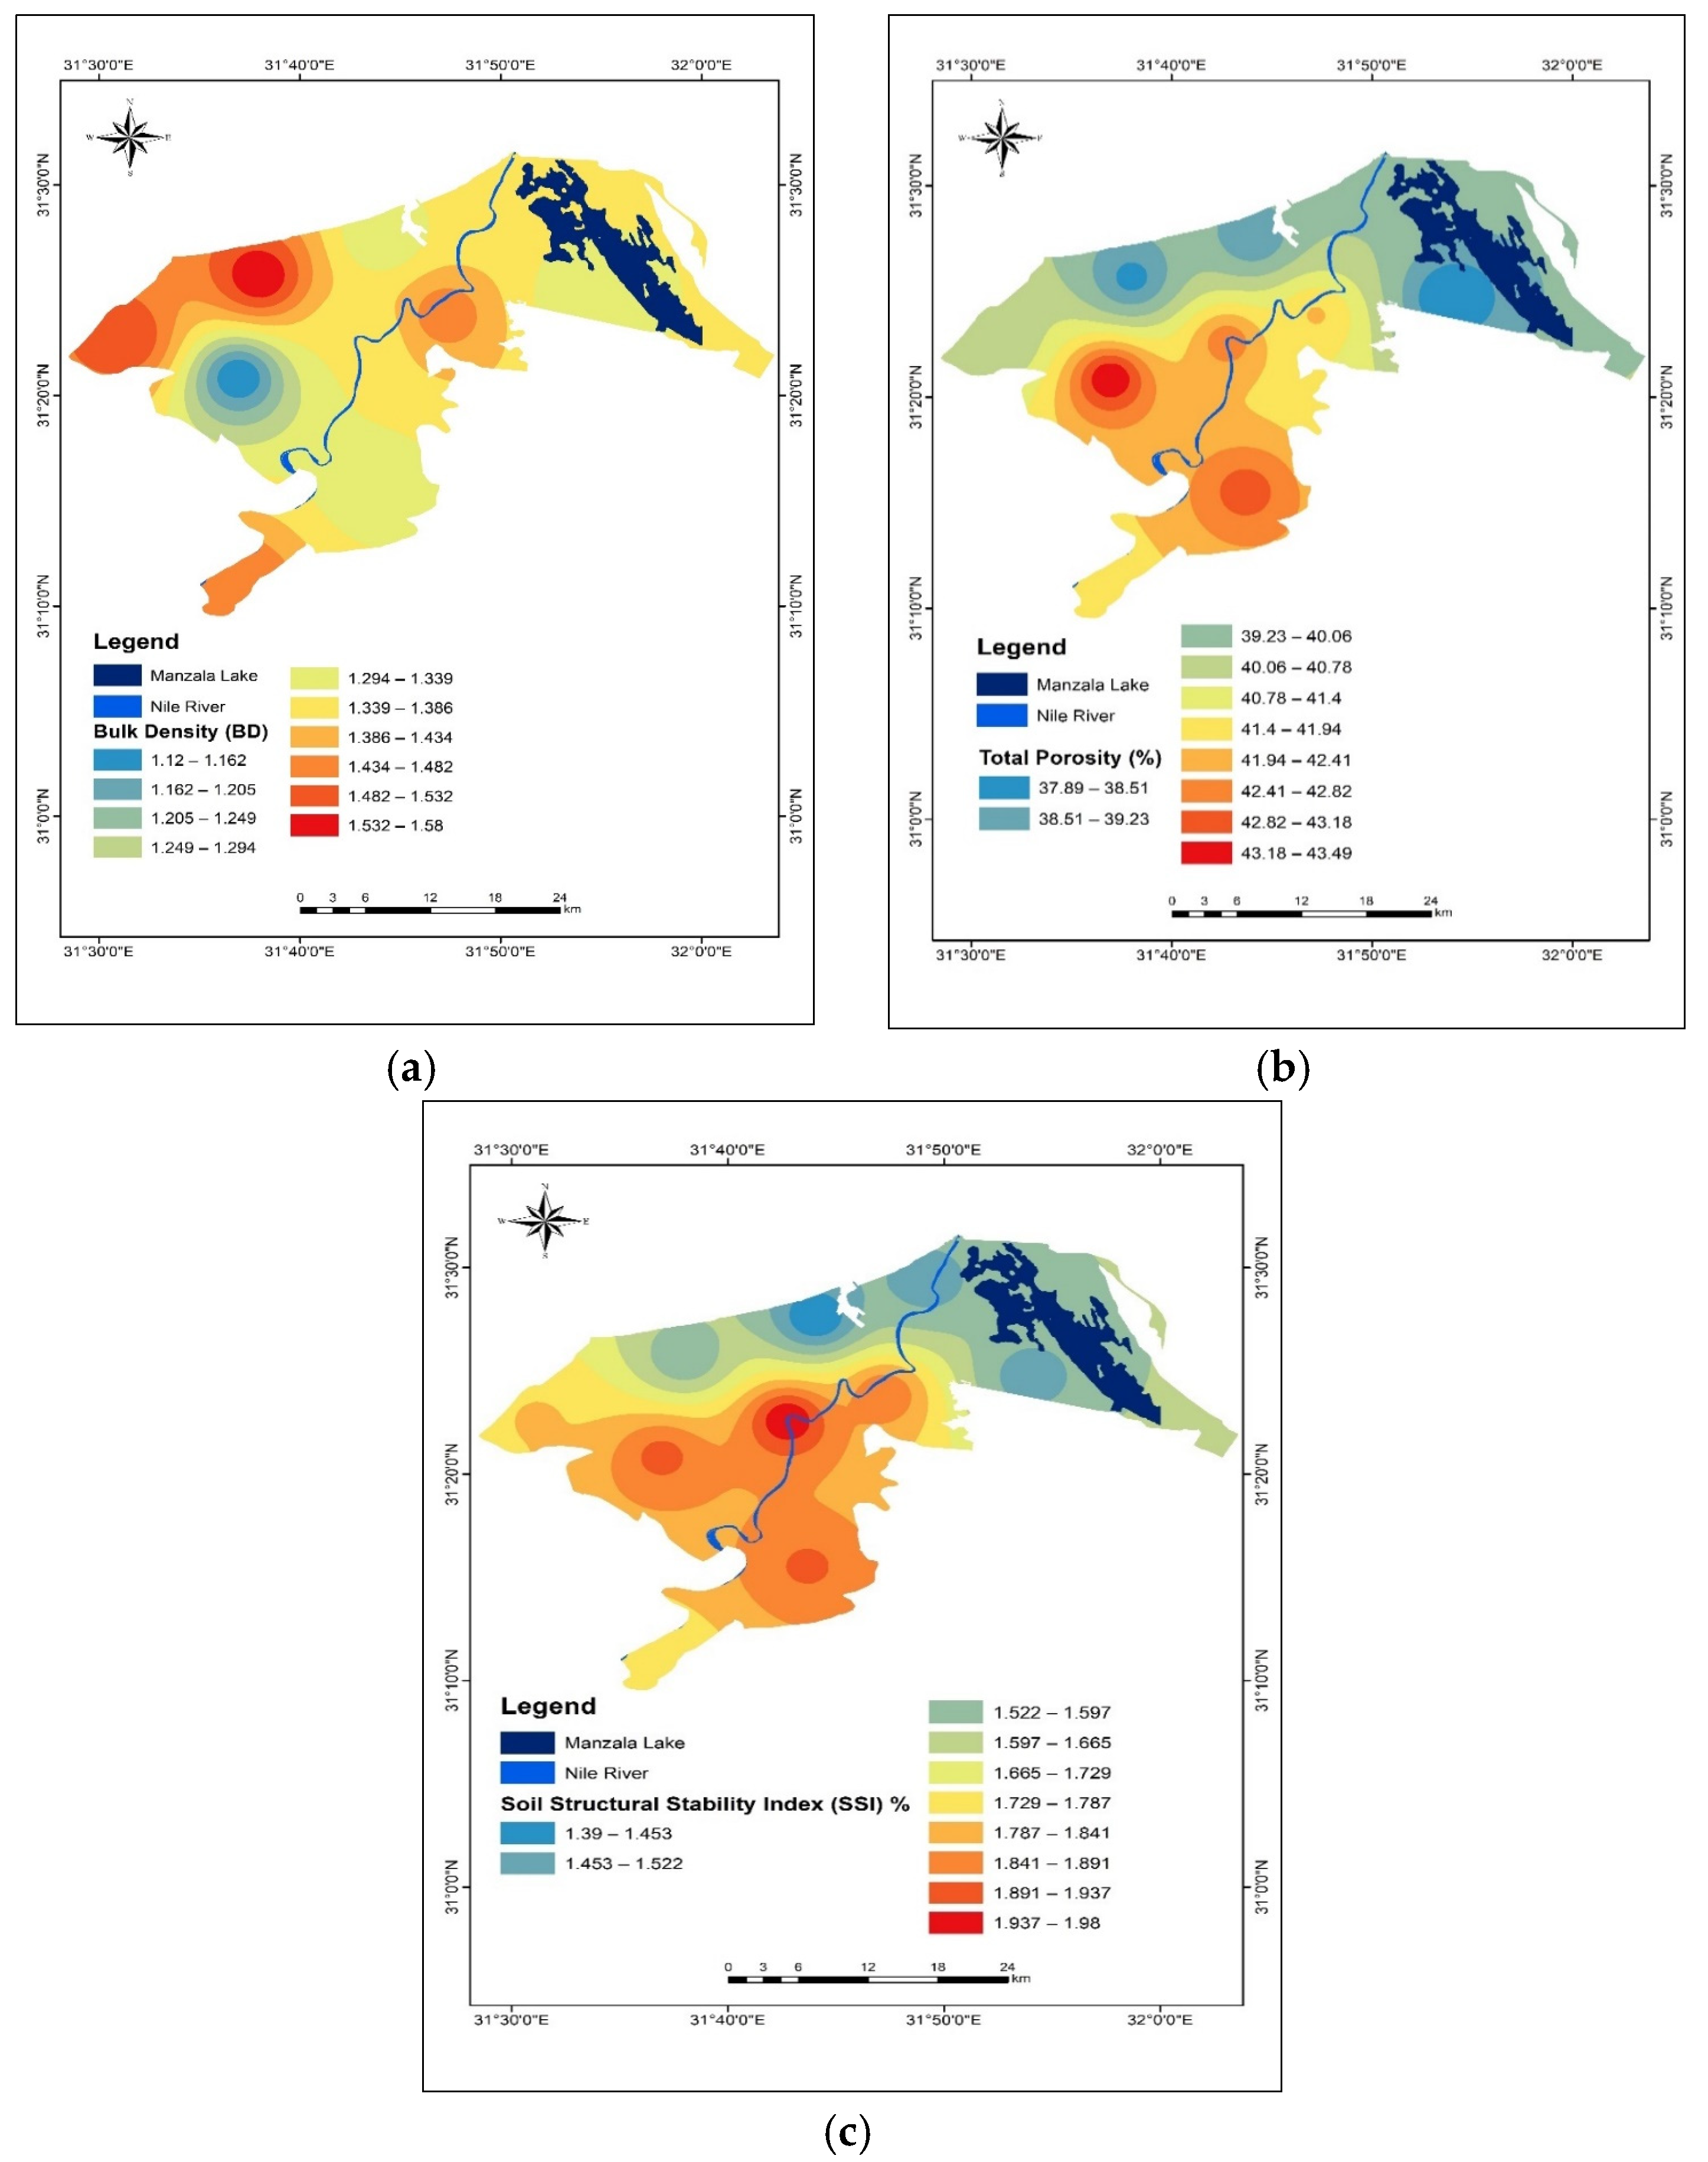
The irrigated alluvial fields in the study area did not show any significant difference in microporosity decreases and bulk density (BD) compared to the coastal marine fields. The soil bulk density in the alluvial fields ranged from 1.12 to 1.43 Mg m−3, while in the marine fields it ranged from 1.14 to 1.56 Mg m−3 (Table 5 and Figure 3a). It appears that long-term irrigation practice in the study area resulted in a 3.45% reduction in soil bulk density compared to the corresponding soils from marine fields. Similarly, there was a 13.74% reduction in soil bulk density reported in irrigated alluvial fields compared to marine fields in semi-arid Mediterranean soil conditions [35]. This suggests that irrigation may have a positive impact on soil structure and porosity in these fields [36]. The observed differences in soil bulk density between the irrigated alluvial fields and marine fields can be attributed to several factors, such as continuous application of organic fertilizer sources, which can improve soil structure and increase soil OM content, crop residues, crop rotations, and the availability of soil moisture in the irrigated alluvial fields [37]. According to Denef et al. [38], long-term irrigation and fertilization practices can lead to an increase in soil carbon (C) concentrations (which is primarily composed of carbon, plays a crucial role in maintaining soil physical properties, and helps to improve soil structure, porosity, and water-holding capacity). Increased soil carbon concentrations resulting from irrigation and fertilization practices can enhance the formation and stability of soil aggregates, reducing soil compaction and improving soil porosity.
The increase in total porosity (TP) of 8.78% in alluvial fields compared to marine areas can be attributed to the higher root biomass production from crops that have been cultivated for many years according to a relatively higher soil OM content and lower soil bulk density [39], as shown in Figure 3b. The higher bulk density observed in Marine farming (1.56 g cm−3) compared to the corresponding alluvial field (1.43 g cm−3) indicates that the soil in marine areas has a higher mass per unit volume based on some factors such as compaction from heavy machinery or the natural characteristics of marine sediments. Therefore, the differences in bulk density and porosity between marine farming and alluvial fields emphasize the importance of soil management practices that promote soil structure, OM content, and root biomass production to improve soil health and overall agricultural productivity [40].
The results from Table 5 emphasize the positive impact of long-term irrigation practices on the soil structural stability index (SSI). The SSI showed a significant increase of 24.01% in soils that underwent long-term irrigation compared to those under rain production systems, specifically in the coastal marine region (Figure 3c). This increase in SSI suggests that irrigation practices play a crucial role in enhancing the stability of soil aggregates in alluvial fields through improved moisture distribution, reduced compaction, and enhanced root development facilitated by irrigation [41]. Conversely, the lower SSI value observed in alluvial soils can be indicative of inadequate replenishment, continuous nutrient removal, and loss of OM from the soil. These factors contribute to increased erosion rates, which can have detrimental effects on soil health and agricultural productivity [42]. Soils with good physical quality and stable structures are essential for sustainable agriculture as they provide a favorable environment for plant growth, nutrient availability, and water infiltration. By improving soil structural stability, irrigation practices can contribute to long-term soil health and productivity [43].

3.2. Irrigation System and Soil Type Impact on Soil Chemical Characteristics

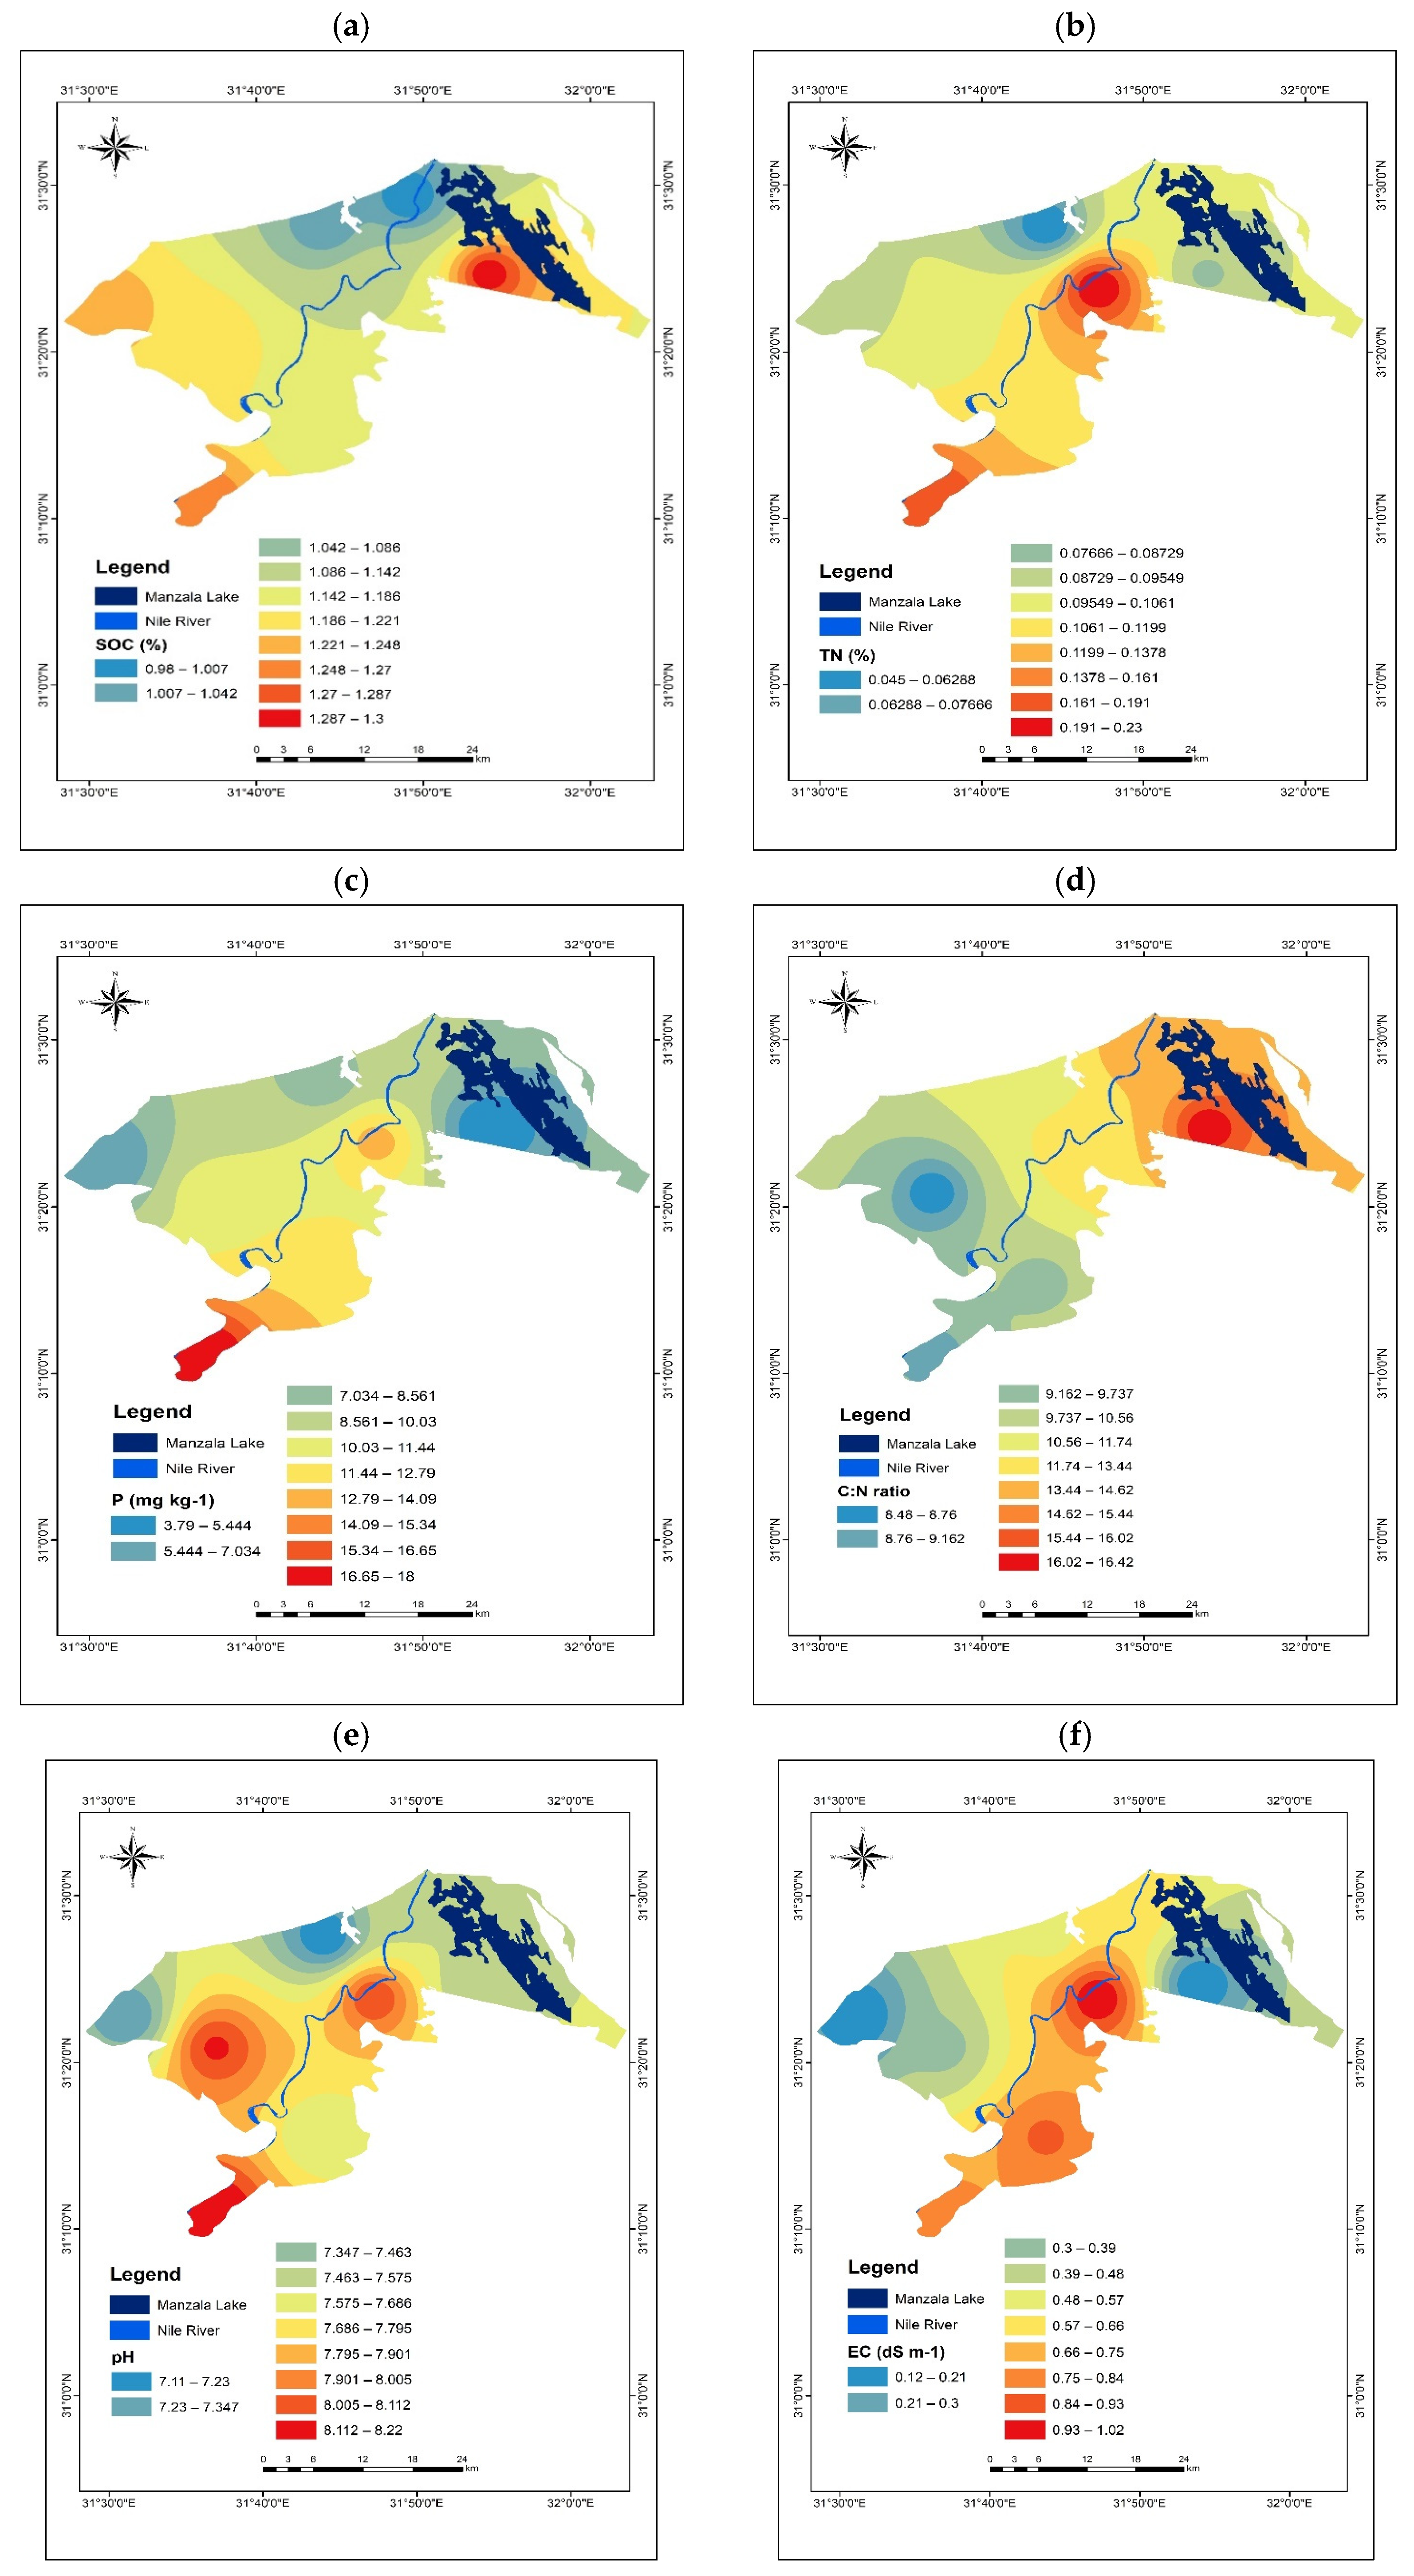
The comparison between irrigated alluvial fields and adjacent rain-fed coastal marine soils, as shown in Table 6 and Figure 4a–c, reveals that the irrigated alluvial fields have significantly higher levels of soil organic carbon (SOC), total nitrogen (TN), and potassium (K). Long-term irrigation has resulted in a 5.8% increase in SOC and a 35.71% increase in TN. This indicates that the practice of irrigation has improved the retention of crop residues in the soil, leading to higher organic carbon and nitrogen contents [44], and/or a leaching of the most hydrophilic components of SOC, promoting SOC hydrophobicity and stability [45], as is the case for rice-paddy soils [46]. Furthermore, the potassium (K) content in the irrigated alluvial soils was 52.63% higher compared to the rain-fed coastal marine soils. This difference can be attributed to the additional inputs, such as animal manure and compost, that are supplied to the soils of irrigated fields [47]. These additional inputs contribute to the higher potassium content in the irrigated alluvial soils. The significantly lower carbon-to-nitrogen ratio (C:N) observed in irrigated alluvial soils (10.07) compared to rain-fed coastal marine soils (12.80) indicates that the irrigated soils have a higher nitrogen content relative to their carbon content; see Figure 4d. This lower C:N ratio is directly related to the increased soil organic matter and soil moisture contents in irrigated alluvial fields [48]. The higher soil organic matter content in irrigated alluvial soils provides a greater pool of carbon for decomposition. Additionally, the presence of adequate soil moisture in these irrigated fields creates favorable conditions for the optimum decomposition of soil organic matter, leading to a higher rate of nitrogen mineralization. As a result, the nitrogen content is relatively higher compared to the carbon content, resulting in a lower C:N ratio [49]. Additionally, the leaching of the hydrophilic labile components of soil organic matter and the accumulation of hydrophobic components, such as heterocyclic nitrogen compounds [45], may also result in a decrease in the C:N ratio. The long-term irrigation practice in the study area has resulted in an 8.48% increase in soil pH compared to rain-fed coastal marine soils. The pH of the soils increased from 7.34 to 8.02 upon adopting irrigation, as shown in Figure 4e. This increase in pH can be attributed to the increased application of soil organic matter [50]. However, it is important to note that the soils in the study area are categorized as moderately alkaline and this means that the pH of these soils is already relatively high. However, there is a possibility of phosphorus (P) and metal deficiencies in these soils due to the alkaline conditions. It is essential to consider the potential limitations of these alkaline soils, such as reduced availability of certain nutrients like phosphorus, as well as potential metal deficiencies [51]. Proper nutrient management strategies and soil amendments may be necessary to address these issues and ensure optimal plant growth and productivity in the study area [52]. In irrigated alluvial soils, the electrical conductivity (EC) was found to be significantly higher, with a 52.63% increase compared to adjacent rain-fed coastal marine soils, as shown in Figure 4f. This increase in EC can be attributed to the long-term irrigation practices in the area. Several factors contribute to the higher EC in irrigated soils, such as irrigation water quality that can contain dissolved salts, which can accumulate in the soil over time, leading to an increase in EC. Additionally, the furrow irrigation method used in the area can help reduce surface salt accumulation, as it allows for better drainage and leaching of salts from the root zone. Furthermore, heavy rainfall during the rainy season can also contribute to the timely leaching of salts from the root zone, further increasing the EC in irrigated soils [53].
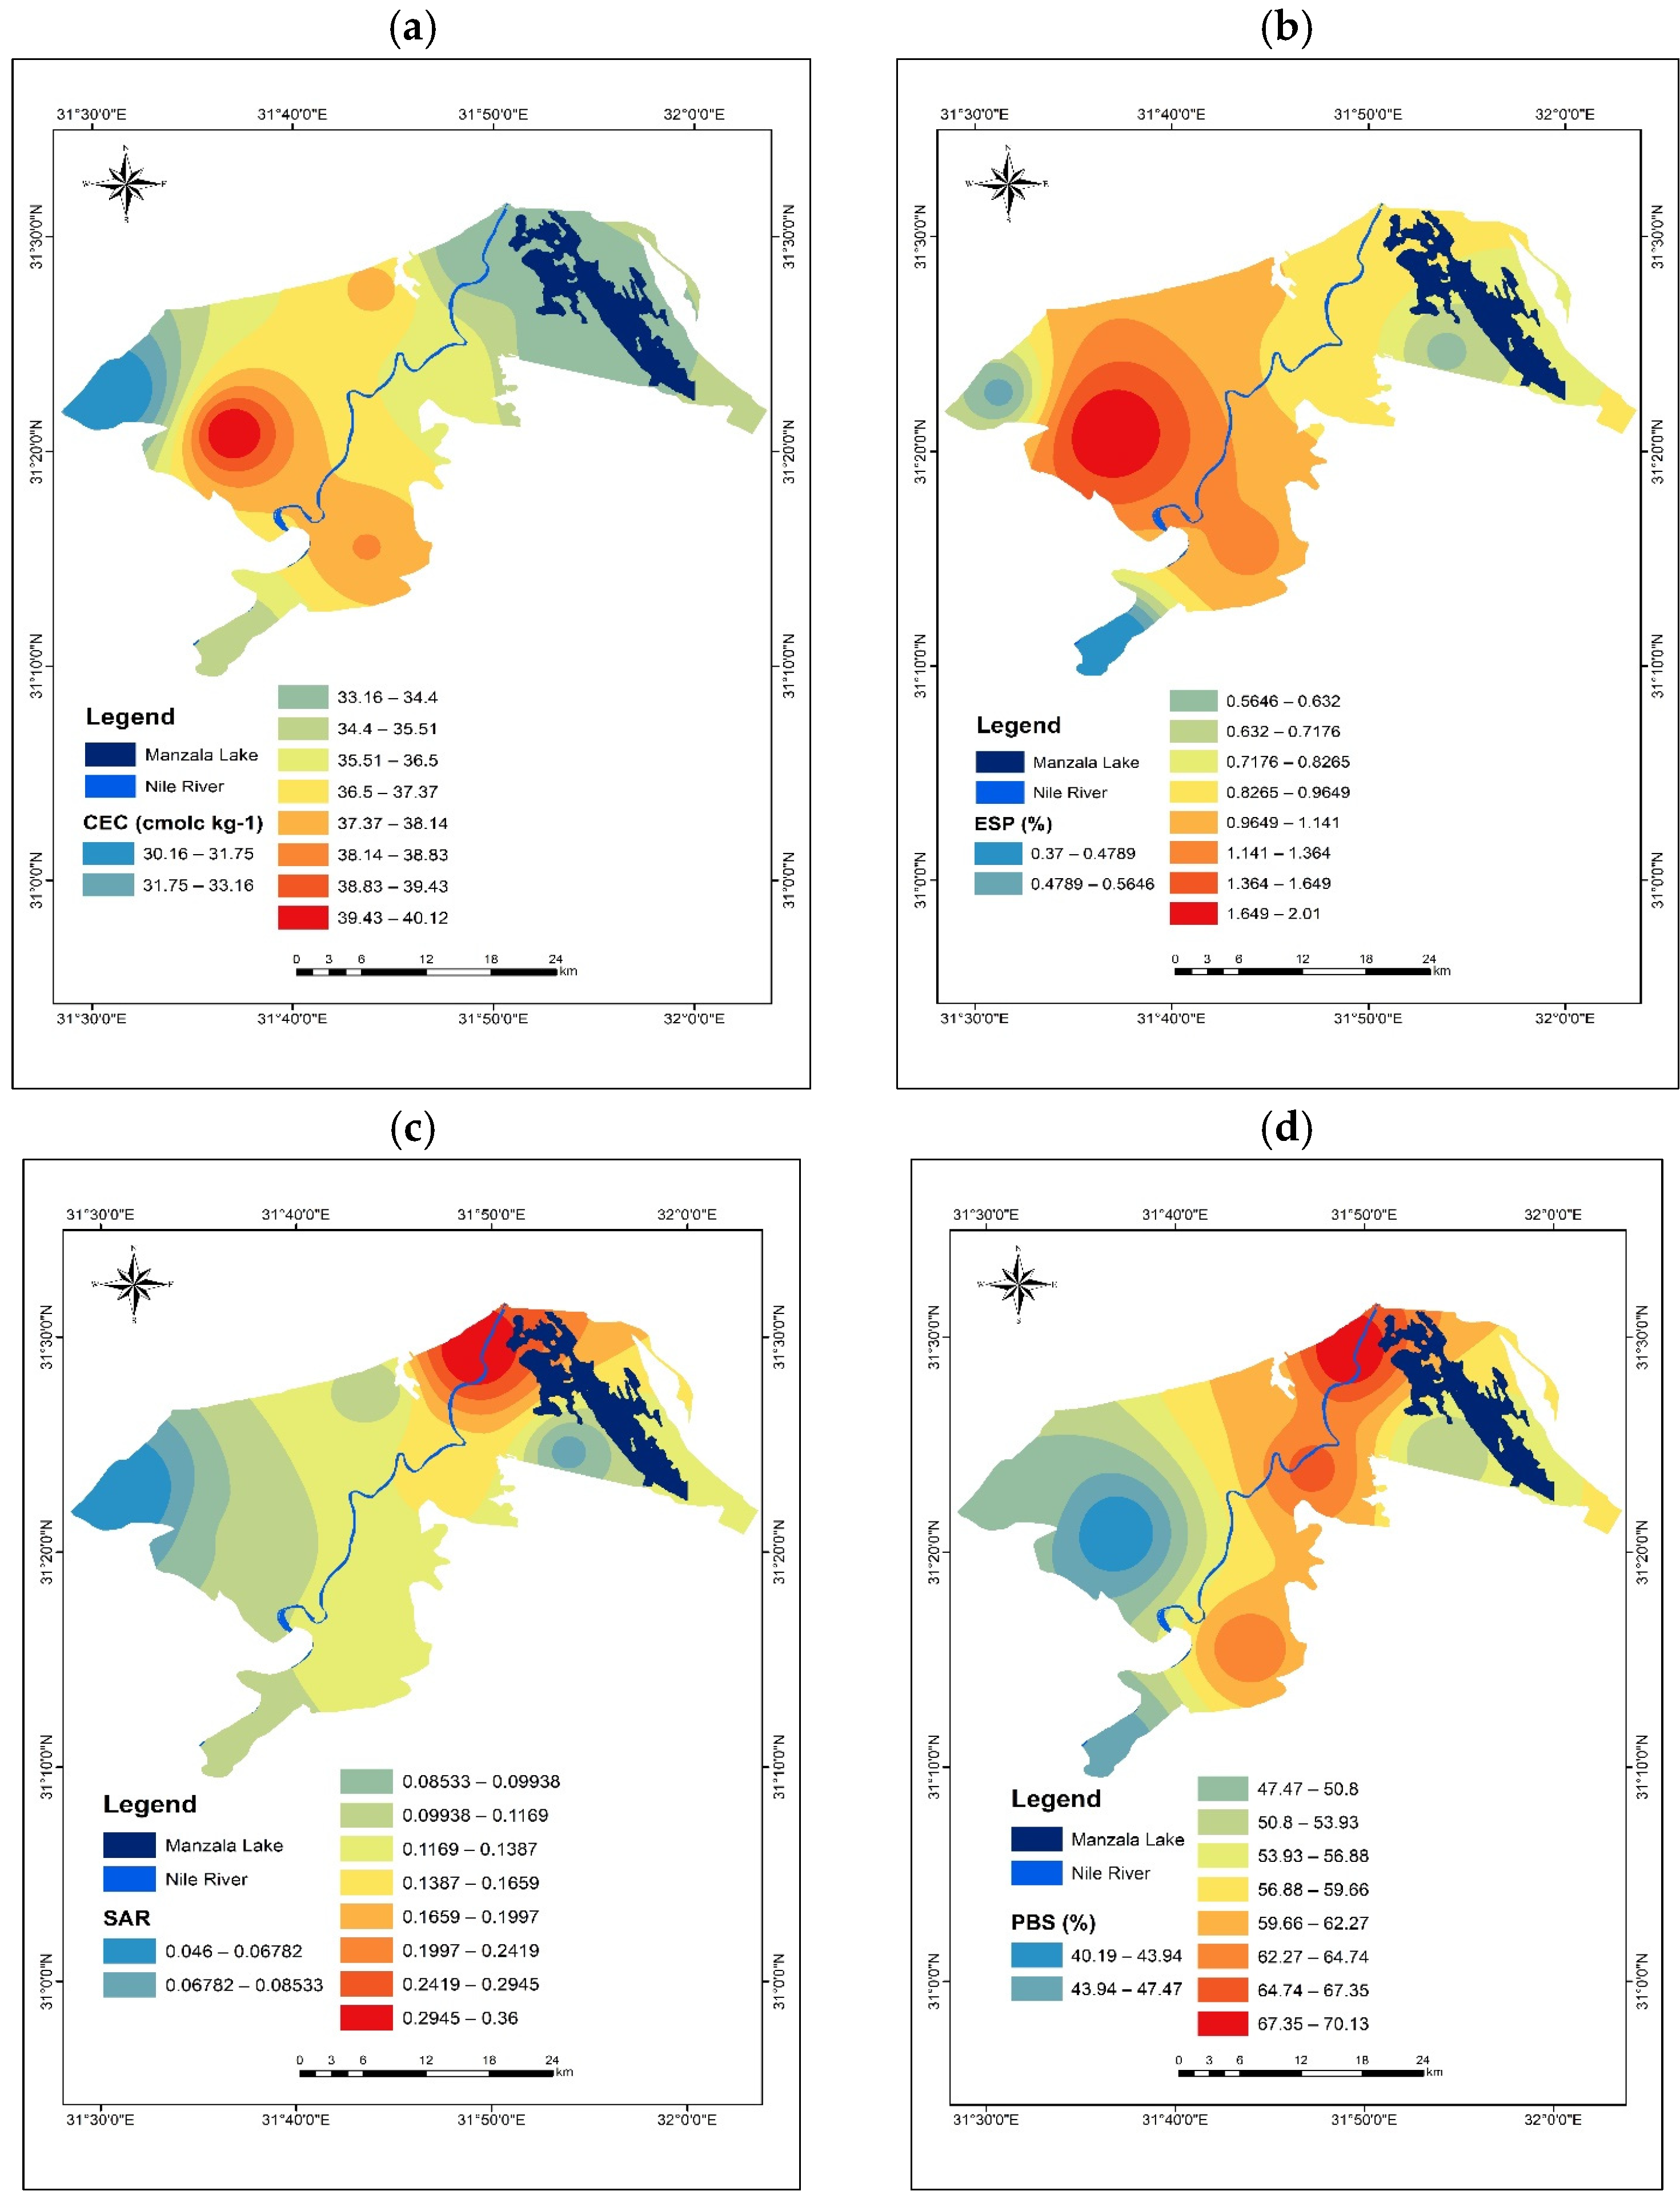
The long-term irrigation in the study area has resulted in significant increases in several soil parameters compared to rain-fed coastal marine soils, as shown in Table 7 and Figure 5a–d. One of the notable changes is the increase in cation exchange capacity (CEC) by 8.22%. This increase can be attributed to the addition of organic materials and improved cation mobility in the soil due to irrigation practices. These findings are consistent with the results reported by Diacono and Montemurro (2015) [54].
The adoption of long-term irrigation in the study area has led to significant changes in several soil parameters. The exchangeable sodium percentage (ESP) increased by 49.6%, the sodium absorption ratio (SAR) increased by 55.6%, and the percentage base saturation (PBS) increased by 10.10% due to irrigation practices. The substantial increase in SAR from 0.08 to 0.18 and ESP from 0.63 to 1.25% highlights the impact of long-term irrigation on these parameters. The overall increase in PBS from 51.97% to 57.81% indicates an improved soil fertility status in the irrigated alluvial fields. This shift from moderate fertility in the rain-fed coastal marine soils to high soil fertility in the irrigated alluvial fields suggests that irrigation has positively influenced soil fertility levels. These changes reflect the influence of irrigation on soil chemistry and fertility, emphasizing the importance of sustainable irrigation practices in enhancing soil productivity and agricultural yields in the study area [55].
The CEC calculations classify both land uses as moderate, signifying sufficient levels of basic cations in the soils. The rise in CEC values can be attributed to practices such as increased animal manure application, retention of crop residues, and enhanced soil moisture content in irrigated areas. This increase in CEC enhances the availability of soil exchangeable cations, as mentioned in a previous study [56]. These results underscore the beneficial impacts of prolonged irrigation on soil characteristics, indicating enhanced soil fertility and nutrient availability in the irrigated alluvial fields when compared to the rain-fed coastal marine soils.

3.3. Irrigation System and Soil Type Impact on Soil Organic Carbon Stock, Nitrogen Stock, and Soil Quality

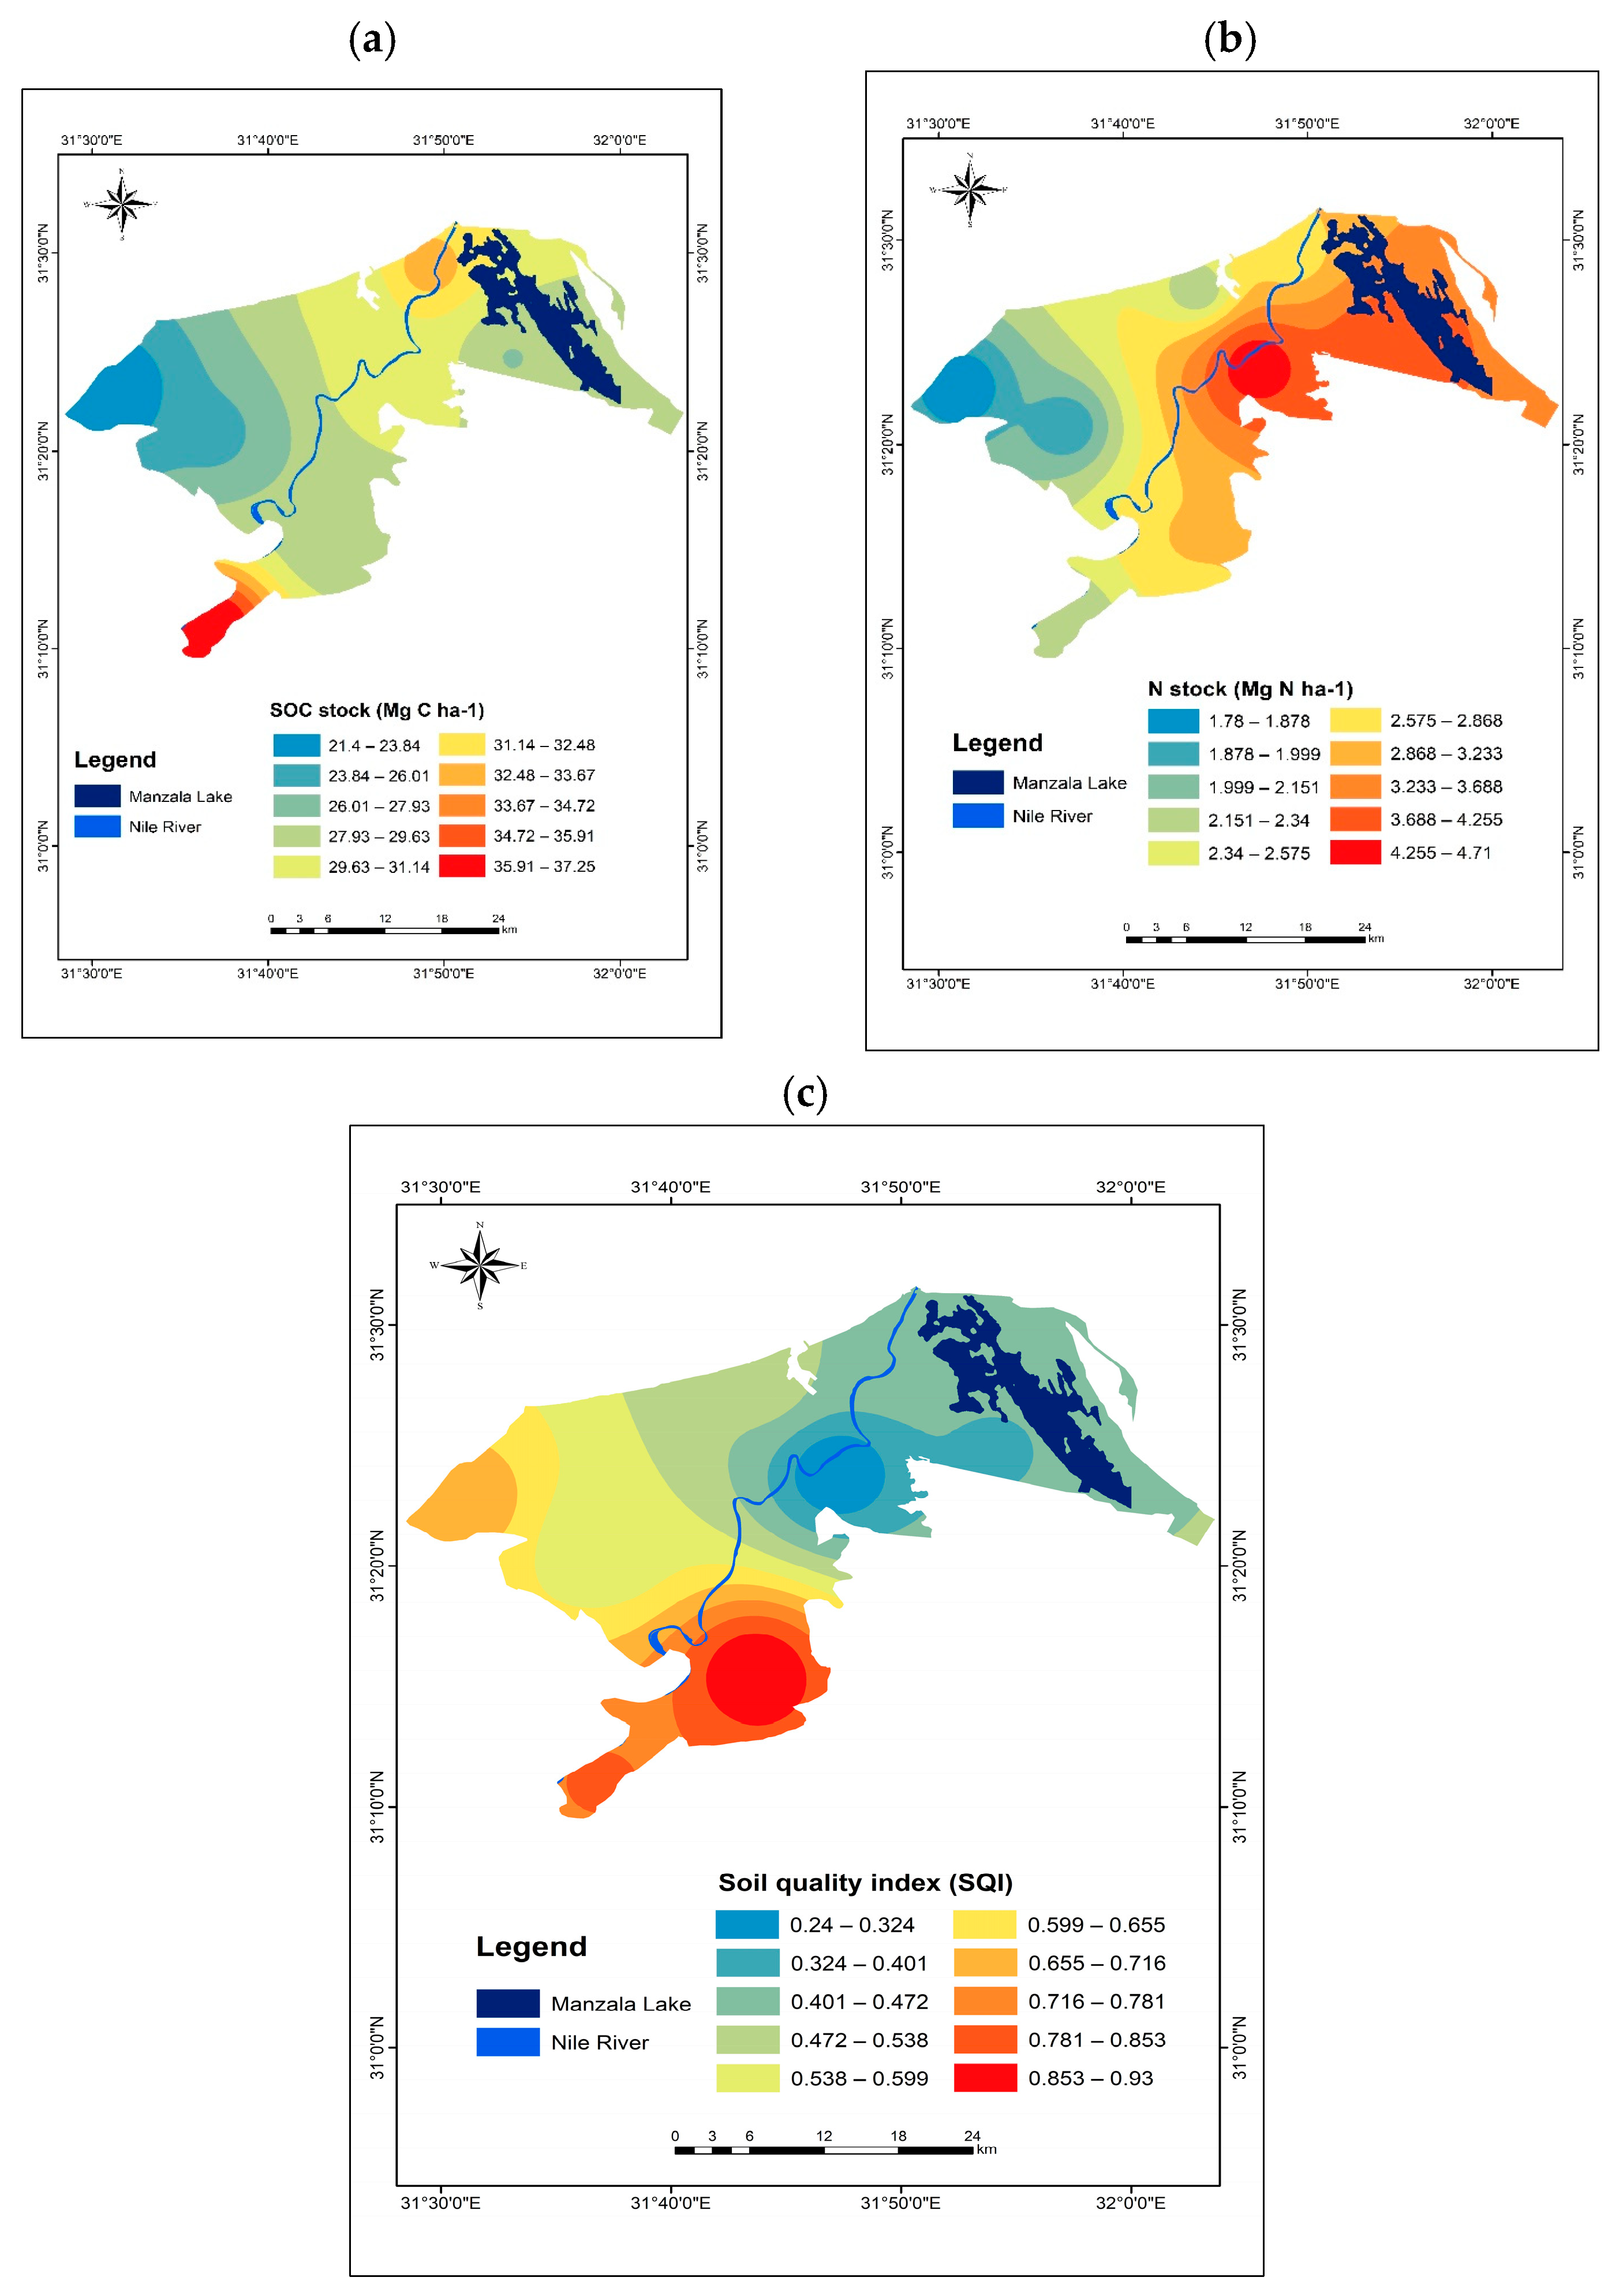
The mean soil organic carbon stock and nitrogen stock were higher on irrigated alluvial soils compared to coastal marine fields, as presented in Table 8 and Figure 6a,b. The irrigated alluvial soils had a carbon stock of 30.48 Mg C ha−1 and a nitrogen stock of 2.91 Mg N ha−1, while the coastal marine fields had a carbon stock of 28.04 Mg C ha−1 and a nitrogen stock of 2.7 Mg N ha−1. This indicates that long-term irrigation increased the SOC and N stocks by approximately 8% and 7.22%, respectively. Coastal wetlands play a crucial role in carbon sequestration, as they have the ability to store large amounts of carbon in their soils. However, converting these wetlands into farmlands or other land use types can have negative impacts on carbon sequestration and lead to increased carbon emissions [57].
The comparison between irrigated alluvial soils and coastal marine soils shows that alluvial soils had a higher soil quality index (0.86) compared to coastal marine soils (0.52), which represents a 39.53% increase, as shown in Table 8 and Figure 6c. The increased use of crop rotation, specifically between grains and vegetables, can contribute to improved soil quality. Crop rotation helps to break pest and disease cycles, enhance nutrient cycling, and improve soil structure. By diversifying the types of crops grown on irrigated soils, the soil is exposed to a wider range of root systems and organic matter inputs, leading to increased soil organic matter availability and improved soil quality [58]. Irrigation provides additional moisture to the soil, which can have a positive impact on soil quality. Adequate moisture content in the soil promotes better nutrient uptake by plants, enhances microbial activity, and improves soil structure. The availability of water through irrigation allows for more consistent and controlled soil moisture levels, which can support healthier plant growth and contribute to increased soil organic matter [59]. The increased soil organic matter availability on irrigated soils is likely a result of the combined effects of crop rotation and improved moisture content. Organic matter is a key component of soil fertility and plays a crucial role in enhancing soil structure, water-holding capacity, nutrient availability, and overall soil quality [60].

4. Conclusions and Recommendations

This study involved a comparison of soil physical and chemical characteristics, as well as soil quality indices, between fields that have been under long-term irrigation (alluvial soils) and soils that have been managed under rain-fed production systems (coastal marine fields). Comprehension of the long-term effects of irrigation practices on soil quality and basic soil characteristics is crucial for sustainable land management and agricultural production, especially in arid and semi-arid regions where water is scarce. The results showed that most soil parameters were significantly higher in alluvial soils compared to coastal marine soils. Long-term irrigation resulted in an 8% increase in SOC stocks and a 7.22% increase in N stocks compared to coastal marine soils. Additionally, the soil quality index (SQI) increased by 39.53% with long-term irrigation. These findings suggest that shifting from rain-fed agriculture in coastal marine areas to irrigated production systems in alluvial fields can improve soil quality, SOC, and N stocks. Further research is necessary to explore the effects of additional factors, including irrigation methods and soil salinity, on agricultural productivity and the sustainability of land use. Understanding how different irrigation methods and varying levels of soil salinity impact crop yields and overall soil quality will contribute to more efficient and sustainable agricultural practices.
In the scenario of long-irrigated soil that may become oversaturated due to precipitation, there are potential concerns regarding nutrient management, particularly for nitrogen (N) and phosphorus (P). When fertilizer application increases N and P concentrations in the soil, regular irrigation and additional precipitation can lead to nutrient leaching.
Excessive irrigation and precipitation can cause nutrients, including N and P, to move beyond the root zone of plants, leading to leaching into groundwater or surface water bodies. This can result in nutrient losses, environmental pollution, and potential harm to aquatic ecosystems due to eutrophication.
If the amount of fertilizer applied is not specified and there is a possibility of excess application, the risk of nutrient leaching and environmental impacts would be higher. It is crucial to practice precise nutrient management, considering the specific nutrient needs of crops, soil conditions, and environmental factors to minimize nutrient losses and ensure sustainable agricultural practices.
To address this concern, it is recommended to conduct soil testing to determine the nutrient status of the soil and apply fertilizers based on crop requirements. Implementing best management practices, such as using slow-release fertilizers, optimizing irrigation practices, and monitoring nutrient levels in the soil can help to prevent nutrient leaching and mitigate potential environmental risks associated with excess nutrient application in oversaturated soils.

Author Contributions

Conceptualization, M.E.F., Y.A.S., A.I.E.-D., E.M.S., M.Z., E.A.A., M.D. and A.S.; methodology, M.E.F., E.A.A. and M.D.; software, M.E.F. and E.A.A.; validation, M.E.F., Y.A.S., A.I.E.-D., E.M.S., M.Z., E.A.A., M.D. and A.S.; formal analysis, M.E.F., Y.A.S., A.I.E.-D. and E.A.A.; investigation, M.E.F. and E.A.A.; resources, M.E.F., Y.A.S., A.I.E.-D., E.M.S., M.Z., E.A.A., M.D. and A.S.; data curation, M.E.F., E.A.A. and M.D.; writing—original draft preparation, M.E.F., Y.A.S., A.I.E.-D., E.M.S., M.Z., E.A.A., M.D. and A.S.; writing—review and editing, M.E.F., Y.A.S., A.I.E.-D., E.M.S., M.Z., E.A.A., M.D. and A.S.; visualization, M.E.F., Y.A.S., A.I.E.-D., E.M.S., M.Z., E.A.A., M.D. and A.S.; supervision, M.E.F., M.D. and A.S.; project administration, M.E.F. and A.S.; funding acquisition, M.E.F., Y.A.S., A.I.E.-D., E.M.S., M.Z., E.A.A., M.D. and A.S. All authors have read and agreed to the published version of the manuscript.

Funding

This research received no external funding.

Institutional Review Board Statement

Not applicable.

Informed Consent Statement

Not applicable.

Data Availability Statement

Data are contained within the article.

Acknowledgments

The manuscript presented a scientific collaboration between scientific institutions in three countries (Egypt, Algeria, and Italy). The authors would like to thank the National Authority for Remote Sensing and Space Science (NARSS), Al-Azhar University, Assiut University, the National Higher School of Agronomy and Università degli Studi della Basilicata for funding the field survey and satellite data.

Conflicts of Interest

The authors declare no conflicts of interest.

References

  1. Bhattacharyya, T.; Pal, D. The Soil: A natural resource. In Soil Science: An Introduction; Rattan, R.K., Katyal, J.C., Dwivedi, B.S., Sarkar, A.K., Tapas Bhattacharyya, J.C., Tarafdar, S.K., Eds.; Bio-Green Books: Delhi, India, 2015; pp. 1–19. [Google Scholar]
  2. Kawy, W.A.; Ali, R. Assessment of soil degradation and resilience at northeast Nile Delta, Egypt: The impact on soil productivity. Egypt. J. Remote Sens. Space Sci. 2012, 15, 19–30. [Google Scholar] [CrossRef]
  3. Abd-Elmabod, S.K.; Fitch, A.C.; Zhang, Z.; Ali, R.R.; Jones, L. Rapid urbanisation threatens fertile agricultural land and soil carbon in the Nile delta. J. Environ. Manag. 2019, 252, 109668. [Google Scholar] [CrossRef] [PubMed]
  4. Arnous, M.O.; El-Rayes, A.E.; Green, D.R. Hydrosalinity and environmental land degradation assessment of the East Nile Delta region, Egypt. J. Coast. Conserv. 2015, 19, 491–513. [Google Scholar] [CrossRef]
  5. Bouzekri, A.; Alexandridis, T.K.; Toufik, A.; Rebouh, N.Y.; Chenchouni, H.; Kucher, D.; Dokukin, P.; Mohamed, E.S. Assessment of the spatial dynamics of sandy desertification using remote sensing in Nemamcha region (Algeria). Egypt. J. Remote Sens. Space Sci. 2023, 26, 642–653. [Google Scholar] [CrossRef]
  6. Fernández-Cirelli, A.; Arumí, J.L.; Rivera, D.; Boochs, P.W. Environmental effects of irrigation in arid and semi-arid regions. Chil. J. Agric. Res. 2009, 69, 27–40. [Google Scholar] [CrossRef]
  7. Sun, H.; Zhang, X.; Liu, X.; Ju, Z.; Shao, L. The long-term impact of irrigation on selected soil properties and grain production. J. Soil Water Conserv. 2018, 73, 310–320. [Google Scholar] [CrossRef]
  8. Verhulst, N.; Govaerts, B.; Verachtert, E.; Castellanos-Navarrete, A.; Mezzalama, M.; Wall, P.; Deckers, J.; Sayre, K.D. Conservation agriculture, improving soil quality for sustainable production systems? In Food Security and soil Quality, 1st ed.; Lal, R., Stewart, B.A., Eds.; CRC Press: Boca Raton, FL, USA, 2010; pp. 137–208. [Google Scholar] [CrossRef]
  9. Elbasiouny, H.; Abowaly, M.; Abu_Alkheir, A.; Gad, A.A. Spatial variation of soil carbon and nitrogen pools by using ordinary Kriging method in an area of north Nile Delta, Egypt. Catena 2014, 113, 70–78. [Google Scholar] [CrossRef]
  10. Usman, A.R.A.; Al-Wabel, M.I.; Abdulaziz, A.H.; Mahmoud, W.A.; El-naggar, A.H.; Ahmad, M.; Abdulelah, A.F.; Abdulrasoul, A.O. Conocarpus biochar induces changes in soil nutrient availability and tomato growth under saline irrigation. Pedosphere 2016, 26, 27–38. [Google Scholar] [CrossRef]
  11. Wang, R.; Zhou, J.; Xie, J.; Khan, A.; Yang, X.; Sun, B.; Zhang, S. Carbon sequestration in irrigated and rain-fed cropping systems under long-term fertilization regimes. J. Soil Sci. Plant Nutr. 2020, 20, 941–952. [Google Scholar] [CrossRef]
  12. Turmel, M.S.; Speratti, A.; Baudron, F.; Verhulst, N.; Govaerts, B. Crop residue management and soil health: A systems analysis. Agric. Syst. 2015, 134, 6–16. [Google Scholar] [CrossRef]
  13. Abdallah, S.; El-Ramady, H.R. Monitoring of nitrogen and phosphorus forms in some water canals in delta region, Egypt. J. Environ. Sci. Toxicol. Food Technol. 2019, 13, 54–69. [Google Scholar] [CrossRef]
  14. Yan, Z.; Zhang, W.; Wang, Q.; Liu, E.; Sun, D.; Liu, B.; Liu, X.; Mei, X. Changes in soil organic carbon stocks from reducing irrigation can be offset by applying organic fertilizer in the North China Plain. Agric. Water Manag. 2022, 266, 107539. [Google Scholar] [CrossRef]
  15. Yan, S.; Gao, Y.; Tian, M.; Tian, Y.; Li, J. Comprehensive evaluation of effects of various carbon-rich amendments on tomato production under continuous saline water irrigation: Overall soil quality, plant nutrient uptake, crop yields and fruit quality. Agric. Water Manag. 2021, 255, 106995. [Google Scholar] [CrossRef]
  16. Bouyoucos, G.J. Hydrometer method improved for making particle size analyses of soils. Agron. J. 1962, 54, 464–465. [Google Scholar] [CrossRef]
  17. Rhoades, J. Cation exchange capacity. In Methods of Soil Analysis: Part 2-Chemical and Microbiological Properties, 2nd ed.; Page, A.L., Ed.; Agronomy Monographs: Madison, WI, USA, 1983; pp. 149–157. [Google Scholar] [CrossRef]
  18. Walkley, A.; Black, I.A. An examination of the Degtjareff method for determining soil organic matter, and a proposed modification of the chromic acid titration method. Soil Sci. 1934, 37, 29–38. [Google Scholar] [CrossRef]
  19. Bremner, J.M.; Mulvaney, C.S. Nitrogen-Total. In Methods of Soil Analysis: Part 2-Chemical and Microbiological Properties, 2nd ed.; Page, A.L., Ed.; Agronomy Monographs: Madison, WI, USA, 1983; pp. 595–624. [Google Scholar] [CrossRef]
  20. Blake, G.R. Bulk density. In Methods of Soil Analysis: Part 1-Physical and Mineralogical Methods, Including Statistics of Measurement and Sampling; Black, C.A., Ed.; Agronomy Monographs: Madison, WI, USA, 1965; pp. 374–390. [Google Scholar] [CrossRef]
  21. Olsen, R.; Cole, C.V.; Watanabe, F.S.; Dean, L.A. Estimation of Available Phosphorus in Soils by Extraction with Sodium Bicarbonate; USDA Circular No. 939 USDQ; Government Printing Office: Washington, DC, USA, 1954; pp. 1–19. [Google Scholar]
  22. Knudsen, D.; Peterson, G.A.; Pratt, P.F. Lithium, Sodium and Potassium. In Methods of Soil Analysis: Part 2-Chemical and Microbiological Properties, 2nd ed.; Page, A.L., Ed.; Agronomy Monographs: Madison, WI, USA, 1983; pp. 225–246. [Google Scholar] [CrossRef]
  23. Lanyon, L.E.; Heald, W.R. Magnesium, Calcium, Strontium, and Barium. In Methods of Soil Analysis: Part 2-Chemical and Microbiological Properties, 2nd ed.; Page, A.L., Ed.; Agronomy Monographs: Madison, WI, USA, 1983; pp. 247–262. [Google Scholar] [CrossRef]
  24. Serme, I.; Ouattara, K.; Ouattara, B.; Taonda, S.J.B. Short term impact of tillage and fertility management on Lixisol structural degradation. Int. J. Agric. Policy Res. 2016, 4, 1–6. [Google Scholar] [CrossRef]
  25. Richards, L.A. Diagnosis and Improvement of Saline and Alkali Soils; US Government Printing Office: Washington, DC, USA, 1954. Available online: https://www.ars.usda.gov/ARSUserFiles/20360500/hb60_pdf/hb60complete.pdf (accessed on 8 February 2024).
  26. Ellert, B.; Bettany, J. Calculation of organic matter and nutrients stored in soils under contrasting management regimes. Can. J. Soil Sci. 1995, 75, 529–538. [Google Scholar] [CrossRef]
  27. Selmy, S.A.; Al-Aziz, S.H.A.; Jiménez-Ballesta, R.; García-Navarro, F.J.; Fadl, M.E. Soil quality assessment using multivariate approaches: A case study of the dakhla oasis arid lands. Land 2021, 10, 1074. [Google Scholar] [CrossRef]
  28. Joimel, S.; Cortet, J.; Jolivet, C.C.; Saby, N.; Chenot, E.-D.; Branchu, P.; Consalès, J.-N.; Lefort, C.; Morel, J.-L.; Schwartz, C. Physico-chemical characteristics of topsoil for contrasted forest, agricultural, urban and industrial land uses in France. Sci. Total Environ. 2016, 545, 40–47. [Google Scholar] [CrossRef]
  29. Howard, M.C. A review of exploratory factor analysis decisions and overview of current practices: What we are doing and how can we improve? Int. J. Hum.-Comput. Interact. 2016, 32, 51–62. [Google Scholar] [CrossRef]
  30. Yu, P.; Han, D.; Liu, S.; Wen, X.; Huang, Y.; Jia, H. Soil quality assessment under different land uses in an alpine grassland. Catena 2018, 171, 280–287. [Google Scholar] [CrossRef]
  31. Braver, S.L.; MacKinnon, D.P.; Page, M. Levine’s Guide to SPSS for Analysis of Variance, 2nd ed.; Psychology Press: New York, NY, USA, 2003. [Google Scholar] [CrossRef]
  32. Kim, T.K. T test as a parametric statistic. Korean J. Anesthesiol. 2015, 68, 540–546. [Google Scholar] [CrossRef] [PubMed]
  33. Carmer, S.; Swanson, M. Detection of differences between means: A Monte Carlo study of five pairwise multiple comparison procedures. Agron. J. 1971, 63, 940–945. [Google Scholar] [CrossRef]
  34. Amacher, M.C.; O’Neil, K.P.; Perry, C.H. Soil Vital Signs: A New Soil Quality Index (SQI) for Assessing Forest Soil Health; Res. Pap. RMRS-RP-65; Department of Agriculture, Forest Service, Rocky Mountain Research Station: Fort Collins, CO, USA, 2007; p. 12. [Google Scholar] [CrossRef]
  35. Celik, I.; Gunal, H.; Budak, M.; Akpinar, C. Effects of long-term organic and mineral fertilizers on bulk density and penetration resistance in semi-arid Mediterranean soil conditions. Geoderma 2010, 160, 236–243. [Google Scholar] [CrossRef]
  36. Katsumi, N.; Kusube, T.; Nagao, S.; Okochi, H. The role of coated fertilizer used in paddy fields as a source of microplastics in the marine environment. Mar. Pollut. Bull. 2020, 161, 111727. [Google Scholar] [CrossRef] [PubMed]
  37. Moraru, S.S.; Ene, A.; Badila, A. Physical and hydro-physical characteristics of soil in the context of climate change. A case study in Danube river basin, SE Romania. Sustainability 2020, 12, 9174. [Google Scholar] [CrossRef]
  38. Denef, K.; Stewart, C.; Brenner, J.; Paustian, K. Does long-term center-pivot irrigation increase soil carbon stocks in semi-arid agro-ecosystems? Geoderma 2008, 145, 121–129. [Google Scholar] [CrossRef]
  39. Abuamarah, B.A.; Nabawy, B.S.; Shehata, A.M.; Kassem, O.M.; Ghrefat, H. Integrated geological and petrophysical characterization of oligocene deep marine unconventional poor to tight sandstone gas reservoir. Mar. Pet. Geol. 2019, 109, 868–885. [Google Scholar] [CrossRef]
  40. Emudianughe, J.E.; Eze, P.; Utah, S. Porosity And Permeability Trend In Agbami-Field Using Well Log, Offshore, Niger Delta. Commun. Phys. Sci. 2021, 7, 531–541. [Google Scholar]
  41. El Bourhrami, B.; Ibno Namr, K.; Et-Tayeb, H.; Duraisamy, V. Application of Soil Quality Index to Assess the Status of Soils Submitted to Intensive Agriculture in the Irrigated Plain of Doukkala, Moroccan Semiarid Region. Ecol. Eng. Environ. Technol. 2022, 2, 129–143. [Google Scholar] [CrossRef]
  42. Alinejadian-Bidabadi, A.; Maleki, A.; Roshaniyan, M. The impact of tillage systems and crop residues on microbial mass and soil structure stability indices. Span. J. Agric. Res. 2021, 19, e1101. [Google Scholar] [CrossRef]
  43. Santos, R.S.; Wiesmeier, M.; Cherubin, M.R.; Oliveira, D.M.; Locatelli, J.L.; Holzschuh, M.; Cerri, C.E. Consequences of land-use change in Brazil’s new agricultural frontier: A soil physical health assessment. Geoderma 2021, 400, 115149. [Google Scholar] [CrossRef]
  44. Adejumobi, M.; Ojediran, J.; Olabiyi, O. Effects of irrigation practices on some soil chemical properties on OMI irrigation scheme. Int. J. Eng. Res. Appl. 2014, 4, 29–35. [Google Scholar]
  45. Drosos, M.; Orlando, M.; Cozzolino, V.; Scopa, A.; Piccolo, A. Deriving the Shannon index from the soil molecular Humeome serves as a descriptor of soil organic matter stability under different cropping systems. Chem. Biol. Technol. Agric. 2023, 10, 105. [Google Scholar] [CrossRef]
  46. Pan, G.; Li, L.; Wu, L.; Zhang, X. Storage and sequestration potential of topsoil organic carbon in China’s paddy soils. Glob. Chang. Biol. 2004, 10, 79–92. [Google Scholar] [CrossRef]
  47. Azouzi, R.; Charef, A.; Zaghdoudi, S.; Khadhar, S.; Shabou, N.; Boughanmi, H.; Hjiri, B.; Hajjaj, S. Effect of long-term irrigation with treated wastewater of three soil types on their bulk densities, chemical properties and PAHs content in semi-arid climate. Arab. J. Geosci. 2016, 9, 3. [Google Scholar] [CrossRef]
  48. Khaskhoussy, K.; Kahlaoui, B.; Misle, E.; Hachicha, M. Impact of irrigation with treated wastewater on physical-chemical properties of two soil types and corn plant (Zea mays). J. Soil Sci. Plant Nutr. 2022, 22, 1377–1393. [Google Scholar] [CrossRef]
  49. Kumar, V.; Chopra, A. Impact on physico-chemical characteristics of soil after irrigation with distillery effluent. Arch. Appl. Sci. Res. 2011, 3, 63–77. [Google Scholar]
  50. Takase, M.; Sam-Amoah, L.; Owusu-Sekyere, J. The effects of four sources of irrigation water on soil chemical and physical properties. Asian J. Plant Sci. 2011, 10, 92–96. [Google Scholar] [CrossRef]
  51. Tarchouna, L.G.; Merdy, P.; Raynaud, M.; Pfeifer, H.R.; Lucas, Y. Effects of long-term irrigation with treated wastewater. Part I: Evolution of soil physico-chemical properties. Appl. Geochem. 2010, 25, 1703–1710. [Google Scholar] [CrossRef]
  52. Al-Ghobari, H. The effect of irrigation water quality on soil properties under center pivot irrigation systems in central Saudi Arabia. WIT Trans. Ecol. Environ. 2011, 145, 507–516. [Google Scholar] [CrossRef]
  53. Yang, H.; An, F.; Yang, F.; Wang, Z. The impact of irrigation on yield of alfalfa and soil chemical properties of saline-sodic soils. PeerJ 2019, 7, e7148. [Google Scholar] [CrossRef] [PubMed]
  54. Diacono, M.; Montemurro, F. Effectiveness of organic wastes as fertilizers and amendments in salt-affected soils. Agriculture 2015, 5, 221–230. [Google Scholar] [CrossRef]
  55. Uwingabire, S.; Msanya, B.M.; Mtakwa, P.W.; Uwitonze, P.; Sirikare, S. Pedological characterisation of soils developed on gneissic-granites in the Congo Nile watershed divide and central Plateau zones, Rwanda. Int. J. Curr. Res. 2016, 8, 39489–39501. [Google Scholar]
  56. Young, R.; Huth, N.; Harden, S.; McLeod, R. Impact of rain-fed cropping on the hydrology and fertility of alluvial clays in the more arid areas of the upper Darling Basin, eastern Australia. Soil Res. 2014, 52, 388–408. [Google Scholar] [CrossRef]
  57. Yang, W.; Xia, L.; Zhu, Z.; Jiang, L.; Cheng, X.; An, S. Shift in soil organic carbon and nitrogen pools in different reclaimed lands following intensive coastal reclamation on the coasts of eastern China. Sci. Rep. 2019, 9, 5921. [Google Scholar] [CrossRef] [PubMed]
  58. Yu, J.; Zhan, C.; Li, Y.; Zhou, D.; Fu, Y.; Chu, X.; Xing, Q.; Han, G.; Wang, G.; Guan, B. Distribution of carbon, nitrogen and phosphorus in coastal wetland soil related land use in the Modern Yellow River Delta. Sci. Rep. 2016, 6, 37940. [Google Scholar] [CrossRef] [PubMed]
  59. Amorim, H.C.; Ashworth, A.J.; Brye, K.R.; Wienhold, B.J.; Savin, M.C.; Owens, P.R.; Silva, S.H. Soil quality indices as affected by long-term burning, irrigation, tillage, and fertility management. Soil Sci. Soc. Am. J. 2021, 85, 379–395. [Google Scholar] [CrossRef]
  60. Iheshiulo, E.M.A.; Larney, F.J.; Hernandez-Ramirez, G.; Luce, M.S.; Chau, H.W.; Liu, K. Soil organic matter and aggregate stability dynamics under major no-till crop rotations on the Canadian prairies. Geoderma 2024, 442, 116777. [Google Scholar] [CrossRef]
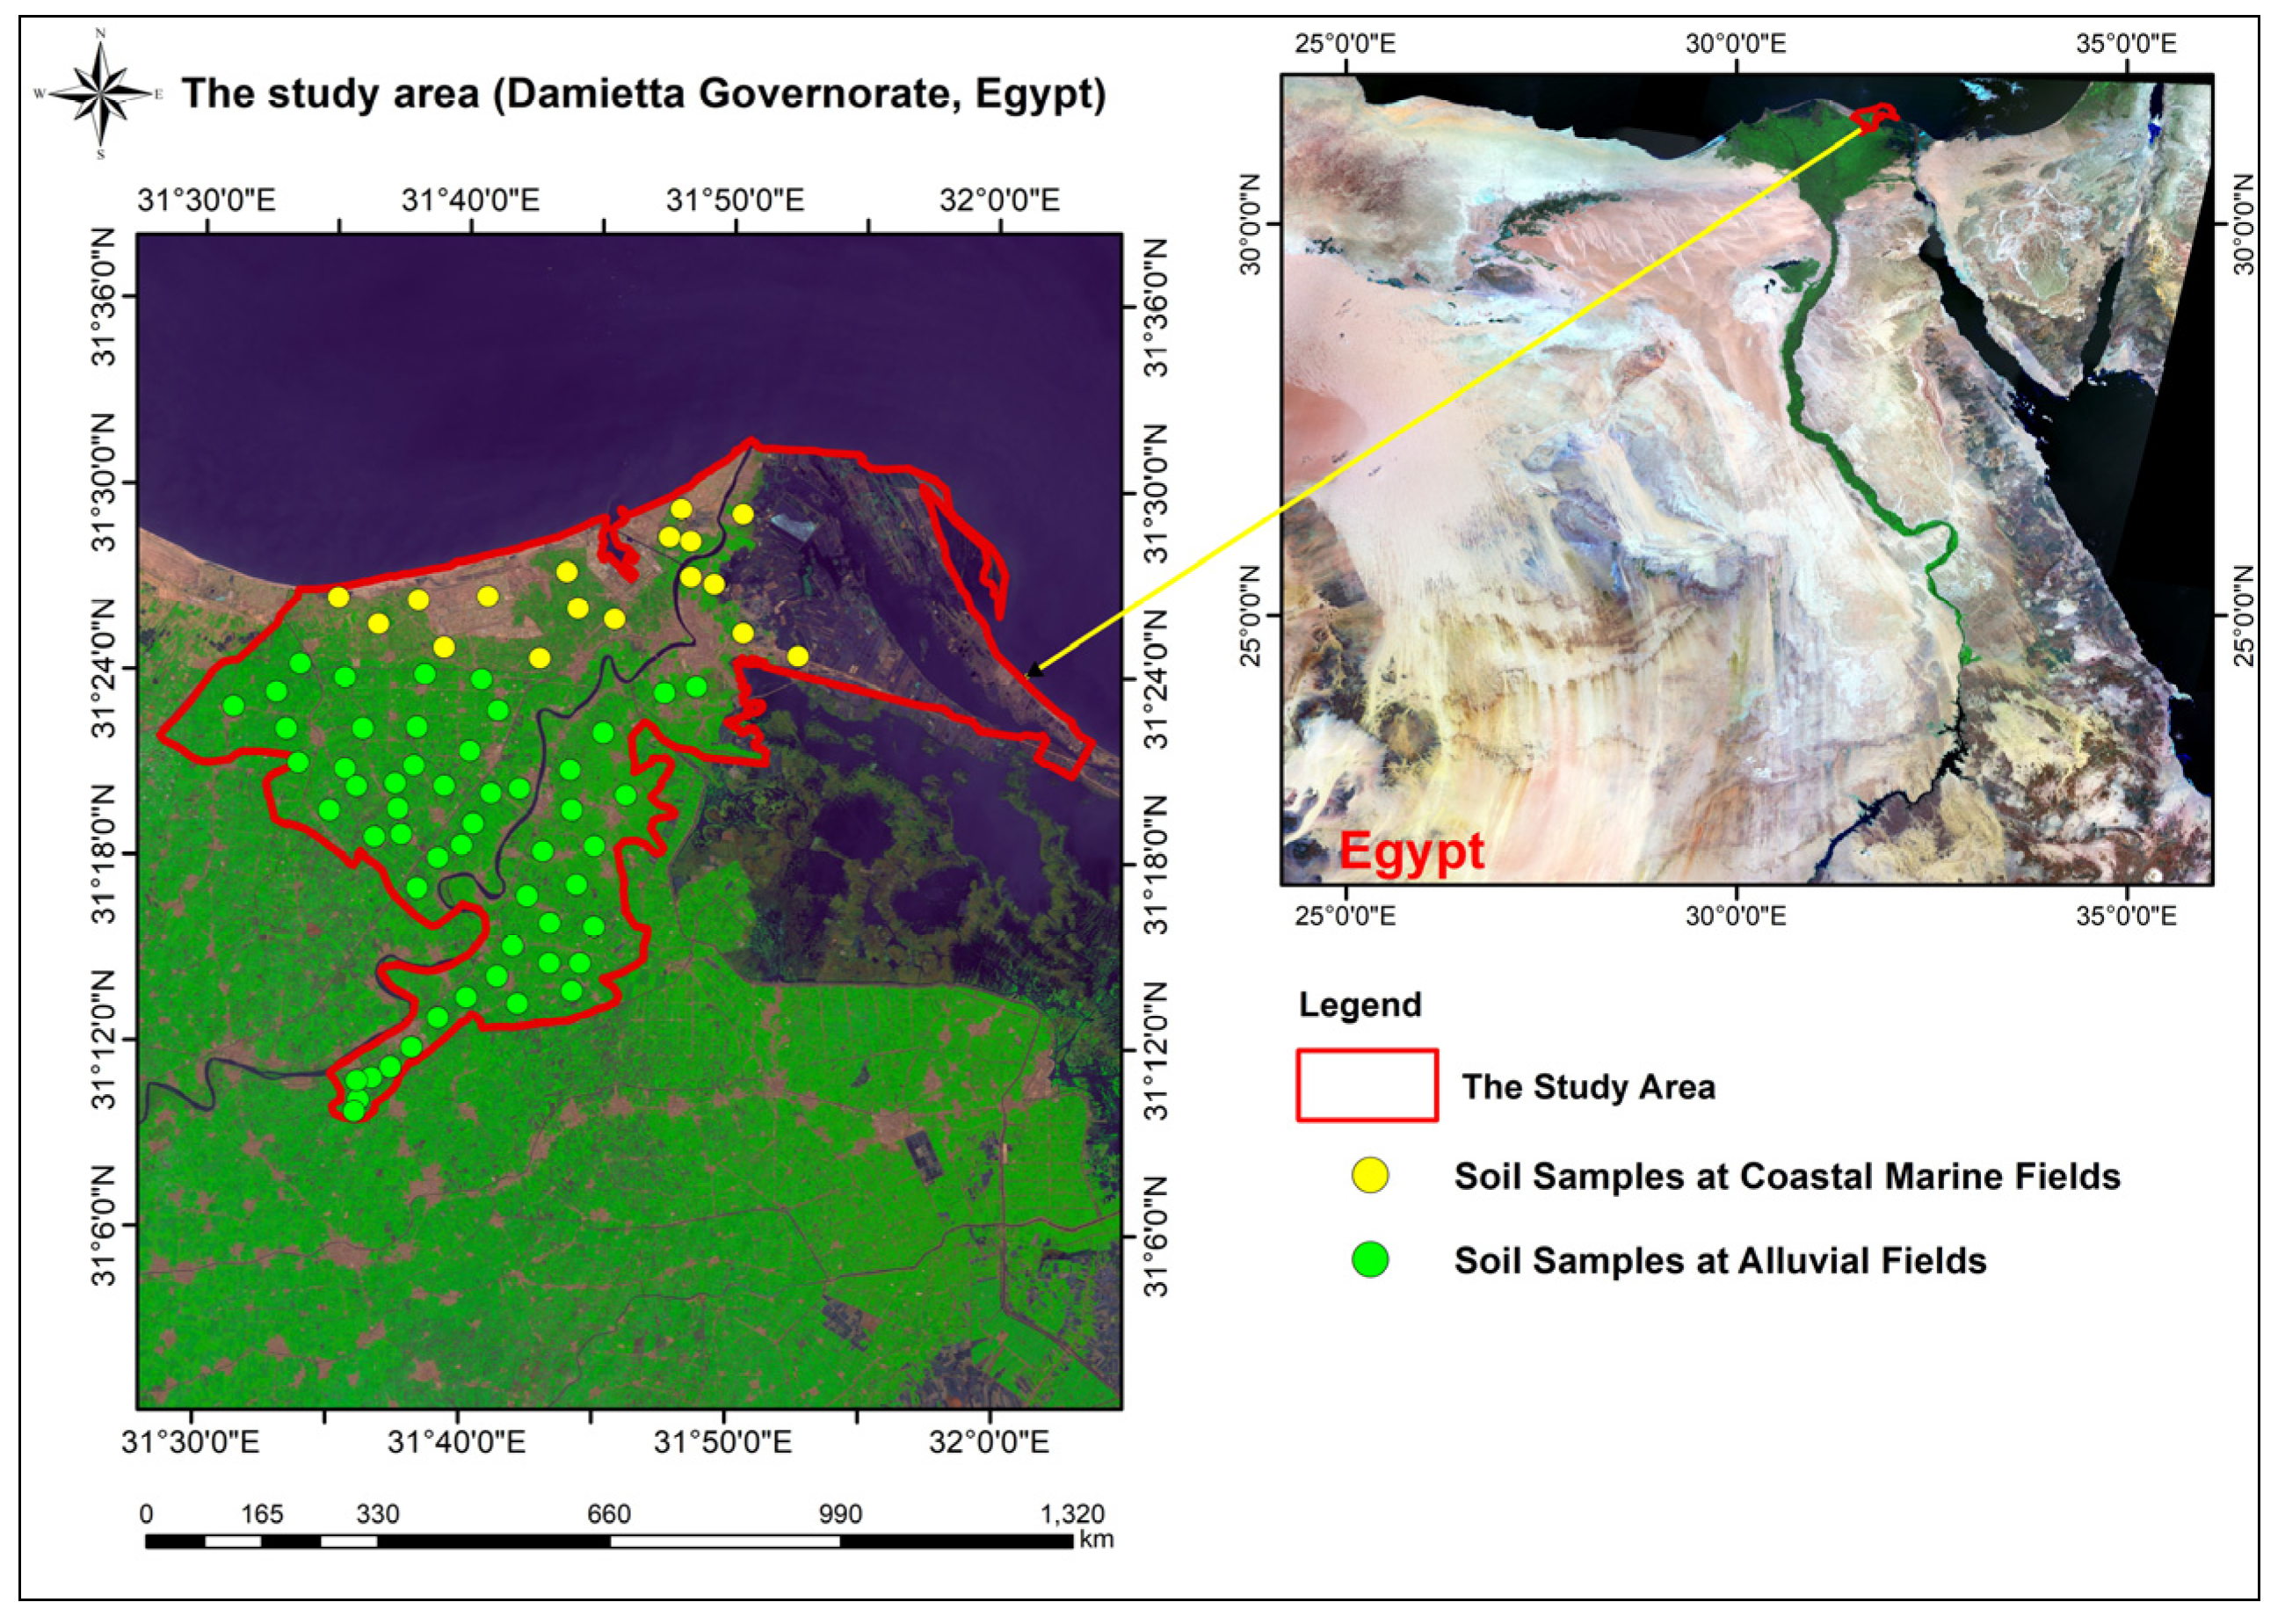
Figure 1. Location map of the study area.
Soilsystems 08 00052 g001
Figure 2. Physiographical map of the investigated area.
Soilsystems 08 00052 g002
Figure 3. Bulk density (BD) (a), total porosity (b), and soil structural stability index (SSI) (c) distribution in the study area.
Soilsystems 08 00052 g003
Figure 4. Soil chemical characteristics distribution in the study area: SOC (a); TN (b); P (c); C:N ratio (d); pH (e); and EC (f).
Soilsystems 08 00052 g004
Figure 5. Some soil parameter distribution in the study area: CEC (a); ESP (b); SAR (c); PBS (d).
Soilsystems 08 00052 g005
Figure 6. Soil organic carbon stock (a), nitrogen stock (b), and soil quality index (c) distribution in the study area.
Soilsystems 08 00052 g006
Table 1. Meteorological data from Damietta Governorate.
MonthAverage Temperature °CRainfall
mm
Relative
Humidity
%
Evaporation
mm/Day
Wind Speed
(Knots)
Max
°C
Min
°C
Mean
°C
January17.910.114.962.067.32.45.2
February18.110.215.432.064.92.66.0
March19.812.017.119.464.13.06.1
April21.014.420.05.863.03.56.2
May26.117.322.92.063.44.05.8
June28.820.727.00.164.04.25.9
July30.323.027.70.066.64.05.7
August30.623.328.00.066.83.75.3
September29.321.826.73.864.83.65.0
October27.119.424.28.465.33.34.7
November23.215.720.329.266.72.95.0
December19.411.716.553.969.22.45.0
Table 2. Physiographical units of Damietta Governorate.
UnitsArea km−2
Flood plain117.19
Fluvio-marine plain83.47
Old alluvial plain60.89
Recent alluvial plain508.36
Fish farms65.86
Lake10.02
Total845.79
Table 3. Soil characteristics examined and the techniques used for analyses.
Soil ParametersMethodsReferences
Soil textureHydrometer method (Bouyoucos 1962)[16]
Cation exchange capacity (CEC) (cmolc kg−1)Ammonium acetate method[17]
Electric conductivity (EC dS m−1)EC meter
pHElectronic pH meter
Organic carbon (OC %)Walkley–Black methods[18]
Total nitrogen (TN %)Kjeldahl digestion method (1983)[19]
Bulk density (Mg m−3)Using a core sampler[20]
Phosphorus (P mg kg−1)Olsen-P methods (1954)[21]
Sodium (Na) and potassium (K cmolc kg−1)Flame photometry[22]
Calcium (Ca) and magnesium (Mg cmolc kg−1)Atomic absorption spectrometer (AAS)[23]
Table 5. Comparison of soil physical characteristics between alluvial and coastal marine soils.
Soil CharacteristicsSoil TypeMeanp-Value
BD (Mg m−3)Alluvial1.305 (±0.133)0.174
Coastal Marine1.350 (±0.181)
TP (%)Alluvial43.490 (±9.390)0.168
Coastal Marine39.980 (±10.025)
SSI (%)Alluvial1.910 (±0.516)0.042 a
Coastal Marine1.540 (±0.384)
±, standard deviation; a indicates a statistically significant difference between the alluvial and coastal marine fields.
Table 6. Comparison of soil chemical characteristics between alluvial and coastal marine soils.
Soil CharacteristicsSoil TypeMeanp-Value
SOC (%)Alluvial1.20 (±0.059)0.0001 a
Coastal Marine1.13 (±0.161)
TN (%)Alluvial0.14 (±0.069)0.0001 a
Coastal Marine0.09 (±0.032)
P (mg kg−1)Alluvial13.68 (±3.152)0.029 a
Coastal Marine6.48 (±2.339)
C:NAlluvial10.07 (±2.175)0.035 a
Coastal Marine12.80 (±3.083)
pHAlluvial8.02 (±0.287)0.0001 a
Coastal Marine7.34 (±0.189)
EC (dS m−1)Alluvial0.76 (±0.282)0.0001 a
Coastal Marine0.36 (±0.270)
±, standard deviation; a indicates a statistically significant difference between the alluvial and coastal marine fields.
Table 7. Comparison of some basic soil parameters between alluvial and coastal marine soils.
Soil CharacteristicsSoil TypeMeanp-Value
CEC (cmolc kg−1)Alluvial36.99 (±2.951)0.192
Coastal Marine33.95 (±3.146)
ESP (%)Alluvial1.25 (±0.519)0.0001 a
Coastal Marine0.63 (±0.257)
SARAlluvial0.18 (±0.120)0.0001 a
Coastal Marine0.08 (±0.025)
PBS (%)Alluvial57.81 (±12.95)0.0001 a
Coastal Marine51.97 (±5.779)
±, standard deviation; a indicates a statistically significant difference between the alluvial and coastal marine fields.
Table 8. Comparison of soil organic carbon stock, nitrogen stock, and soil quality between alluvial and coastal marine soils.
ParametersSoil TypeMeanp-Value
SOC stock (Mg C ha−1)Alluvial30.48 (±5.084)0.0001 a
Coastal Marine28.04 (±4.936)
N stock (Mg N ha−1)Alluvial2.91 (±1.271)0.0001 a
Coastal Marine2.70 (±1.039)
Soil quality index (SQI)Alluvial0.86 (±0.290)0.0001 a
Coastal Marine0.52 (±0.127)
±, standard deviation; a indicates a statistically significant difference between the alluvial and coastal marine fields.
Disclaimer/Publisher’s Note: The statements, opinions and data contained in all publications are solely those of the individual author(s) and contributor(s) and not of MDPI and/or the editor(s). MDPI and/or the editor(s) disclaim responsibility for any injury to people or property resulting from any ideas, methods, instructions or products referred to in the content.