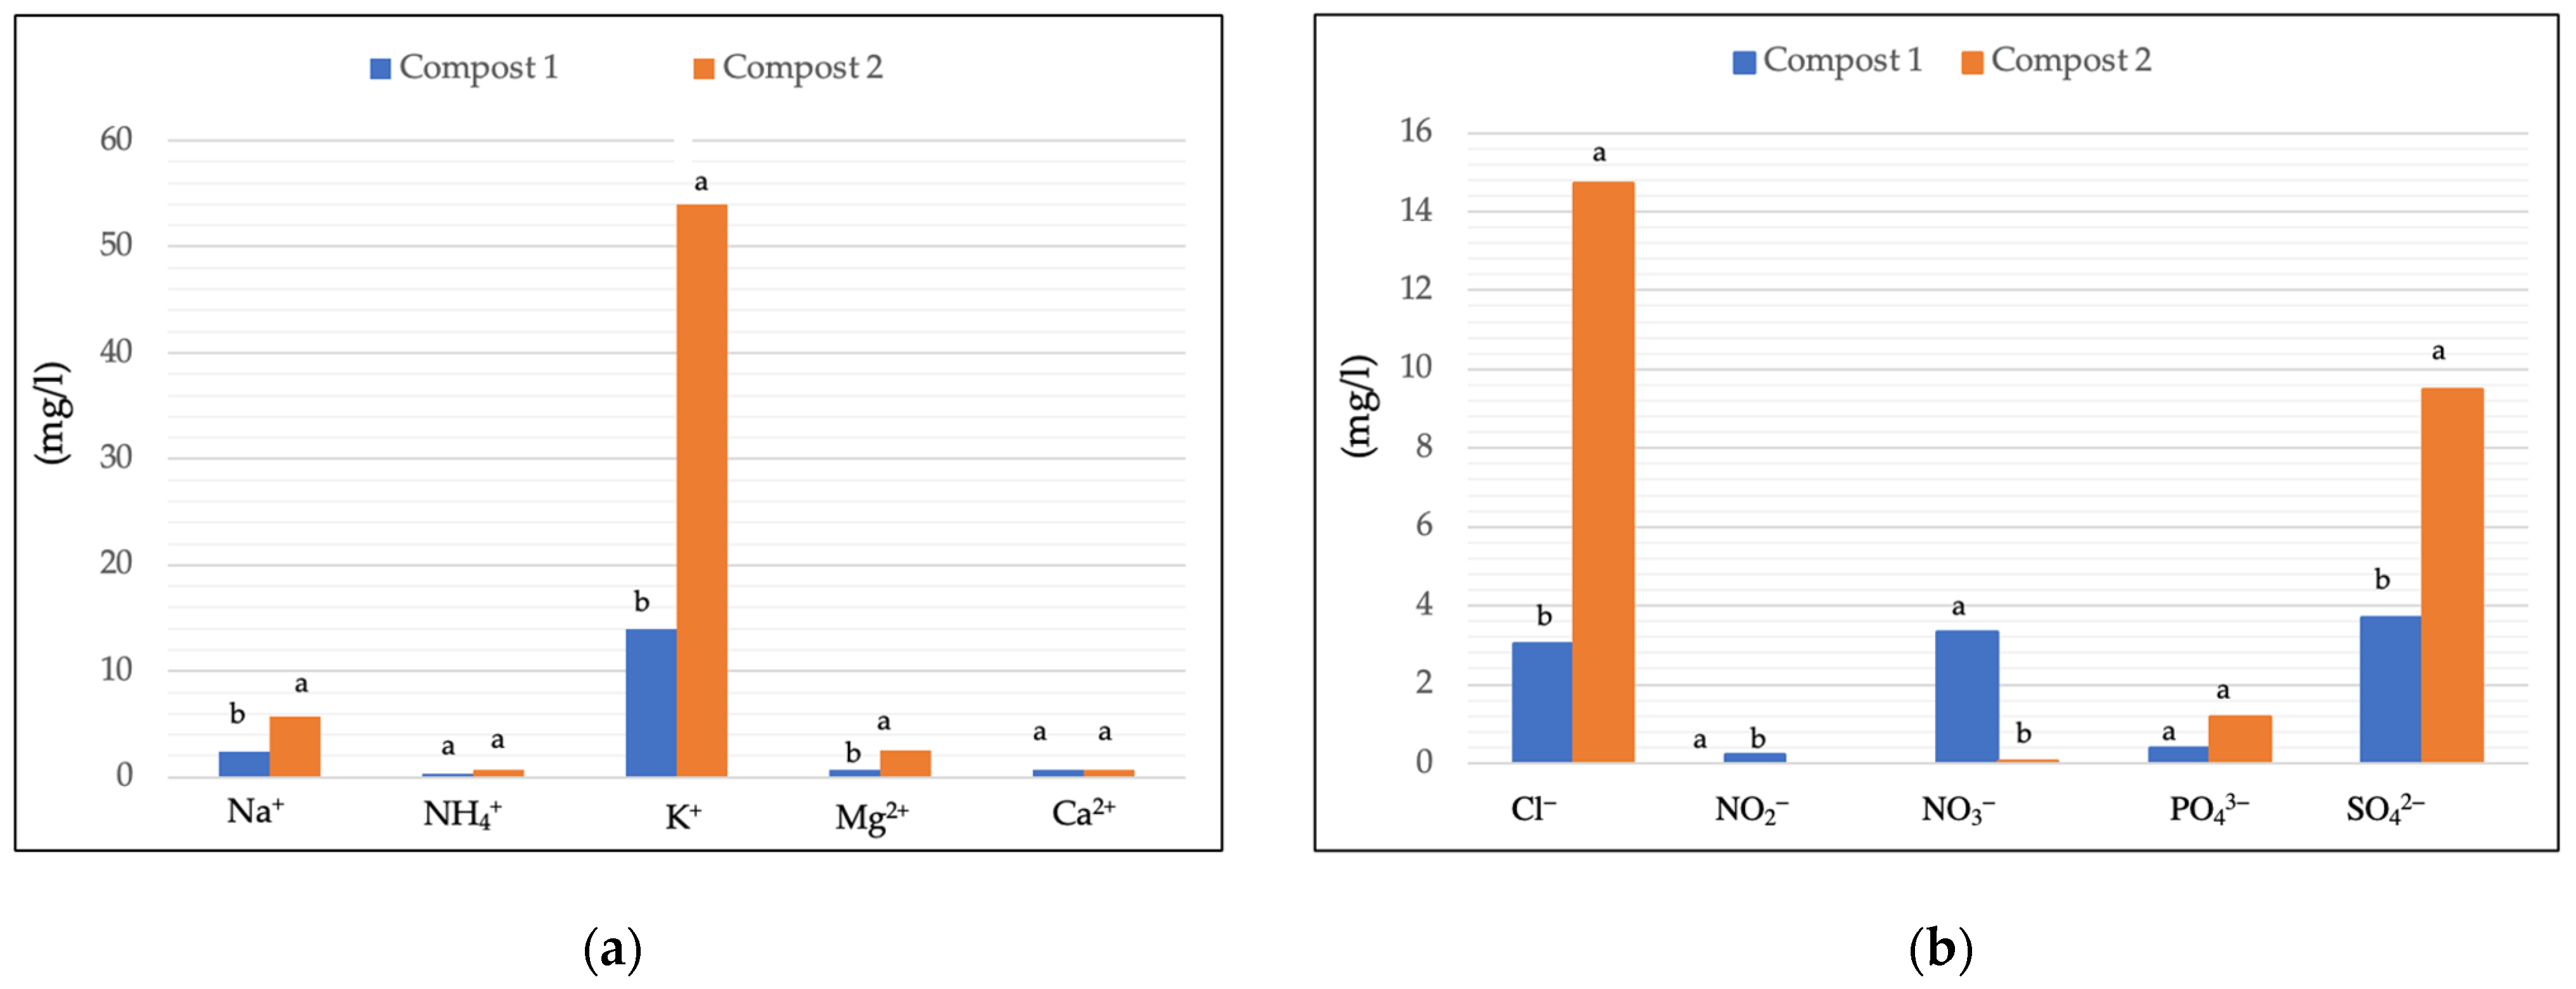
Figure 1.
Cation concentration (mgL−1) (a) and anion concentration (mgL−1) (b) detected in Compost 1 (50% wood sawdust + 50% wet wastes) and Compost 2 (10% Straw + 90% wet wastes) 120 days after the composting process at the end of the composting process. Different letters indicate significant differences (Turkey’s test p ≤ 0.05).
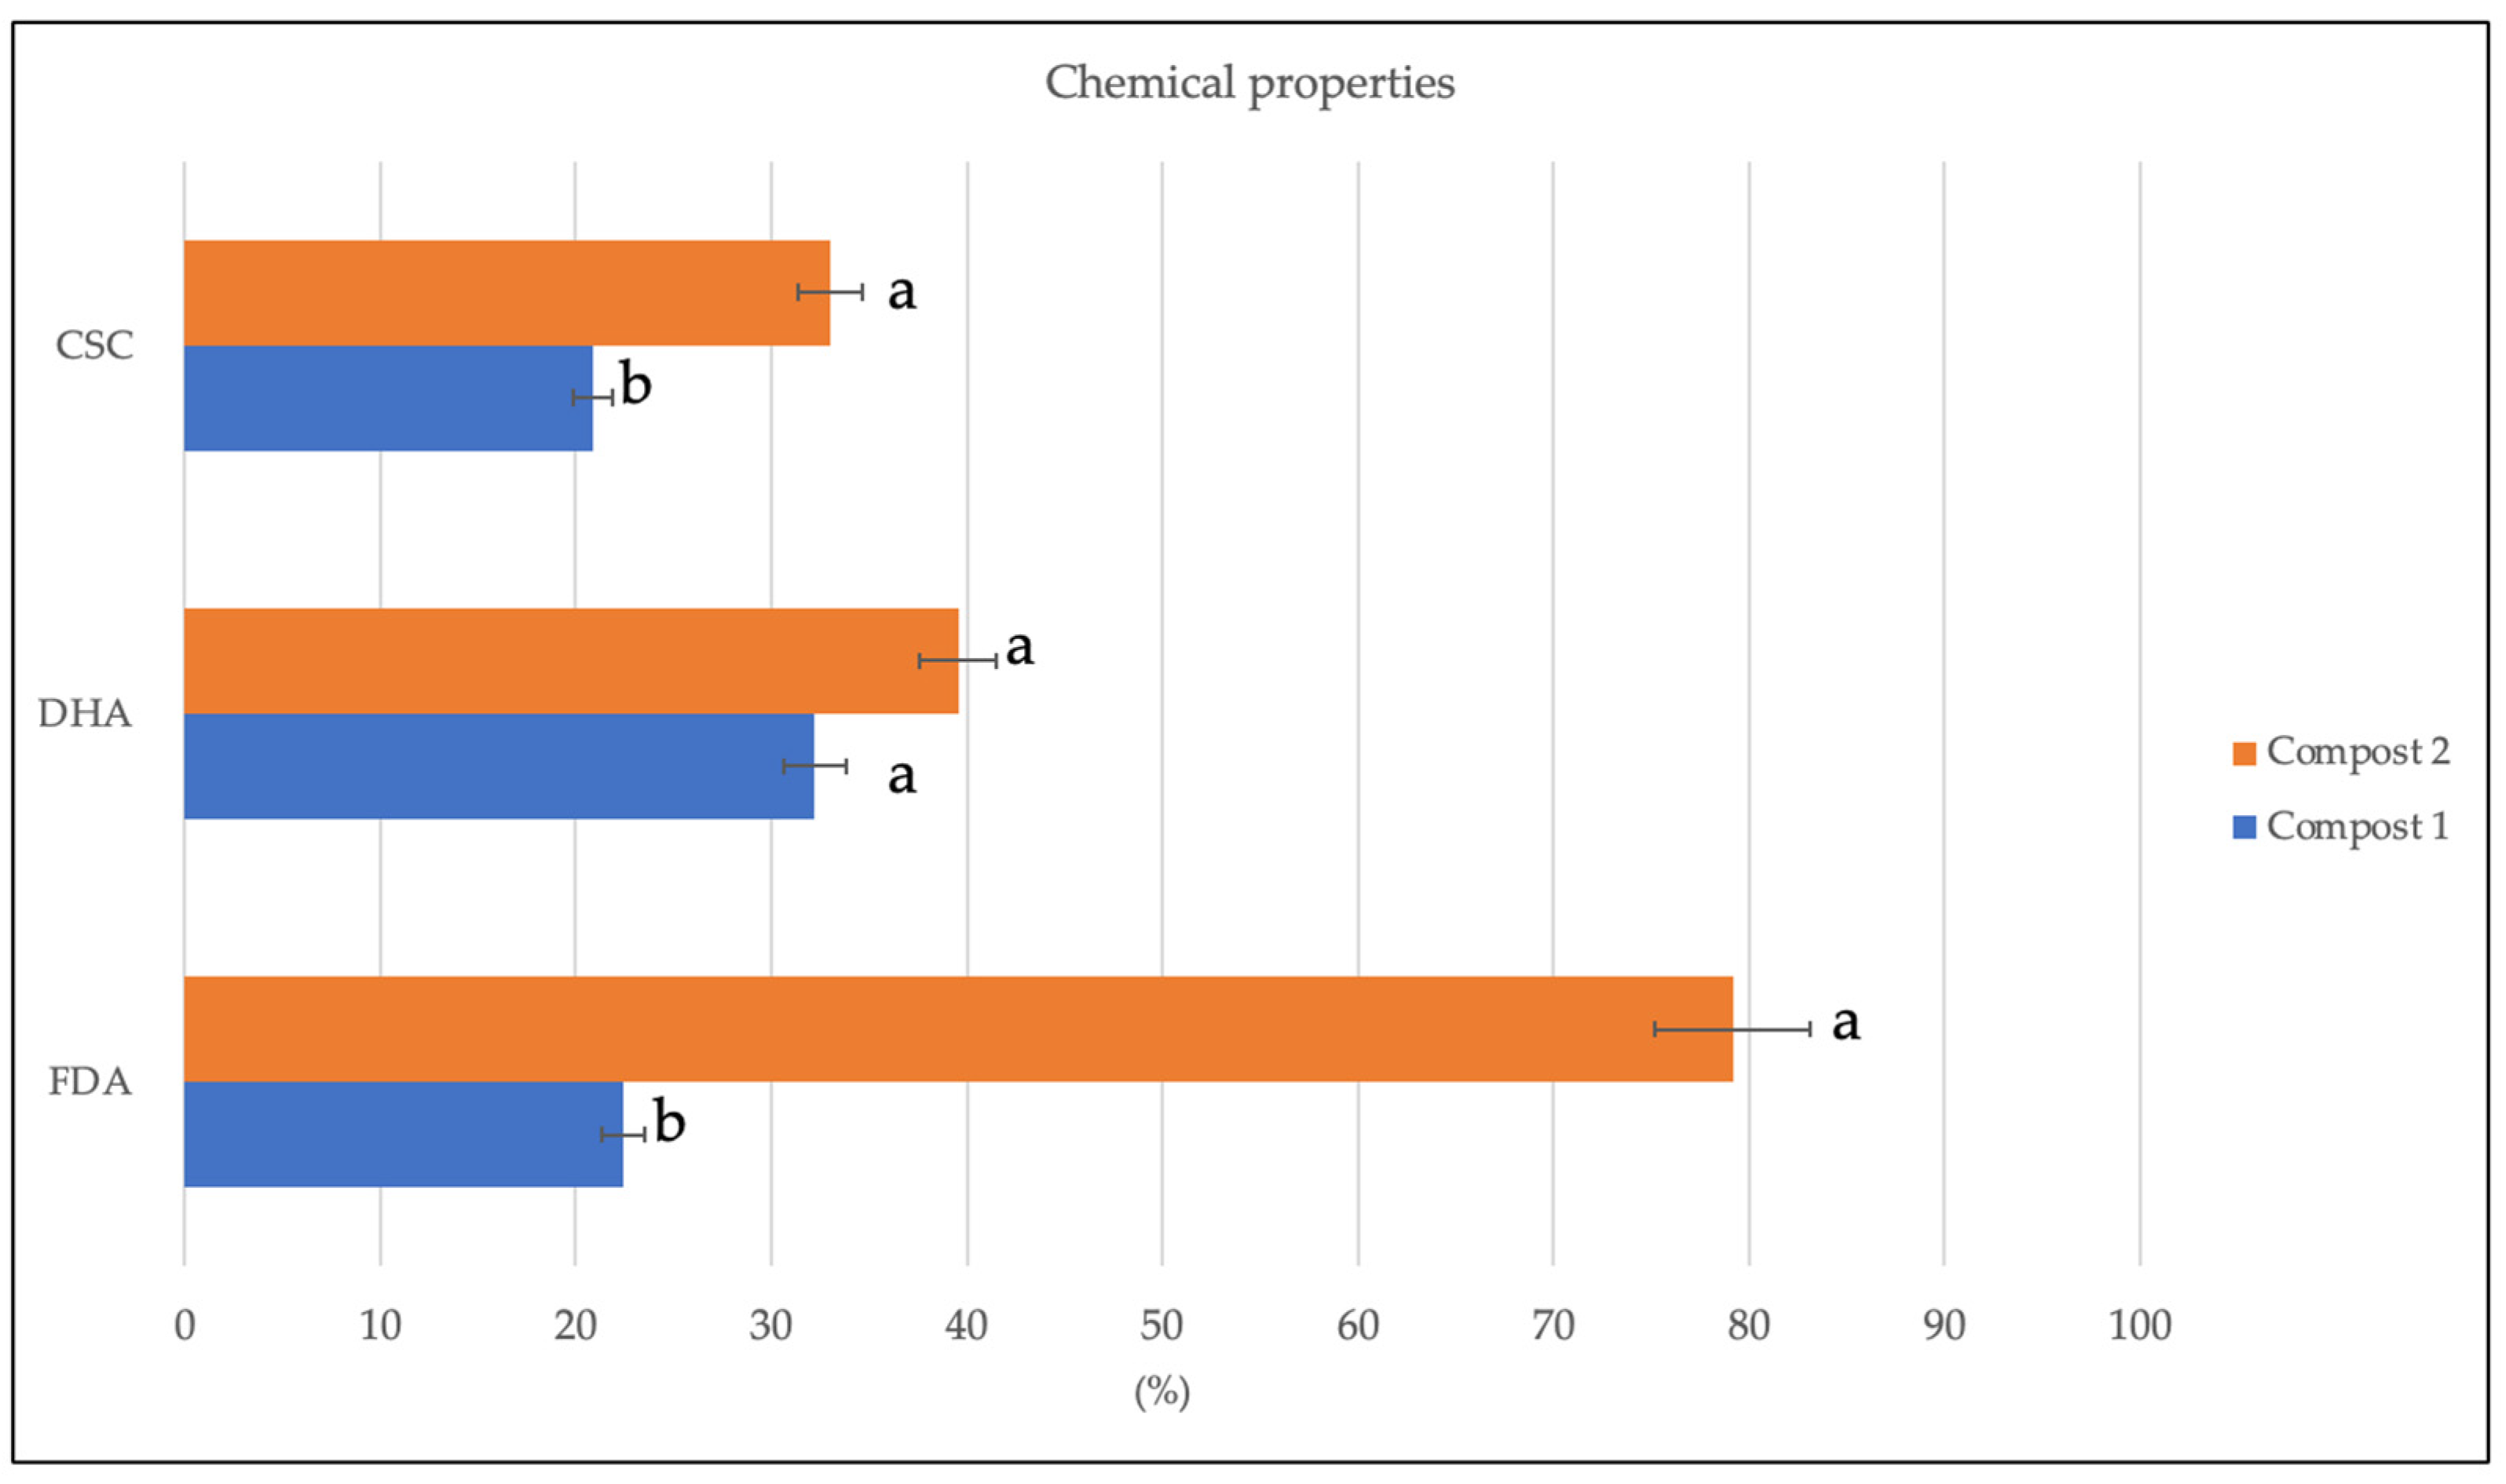
Figure 2.
Fluorescein diacetate hydrolase (FDA, µg fluorescein g−1 d.w.), dehydrogenase (DHA, µg TTF g−1 h−1d.w.), cation exchange capacity (CEC, cmol(+) Kg−1) detected in Compost 1 (50% wood sawdust + 50% wet wastes) and Compost 2 (10% Straw + 90% wet wastes) 120 days after the composting process. Different letters indicate significant differences (Turkey’s test p ≤ 0.05).
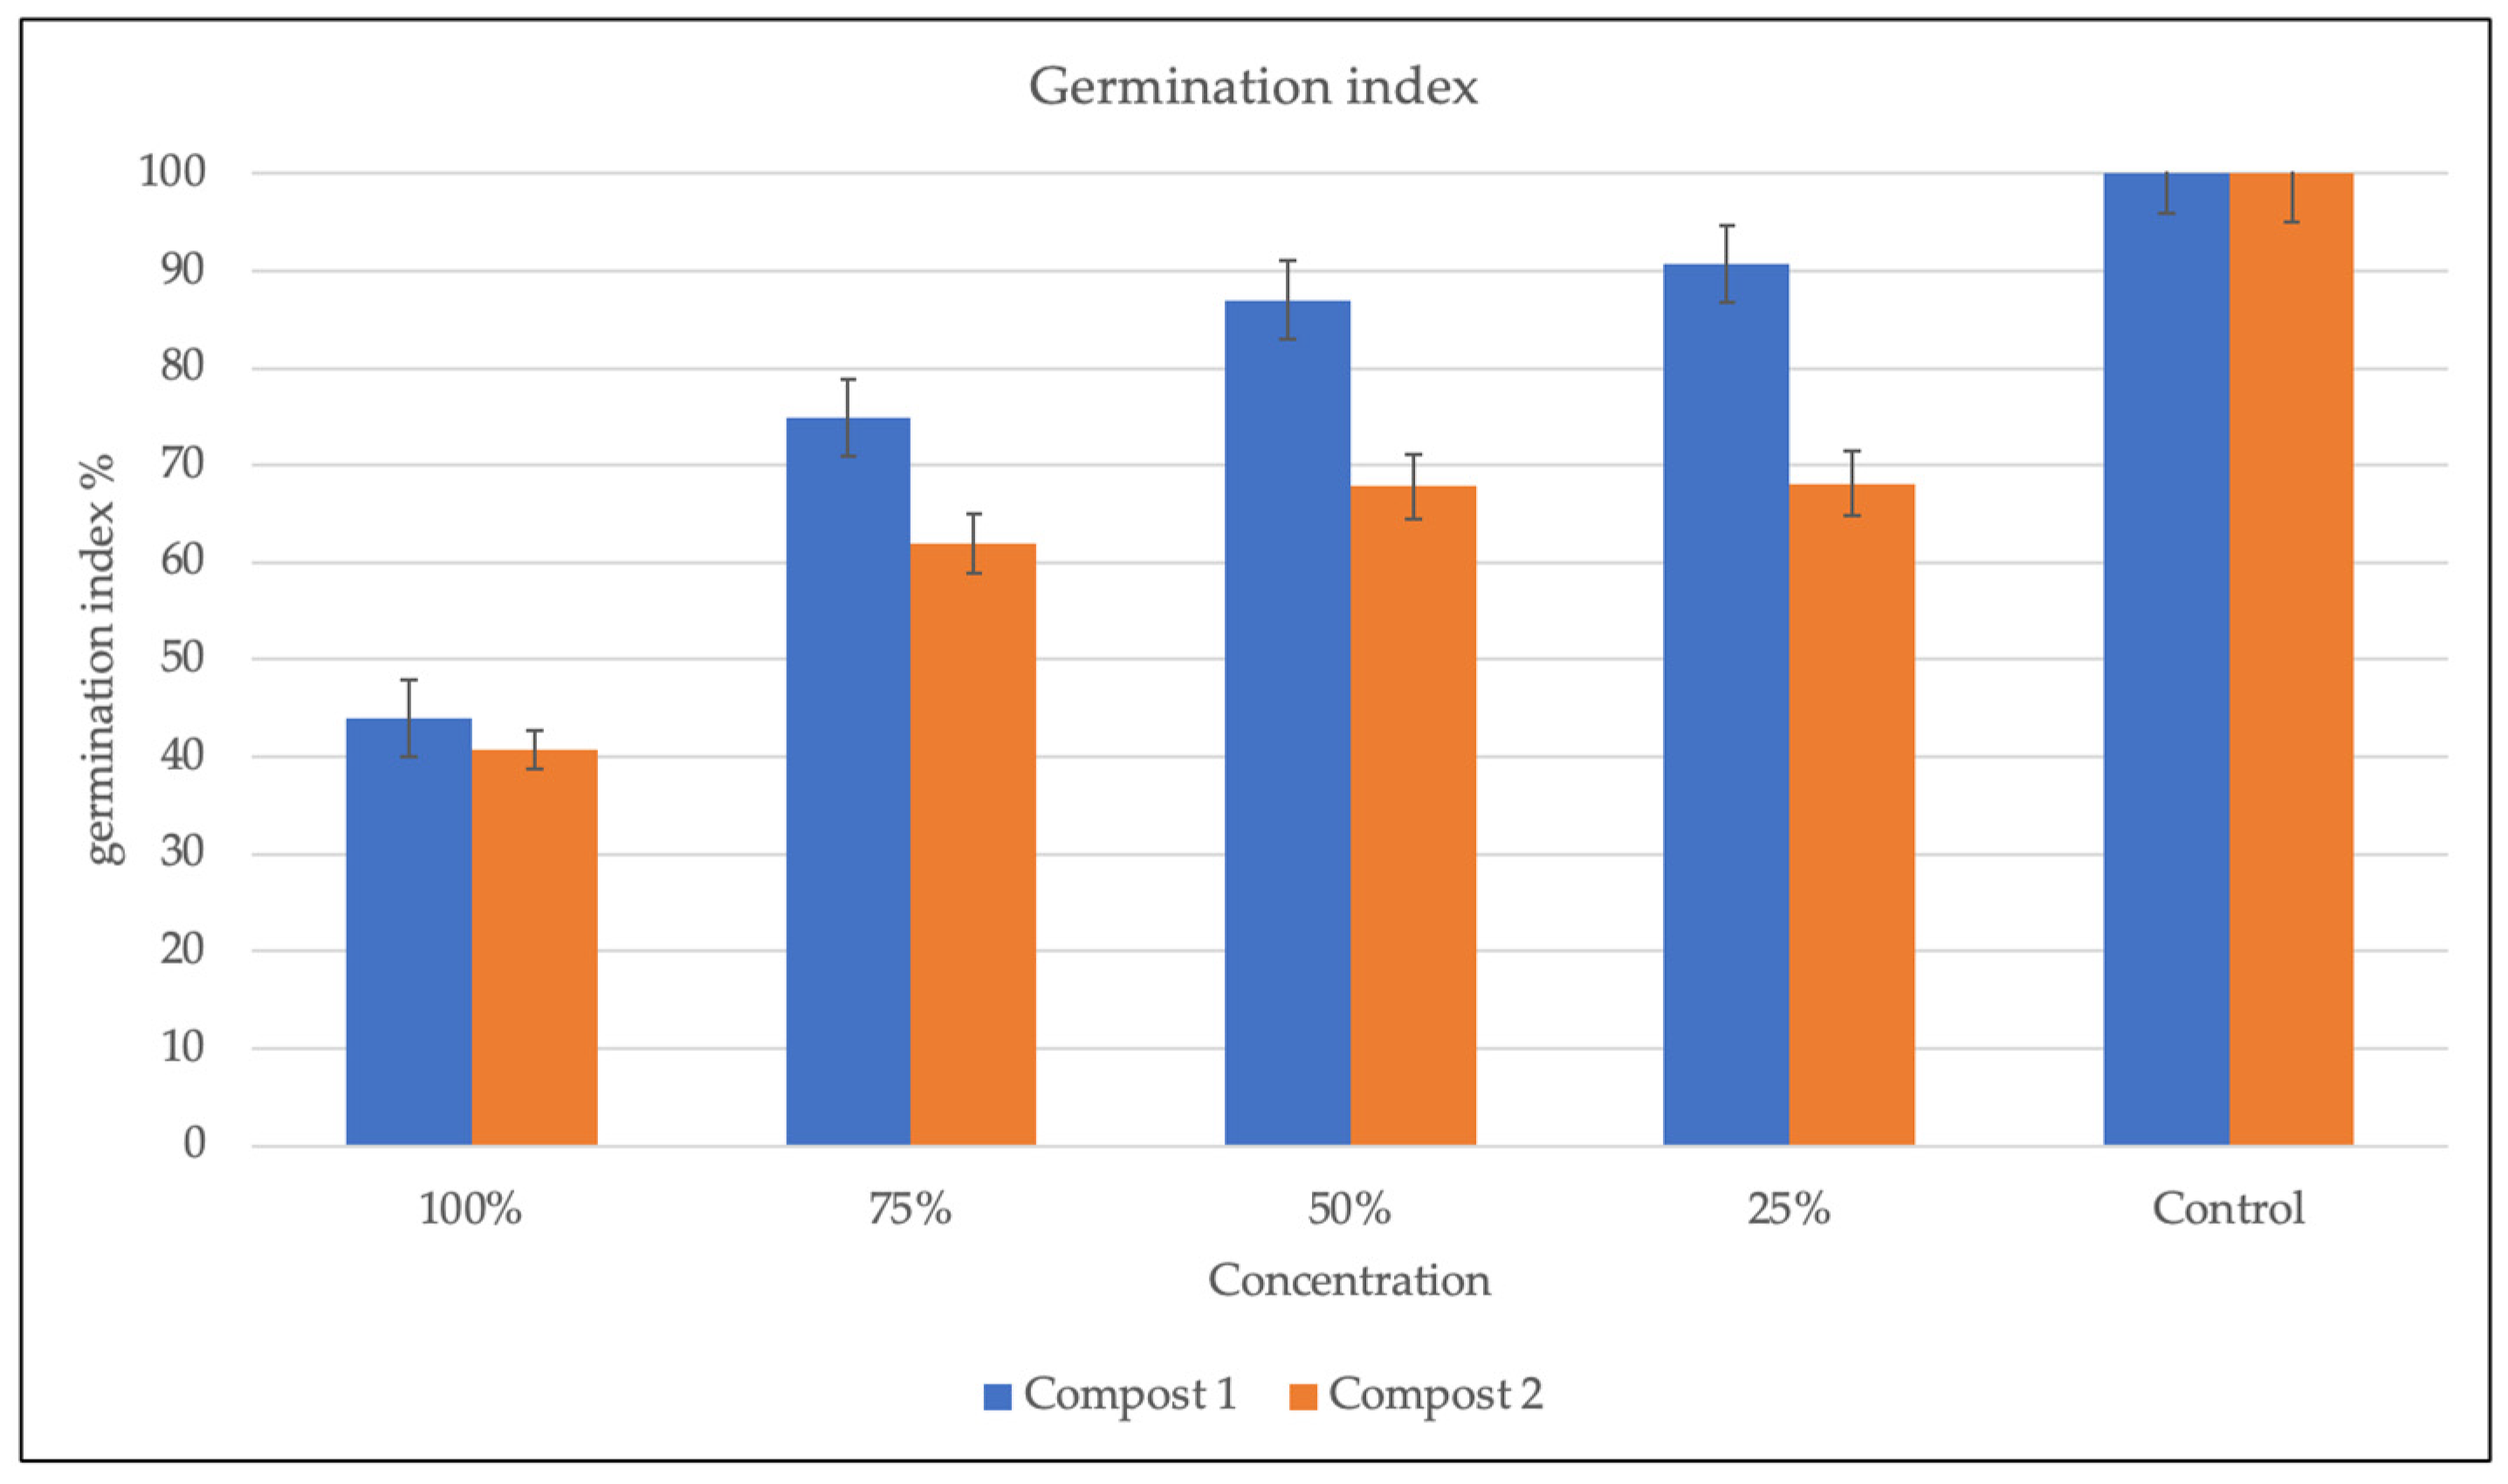
Figure 3.
Germination index in Compost 1 (50% wood sawdust + 50% wet wastes) and Compost 2 (10% Straw + 90% wet wastes) 120 days after the composting process.
Figure 3.
Germination index in Compost 1 (50% wood sawdust + 50% wet wastes) and Compost 2 (10% Straw + 90% wet wastes) 120 days after the composting process.
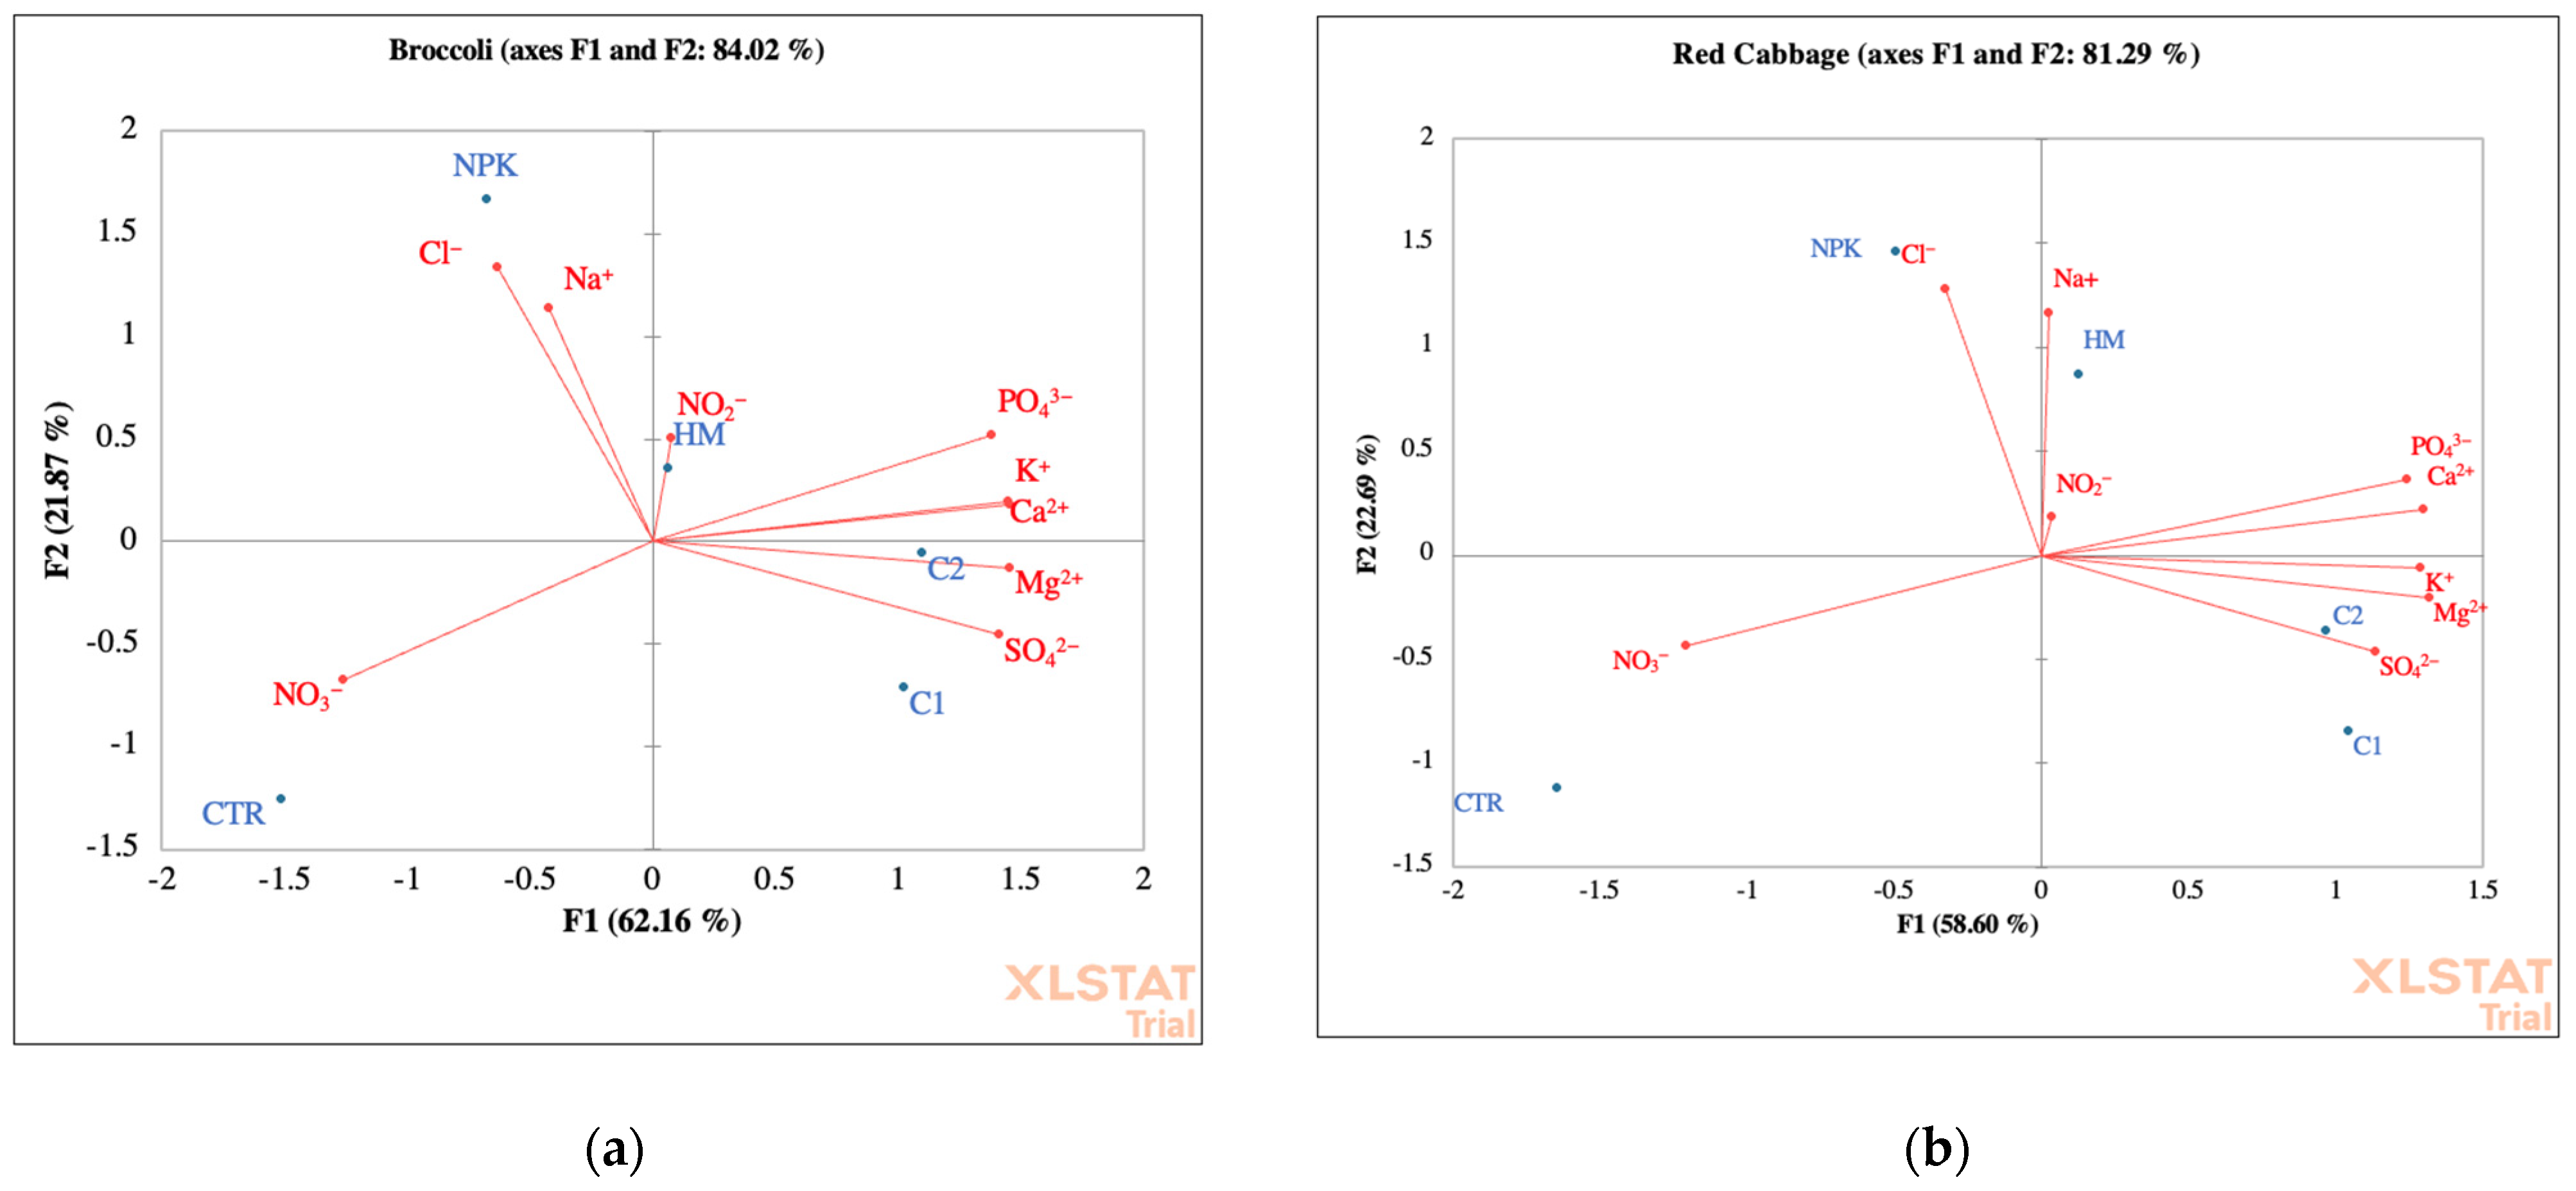
Figure 4.
Principal component analyses of ions and cations soil with broccoli (a) and red cabbage (b). CTR (Control) soil without fertilizer; NPK = nitrogen–phosphorous–potassium; HM = horse manure; C1 50% wood sawdust + 50% wet wastes, C2 10% straw and 90% wet wastes.
Figure 4.
Principal component analyses of ions and cations soil with broccoli (a) and red cabbage (b). CTR (Control) soil without fertilizer; NPK = nitrogen–phosphorous–potassium; HM = horse manure; C1 50% wood sawdust + 50% wet wastes, C2 10% straw and 90% wet wastes.
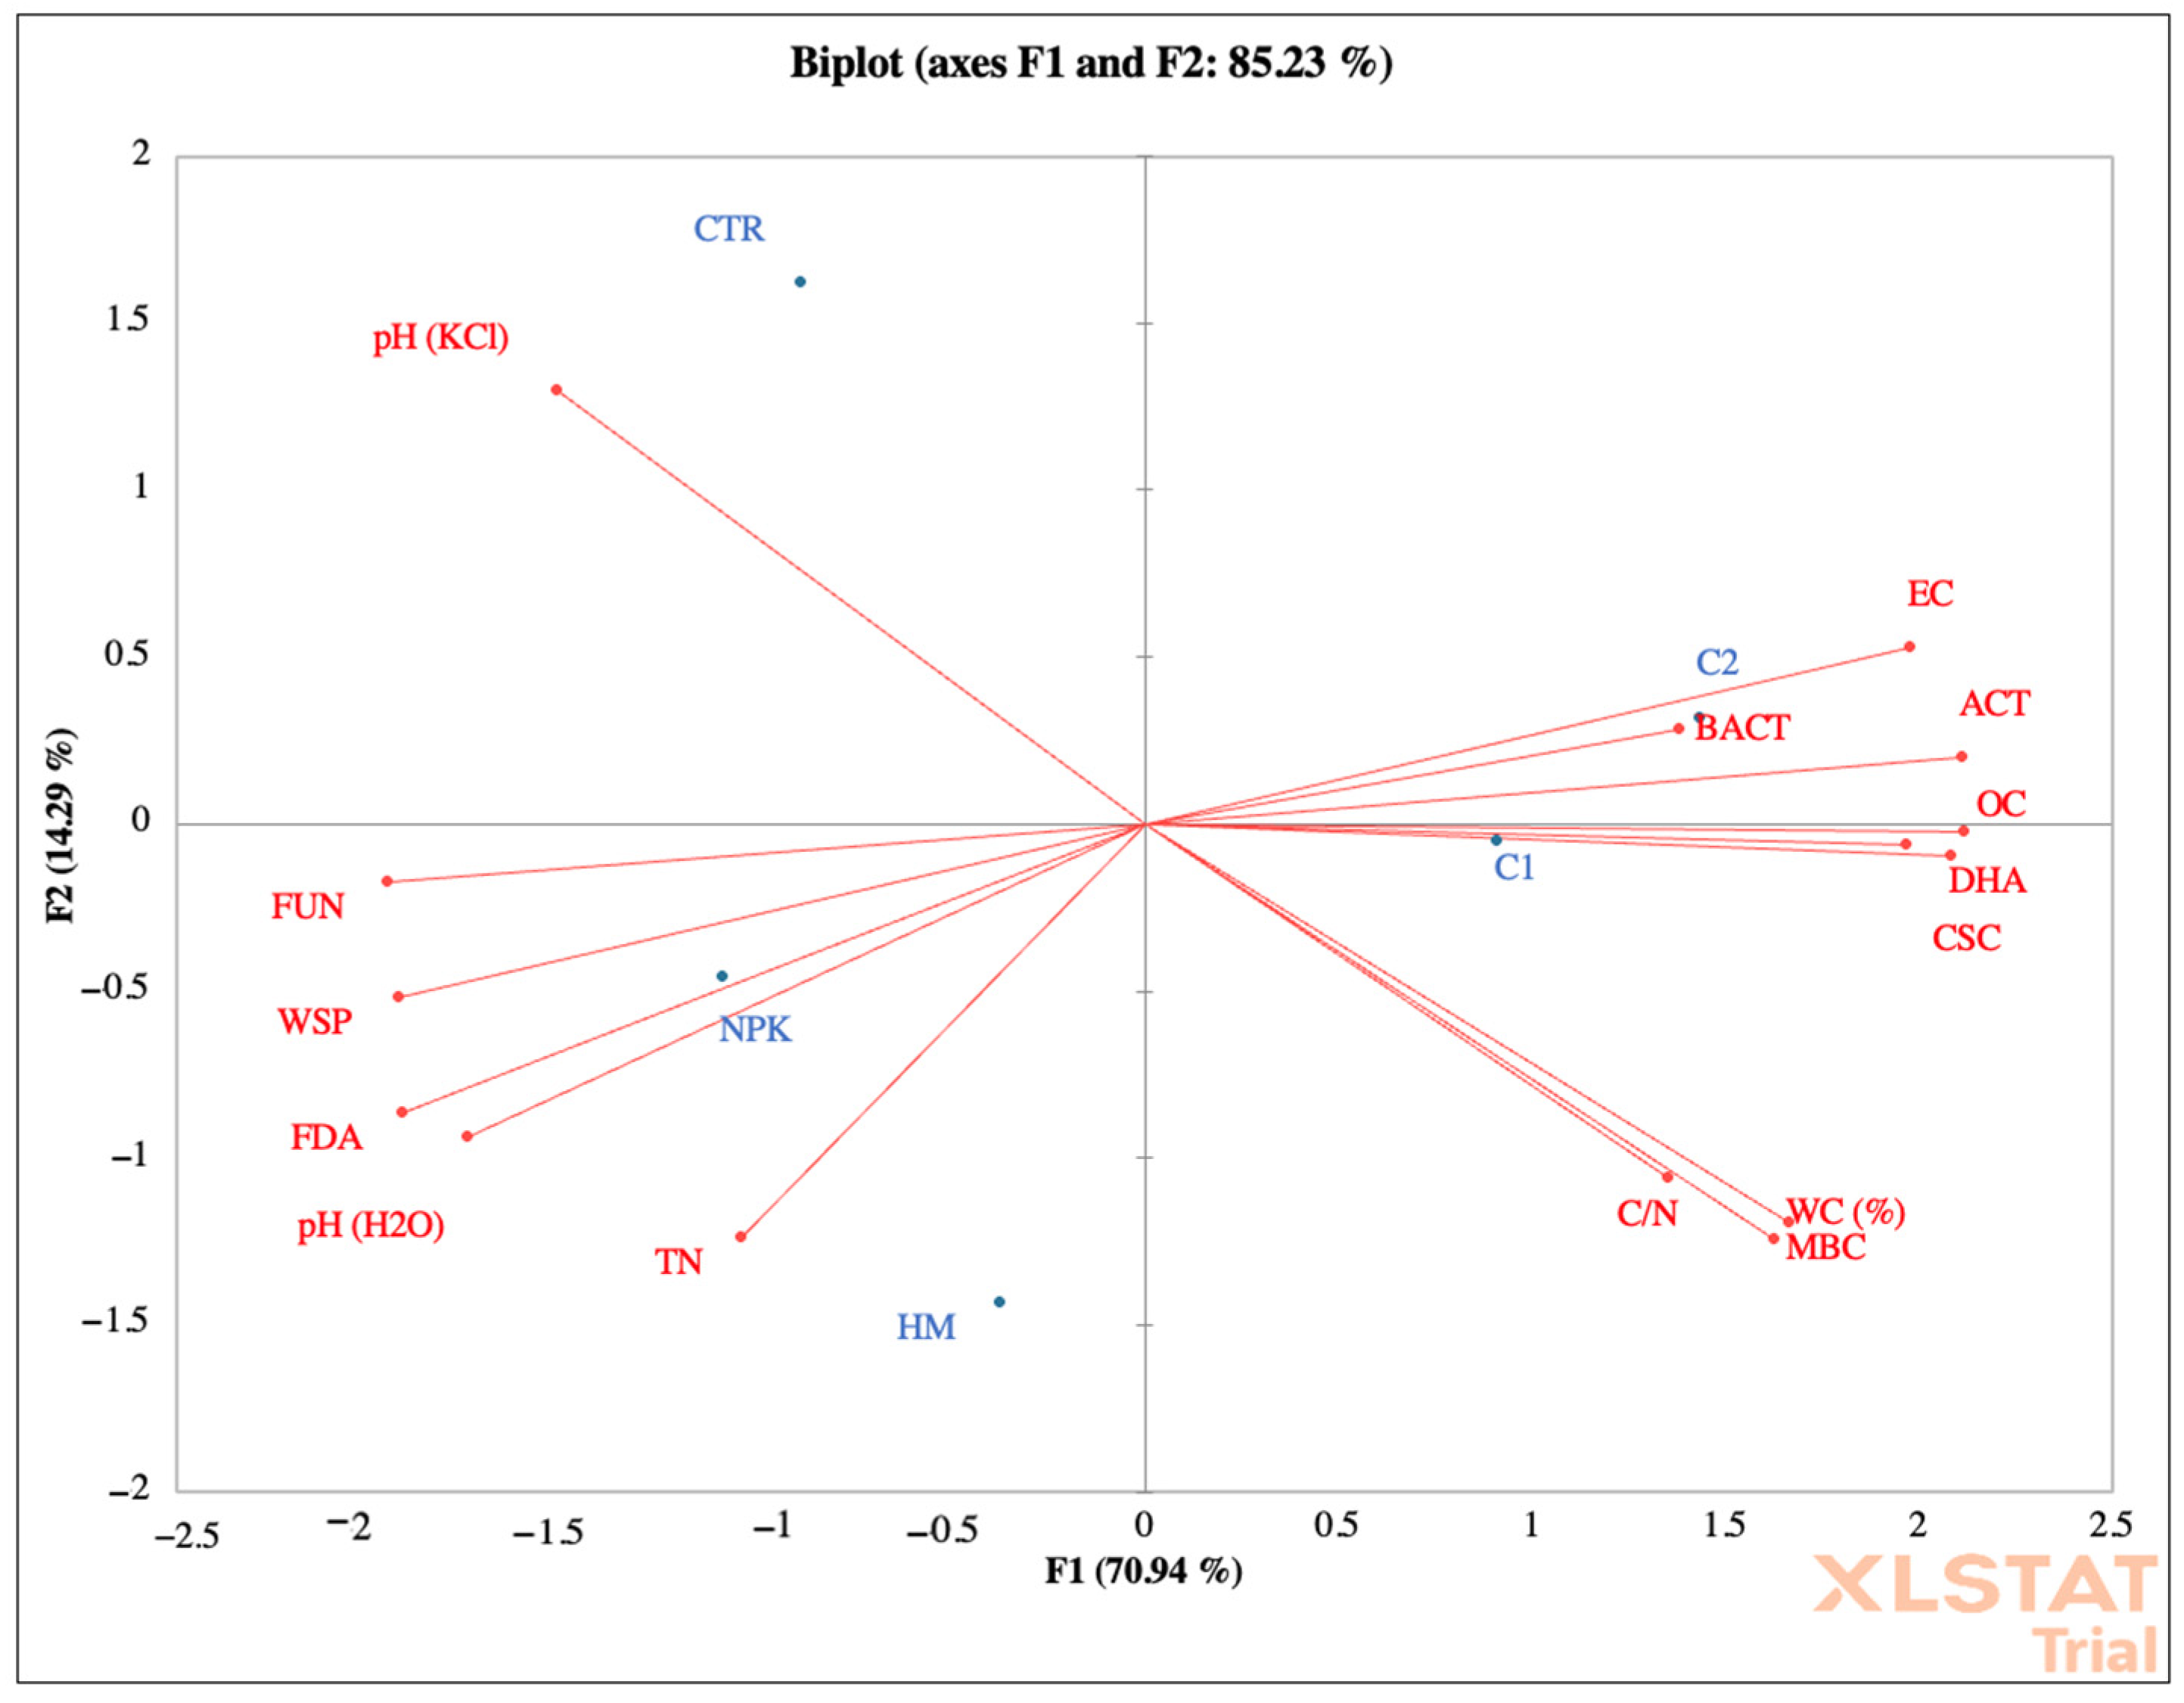
Figure 5.
Principal component analyses of chemical and biochemical properties of soil located in Motta San Giovanni before fertilization. CTR (control) soil without fertilizer; NPK = nitrogen–phosphorous–potassium; HM = horse manure; C1 50% wood sawdust + 50% wet wastes, C2 10% straw and 90% wet wastes.
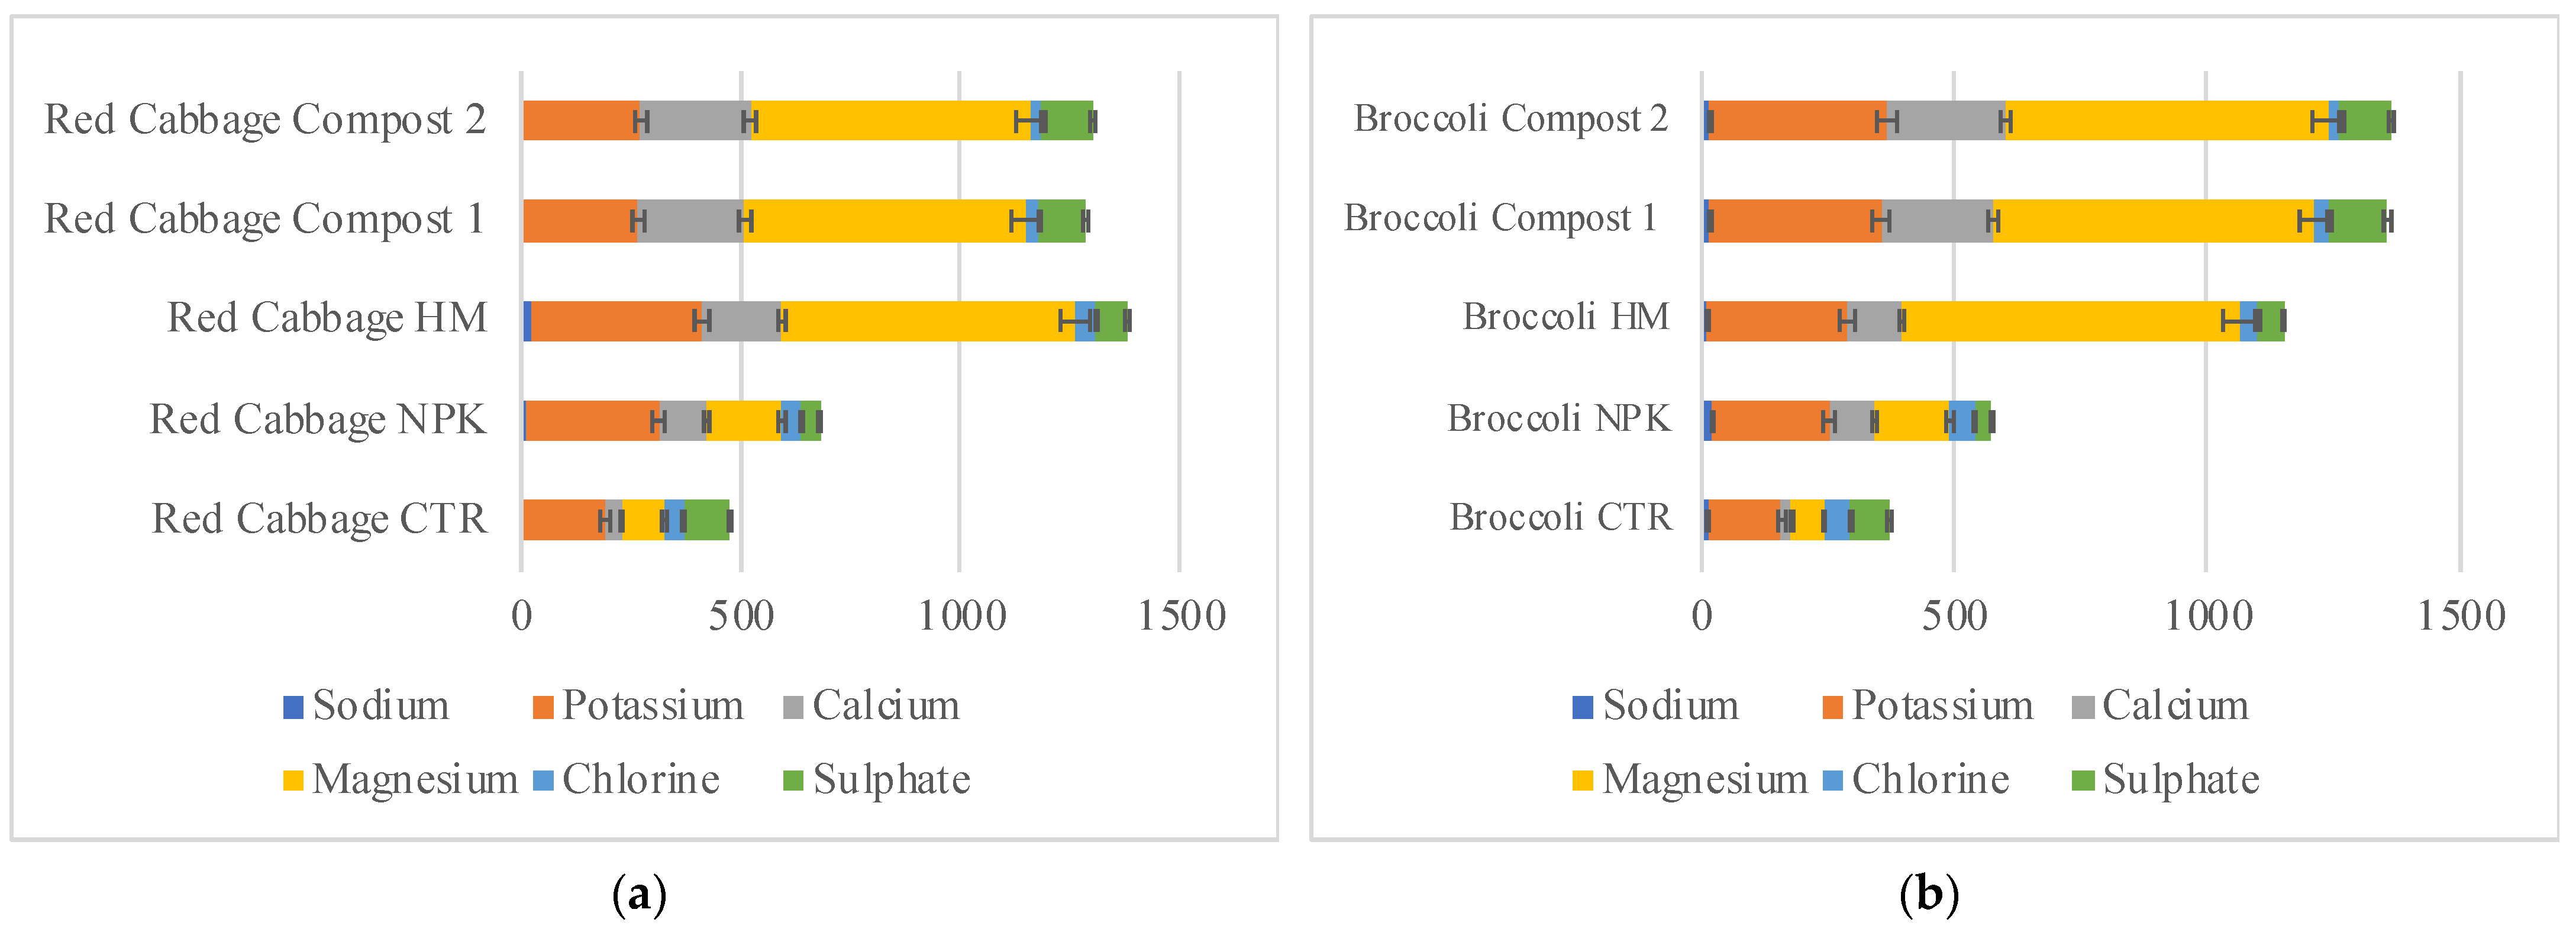
Figure 6.
Bioaccumulation factor of red cabbage (a) and broccoli (b) grown in not-amended soil (control, CTR), NPK = nitrogen–phosphorous–potassium; HM = horse manure; C1 50% wood sawdust + 50% wet wastes, C2 10% Straw + 90% wet wastes. Values are expressed as micrograms and are the mean of three replicates (n = 15) with errors standard.
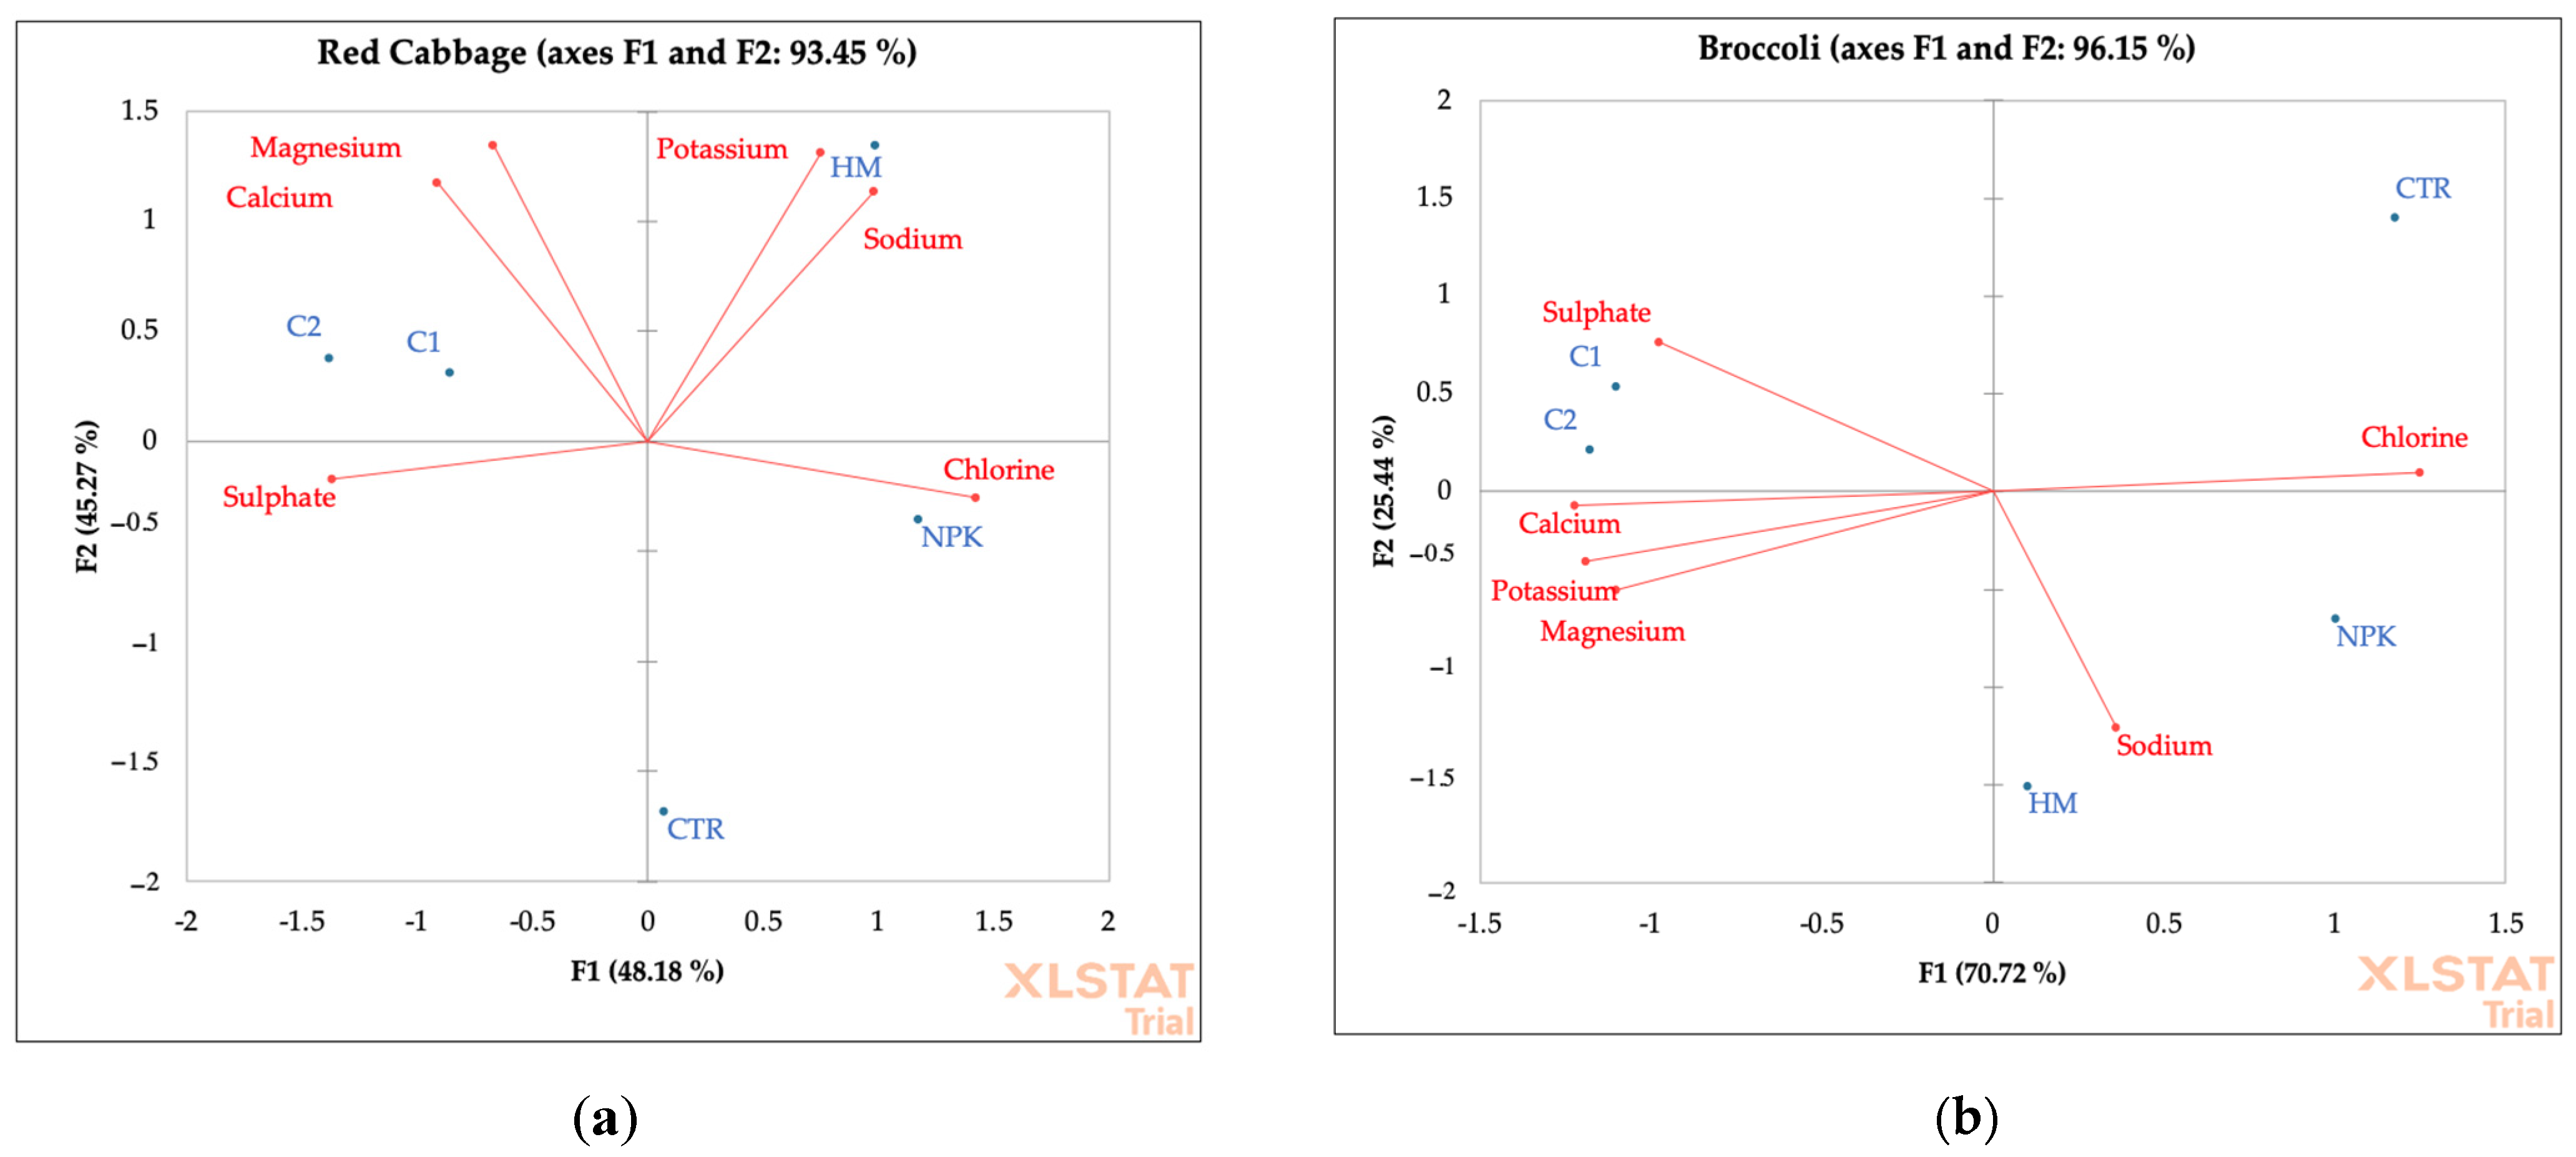
Figure 7.
PCA of ions and cations of red cabbage (a) and broccoli (b) grown in not-amended soil (control, CTR), NPK = nitrogen–phosphorous–potassium; HM = horse manure; C1 50% wood sawdust + 50% wet wastes, C2 10% Straw + 90% wet wastes.
Figure 7.
PCA of ions and cations of red cabbage (a) and broccoli (b) grown in not-amended soil (control, CTR), NPK = nitrogen–phosphorous–potassium; HM = horse manure; C1 50% wood sawdust + 50% wet wastes, C2 10% Straw + 90% wet wastes.
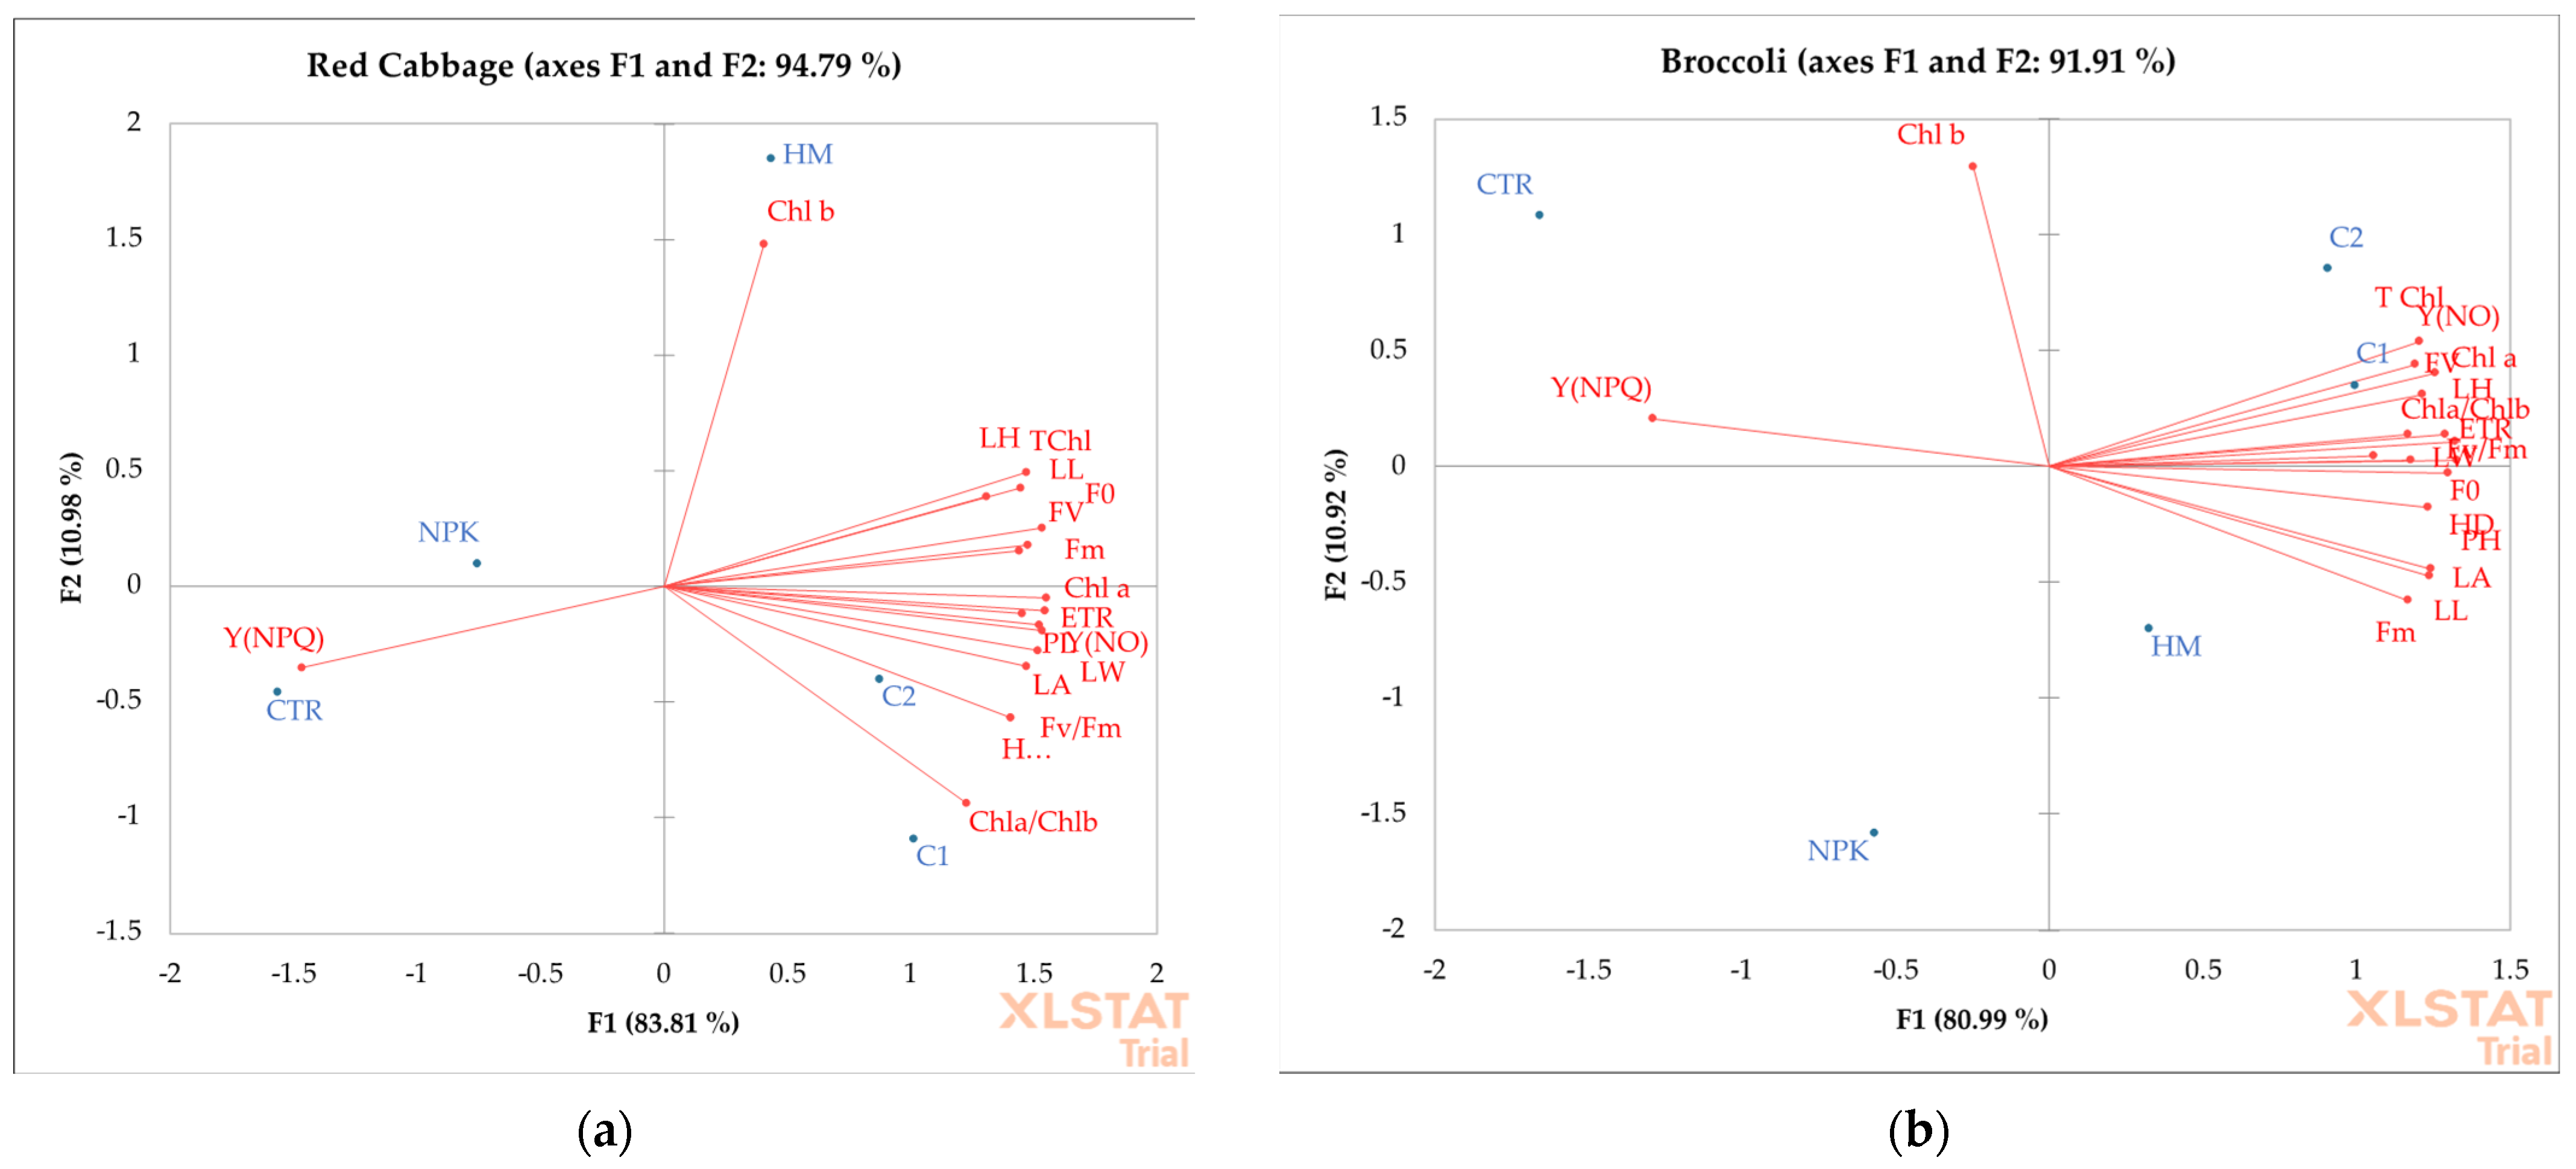
Figure 8.
Principal component analyses of the content of chlorophyll a (Chl a, mg 100 g−1FW), chlorophyll b (Chl b, mg 100 g−1FW), total chlorophyll (TChl, mg 100 g−1FW), chlorophyll a/chlorophyll b (Chl a/Chl b) and photosynthetic parameters (FV, Fm, Y(NPQ), Y(NO), and ETR are expressed as µmol m−2 s−1), in leaves of red cabbage (a) and broccoli (b) grown in not-amended soil (control, CTR), NPK = nitrogen–phosphorous–potassium; HM = horse manure; C1 50% wood sawdust + 50% wet wastes, C2 10% Straw + 90% wet wastes.
Table 1.
Compostable raw materials of different composts used.
Table 1.
Compostable raw materials of different composts used.
| Compost ID | Compostable Raw Material |
|---|
| Compost 1 (C1) | 50% wood sawdust + 50% wet waste, such as kitchen and restaurant scraps. |
| Compost 2 (C2) | 10% Straw + 90% wet wastes, such as kitchen and restaurant scraps. |
Table 2.
Physico-chemical properties of the two composts obtained from different raw materials Compost 1 (50% wood sawdust + 50% wet wastes) and Compost 2 (10% Straw + 90% wet wastes) 120 days after the composting process. pH (H2O and KCl); electric conductivity (EC, mS cm⁻1); water content (WC, %); total organic carbon (TOC, %); Total Nitrogen (TN, %); carbon–nitrogen ratio (C/N); ammonium-nitrogen–nitrate-nitrogen ratio (NH₄⁺-N/NO₃⁻-N); organic nitrogen–total nitrogen ratio (ON/TN, %), water-soluble phenols (WSP µg GAE g−1 d.s). Data are the means of three replicates ± standard deviation. Different letters in the same row indicate significant differences at p ≤ 0.05.
| Physico-Chemical Properties | COMPOST 1 | COMPOST 2 |
|---|
| pHH2O | 9.05 b ± 0.1
very strongly alkaline | 9.90 a ± 0.1
very strongly alkaline |
| pHKCl | 8.39 b ± 0.1 | 9.28 a ± 0.1 |
| E.C. | 5.01 a ± 0.12 | 5.06 a ± 0.11 |
| Water content | 56.8 a ± 2 | 45.9 b ± 1.5 |
| TOC | 16.8 b ± 0.9 | 24.0 a ± 1 |
| TN (%) | 0.78 b ± 0.05 | 2.0 a ± 0.1 |
| C/N | 21.57 a ± 1 | 11.97 b ± 0.9 |
| NH4+-N/NO3-N | 1.30 b ± 0.3 | 2.80 a ± 0.2 |
| ON/TN | 90 a ± 2 | 60 b ± 1 |
| WSP | 0.90 b ± 0.05 | 7.03 a ± 0.3 |
Table 3.
The data regarding the absorption capacity of the analyzed compost related to sodium and chloride. Data are the means of three replicates ± standard deviation. Different letters in the same row indicate significant differences (Turkey’s test p ≤ 0.05).
Table 3.
The data regarding the absorption capacity of the analyzed compost related to sodium and chloride. Data are the means of three replicates ± standard deviation. Different letters in the same row indicate significant differences (Turkey’s test p ≤ 0.05).
| | 0 mM | 25 mM | 50 mM | 100 mM | 150 mM |
| ID | Na+ | Na+ | Na+ | Na+ | Na+ |
| C1 | −4.56 e ± 0.15 | 8.09 d ± 0.76 | 12.60 c ± 0.23 | 53.58 b ± 0.24 | 93.95 a ± 1.4 |
| C2 | −3.26 e ± 0.2 | 88.11 d ± 0.6 | 109.51 c ± 0.2 | 243.50 a ± 0.4 | 212.88 b ± 1.3 |
| ID | Cl− | Cl− | Cl− | Cl− | Cl− |
| C1 | −5.86 e ± 0.2 | 53.23 d ± 0.16 | 120.59 c ± 1.6 | 138.23 b ± 1.8 | 367.99 a ± 3.6 |
| C2 | −4.330 e ± 0.1 | 87.40 d ± 0.5 | 124.08 c ± 0.1 | 311.51 b ± 0.1 | 461.24 a ± 0.2 |
Table 4.
Chemical and biochemical properties of soil located in Motta San Giovanni before fertilization. WC (water content %), pH H2O in water and pHKCl in potassium chloride; EC = electric conductivity (dS/m); WSP = water-soluble phenols (µg TAE g−1 ds): OC = organic carbon (%); TN = total nitrogen (%); C/N = carbon–nitrogen ratio; OM = organic matter (%); MBC = microbial biomass carbon (μg C g−1 f.s.); Dehydrogenase (DHA, μg TTF g−1 h−1 d.s.), fluorescein diacetate hydrolase (FDA, μg fluorescein g−1 d.s.), BACT (bacteria, UFC g−1 f.s.), FUN (fungi (UFC g−1 f.s.), ACT (Actinomycetes, UFC g−1 f.s.), CEC = cation exchange capacity (cmol(+) Kg−1 d.s.). Data are the means of three replicates ± standard deviation.
| | SOIL |
|---|
| Skeleton (%) | 45 ± 0.01 |
| Sandy % | 65 ± 0.02 |
| Clay % | 23 ± 0.12 |
| Silt % | 12 ± 0.23 |
| Textural Class | Sandy-loam |
| WC | 18 ± 0.4 |
| pH (H2O) | 8.5 ± 0.32 |
| pH (KCl) | 7.8 ± 0.53 |
| EC | 307.3 ± 12.3 |
| CEC (cmol(+) kg−1) | 16 ± 1.7 |
| OC | 1.37 ± 0.13 |
| TN | 0.19 ± 0.14 |
| C/N | 7.21 ± 0.13 |
| WSP | 276.1 ± 4.5 |
| MBC | 376 ± 8.6 |
| FDA | 2.1 ± 0.12 |
| DHA | 15.11 ± 0.22 |
| BACT | 0.9 × 10⁵ |
| FUN | 2.6 × 10⁴ |
| ACT | 2.7 × 10⁴ |
| Na+ | 0.117 ± 0.32 |
| K+ | 0.100 ± 0.26 |
| Ca2+ | 0.311 ± 0.06 |
| Mg2+ | 0.011 ± 0.16 |
| Cl− | 0.222 ± 0.11 |
| NO2− | nd |
| NO3− | nd |
| PO43− | nd |
| SO42− | 0.134 ± 0.11 |
Table 5.
Soil ions and cations correlation matrix. Pearson values in bold are different from 0 with a significance level alpha = 0.05.
Table 5.
Soil ions and cations correlation matrix. Pearson values in bold are different from 0 with a significance level alpha = 0.05.
| Variables | Na+ | K+ | Ca2+ | Mg2+ | Cl− | NO2− | NO3− | PO43− | SO42− |
|---|
| Na+ | 1 | 0.908 | 0.125 | 0.326 | 0.582 | 0.998 | 0.998 | 0.998 | 0.931 |
| K+ | 0.908 | 1 | 0.408 | 0.582 | 0.759 | 0.893 | 0.893 | 0.893 | 0.980 |
| Ca2+ | 0.125 | 0.408 | 1 | 0.887 | 0.793 | 0.090 | 0.090 | 0.090 | 0.441 |
| Mg2+ | 0.326 | 0.582 | 0.887 | 1 | 0.672 | 0.309 | 0.309 | 0.309 | 0.635 |
| Cl− | 0.582 | 0.759 | 0.793 | 0.672 | 1 | 0.540 | 0.540 | 0.540 | 0.751 |
| NO2− | 0.998 | 0.893 | 0.090 | 0.309 | 0.540 | 1 | 1.000 | 1.000 | 0.921 |
| NO3− | 0.998 | 0.893 | 0.090 | 0.309 | 0.540 | 1.000 | 1 | 1.000 | 0.921 |
| PO43− | 0.998 | 0.893 | 0.090 | 0.309 | 0.540 | 1.000 | 1.000 | 1 | 0.921 |
| SO42− | 0.931 | 0.980 | 0.441 | 0.635 | 0.751 | 0.921 | 0.921 | 0.921 | 1 |
Table 6.
Cations and anions concentrations (mg/L) detected 90 days after treatments with the different fertilizers. CTR (control) soil without fertilizer; NPK = nitrogen–phosphorous–potassium; HM = horse manure; C1 50% wood sawdust + 50% wet wastes, C2 10% straw + 90% wet wastes Na+ (sodium), K+ (potassium), Ca2+ (calcium), Mg2+ (magnesium), Cl− (chloride), NO2− (nitrite), NO3− (nitrate), PO43− (phosphate), SO42− (sulfate). Data are the means of three replicates ± standard deviation. Different letters in the same row indicate significant differences (Turkey’s test p ≤ 0.05).
| Soil Cations | CTR | Soil + NPK | Soil + HM | Soil + C1 | Soil + C2 |
|---|
| Na+ | 0.124 b ± 0.02 | 0.119 b ± 0.08 | 0.101 b ± 0.10 | 0.155 b ± 0.09 | 0.91 a ± 0.07 |
| K+ | 0.116 c ± 0.07 | 0.165 b ± 0.03 | 0.145 bc ± 0.12 | 0.199 a ± 0.11 | 0.290 a ± 0.06 |
| Ca2+ | 0.254 b ± 0.32 | 0.234 b ± 0.22 | 0.346 b ± 0.27 | 0.495 b ± 0.19 | 3.53 a ± 0.16 |
| Mg2+ | 0.019 a ± 0.23 | 0.021 a ± 0.31 | 0.027 a ± 0.12 | 0.029 a ± 0.22 | 0.027 a ± 0.12 |
| Soil Anions | CTR | Soil + NPK | Soil + HM | Soil + C1 | Soil + C2 |
| Cl− | 0.222 b ± 0.23 | 0.206 b ± 0.34 | 0.208 b ± 0.21 | 0.310 a ± 0.07 | 0.298 a ± 0.02 |
| NO2− | nd | nd | nd | nd | 0.01 ± 0.01 |
| NO3− | nd | nd | nd | nd | 0.06 ± 0.02 |
| PO43− | nd | nd | nd | nd | 0.003 ± 0.01 |
| SO42− | 0.134 c ± 0.32 | 0.339 b ± 0.12 | 0.479 b ± 0.17 | 0.769 b ± 0.19 | 1.65 a ± 0.18 |
Table 7.
Chemical and biochemical properties of soil located in Motta San Giovanni, 90 days after treatments with the different fertilizers. CTR (control) soil without fertilizer; NPK = nitrogen–phosphorous–potassium; HM = horse manure; C1 50% wood sawdust + 50% wet wastes, C2 10% straw and 90% wet wastes. WC (water content %), pHH2O in water and pHKCl in potassium chloride; EC = electric conductivity (dS/m); WSP = water-soluble phenols (µg TAE g−1 ds); OC = organic carbon (%); TN = total nitrogen (%); C/N = carbon nitrogen ratio; OM = organic matter (%); MBC = microbial biomass carbon (μg C g−1 f.s.); dehydrogenase (DHA, μg TTF g−1 h−1 d.s.), fluorescein diacetate hydrolase (FDA, μg fluorescein g−1 d.s.), BACT (bacteria, UFC g−1 f.s.), FUN (fungi (UFC g−1 f.s.), ACT (Actinomycetes, UFC g−1 f.s.), CEC = cation exchange capacity (cmol(+) Kg−1d.s.).
| Soil Chemical Analyses | CTR | Soil + NPK | Soil + HM | Soil + C1 | Soil + C2 |
|---|
| WC (%) | 21.4 b ± 0.02 | 22.2 b ± 0.01 | 25.6 a ± 0.03 | 25.2 a ± 0.01 | 25.5 a ± 0.01 |
| pH (H2O) | 8.45 a ± 0.12 | 8.46 a ± 0.02 | 8.47 a ± 0.05 | 8.44 a ± 0.05 | 8.41 a ± 0.01 |
| pH (KCl) | 7.1 a ± 0.07 | 7.01 a ± 0.06 | 6.99 a ± 0.05 | 6.94 a ± 0.04 | 6.97 a ± 0.05 |
| EC | 350 c ± 0.23 | 301 c ± 0.22 | 297 c ± 0.12 | 530 b ± 0.17 | 740 a ± 0.14 |
| OC | 1.78 b ± 0.19 | 1.69 b ± 0.22 | 2.13 ab ± 0.11 | 2.9 a ± 0.09 | 3.3 a ± 0.09 |
| TN | 0.19 a ± 0.17 | 0.23 a ± 0.09 | 0.21 a ± 0.13 | 0.19 a ± 0.12 | 0.20 a ± 0.11 |
| C/N | 9.4 b ± 0.15 | 7.39 c ± 0.15 | 19.1 a ± 0.16 | 15.2 a ± 0.11 | 16.5 a ± 0.14 |
| WSP | 282 b ± 0.32 | 320 a ± 0.52 | 315 a ± 0.42 | 138 c ± 1.12 | 170 c ± 0.92 |
| MBC | 433.3 c ± 0.52 | 733 b ± 0.17 | 798 b ± 0.42 | 897.33 a ± 0.52 | 961.4 a ± 0.32 |
| FDA | 5.14 a ± 0.44 | 5.44 a ± 0.33 | 5.33 a ± 0.27 | 4.88 b ± 0.36 | 4.81 b ± 0.18 |
| DHA | 20.1 b ± 0.72 | 22.1 b ± 0.32 | 24.1 b ± 0.42 | 32.92 a ± 0.32 | 38.09 a ± 0.42 |
| BACT | 1.3 × 10⁵ c ± 1.42 | 1.1 × 10⁵ c ± 2.12 | 1.6 × 10⁵ c ± 3.32 | 5 × 10⁵ b ± 3.13 | 8.3 × 10⁵ a ± 2.12 |
| FUN | 4.6 × 10⁴ a ± 3.12 | 4.5 × 10⁴ a ± 1.42 | 4.6 × 10⁴ a ± 2.62 | 2.7 × 10⁴ b ± 2.11 | 3 × 10⁴ ± 2.02 b |
| ACT | 5.7 × 10⁴ a ± 2.12 | 3.7 × 10⁴ b ± 4.12 | 6.7 × 10⁴ a ± 1.12 | 1.3 × 10⁵ c ± 3.16 | 1.5 × 10⁵ c ± 2.21 |
| CEC | 16 b ± 0.13 | 12 c ± 0.12 | 19 ba ± 0.18 | 22 a ± 0.11 | 22.9 a ± 0.15 |
Table 8.
Correlation matrix (Pearson) of chemical and biochemical properties of soil located in Motta San Giovanni, 90 days after treatments with the different fertilizers. CTR (control) soil without fertilizer; NPK = nitrogen–phosphorous–potassium; HM = horse manure; C1 50% wood sawdust + 50% wet wastes, C2 10% Straw and 90% wet wastes. Values in bold are different from 0 with a significance level of alpha = 0.05.
| Variables | WC (%) | pH (H2O) | pH (KCl) | EC | OC | TN | C/N | WSP | MBC | FDA | DHA | BACT | FUN | ACT | CEC |
|---|
| WC (%) | 1 | −0.315 | −0.841 | 0.529 | 0.770 | −0.175 | 0.934 | −0.525 | 0.863 | −0.473 | 0.740 | 0.403 | −0.593 | 0.714 | 0.825 |
| pH (H2O) | −0.315 | 1 | 0.312 | −0.971 | −0.831 | 0.441 | −0.189 | 0.794 | −0.468 | 0.879 | −0.847 | −0.815 | 0.774 | −0.848 | −0.651 |
| pH (KCl) | −0.841 | 0.312 | 1 | −0.506 | −0.715 | −0.059 | −0.602 | 0.602 | −0.959 | 0.403 | −0.752 | −0.229 | 0.736 | −0.655 | −0.609 |
| EC | 0.529 | −0.971 | −0.506 | 1 | 0.939 | −0.444 | 0.390 | −0.860 | 0.641 | −0.912 | 0.947 | 0.806 | −0.861 | 0.942 | 0.787 |
| OC | 0.770 | −0.831 | −0.715 | 0.939 | 1 | −0.463 | 0.637 | −0.895 | 0.794 | −0.894 | 0.988 | 0.677 | −0.913 | 0.992 | 0.921 |
| TN | −0.175 | 0.441 | −0.059 | −0.444 | −0.463 | 1 | −0.314 | 0.641 | 0.100 | 0.758 | −0.341 | −0.093 | 0.466 | −0.565 | −0.659 |
| C/N | 0.934 | −0.189 | −0.602 | 0.390 | 0.637 | −0.314 | 1 | −0.372 | 0.631 | −0.406 | 0.561 | 0.351 | −0.383 | 0.598 | 0.813 |
| WSP | −0.525 | 0.794 | 0.602 | −0.860 | −0.895 | 0.641 | −0.372 | 1 | −0.591 | 0.947 | −0.874 | −0.394 | 0.977 | −0.934 | −0.819 |
| MBC | 0.863 | −0.468 | −0.959 | 0.641 | 0.794 | 0.100 | 0.631 | −0.591 | 1 | −0.456 | 0.841 | 0.485 | −0.729 | 0.720 | 0.648 |
| FDA | −0.473 | 0.879 | 0.403 | −0.912 | −0.894 | 0.758 | −0.406 | 0.947 | −0.456 | 1 | −0.850 | −0.558 | 0.879 | −0.942 | −0.861 |
| DHA | 0.740 | −0.847 | −0.752 | 0.947 | 0.988 | −0.341 | 0.561 | −0.874 | 0.841 | −0.850 | 1 | 0.704 | −0.919 | 0.968 | 0.851 |
| BACT | 0.403 | −0.815 | −0.229 | 0.806 | 0.677 | −0.093 | 0.351 | −0.394 | 0.485 | −0.558 | 0.704 | 1 | −0.416 | 0.636 | 0.521 |
| FUN | −0.593 | 0.774 | 0.736 | −0.861 | −0.913 | 0.466 | −0.383 | 0.977 | −0.729 | 0.879 | −0.919 | −0.416 | 1 | −0.928 | −0.784 |
| ACT | 0.714 | −0.848 | −0.655 | 0.942 | 0.992 | −0.565 | 0.598 | −0.934 | 0.720 | −0.942 | 0.968 | 0.636 | −0.928 | 1 | 0.932 |
| CEC | 0.825 | −0.651 | −0.609 | 0.787 | 0.921 | −0.659 | 0.813 | −0.819 | 0.648 | −0.861 | 0.851 | 0.521 | −0.784 | 0.932 | 1 |
Table 9.
Growth parameters and productivity (tons per hectare) of red cabbage and broccoli grown in not-amended soil (control, CTR), NPK = nitrogen–phosphorous–potassium; HM = horse manure; C1 50% wood sawdust + 50% wet wastes, C2 10% Straw + 90% wet wastes.
Table 9.
Growth parameters and productivity (tons per hectare) of red cabbage and broccoli grown in not-amended soil (control, CTR), NPK = nitrogen–phosphorous–potassium; HM = horse manure; C1 50% wood sawdust + 50% wet wastes, C2 10% Straw + 90% wet wastes.
| Red Cabbage | CTR | NPK | HM | C1 | C2 |
|---|
| Leaf humidity (%) | 84 a ± 0.11 | 84 a ± 0.62 | 86 a ± 0.42 | 86 a ± 0.32 | 85 a ± 0.46 |
| Leaf width (cm) | 5.7 a ± 0.56 | 8.8 ab ± 0.25 | 1 a ± 0.42 | 14 a ± 0.15 | 13 a ± 0.52 |
| Leaf length (cm) | 4.4 a ± 0.12 | 7.8 ab ± 0.41 | 10 a ± 0.68 | 9.5 a ± 0.42 | 10 a ± 0.23 |
| Leaf area (cm2) | 45 c ± 0.25 | 65 b ± 0.42 | 75 b ± 0.13 | 96 a ± 0.32 | 91 a ± 0.15 |
| Plant height (cm) | 20 c ± 0.125 | 30 b ± 0.14 | 35 b ± 0.12 | 43 a ± 0.12 | 40 a ± 0.43 |
| Head diameter (cm) | 10 b ± 1.42 | 12 a ± 2.32 | 12 a ± 1.72 | 15 a ± 2.52 | 15 a ± 1.52 |
| Yield (Tons/ha) | 36 b ± 1.51 | 42 a ± 1.42 | 42 a ± 1.32 | 49 a ± 2.12 | 47 a ± 2.32 |
| Broccoli Calabrese | CTR | NPK | HM | C1 | C2 |
| Leaf humidity (%) | 84 a ± 0.15 | 84 a ± 0.18 | 86 a ± 0.62 | 86 a ± 0.43 | 85 a ± 0.65 |
| Leaf width (cm) | 9 a ± 3.32 | 12 a ± 3.44 | 11 a ± 2.32 | 15 a ± 2.23 | 14 a ± 1.12 |
| Leaf length (cm) | 14 a ± 2.42 | 17 a ± 3.22 | 18 a ± 2.12 | 18 a ± 0.22 | 18 a ± 0.16 |
| Leaf area (cm2) | 70 b ± 0.29 | 165 a ± 0.59 | 175 a ± 0.54 | 196 a ± 0.44 | 191 a ± 0.12 |
| Plant height (cm) | 50 b ± 0.34 | 60 b ± 0.14 | 65 ab ± 2.42 | 80 a ± 2.12 | 75 a ± 2.32 |
| Head diameter (cm) | 10 b ± 2.12 | 16 a ± 2.32 | 15 a ± 3.10 | 19 a ± 3.11 | 19 a ± 3.12 |
| Yield (Tons/ha) | 5 c ± 3.12 | 15 b ± 4.01 | 19 ab ± 2.12 | 22 a ± 4.2 | 21 a ± 3.11 |
Table 10.
Content of chlorophyll a (Chl a, mg 100 g−1FW), chlorophyll b (Chl b, mg 100 g−1FW), total chlorophyll (TChl, mg 100 g−1FW), chlorophyll a/chlorophyll b (Chl a/Chl b) and photosynthetic parameters (FV, Fm, Y(NPQ), Y(NO) and ETR are expressed as µmol m−2 s−1) in leaves of bed cabbage and broccoli calabrese.
| Broccoli Calabrese | CTR | NPK | HM | C1 | C2 |
|---|
| Chl a | 114 b ± 0.43 | 120 b ± 0.12 | 142 a ± 0.02 | 158 a ± 0.12 | 167 a ± 0.19 |
| Chl b | 60 a ± 2.25 | 54 a ± 3.11 | 55 a ± 1.11 | 57 a ± 1.45 | 59 a ± 1.24 |
| Chla/Chlb | 1.9 b ± 1.11 | 2.2 b ± 1.12 | 2.58 a ± 1.54 | 2.77 a ± 1.12 | 2.83 a ± 1.02 |
| T Chl | 174 b ± 5.12 | 174 b ± 4.12 | 197 ab ± 3.14 | 215 a ± 4.11 | 226 a ± 2.12 |
| FV | 0.621 b ± 0.43 | 0.802 ab ± 0.22 | 1.004 a ± 0.12 | 1.007 a ± 0.52 | 1.107 a ± 0.23 |
| Fm | 0.939 a ± 0.65 | 1.077 a ± 0.21 | 1.423 a ± 0.22 | 1.222 a ± 0.61 | 1.343 a ± 0.36 |
| F0 | 0.293 b ± 0.02 | 0.384 ab ± 0.02 | 0.528 a ± 0.11 | 0.534 a ± 0.12 | 0.544 a ± 0.74 |
| Fv/Fm | 0.661 a ± 0.02 | 0.74 a ± 0.01 | 0.71 a ± 0.12 | 0.82 a ± 0.01 | 0.82 a ± 0.01 |
| Y(NPQ) | 0.443 a ± 0.01 | 0.329 a ± 0.11 | 0.216 a ± 0.02 | 0.215 a ± 0.04 | 0.219 a ± 0.01 |
| Y(NO) | 0.235 b ± 0.02 | 0.215 b ± 0.01 | 0.344 a ± 0.01 | 0.397 a ± 0.03 | 0.361 a ± 0.04 |
| ETR | 21.21 c ± 0.12 | 28.84 b ± 0.16 | 35.24 b ± 0.14 | 41.26 a ± 0.13 | 39.54 a ± 0.14 |
| Red Cabbage | CTR | NPK | HM | C1 | C2 |
| Chl a | 94 a ± 0.56 | 100 a ± 1.52 | 112 a ± 4.12 | 118 a ± 4.67 | 117 a ± 5.12 |
| Chl b | 65 a ± 3.52 | 69 a ± 3.15 | 66 a ± 2.17 | 65 a ± 2.15 | 69 a ± 1.21 |
| Chla/Chlb | 1.45 a ± 0.01 | 1.45 a ± 0.42 | 1.47 a ± 0.13 | 1.81 a ± 0.13 | 1.71 a ± 0.11 |
| T Chl | 159 b ± 8.76 | 169 a ± 8.22 | 178 a ± 4.62 | 183 a ± 2.24 | 186 a ± 4.12 |
| FV | 0.644 b ± 0.02 | 0.776 b ± 0.01 | 1.016 a ± 0.01 | 1.027 a ± 0.02 | 1.144 a ± 0.02 |
| Fm | 0.899 b ± 0.03 | 1.000 b ± 0.25 | 1.227 a ± 0.26 | 1.392 a ± 0.11 | 1.465 a ± 0.12 |
| F0 | 0.293 b ± 0.05 | 0.384 b ± 0.06 | 0.528 a ± 0.08 | 0.534 a ± 0.04 | 0.544 a ± 0.06 |
| Fv/Fm | 0.617 a ± 0.01 | 0.626 a ± 0.05 | 0.639 a ± 0.03 | 0.656 a ± 0.04 | 0.663 a ± 0.01 |
| Y(NPQ) | 0.433 a ± 0.02 | 0.409 a ± 0.08 | 0.216 b ± 0.03 | 0.225 b ± 0.07 | 0.256 b ± 0.09 |
| Y(NO) | 0.235 b ± 0.07 | 0.215 b ± 0.03 | 0.344 a ± 0.05 | 0.397 a ± 0.03 | 0.361 a ± 0.05 |
| ETR | 21.21 c ± 1.03 | 28.84 b ± 3.12 | 35.24 b ± 2.12 | 41.26 a ± 4.02 | 39.54 a ± 3.02 |
