Article

Merits and Limitations of Element Balances as a Forest Planning Tool for Harvest Intensities and Sustainable Nutrient Management—A Case Study from Germany

1
Department of Environmental Control, Northwest German Forest Research Institute (NW-FVA), D-37079 Goettingen, Germany
2
Department of Soil and Environment, Forest Research Institute of Baden-Wuerttemberg (FVA-BW), D-79100 Freiburg, Germany
3
Department of Soil and Climate, Bavarian State Institute of Forestry, D-85354 Freising, Germany
4
Department of Biometry and Information Sciences, Forest Research Institute of Baden-Wuerttemberg (FVA-BW), D-79100 Freiburg, Germany
5
INTERRA, Bureau for Environmental Monitoring, St. Peter Str. 30, D-79341 Kenzingen, Germany
*
Author to whom correspondence should be addressed.
Soil Syst. 2022, 6(2), 41; https://doi.org/10.3390/soilsystems6020041
Submission received: 28 February 2022 / Revised: 25 March 2022 / Accepted: 13 April 2022 / Published: 20 April 2022
(This article belongs to the Special Issue Forest Soils: Functions, Threats, Management)

Abstract

:
Climate change and rising energy costs have led to increasing interest in the use of tree harvest residues as feedstock for bioenergy in recent years. With an increasing use of wood biomass and harvest residues, essential nutrient elements are removed from the forest ecosystems. Hence, nutrient sustainable management is mandatory for planning of intensive forest use. We used soil nutrient balances to identify regions in Germany where the output of base cations by leaching and biomass utilization was not balanced by the input via weathering and atmospheric deposition. The effects of conventional stem harvesting, stem harvesting without bark, and whole-tree harvesting on Ca, Mg and K balances were studied. The nutrient balances were calculated using regular forest monitoring data supplemented by additional data from scientific projects. Effective mitigation management strategies and options are discussed and calculations for the compensation of the potential depletion of nutrients in the soil are presented.

1. Introduction

The supply of base cations like sodium (Na), potassium (K), magnesium (Mg) and calcium (Ca) into forest soils occurs through the dissolution of minerals and inputs through atmospheric deposition [1]. The decline in base cation deposition throughout large parts of Europe [2,3] will partly offset the positive effect of reduced base cation leaching due to decreased sulphur deposition [4,5], even if the sulphur emissions in Germany have decreased by more than 90% in the past decades [6]. Additionally, forests are currently and will be in the coming decades under pressure to fulfil the rising demands for timber and biomass as a sustainable energy source [7], which can contribute to reducing greenhouse gas emissions [8,9].
With the intensifying use of wood biomass and harvest residues, like tree tops, branches and bark, the associated nutrient element exports increase disproportionately [10], as the element concentrations in these tree parts are much higher than in stem wood [11,12]. Subsequently, the additional exports of base cations may have significant impacts on soil element stocks and soil quality [13], if weathering or other input fluxes cannot compensate for the resulting losses. Under these conditions, a recovery of forest soils from past acidification is not to be expected, despite a considerable ongoing decrease of sulphur deposition in Europe [4].
Accordingly, concerns have been raised about the sustainability of harvesting practices and their net impact on forest productivity, particularly during the second and subsequent rotation periods [14]. Therefore, a world-wide debate on the merits and trade-offs of additional forest biomass use is under way in the scientific community, as well as in politics, forestry practice and among certification authorities. Practical decisions in harvest intensity planning have long-term consequences on soil quality, forest growth and potentially necessary compensation measures. However, decisions are often based on intuition [15] or very different, hardly comparable methodological approaches [16]. As indicators should have a scientific basis and be applied operationally in a mapped way [17], a common method for site-specific assessment is to calculate input-output nutrient budgets [7,18,19].
In the Netherlands, soil nutrient balances were calculated in order to develop nationwide forest harvesting guidelines specific to regions of comparable deposition, tree species and soil types [7]. For each region-tree-soil combination, the maximum possible harvest intensities were calculated under equalized nutrient balance including uncertainties. The results show that on poorer sandy soils, even the current rates of timber and biomass exports lead to negative balances, particularly for phosphorus (P) and K. A long term mass balance study in Sweden showed net losses of Ca and Mg for stem harvesting and whole-tree harvesting (WTH) scenarios throughout most parts of the country [20]. In another study from Sweden, WTH reduced the base saturation in the soil [21]. Long-term base cation balances for forest soils in Finland demonstrated that WTH will lead to the depletion of base cations [22]. In 1066 Finish lake catchments, stem-only and stem-and-branches harvesting scenarios resulted in a balanced base cation budget, whilst WTH scenarios depleted the soil base cation pools [13]. In contrast, the calculations of Forsius et al. [23] for Finnish forests suggested that the input by weathering and deposition was sufficient to sustain the nutrient demand of WTH. For the British Isles, the predicted input from weathering and deposition were sufficient to compensate the losses of Ca, Mg, and K for stem-only and stem plus branch harvest scenarios [24]. Whole-tree harvesting resulted in a negative Ca balance at about half of the studied sites. Consistent with this, one of the oldest European WTH experiments in the United Kingdom also observed a significant decrease of soil base saturation after harvesting all above ground biomass [14]. When comparing these studies from different countries, it is important to note that conventional harvest schemes vary widely across countries [25] and that the considered WTH scenarios differ as well (for example in terms of the harvested tree compartments).
A review by Agate et al. [26] confirmed that high nutrient losses from soils have measureable consequences for forest ecosystems. Most studies therein revealed a negative effect on stand growth (tree diameter, tree height and tree volume) with a 3–7% reduction in the short and medium-term (up to 33 years after use), especially when canopy biomass including foliage was exported. The review by Thiffault et al. [27] also indicated medium-term (≤24 years) growth reductions in intensively used stands. However, the long-term effects are largely unknown [28] and it should be noted that the negative effects on stand growth after WTH observed in some studies resulted from a temporary nitrogen deficiency [29]. The high risk of site degradation due to intensified biomass harvesting [30] makes it necessary to develop forest management strategies which will not impair forest productivity in the long term [8] and which take into account that the risks are highly dependent on soil fertility, stand and site conditions [31,32].
In Germany and many other countries, there is a great interest in sustainable nutrient management in the forestry sector. Nutrient balances are widely adopted tools to assess sustainable forestry. However, the calculation procedures in the individual federal states of Germany differ significantly from each other and the approaches have only been implemented in small-scale studies. For example, very different models and methods are used to calculate weathering [33,34,35,36] and leaching rates [19,37,38].
The objective of our study was to improve the nationwide assessment of the effects of harvest intensities on sustainability of the element budgets of forest soils. Specifically, we aimed at: (1) calculating methodologically uniform nutrient balances and their uncertainties for Germany using established, regular environmental monitoring systems as spatial data basis; (2) analysing the spatial patterns of harvesting effects on element balances to assess potential and risk of actual and intensified biomass harvesting for German forests and (3) deriving and quantifying strategic approaches for adapting harvest intensities as well as other nutrient management options to the actual nutrient availability at a regional scale.

2. Materials and Methods

2.1. Calculation of Nutrient Balances

Soil nutrient balances are commonly used indicators in both agriculture and forestry where annually or periodically aggregated balances express changes in soil nutrient stocks and soil fertility. Compared to agricultural systems, where fertilizer input dominates the soil nutrient balance, calculating soil nutrient balances for forest ecosystems poses a much greater challenge and the involved uncertainties are very high [39]. In forest soils, the relevant processes are inputs by atmospheric deposition as well as soil mineral weathering and the output fluxes by leaching and forest harvesting (Figure 1). For the assessment of different management options, the calculations should be performed in two steps: (1) calculation of nutrient balances without harvest removal (environmental part) and (2) calculation of total nutrient balances considering specific management options, e.g., different harvest scenarios or soil protective liming.
In our study, the calculation of nutrient balances was restricted to the main nutrients Ca, Mg and K. These elements largely determine the resilience of forest soils to acidification. Nitrogen (N) fluxes were not calculated because high nitrogen emissions in the recent past and at present have caused an oversupply of nitrogen throughout Germany [19,40]. Phosphorus, also an essential nutrient for tree growth and health, is characterized by very small fluxes in both leaching and deposition, and P concentrations are often near or below the limit of detection of conventional analytical methods [41]. In addition, part of the P transport in soils takes place in colloidal inorganic and organic P forms and can only be measured with considerable analytical effort [42]. Phosphorus was therefore not addressed in this study.
In some forest soils, the depletion rate of base cations in relation to element pools is very small [24]. To take this into account, one thousandth of the plant-available soil nutrient stock of Ca, Mg and K up to a depth of 90 cm was added to the nutrient balance and thus would be depleted in 1000 years at the earliest. Such a buffer is appropriate because small balance deficits are more tolerable in soils with high plant-available nutrient stocks and natural soil acidification is an extremely slow process [43]. All presented balances were averaged over the years 2000 to 2010 (data and conditions of the second National Forest Soil Inventory (NFSI II)) to compensate for annual fluctuations.

2.1.1. Study Sites

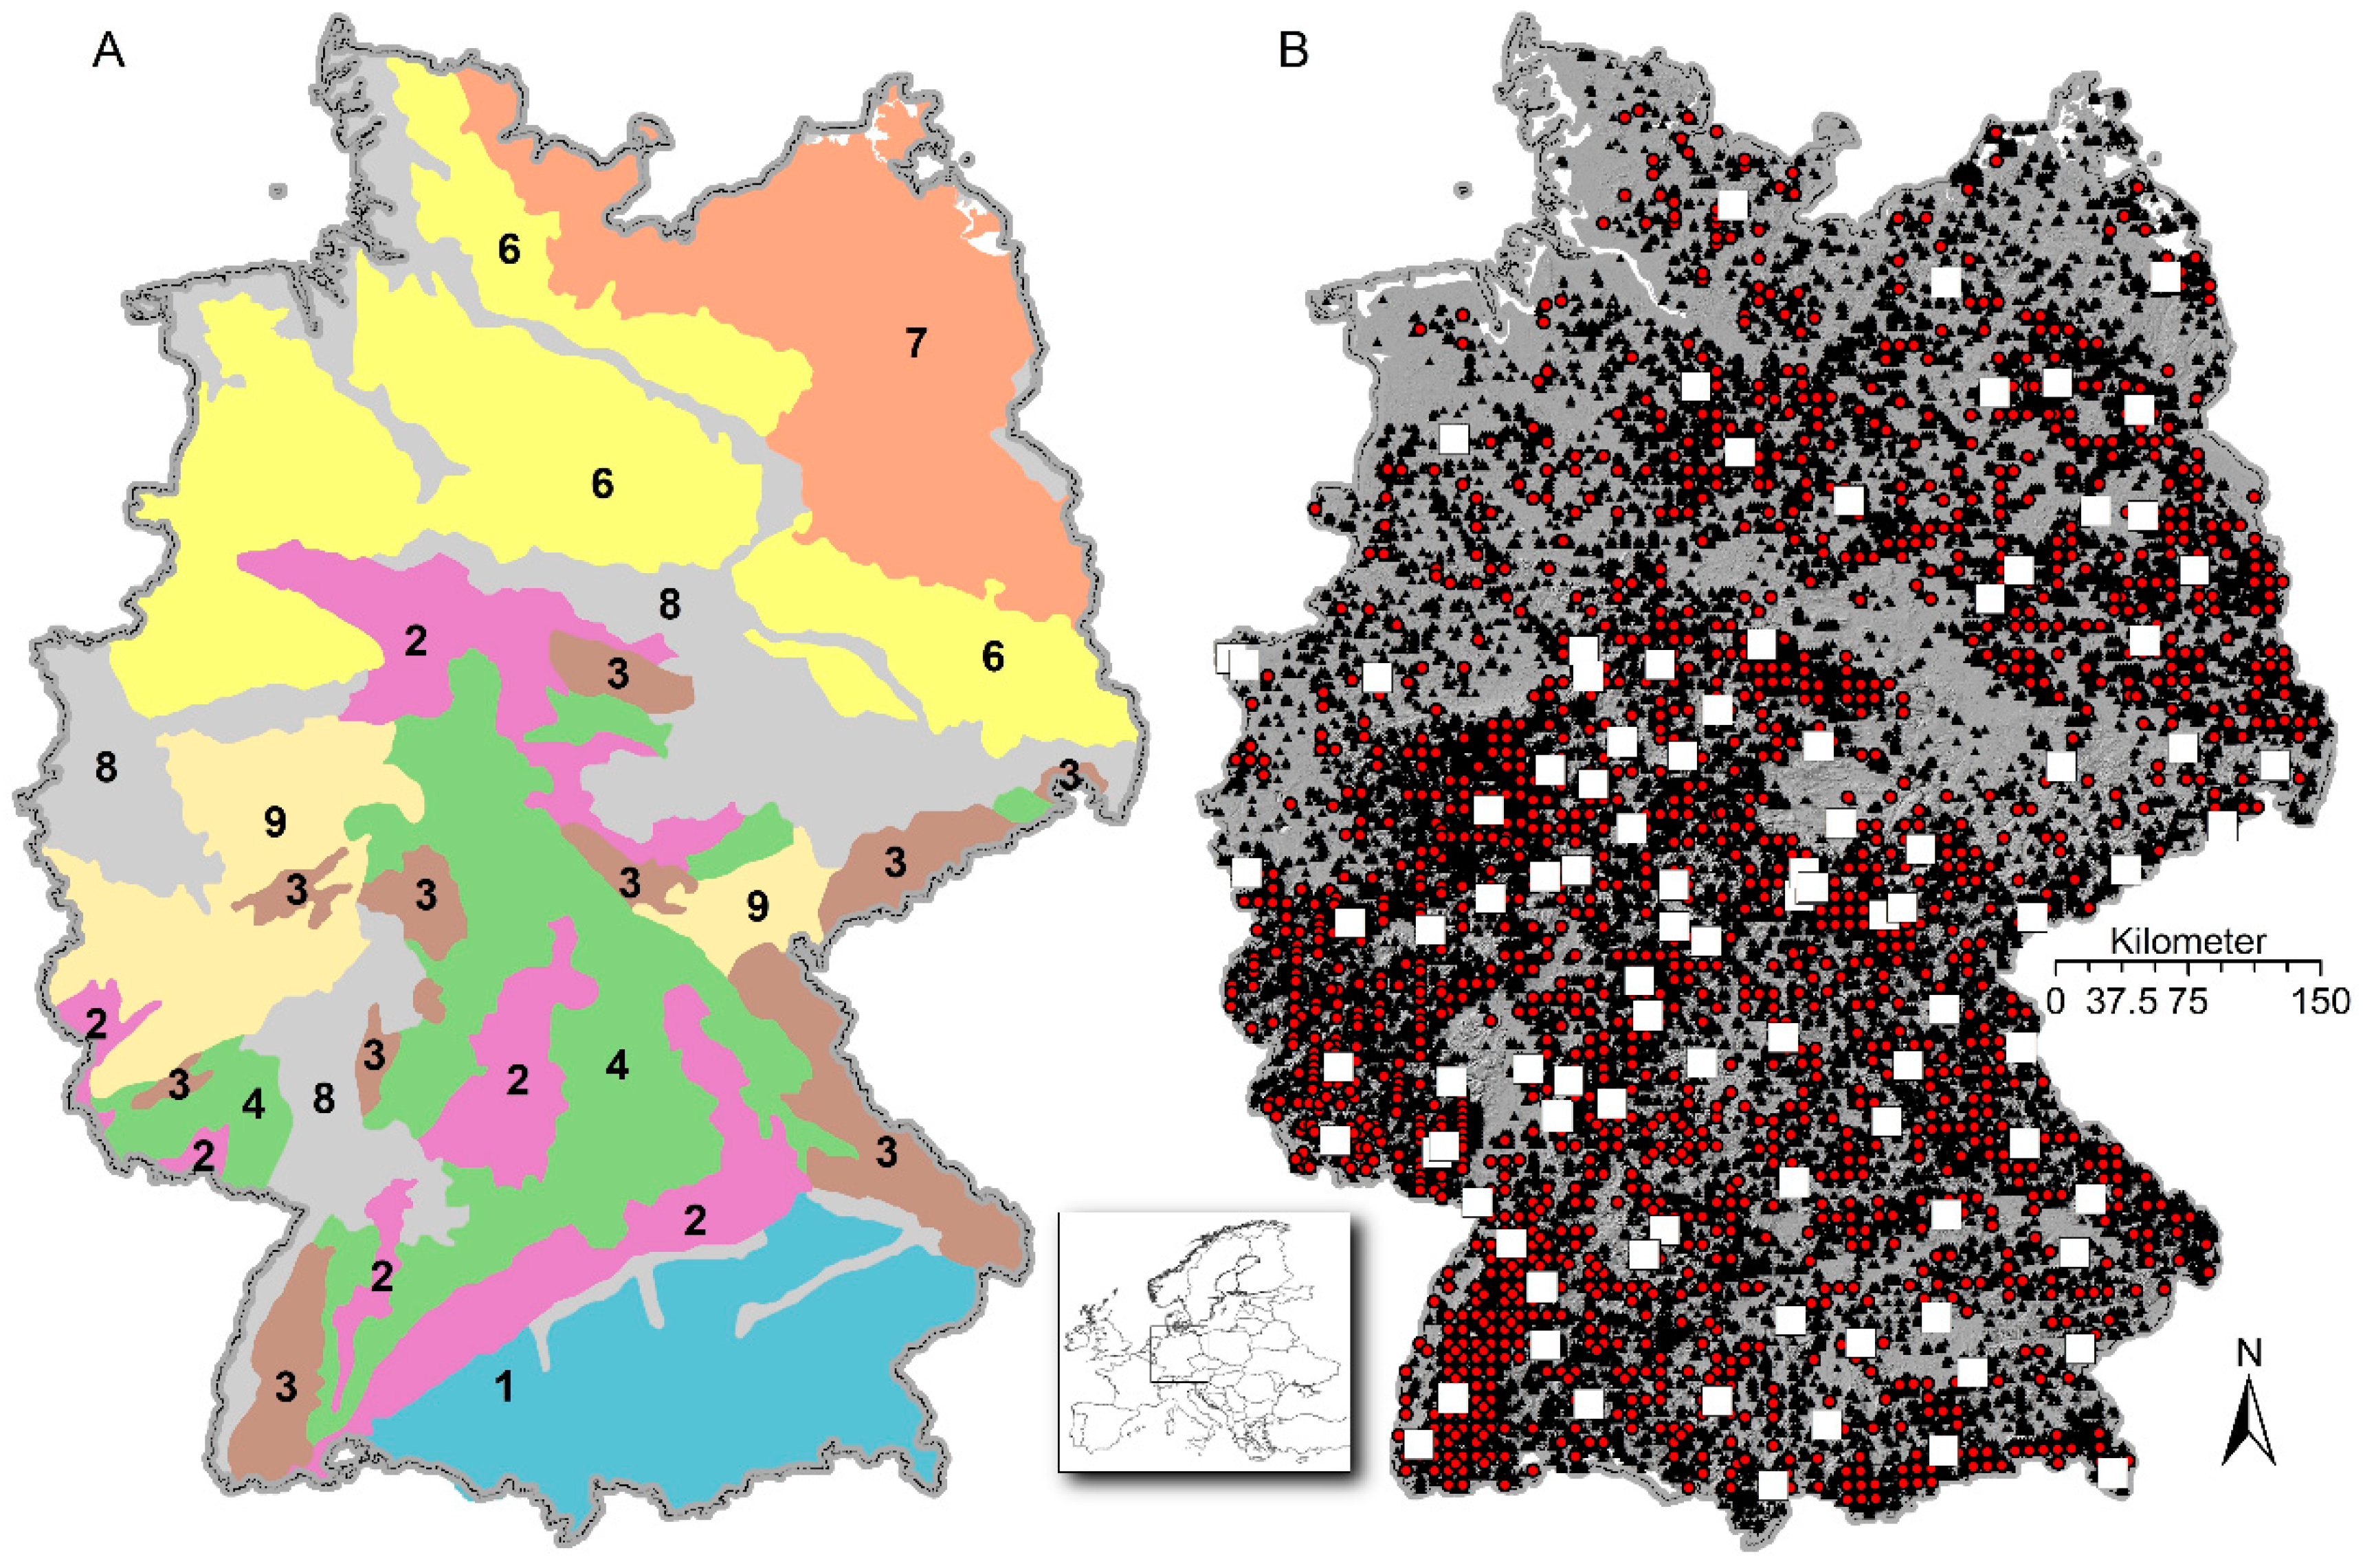
Around one third (32%) of Germany is covered by forest. Due to the high diversity of soils in Germany, reflecting different landscapes formed during the ice age, climate, and bedrock conditions, we stratified Germany into eight different model regions or soil landscapes (Figure 2A).
For model development, application, regionalization, and evaluation, we used data from three different monitoring networks in Germany (Figure 2B). Data from Intensive Forest Monitoring sites were used to parametrize the statistical deposition model (cf. Section 2.1.3) and for the estimation of weathering rates (cf. Section 2.1.4) and element concentrations in seepage water (cf. Section 2.1.5). Data from an 8 × 8 km grid of the NFSI II (1690 sites) were used to calculate weathering and leaching rates and then transferred from these sites to the 23,880 tracts of the third German National Forest Inventory (NFI 2012), using statistical regionalization methods (cf. Section 2.2). The German NFI is based on a systematic rectangular grid with clusters (tracts) as primary sampling units. The sample grid has a width of 4 × 4 km covering the entire forest area of Germany. The NFI data can be used to quantify different forest use scenarios and compare these to the nutrient balance without harvesting (WOH). In addition, the 16-fold higher data density of the NFI compared to the NFSI allows a more spatially differentiated identification of regions with critical nutrient balances.

2.1.2. Model Formulation

The total nutrient balance (EB) with harvest (WH) was calculated according to:
EB x = DEP x + WEA x + LEA x + HAR x + S x 1000
for each element x (Ca, Mg, K) separately, where DEP is the deposition, WEA the weathering rate, LEA the leaching, HAR the harvest removal of base cations and S denotes one 1000th of the plant-available nutrient stock in the soil. In scenarios without harvest (WOH), HAR was set to zero. All fluxes were calculated as kg ha−1 yr−1 and for the comparison between different charged ions, kmolc ha−1 yr−1. Following Sverdrup et al. [44], cation exchange and the release of base cations in the decomposition process of organic matter were not taken into account, because they are internal cycles and accordingly not long-term sources.
We defined three different potentially feasible harvesting scenarios along a gradient of harvesting intensity (MIN, REAL, MAX—see Table A1). The scenarios considered different intensities of stem and crown utilization as well as the redistribution of biomass in the forest stand, its accumulation on skid trails or its export depending on the utilization technique. Scenario MIN was the most resource saving harvest intensity where only saw logs and industrial wood with diameters > 12–17 cm are harvested. Scenario REAL represented a common harvest intensity where saw logs, industrial wood, and fuel wood with diameters > 7 cm are used. In the most intense scenario MAX, all above-ground woody biomass except inevitable harvesting losses is used. More details can be found in Table A1.

2.1.3. Deposition

The estimation of total deposition (TD—sum of wet, dry and occult) of the base cations x (Ca, Mg, K) was based on combined regionalized measurements (wet deposition [45,46]) and canopy budget model calculations (dry and occult) after the ‘filtering approach’ [47] for the period 2000–2010. The calculations are performed as follows:
TD x = BD x + BD x · DDF
and the dry deposition factor (DDF) is calculated from Na deposition [48,49]:
DDF = ( TF BD ) Na BD Na
where TF = throughfall deposition and BD = bulk deposition. This approach assumes that Ca, Mg and K aerosols are deposited with equal deposition velocity as Na particles.
Generalized additive mixed models (GAMM) [50] were used to explore and quantify the impact of forest stand characteristics, topographic and atmospheric variables on DDF. For this, measured deposition data [51] from more than a hundred Intensive Forest Monitoring sites with a variety of forest stand types were analysed. The final DDF model included the predictor variables wind speed, windward and leeward effects, distance to the North Sea (as proxy for sea salt concentration), bulk deposition, tree species and stand height. Bulk open field deposition was estimated from regionalized wet deposition maps which were adjusted using correction factors for Germany from Gauger et al. [52]. The complete model with all parameters and validation results is summarized in Appendix B. The calculation of the GAMM models was performed with R 3.01 software [53], package “mgvc”, landscape morphology was analysed with SAGA [54].

2.1.4. Weathering Rates

Weathering rates in the mineral soil were calculated with the geochemical model Profile [55], which has been frequently applied in Europe [56,57,58] and North America [59,60,61]. The particularly sensitive input variables [62,63] were parameterized as follows: The specific surface area (SSA) was calculated using the equation from Phelan et al. [60], which is a modification of the equation from the original Profile model [55] and is also valid for soils with clay contents of more than 20%. Dynamic soil water contents for all NFSI profiles were derived from water budget modelling using LWF-Brook90 [64]. A detailed description of the water budget model parameterization is given in a variety of recent studies [65,66,67]. The mean annual soil temperature was taken from regionalized climate data (cf. Section 2.1.5). As mineral analyses were not available for most of the NFSI sites, the mineralogical input to Profile was estimated from total geochemical soil analyses with the A2M (“Analysis to Mineralogy”) model [68].

2.1.5. Leaching of Base Cations

Leaching rates were estimated by multiplying the amount of annual seepage water with an estimated element concentration in the seepage. Plot-specific soil water fluxes were estimated with the physically based hydrological model LWF-Brook90. The LWF-Brook90 model requires meteorological input data in daily resolution (precipitation, temperature, radiation, water vapour pressure, wind speed). The model was run from 2000 to 2010 using regionalized daily climate data derived from measurements at the weather stations of the German Weather Service (German: Deutscher Wetterdienst, DWD). Temperature, vapour pressure and wind speed were interpolated using GAMs, precipitation, and global radiation by kriging. Methodical details and information on model performance are given by Ahrends et al. [65].
To address the second methodological challenge—estimating element concentrations in seepage water—data on soil water extracts measured on the NFSI plots were used. An example for the estimation of seepage nitrate concentrations from water extracts measurements is described in Fleck et al. [19]. Sample preparation and analysis for the soil water extracts followed standardized procedures according to the guidelines for harmonized methodologies for laboratory analyses [69,70,71,72].
The exact procedure is described in Weis et al. [73] and includes the following main steps: (1) estimation of seepage concentrations of strong anions (sulphate, nitrate, chloride) from their concentrations in the aqueous soil extracts (water to soil ratio 2 ÷ 1); (2) estimation of inorganic dissolved carbon concentration from soil pH in water; (3) estimation of the molar fractions of the cations in the leachate from their fractions of the effective cation exchange capacity (extraction with 1 M NH4Cl solution; for carbonate-containing soils extraction with 0.1 M BaCl2 solution); (4) multiplication of the estimated cation fractions with the total anion concentration.
The approach was based on the following simplifying assumptions: the base cation leaching is mainly driven by the leaching of the anions sulphate (SO42+), nitrate (NO3) [7] and chloride (Cl) and the anion discharge is equal to the cation discharge; organic anions can be neglected in the discharge horizon; the cation fractions in the seepage water can be predicted with sufficient accuracy from the cation fractions at the soil exchanger; the total concentration (activity) of the ions in the seepage water plays a subordinate role. At 90% of the NFSI sites the discharge horizon was assumed to be in the mineral soil at depth of 60–90 cm; at 10% of the sites the soil development was shallower, and thus the surface of the bedrock was taken as discharge horizon there.

2.1.6. Estimation of Nutrient Export under Different Harvest Intensities

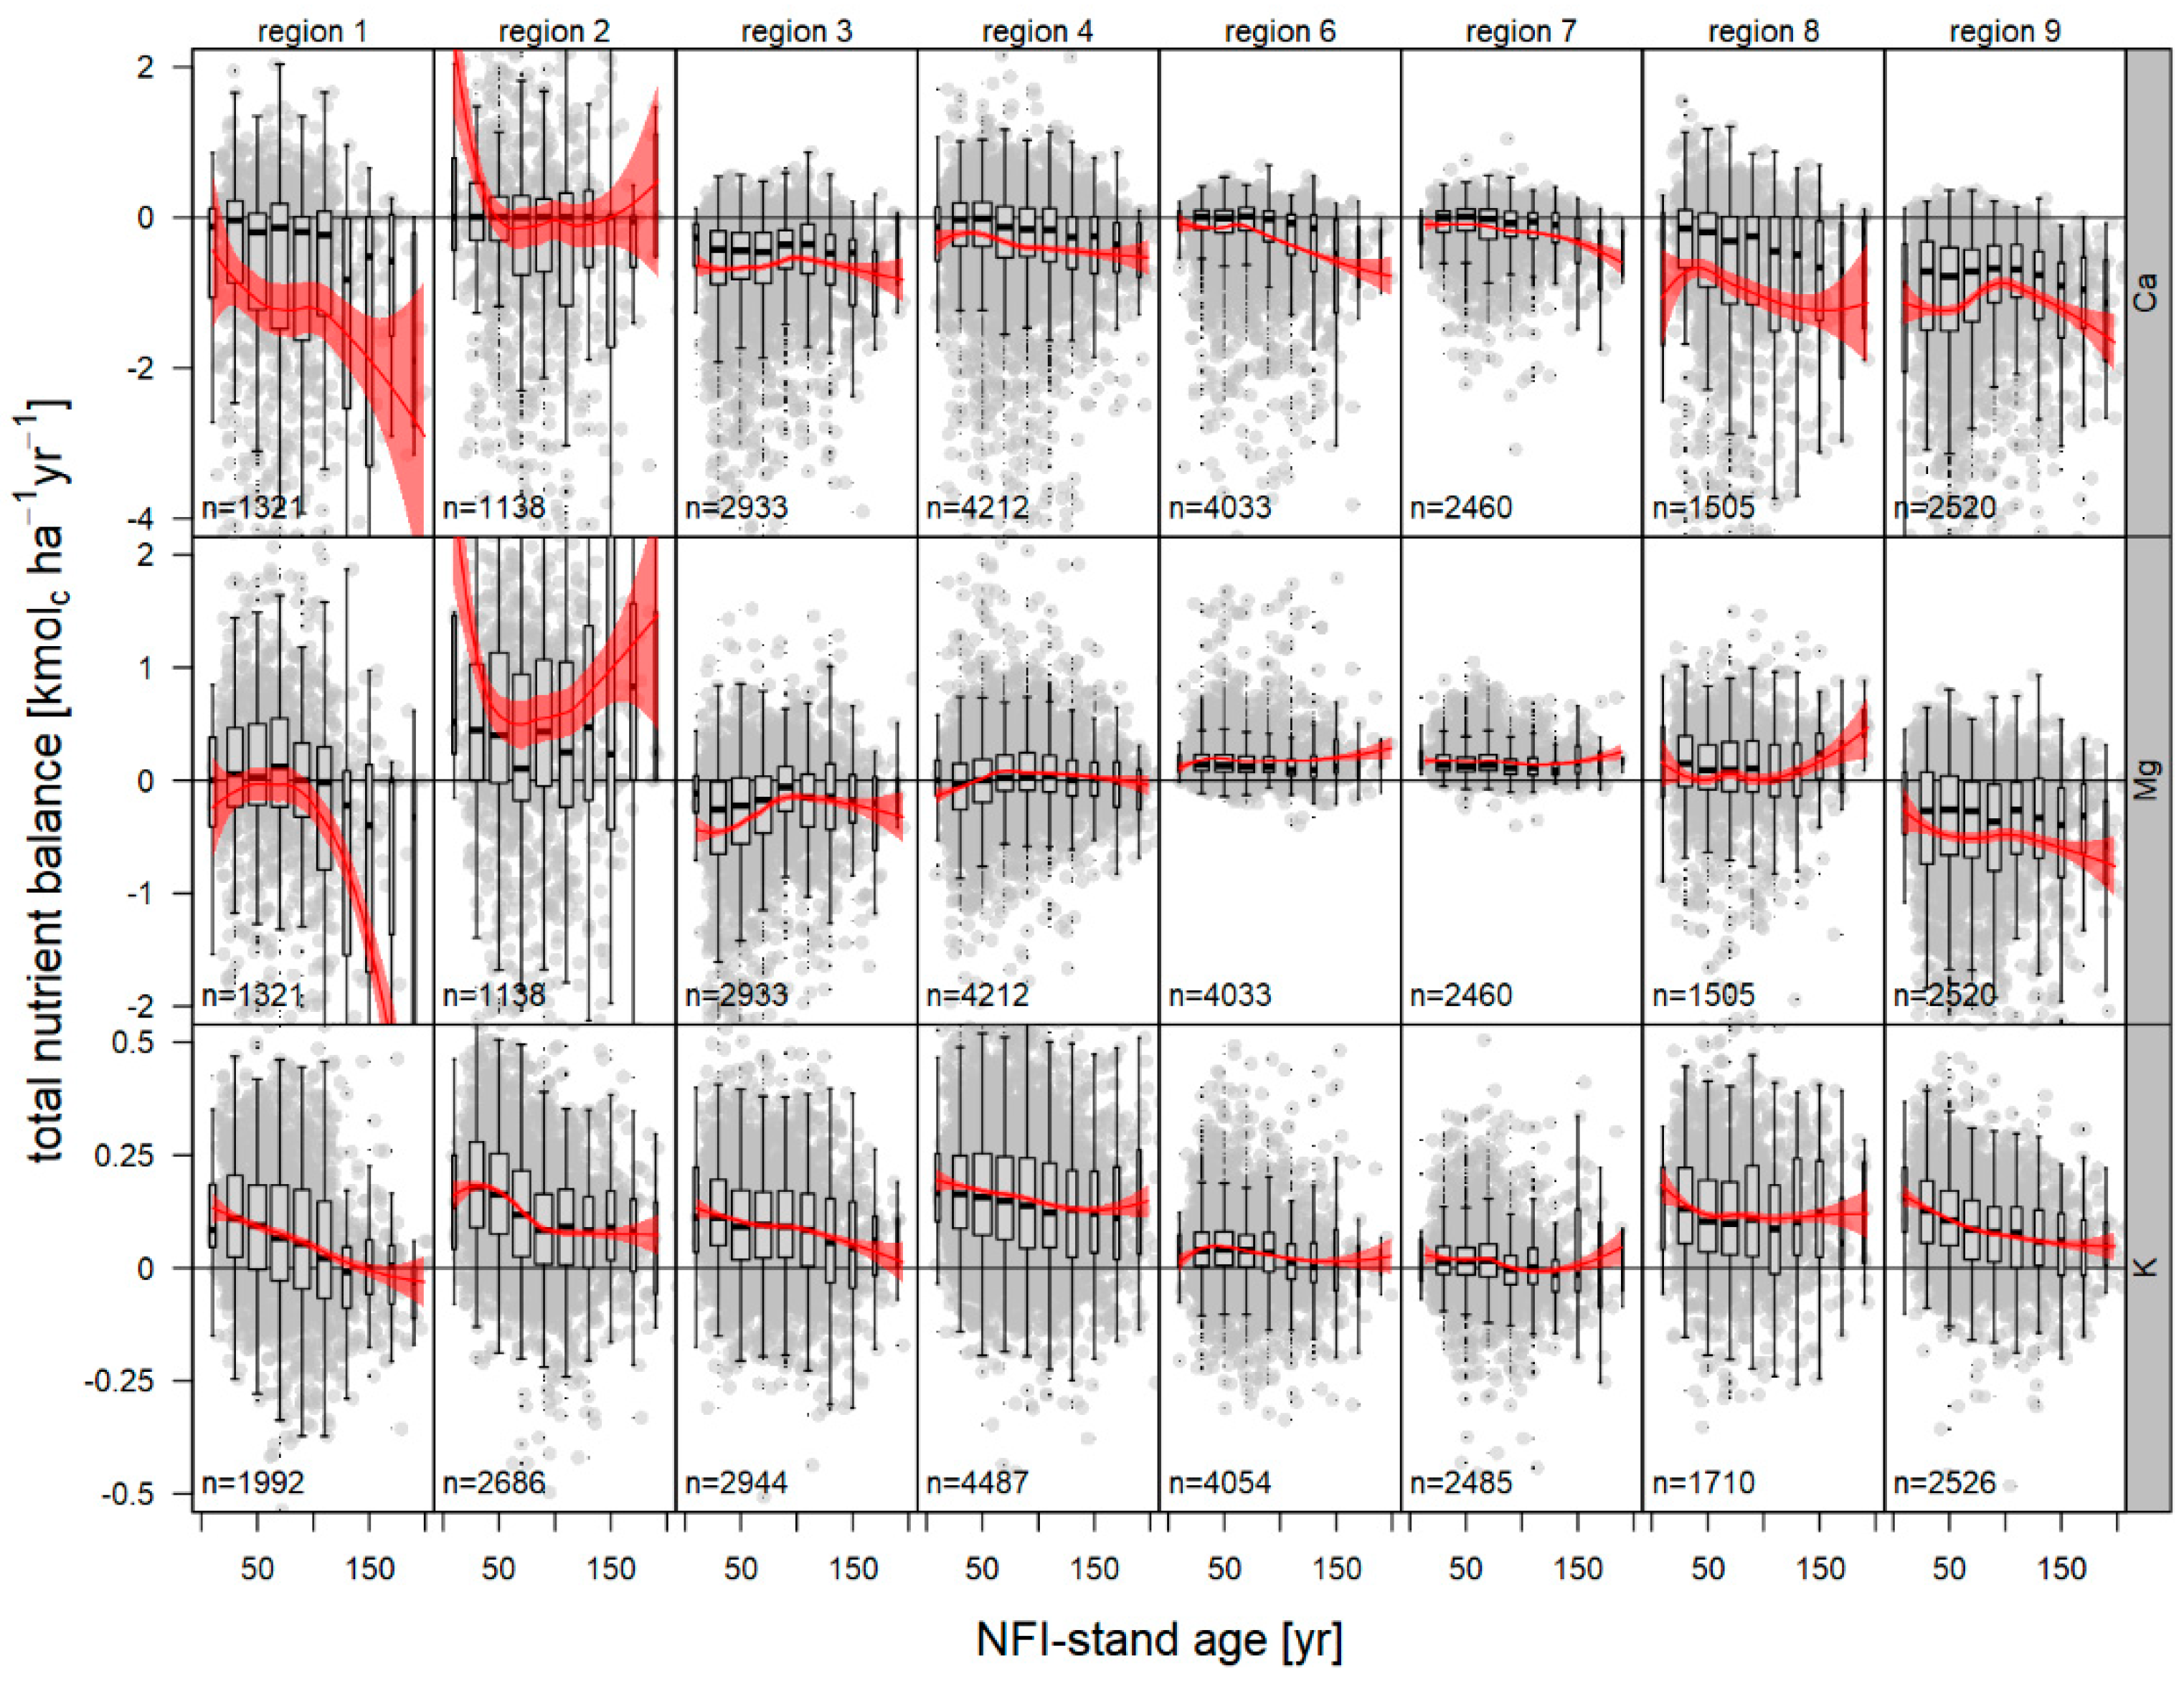
The National Forest Inventory in Germany is the primary source of national forest information and has been conducted three times so far (1987, 2002 and 2012). To project forest development and timber supply based on NFI data into the future, the empirical single-tree growth model WEHAM [74,75] was used. For this study, the resulting data were used to define initial conditions for the simulation of harvest scenarios. Normally the NFI is not to be evaluated for individual tracts, but tracts are aggregated into larger areas comprising all age classes of relevant forest types. When calculating nutrient balances for each NFI tract, we had to assume that nutrient removal by harvest corresponded to the long-term average. Hence, we used real removals during 2002 to 2012 (based on NFI data) and WEHAM projections for 2012 to 2052 encompassing 50 years of forest development. Evaluation results showed that calculated nutrient balances from the nutrient removal at the NFI tracts were independent of stand age (Figure A3).
For our nutrient balances, the exported biomass for each NFI sample tract and each scenario (Table A1) was calculated based on the available biometric tree information using additive biomass functions for different species and different components: stump, stump bark, solid wood, bark of solid wood, brushwood with a diameter of less than 7 cm and needles (if applicable; leaves for broadleaved trees were not considered) [76]. Taper curves and assortment algorithms were used including the quantification of bark share [77]. Mean contents of Ca, Mg and K in the biomass compartments “coarse wood”, “bark of coarse wood” and crown biomass (brushwood plus bark and needles when coniferous) were calculated from twelve scientific studies [33,78,79,80,81,82,83,84,85,86,87,88] and summarized in Rumpf et al. [12]—including 451 experimental sites and 1498 trees of 5 coniferous and 6 broad-leaved tree species. The element exports with harvest were derived from the multiplication of biomass values and nutrient contents of the respective tree components based on GAM models. The pre-defined utilization scenarios (Table A1) determined the average nutrient export at each NFI sample tract.

2.2. Regionalization of Nutrient Fluxes and Soil Stocks

The data needed for calculating the soil-based components of the nutrient balances as well as the balances themselves were only available (measured or assessed by transfer functions) at the grid points of the NFSI. None of these data were available at the systematic grid with tracts of the National Forest Inventory (NFI). Therefore, results were transferred from the NFSI grid to the NFI tracts by means of regression models (stepwise multiple regression models combined with kriging of model residuals when needed) on log transformed response variables (alternatively tested boosted regression trees were outperformed according to the model validation). As predictors, we used quasi-continuously available key variables like geology, topography, soil types, climate and deposition from nationwide data bases and maps (GÜK2000 for geological overview, BÜK50 or BÜK200 for soil types, a 25 m DEM grid for deriving topographical indices and deposition maps [46]). Moreover, information on forest conditions (proportion of coniferous trees, crown condition, soil protective liming) were included in the regression models as potential co-variables.
The transfer was performed in three steps: First, the data was split in half resulting in a training and a validation data set, both randomly distributed in space. Second, the regression models were parameterized (ordinary least squares, OLS) separately for each soil landscape (cf. Figure 2A) at the NFSI grid points. An assessment of the extent to which the regionalized balances reflected the distributional characteristics of the balances based on the measured NFSI data is provided in Figure A6. Model performance was tested after back-transformation and bias correction [89] in terms of R² and RMSE (Root Mean Square Error) using the validation data set. Finally, the regression models were applied with their respective individual set of predictors to each of the NFI tracts with available metadata except for deposition, which was estimated directly for all NFI tracts (cf. Section 2.1.3 and Figure A7).
The completeness of measured parameters at the sampling points of the NFSI differs between the federal states, even if a big effort has been invested for harmonizing the environmental monitoring systems for all of Germany [72,90]. Data availability differed between the balance components: data for calculating weathering rates were available at 86% of the sites, for nutrient leaching with seepage water at 66% and for nutrient balances at 55%. Hence, only at around half of the NFSI points, could the complete nutrient balance including all balance components be calculated. Therefore, transfer of the nutrient balance from the NFSI points to the NFI tracts was achieved in two steps: (1) transfer of the individual balance terms from the NFSI points to the NFI tracts, (2) calculating the nutrient balance at the NFI tracts from the transferred balance components.
For the stratified model regions (Figure 2A), different regionalization models were parameterized. The regions 6 and 7 were combined for the final model selection as both are characterized by glacial till and comparable maritime climate.
Additionally, global models for whole Germany were parametrized for comparison of the model performance with the stratified models. The R2 for the Ca, Mg and K balances were by 0.28, 0.29 and 0.18 lower in the global models than in the stratified ones. An overview on the indicators of model performance of the stratified models is given in Table 1. The model errors were highest for Ca and Mg in model regions with limestone bedrocks (region 1 and 2, Figure 2A) and amounted to a multiple of the mean balance level, whereas for K, model errors were comparatively small and quite uniform for all model regions with a CVRSME (standardized RMSE) of around 0.5. All regression analyses were performed with R environment for statistical computing and the following software packages: “OLS”, “randomFOREST”, “stats” and “dismo”. Landscape morphological indices were calculated with SAGA [54].

2.3. Treatment of Special Sites

On sites dominated by limestone and dolomite, the supply of Ca and Mg to forest soils and trees is usually unlimited. The high solubility of these carbonates causes large Ca and Mg fluxes from weathering and in seepage flux. In combination with equally high uncertainties, this discourages a sufficiently reliable interpretation of Ca and Mg balances for these sites. Therefore, the element balances for Ca and Mg were assumed to be even on limestone and dolomite. The occurrence of carbonate was predicted with a logistic classification model (recall accuracy >90%), which was calculated using the R packages “logistf”, “stats” and “dismo”.
The Ca and Mg balances are also influenced by liming, as both elements are contained in the applied dolomitic limestone. The dissolution of dolomites initially increases the input of both elements into the soil. As a result, higher leaching exports may occur temporarily, but also in the longer term [91,92]. Accordingly, liming effects should be considered in the balances of Ca and Mg. Information on past liming events is available for NFSI plots, although it is very heterogeneous with respect to timing, repetition, and amount of dolomite application in the different federal states of Germany. For the NFI tracts, reliable data on liming are missing for parts of the federal territory or are distributed very heterogeneously in some states. However, evaluations within the framework of the regionalization of input and output fluxes showed that, where liming was documented, the liming effect in the regionalization models was only rarely significant with respect to the target variables leaching, weathering and soil stocks for Ca and Mg and had very low sensitivity on model results with changing signs [93]. This shows that liming obviously has ambiguous effects in our data and, at best, only very weak influence on the nutrient balances of Ca, Mg and K up to a depth of 90 cm. Accordingly, the liming effect was also not considered in the German-wide calculations of this study.

2.4. Uncertainty Estimations

Usually, calculating soil nutrient balances is associated with a high degree of uncertainty, mainly due sampling and measurement errors, errors of the predictive models for balance elements as well as regionalization errors and biases [44,94,95]. Although uncertainty estimation is an important part of model application, there are numerous challenges and pitfalls. A thorough, very detailed, statistical discussion of uncertainty may reduce acceptance by stakeholders [96] as would the concealment of prediction uncertainties [97]. Yanai et al. [98] demanded that element balances should be supplemented with uncertainty analyses as a standard tool, not least also to allow reliable statements about the significance of any presented results.
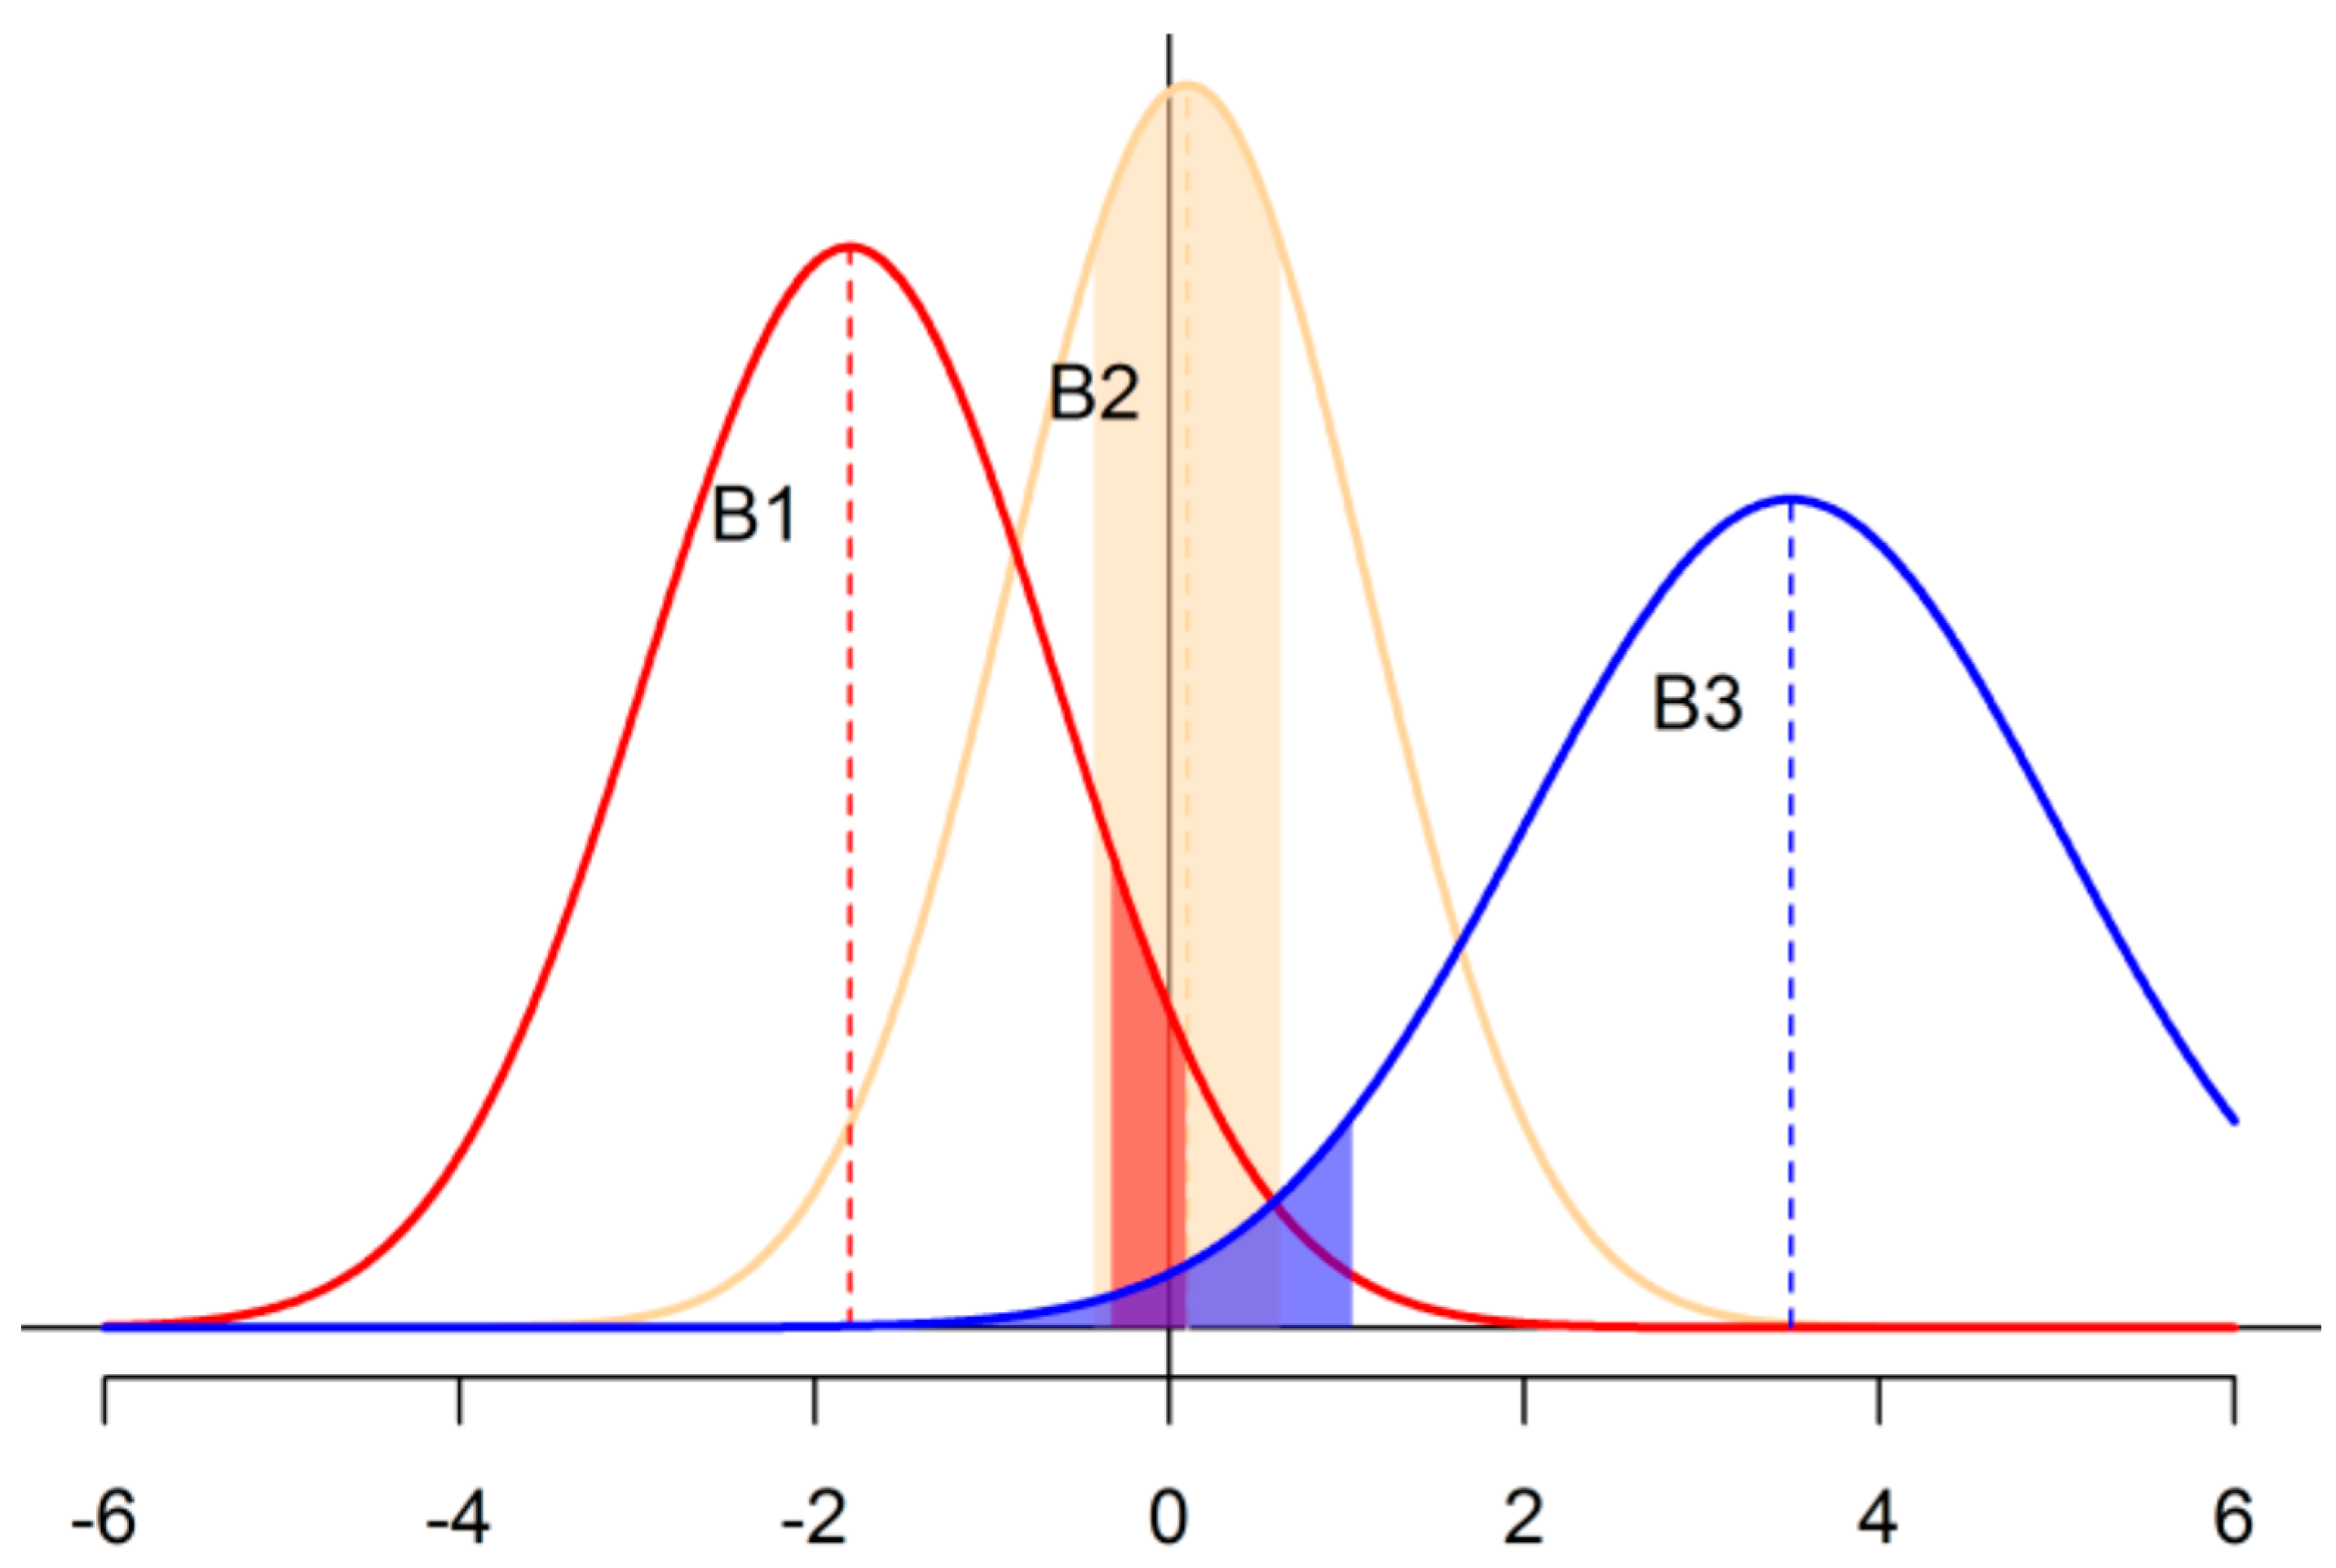
The Monte Carlo simulation method is a widely used technique for uncertainty analysis, which can be described as follows [99]: For a model Φ of arbitrary complexity, the calculation of the resulting variable Z is done according to:
Z i = Φ ( X i , Y i )
where X and Y are normally distributed random variables and the index i refers to samples from these normal distributions. X and Y are assumed to be independent of each other and covariance terms are not taken into account directly [63]. However, Yanai et al. [98] recommended to consider each covariance structure in their joint probability distributions when randomizing the parameters. In our application, the variation of the parameters was generated with the function rmvnorm() from the R software package “splus2R” [100] directly incorporating the covariance between the variables. A compilation of statistical parameters used for the different parts of the element budget calculations and to account for regionalization errors can be found in Appendix C.
We performed repeated calculations of the nutrient balances according to the respective balance equation. An error value randomly selected from its known (or assumed) probability distribution was repeatedly added to the model prediction for the individual balance elements, or the sub-equations for their calculation (e.g., leaching, harvest removal). After 10,000 iterations, the magnitude of the total error was derived from the realized predictions and the corresponding result statistics (mean, standard deviation, quantiles, etc.) were calculated. To assess the level of significance for the occurrence of negative or positive element balances, we analysed the resulting probability densities of the nutrient balances. The terms significant and weakly significant were defined with error probabilities of α ≤ 0.05 and 0.05 < α ≤ 0.1, respectively.

3. Results and Discussion

3.1. Nutrient Fluxes of Deposition, Weathering, Leaching and Harvest Removal

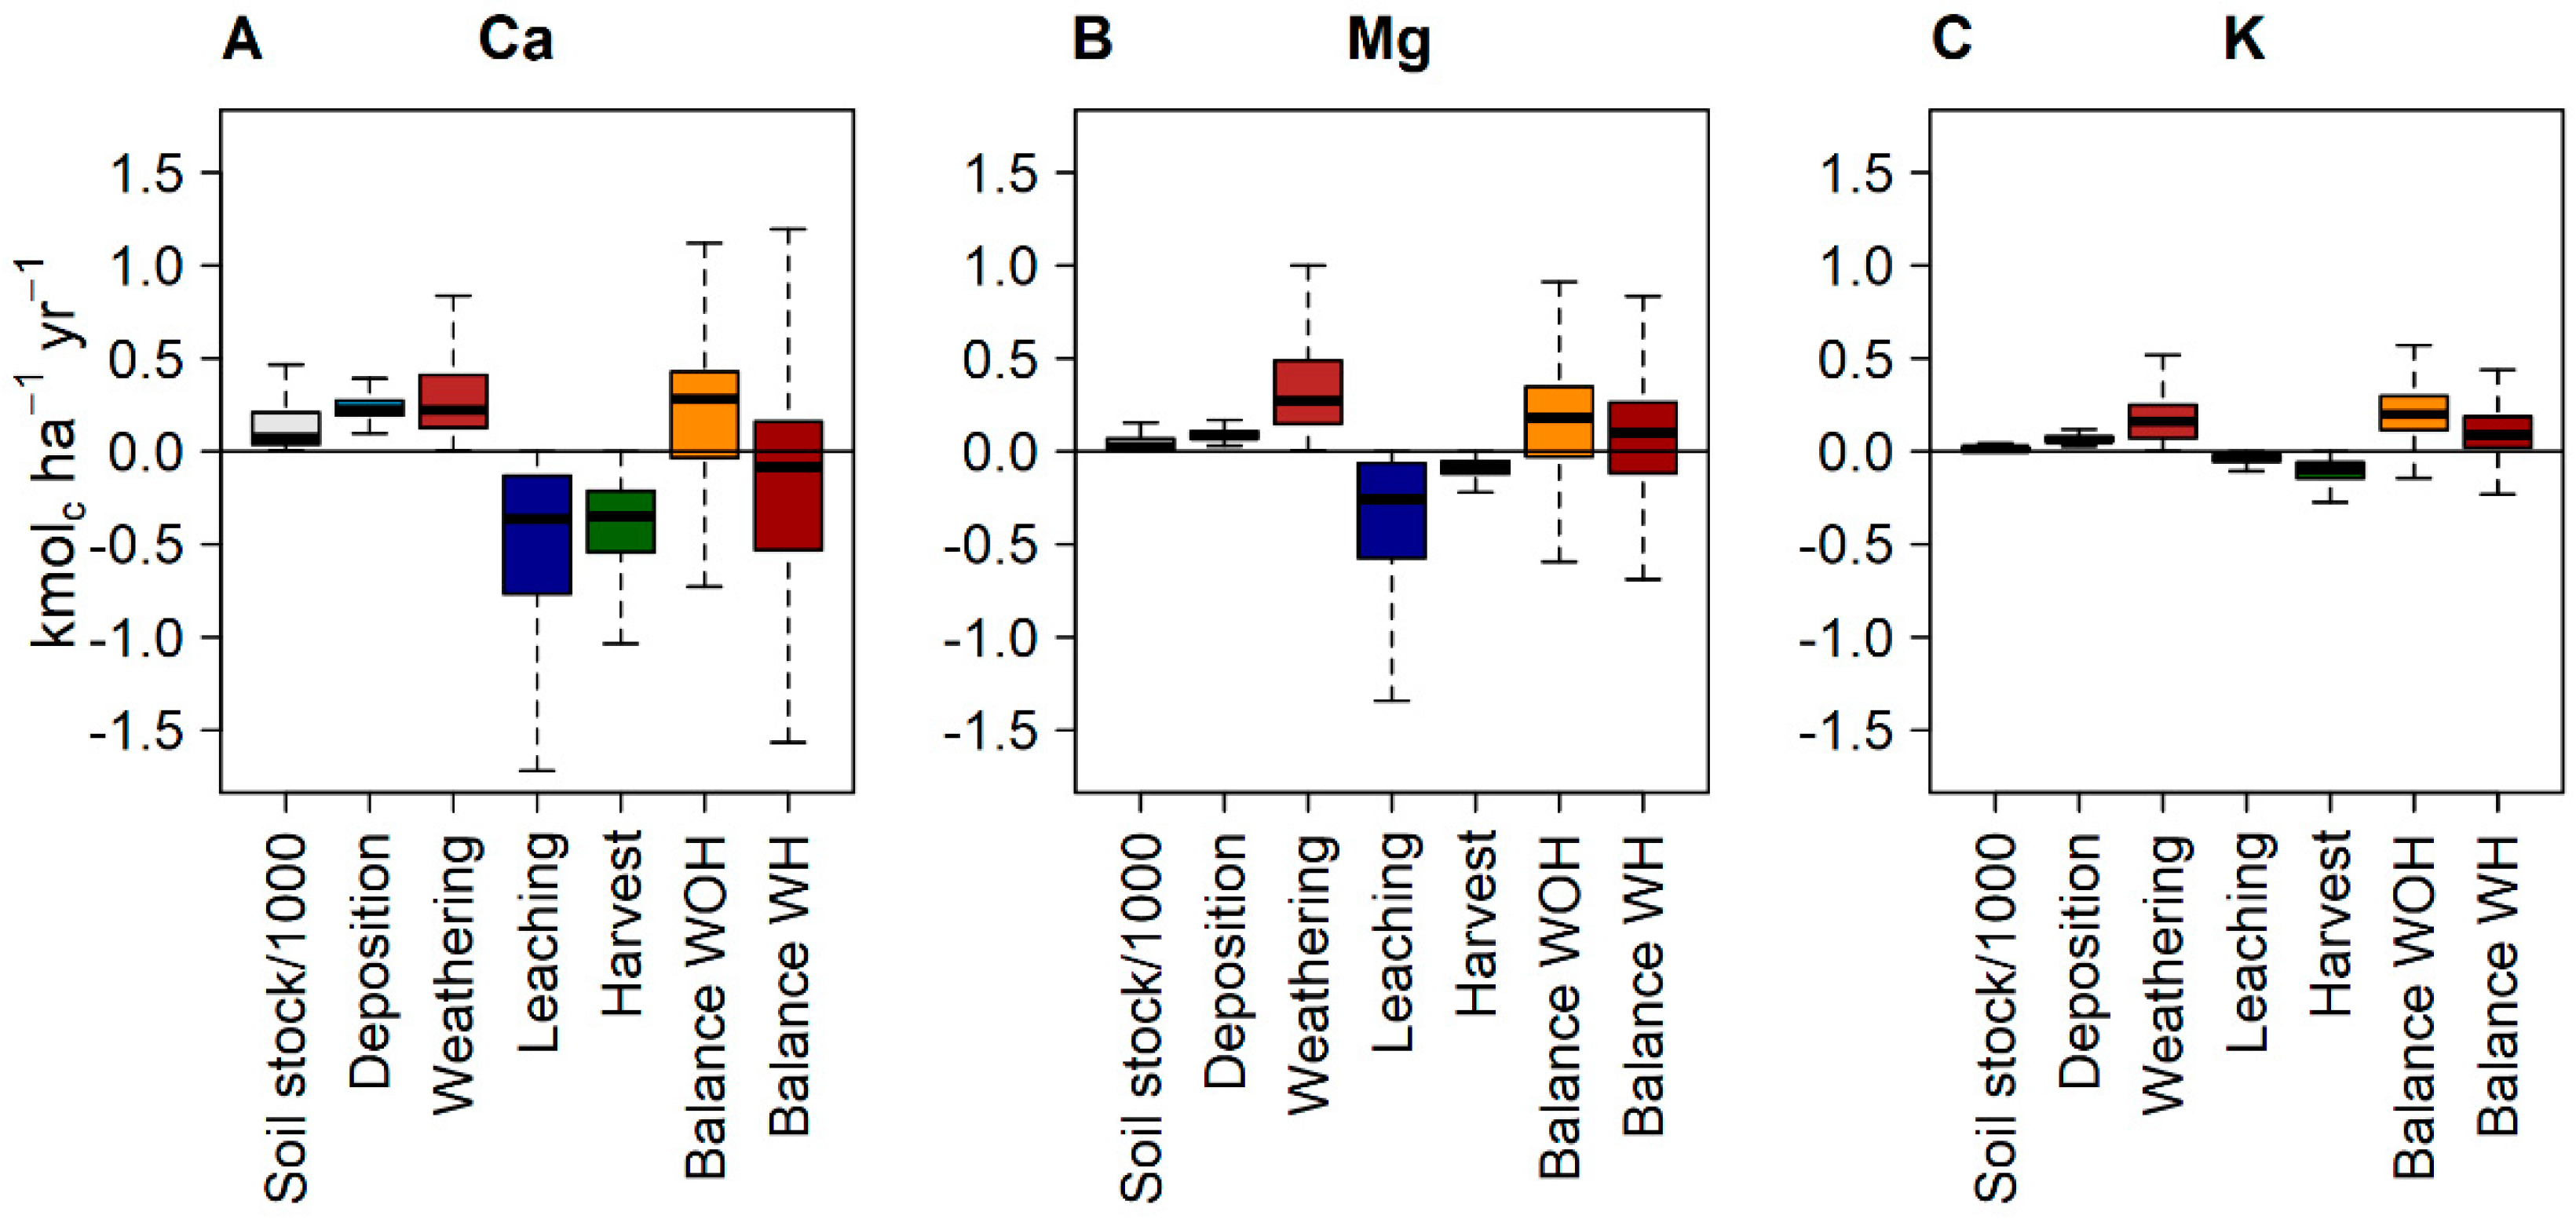
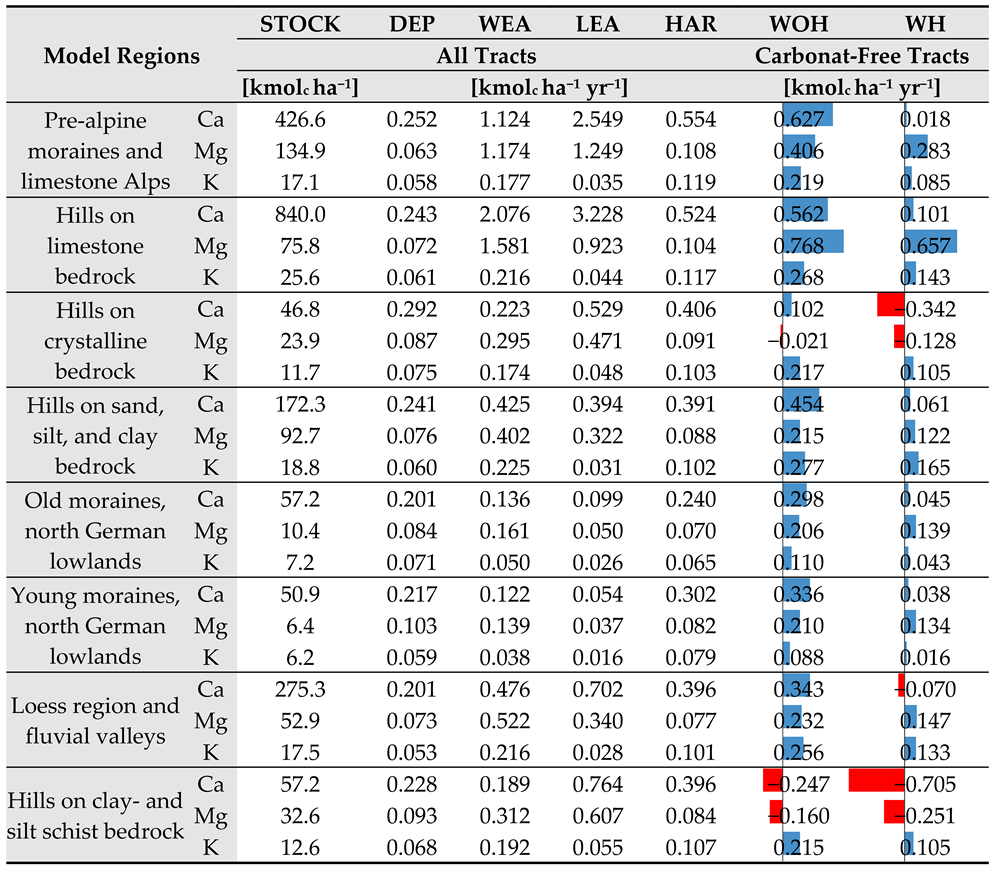
The influence of the various balance components on the total budget calculations was very element-specific (cf. Figure 3A–C). For Ca, a relatively even distribution among the balance components was observed. Loss by leaching and removal tended to be higher than gains from deposition and weathering, so that the overall balance is negative in many cases. Due to the high leaching losses, more than 25% of the NFI tracts had a negative Ca balance already when not considering the harvest removal. For Mg, harvest removal was less important, and the balance remained positive on average. In the case of K, leaching losses were very small and harvest removal was the dominating loss factor. At most of the NFI tracts, harvest export (scenario REAL) was compensated by weathering rate and negative balances were calculated for slightly less than 20% of the NFI tracts. The considered soil stocks (cf. Section 2.1.2) were generally of minor importance, especially for Mg and K. To give an idea of the magnitude and large-scale spatial differences of the balances and their input variables, the medians for different model regions (see Figure 2A) are compiled in Table 2.
The weathering rates of the base cations (Ca, Mg, K) in the stratified model regions (see Figure 2A and Table 2) were, in ascending order, as follows: young moraines, north German lowland: 0.3, old moraines, north German lowland: 0.35, hills on clay- and silt schist bedrocks: 0.7, hills on crystalline bedrocks: 0.7, hills on sand, silt, clay bedrocks: 1.1, loess regions, fluvial valleys: 1.2, pre-alpine moraines and limestone Alps: 2.5, hills on limestone bedrocks: 3.9 kmolc ha−1 yr−1. Calculations of the weathering rates, using an approximation from soil type and texture by Posch et al. [101], give weathering rates of 0.27–2.92 kmolc ha−1 yr−1 for the five main weathering rate classes (WRc) for non-calcareous soils in Germany, which agrees quite well with our results. Field weathering rates of base cations in Dutch sandy soils are reported to vary between 0.1 to 0.7 kmolc ha−1 [102,103,104] cited in van der Salm et al. [105] and 0.16 to 0.58 kmolc ha−1 yr−1 [106]. In the Netherlands and Germany, estimated weathering rates for loess ranged from 0.26–1.85 kmolc ha−1 yr−1 and 0.350–1.72 kmolc ha−1 yr−1, respectively, and in river-clay soils from 0.76–5.3 kmolc ha−1 yr−1 [105]. These orders of magnitude are also quite comparable with the data for our model region “loess regions, fluvial valleys”. De Vries et al. [7] classified the weathering rates for soil types from unconsolidated rocks in the Netherlands as follows: poor sand: 0.250, moderate poor sand: 0.385, rich sand: 0.520; loess: 0.600; clay: 1.300 kmolc ha−1 yr−1.
It should be noted that the rates quoted from the above studies also include Na. They can be related to our values by multiplying by a factor of 0.7 for poor sandy soils and 0.85 for rich soils [107]. However, it is well known that data on weathering can vary widely, and calculations are associated with a high degree of uncertainty [108,109,110,111,112]. Kolka et al. [94] and Wesselink et al. [113] determined uncertainties of 25%. Somewhat larger uncertainties were found by Jönsson et al. [63] and Dultz [114] with 40% and 75%, respectively. According to Hodson and Langan [115], most methods for determining weathering rates have an accuracy of ±50%. Much higher uncertainties of 100% and 250% were reported by Hodson et al. [62,110]. Orders of magnitude above 100% are also given by the works of Klaminder et al. [108] with 98–110% and Futter et al. [109] with 33–300% when comparing different methods for estimating weathering rates. The high variation of weathering rates in the literature can partially be attributed to differences in the methodologies applied, for example different integration levels (soil profile to catchment) or the consideration of gravel content (cf. [108,116,117]). Therefore, when comparing weathering rates determined by different methods, the methodological approach must always be considered.
The median Ca deposition in the stratified model regions ranges between 4 and 6 kg ha−1 yr−1. Recent results from the Netherlands show similar magnitudes [7]. Except for sites strongly influenced by sea salt deposits and sites with very high precipitation, most sites are characterized by Mg depositions of about 1 kg ha−1 yr−1. Median K deposition in the model regions varies between around 2 and 3 kg ha−1 yr−1 (Table 2) and is also quite similar to other studies [7]. The spatial distributions and regional patterns of the deposition input vary largely between the investigated elements (Figure A2). While Mg is strongly influenced by sea salt from the North Sea, this influence is weaker for K. Atmospheric deposits of K are more strongly influenced by local and regional sources [118], which can vary greatly from year to year [46]. In addition to the effect of precipitation and wind speed in the low mountain ranges, the importance of agriculture as a source of K emission is also evident here. Dämmgen et al. [118] noted that Na and Mg depositions now reached a magnitude that can be described as largely unaffected by anthropogenic factors. In the case of Ca, it is mainly the mountainous areas that show maximum inputs.
Compared to deposition, the leaching rates of Ca and Mg differ more strongly between the model regions (Table 2). In regions with higher fractions of carbonate soils the median leaching losses exceed 50 kg ha−1 yr−1 (Ca) and 10 kg ha−1 yr−1 (Mg). For all other upland and hilly areas, the leaching amounts to 8–15 kg ha−1 yr−1 (Ca) and 4–7 kg ha−1 yr−1 (Mg). In regions dominated by loess and fluvial valleys, the leaching losses amount to 14 and 4 kg ha−1 yr−1, respectively. In the poor and moderately poor sandy soils of the regions with “old and young moraine deposits”, the leaching losses are much lower and amount to 1.1–2.0 kg ha−1 yr−1 for Ca and 0.4–0.6 kg ha−1 yr−1 for Mg. In contrast, K leaching losses are much more homogeneous and differ only slightly between the individual model regions (between 1 and 2 kg ha−1 yr−1). A similar magnitude for K with a leaching rate of <2 kg ha−1 yr−1 was also determined in the study of de Vries et al. [7]. Due to the high variability of German soils, a direct comparison of leaching losses with the study of de Vries et al. [7] is difficult, as a larger part of the Dutch forests is located on well-drained sandy soils with sometimes very different nutrient availability. The regions “old moraines” and “loess and fluvial valley” might be the most comparable to the Dutch conditions. The leaching rate for Ca and Mg in the Dutch forests was slightly higher than in our “old moraines” region, at about 4 and 1–4 kg ha−1 yr−1, respectively, but significantly lower than in the “loess and fluvial valley” region.
The calculated harvest export rates of the sum of Ca, Mg and K ranged from 0.38 and 0.78 kmolc ha−1 yr−1 in the different model regions (Table 2). These values are at the upper end of those published in other studies [7,119,120,121,122,123]. It must be emphasized, however, that the current growth rates are higher due to increased N input by deposition [124] and that harvest intensity in many regions of Germany is above the level of many neighbouring countries [25].

3.2. Nutrient Balances for Different Harvest Intensities

The base cation content as well as biomass amount differ greatly between the wood, bark, and brushwood biomass compartments. This explains that nutrient export is much more influenced by the harvest intensity than the biomass export.
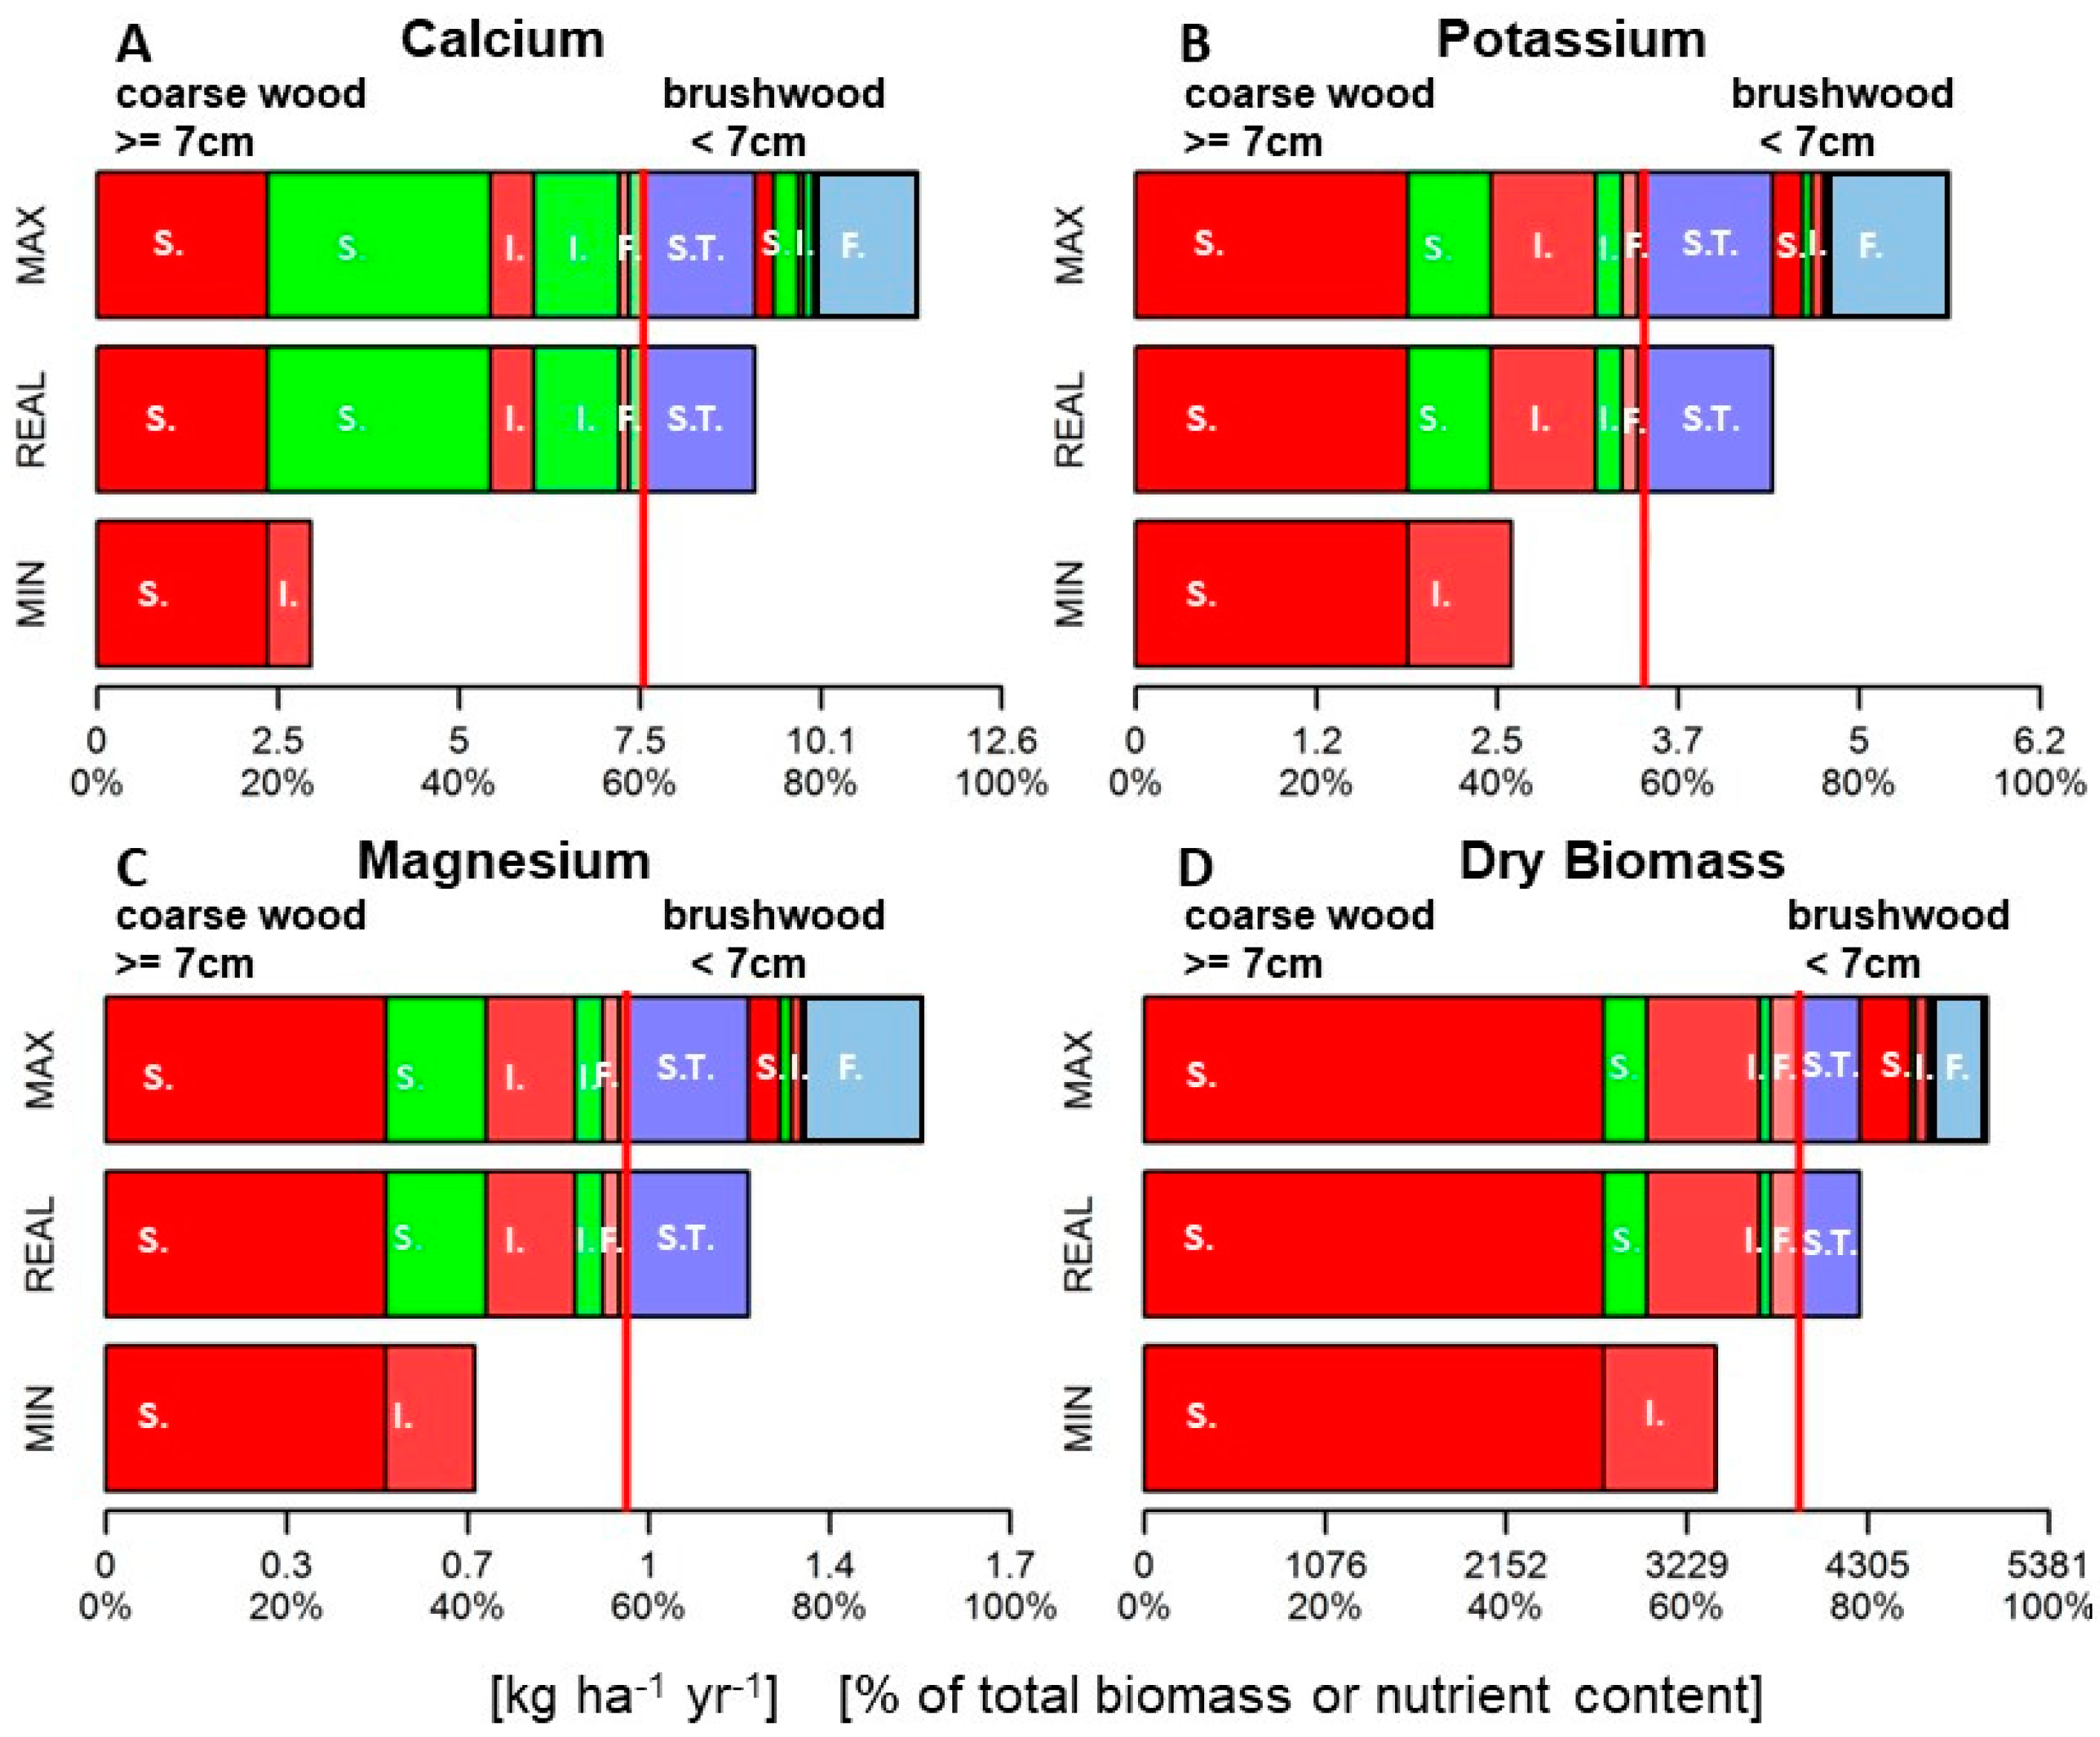
At the usual harvesting intensity (REAL), about 80% of the total aboveground biomass is removed from the stand, including 6.6% brushwood that accumulates in protective brushwood mats on the skid trails. About 20% of the biomass remains distributed within the stand area as harvest residues. The largest share of harvested biomass (including bark) is stem wood with 55.6%, followed by industrial wood with 13.7%, and the smallest share is fuel wood with 6.9%. The ratio between export with harvest and harvest residues is about 70:30% for the nutrient elements Ca, Mg and K (Figure 4A–C).
The “nutrient preservation potential” of the MIN scenario compared to REAL is mainly related to the assumption that debarking of stem wood and industrial wood is technically feasible during the harvesting process and that the bark remains distributed within the stand area. This assumption is an anticipation of recent developments in harvester technology [125]. In addition, the scenario MIN assumed no accumulation of brushwood on skid trails. When harvesting and timber logging is carried out with forestry machines, brush mats weighing 10–20 kg m−2 are required to protect the soil function on the skid trails [126]. Thus, brush accumulation on skid trails could be avoided either by increasing the use of motor-manual harvesting techniques and logging with cable cranes or by consecutive collecting, chipping, and re-distributing brush mats. Both alternatives are considered to be much more costly than conventional fully mechanized harvesting and logging.
If it would be technically possible to leave all bark and brushwood biomass well distributed in the stand area (scenario MIN), Ca export could be reduced by about 70% compared to the REAL scenario, mainly due to the high Ca content of the bark. Additionally, 43% less Mg and 45% less K are exported in the MIN scenario compared to REAL. Compared to the nutrient loss, the harvest volume of the marketable assortments (stem, industrial and fuel wood) is reduced much less, by about 9% compared to the REAL scenario. Scenario MAX increased the biomass harvest rate by 13% compared to scenario REAL, because wood compartments with diameters < 7 cm (as industrial or fuel wood) are used and commonly occurring harvest losses of 10% are avoided. The average harvest of fuel wood, amounting to only 3.1% in the REAL scenario, could be increased up to 9.7% in the MAX scenario. In addition, stem and industrial wood from recovered harvest losses account for up to 7% of total biomass and could be used in the MAX scenario (Figure 4D). Thus, the fuel wood potential could be extended in this scenario up to 18% of the total aboveground biomass. However, the export for all three nutrients would be about 30% higher in the MAX scenario than in the REAL scenario.
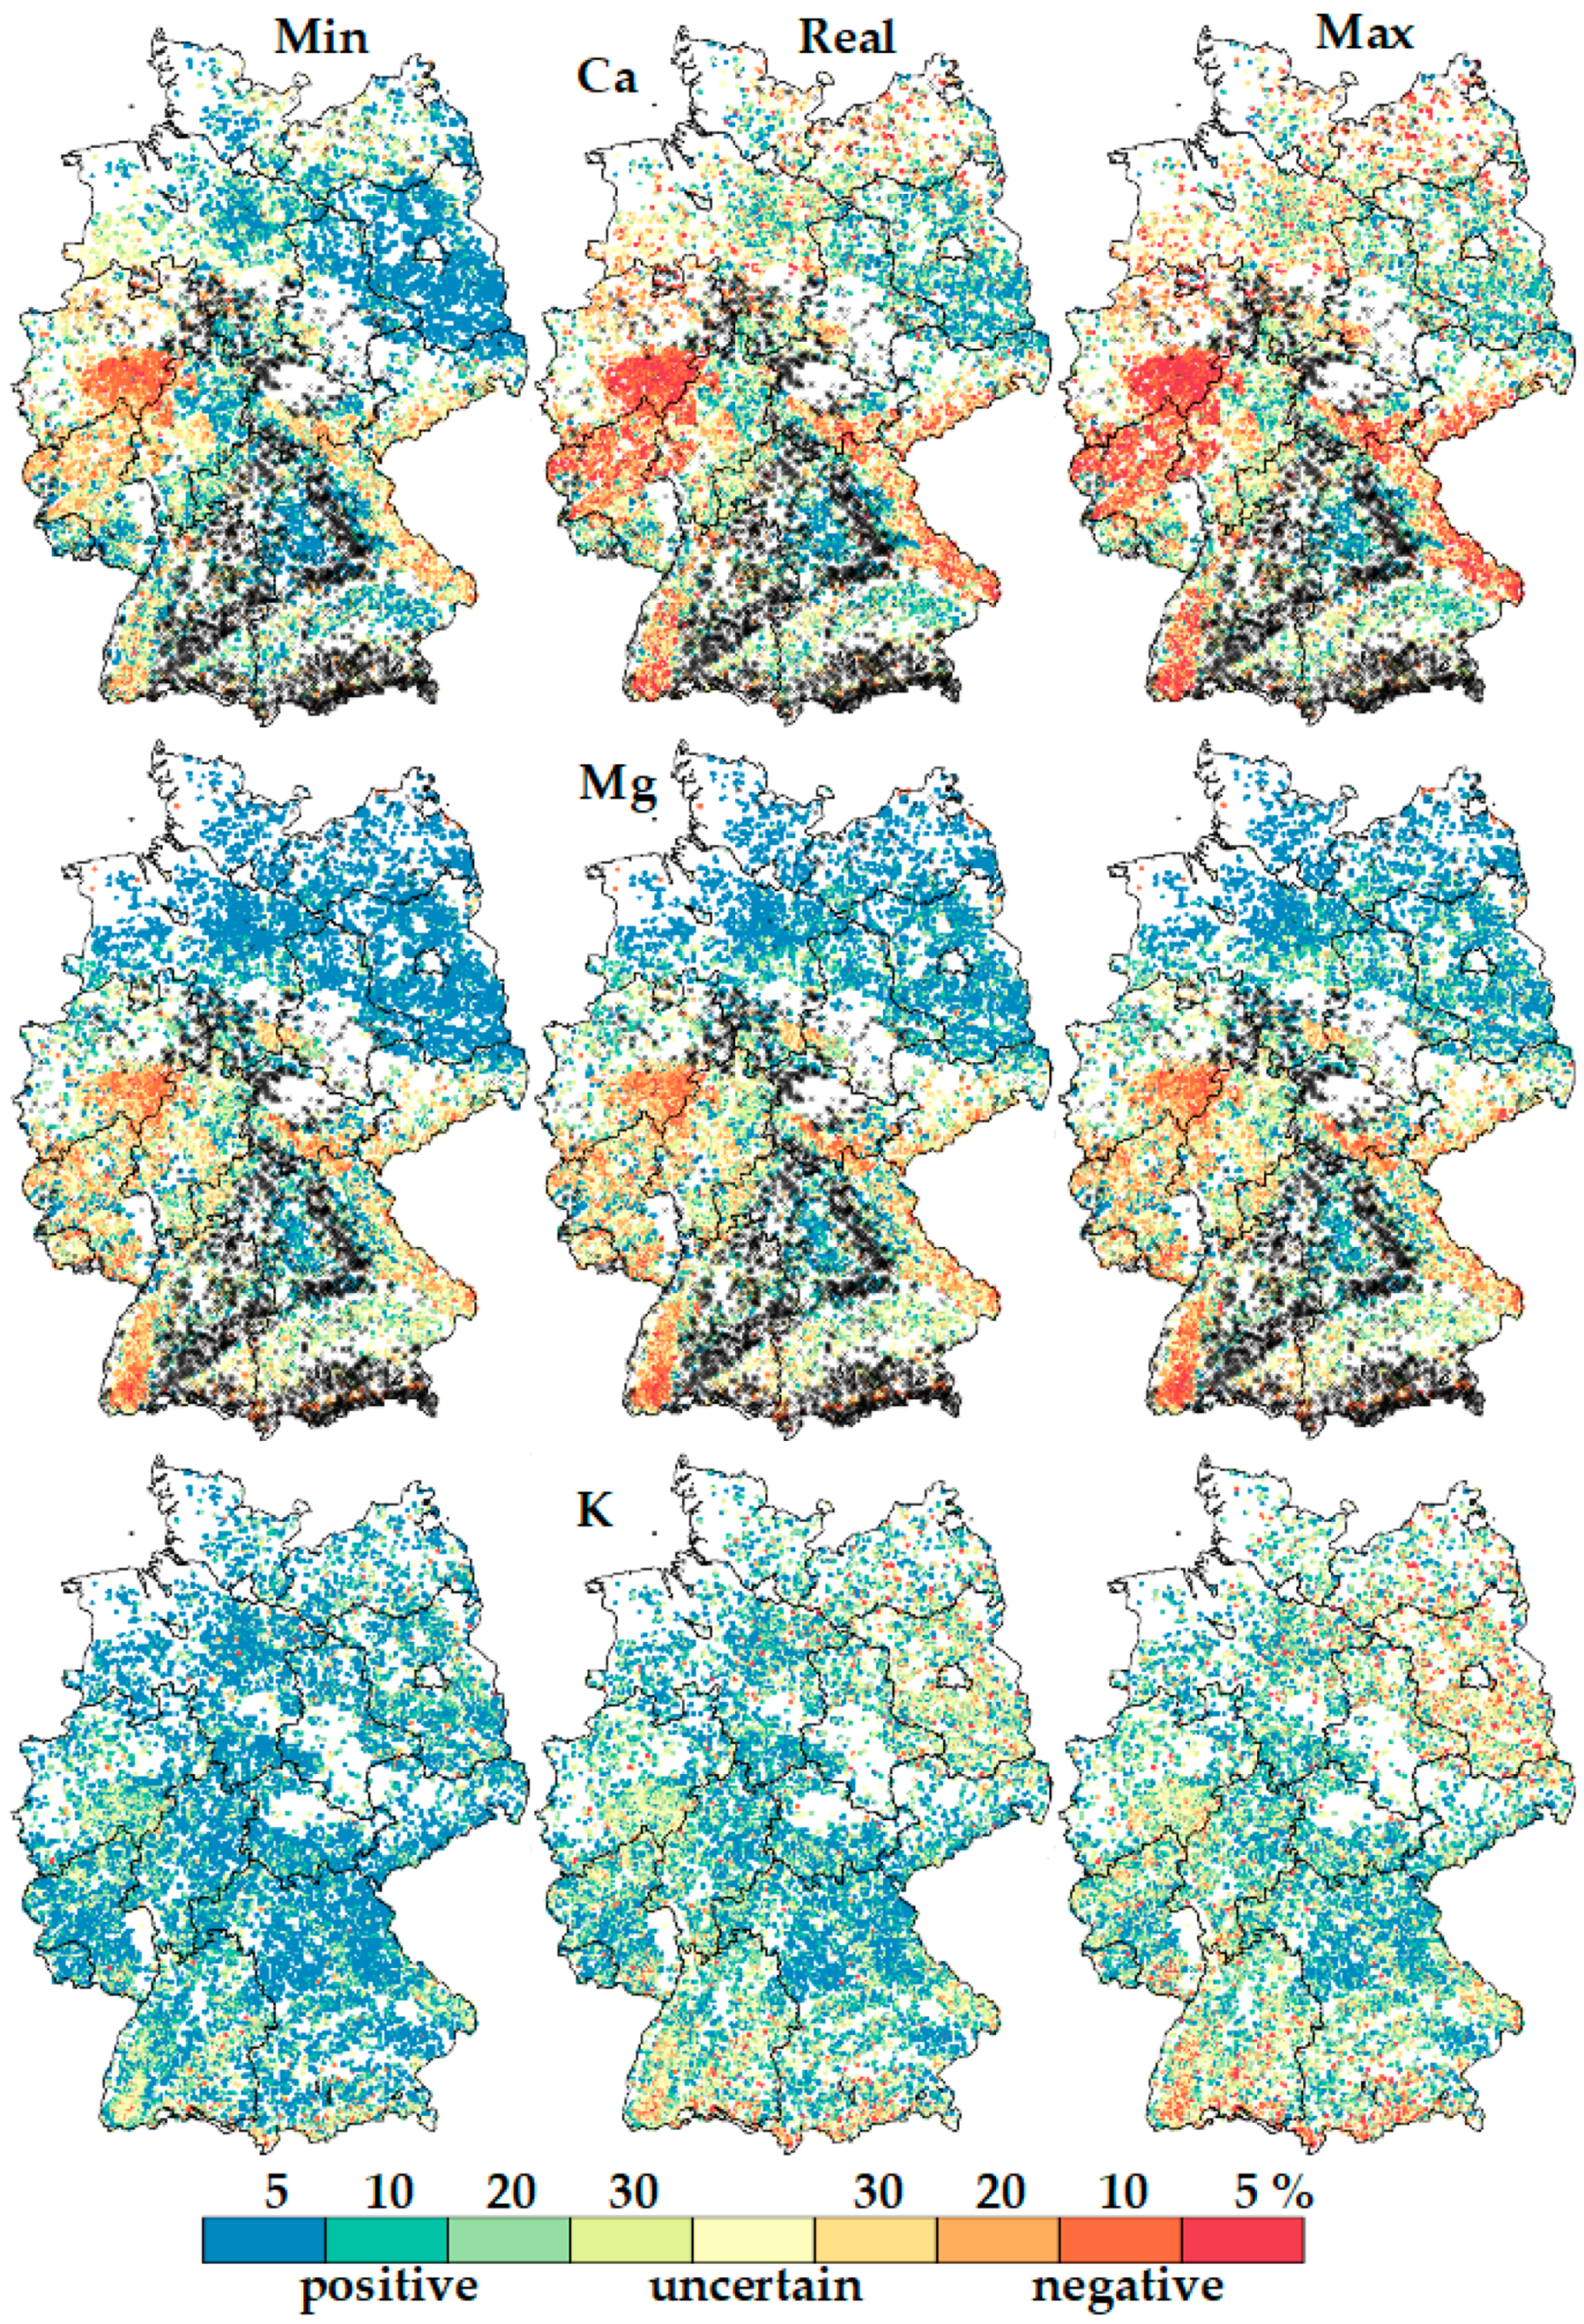
The regional distributions of Ca, Mg, and K balances can reveal hot spots of balance deficits or positive balances and show effects of increasing harvesting intensity (Figure 5). Figure 5 also shows the uncertainty level of the balance calculation at each NFI tract (cf. Section 3.3). Striking regional patterns are found for balance deficits of Ca and Mg, which are most significant in the low mountain ranges with crystalline bedrock and in hill regions with clayey and/or silty shale. The variation caused by harvest intensity is of minor importance for Ca and Mg. The causes are base-poor bedrocks [127] combined with high seepage fluxes [67] and high acid deposition rates [46,128]. Particularly noteworthy here is the hilly ‘Sauerland’ region, which is characterized by very high conventional harvest intensities [25] and high atmospheric inputs of acidifying components (sulphur and nitrogen) in the past [45,46]. Akselsson et al. [58] also referred to high historical sulphur deposition and simultaneously high site productivity for their high risk classes. The northern lowlands are dominated by clearly positive Mg balances, and Ca balances also tend to be positive. The pine forests that predominate in this region are generally characterized by low uptake rates of base cations. For example the study of Akselsson et al. [20] indicated that uptake is clearly higher in spruce than in pine. However, the difference is mostly both a species and a site effect [36]. This is compounded by the close proximity of this region to the North Sea and the high deposition rates of base cations by sea spray (see Figure A2).
The K balances show much less pronounced regional differences than Ca and Mg. They are largely positive for the MIN scenario and not significantly different from zero for the REAL scenario. The higher export of biomass under the MAX scenario results in an increase in significant negative K balances for 24.8% of NFI tracts compared to the REAL scenario (18.6%). The K balances tend to be negative in the MAX scenario predominantly in the Alps, the Black Forest, the Swabian Alb, and the sandy sites of the northern lowlands. This is consistent with the results of other studies [7,88,129] and indicates that insufficient K supply may occur on shallow dolomite and limestone soils and on soils with high water permeability (e.g., poor sandy soils).

3.3. Uncertainties in the Calculated Balances and Methodological Limitations

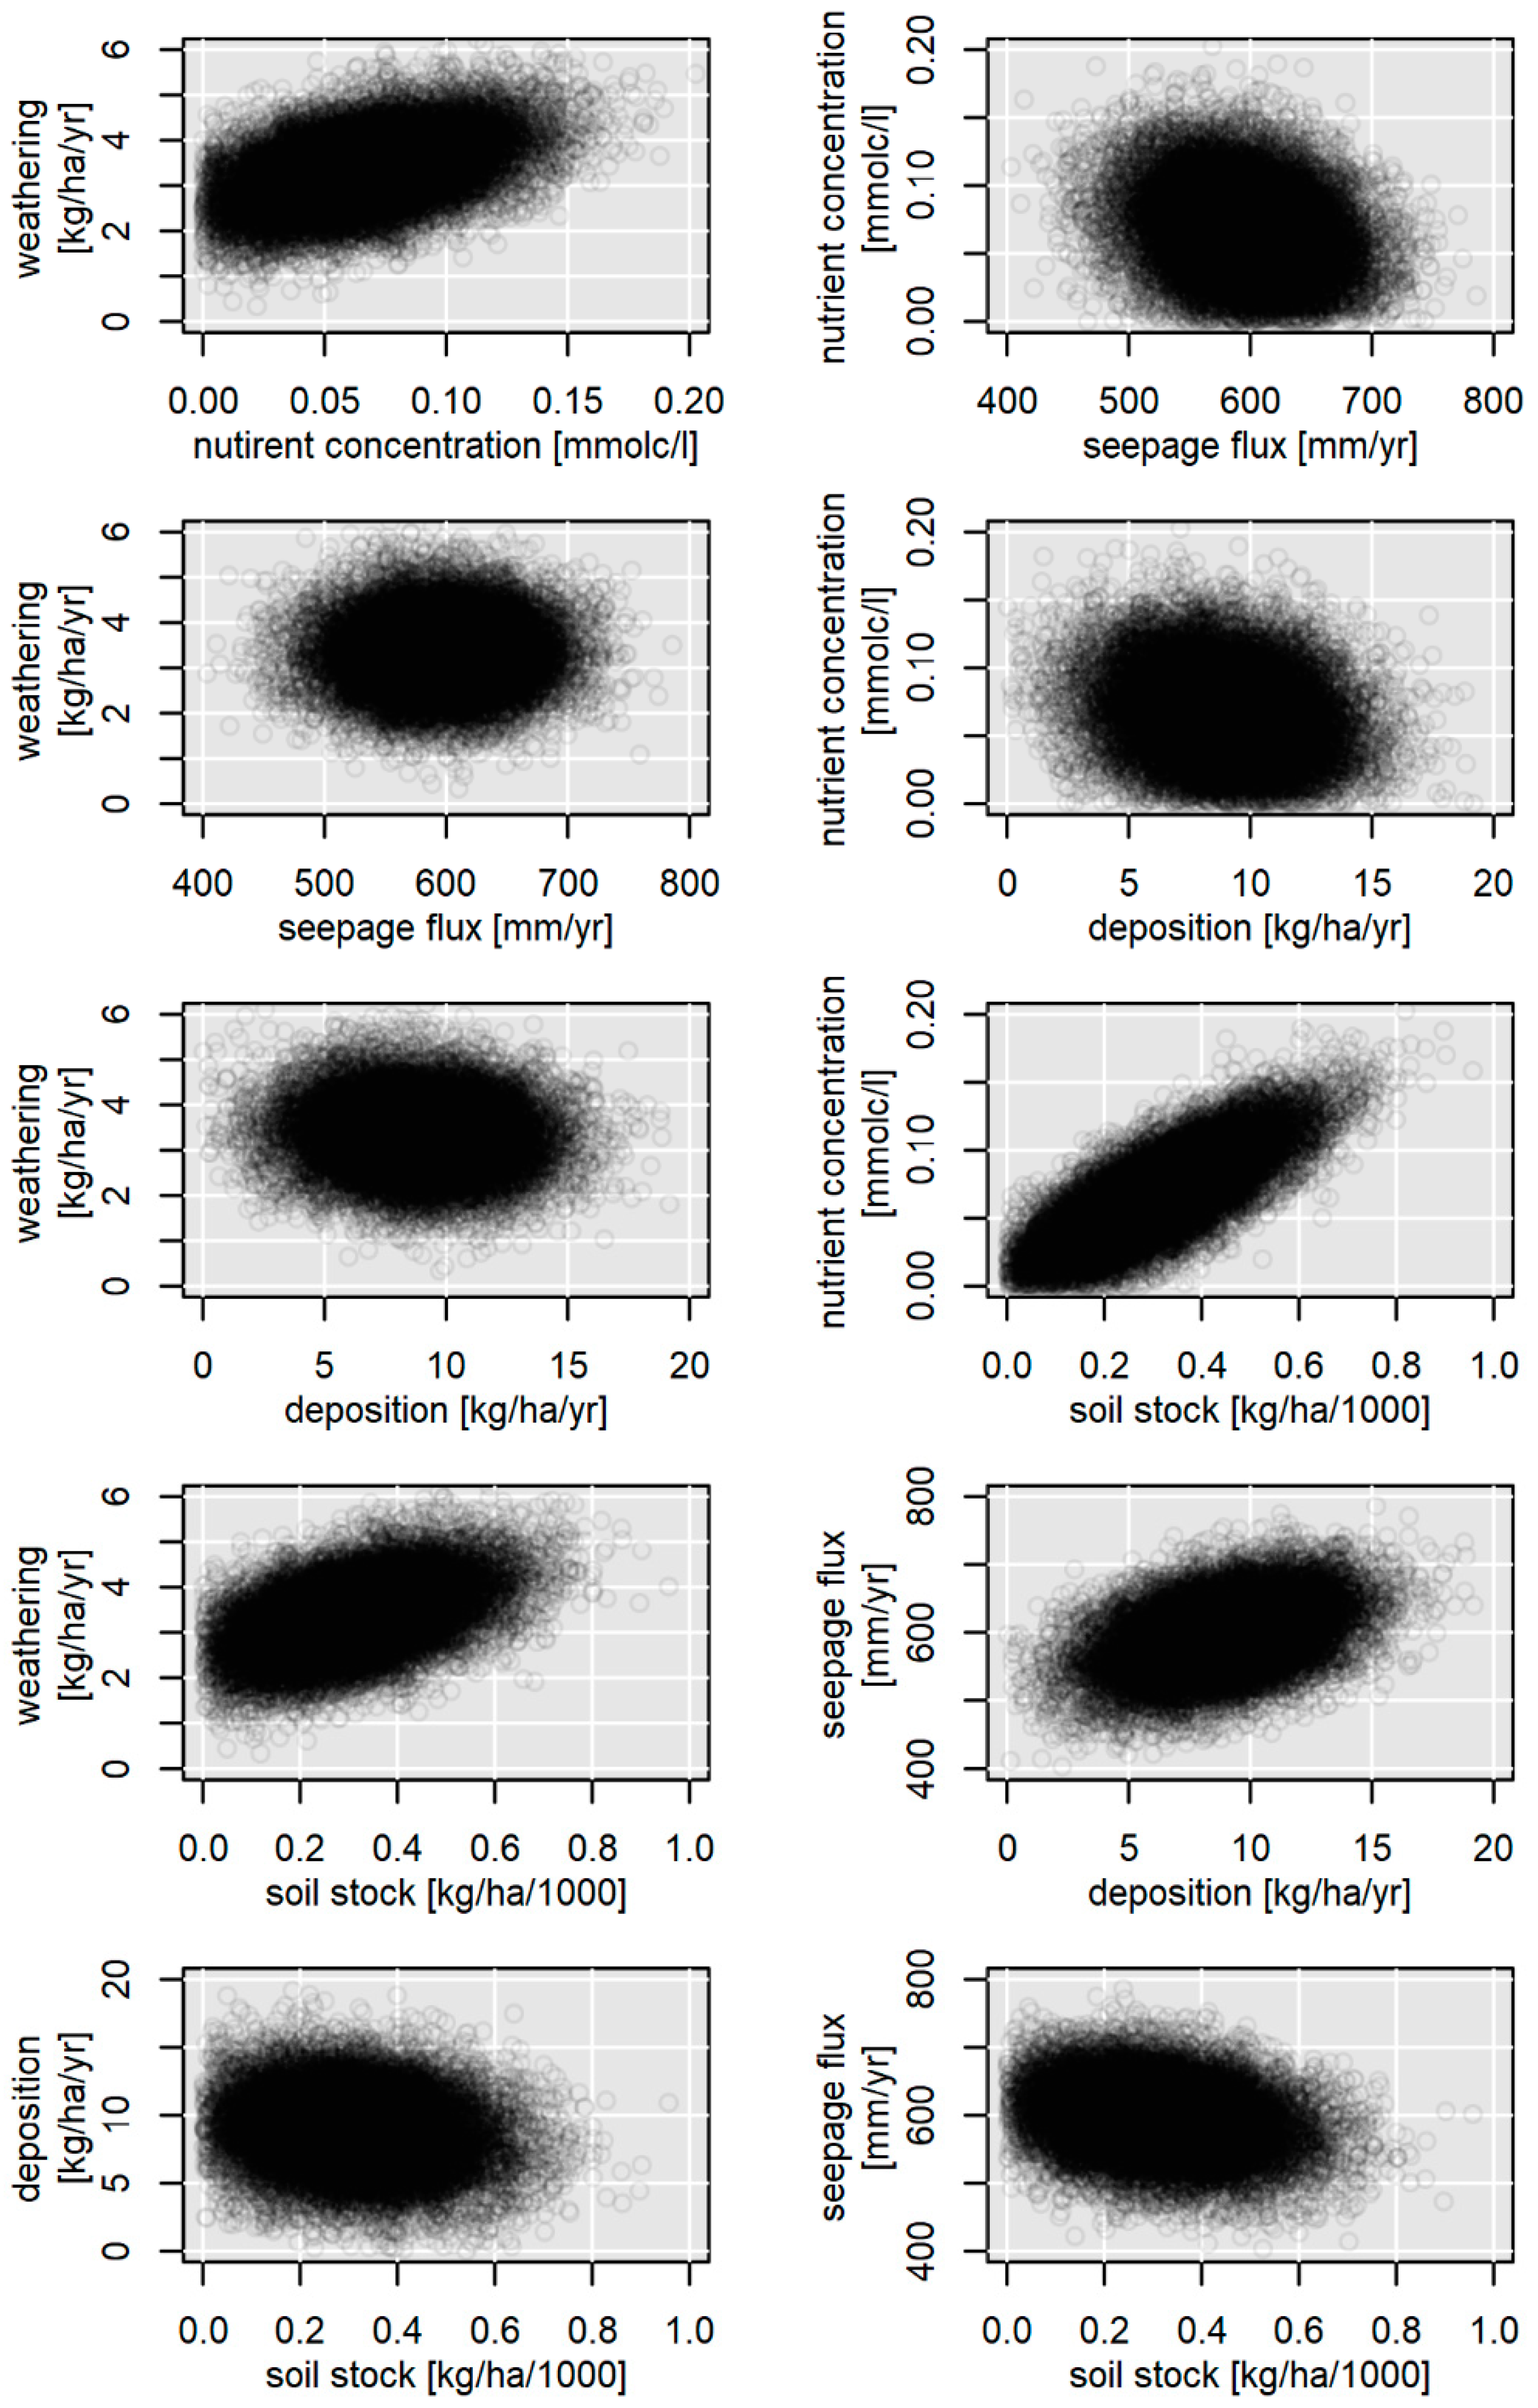
When using model results to derive silvicultural management strategies, there is a great risk that policy or forest decision makers may view model results as “absolute” [130]. Therefore, it is important to also assess the uncertainties of modelling and communicate these to users [96,131]. On such a basis, improved decisions can be made, and the limits of model application can be more clearly demonstrated. There are numerous approaches to represent model uncertainties [99,132,133]. In our study, the Monte Carlo method was used because it is very easy to implement and generally applicable to various modelling approaches. The method has been applied to numerous forestry issues and a wide range of topics such as soil acidification [134], critical loads [135], silicate weathering [63], or soil organic carbon stocks [136]. The main disadvantages of the Monte Carlo method [99] are that the results are not available in analytical form and the error can only be determined from a large number of simulations (10,000 in our case) using appropriate statistical settings. Moreover, the multidimensional distributions for correlated variables are often unknown and/or difficult to derive. The latter was considered in the present study by deriving the covariance between the different parts of the nutrient balance on the NFSI plots. However, it should be noted that the derived correlations are affected by large-scale site differences between inventory points. Accordingly, e.g., acidity and regularity of chemical characteristics at the respective soil plots can only be represented to a limited extent. This is impressively illustrated by the relationship between the weathering rate and the element concentrations in the seepage flux/soil solution (see Figure A4). These and the other relationships shown in Figure A4 must be interpreted in such a way that more Ca, Mg, and K is available for leaching at sites with higher soil stocks of base cations and correspondingly higher weathering rates. In addition, the individual members of the nutrient balance were determined independently of each other and, therefore, the simulations could theoretically be carried out without taking the covariance into account. However, the results of the correlation analyses show that the elements of the nutrient balance are not statistically independent random variables and, accordingly, covariance should be considered. Therefore, the models are independent, but the data are not. Accordingly, the presented approach is a compromise that allows a first approximation to the real conditions and uncertainties. Further uncertainties result from the partly incomplete and inhomogeneous data basis for the NFSI points. Particularly problematic is that very important parameters like sulphate ( SO 4 2 + ), nitrate (NO3) and chloride (Cl) concentrations from 2:1 extracts are not available in some federal states of Germany and where the derived nutrient balances are therefore connected with larger uncertainties (e.g., Brandenburg).
The chosen balancing approach is very vulnerable to large uncertainties in the individual components of the nutrient balance. The simple model of nutrient balancing has so far ignored important interactions between the individual balance components. Such feedback effects particularly influence the already uncertain leaching losses. While the interactions between the cations held on the exchange sites in soils and the concentration of cation in seepage flux are considered in the present approach, the influence of different harvesting intensities on exchanger composition and saturation is not. For example, studies by Zetterberg et al. [137] found reduced exchangeable Ca stocks in the mineral soil and consequently, 40% lower Ca concentrations in seepage water 27–30 years after WTH compared to conventional harvesting. Paré and Thiffault [39] also discussed the large uncertainties (estimation of element fluxes, lack of feedback effects) in applying the nutrient balance approach as indicator for critical biomass harvesting. Löfgren et al. [138] have criticized the nutrient balance approach for being too uncertain for developing forest ecosystem management strategies and because this approach does not account for all relevant processes. It becomes apparent that the “Simple Mass Balance” approach does not consider key factors of the biogeochemical nutrient cycle and dynamics in forest management, such as changes in humus stocks. Accordingly, nutrient balances are likely to provide a more realistic assessment of the actual situation in short rotation forestry and agricultural land use, as nutrient imports and exports as well as nutrient cycling are easier to assess, with the high proportion of artificial nutrient additions—especially on agricultural land—meaning that interrelated factors internal to the system have a much lower influence on the nutrient balance [39]. The mid- to long-term process dynamics in forest soils would suggest to implement ecosystem process models based on ecosystem models like, e.g., ForSAFE [139], that are however extremely difficult and unsure to parameterize under the influence of fast changing environmental conditions. Therefore, it was decided in this study to confine the balance calculation to the time span of 10 years between two NFI campaigns. Further environmental change can be taken into account by re-calculating the nutrient balances on the basis of data from each new NFI campaign, using the algorithms developed in this study.

3.4. Effective Options for Nutrient Management

The balances of the nutrients Ca, Mg and K are influenced by different factors and boundary conditions. Projected changes in soil temperature largely influence the weathering rates of base cations [55]. On the other hand, increasing water limitations may restrict the positive effect of higher temperatures on weathering rates in forest soils as the water content could have a great influence on the weathering rate [62]. Temperature driven increased mineralization rates could lead to higher nitrogen leaching and thus, also to a higher leaching of cations [140]. At present, however, actually the main drivers of base cation leaching are the substantial nitrogen deposition, nitrification processes, and the remobilization of previously retained sulphur in the forest soils [141]. Knust et al. [36] also found for pine and spruce stands in Northeast Germany that Ca and Mg balances became negative due to high leaching rates caused by historically very high sulphur inputs, even with stem-only harvesting. These factors lead to unnaturally high leaching losses of Ca, Mg and K. On the other hand, current forest management strategies can increase or mitigate balance deficits of Ca, Mg and K (Figure 1).
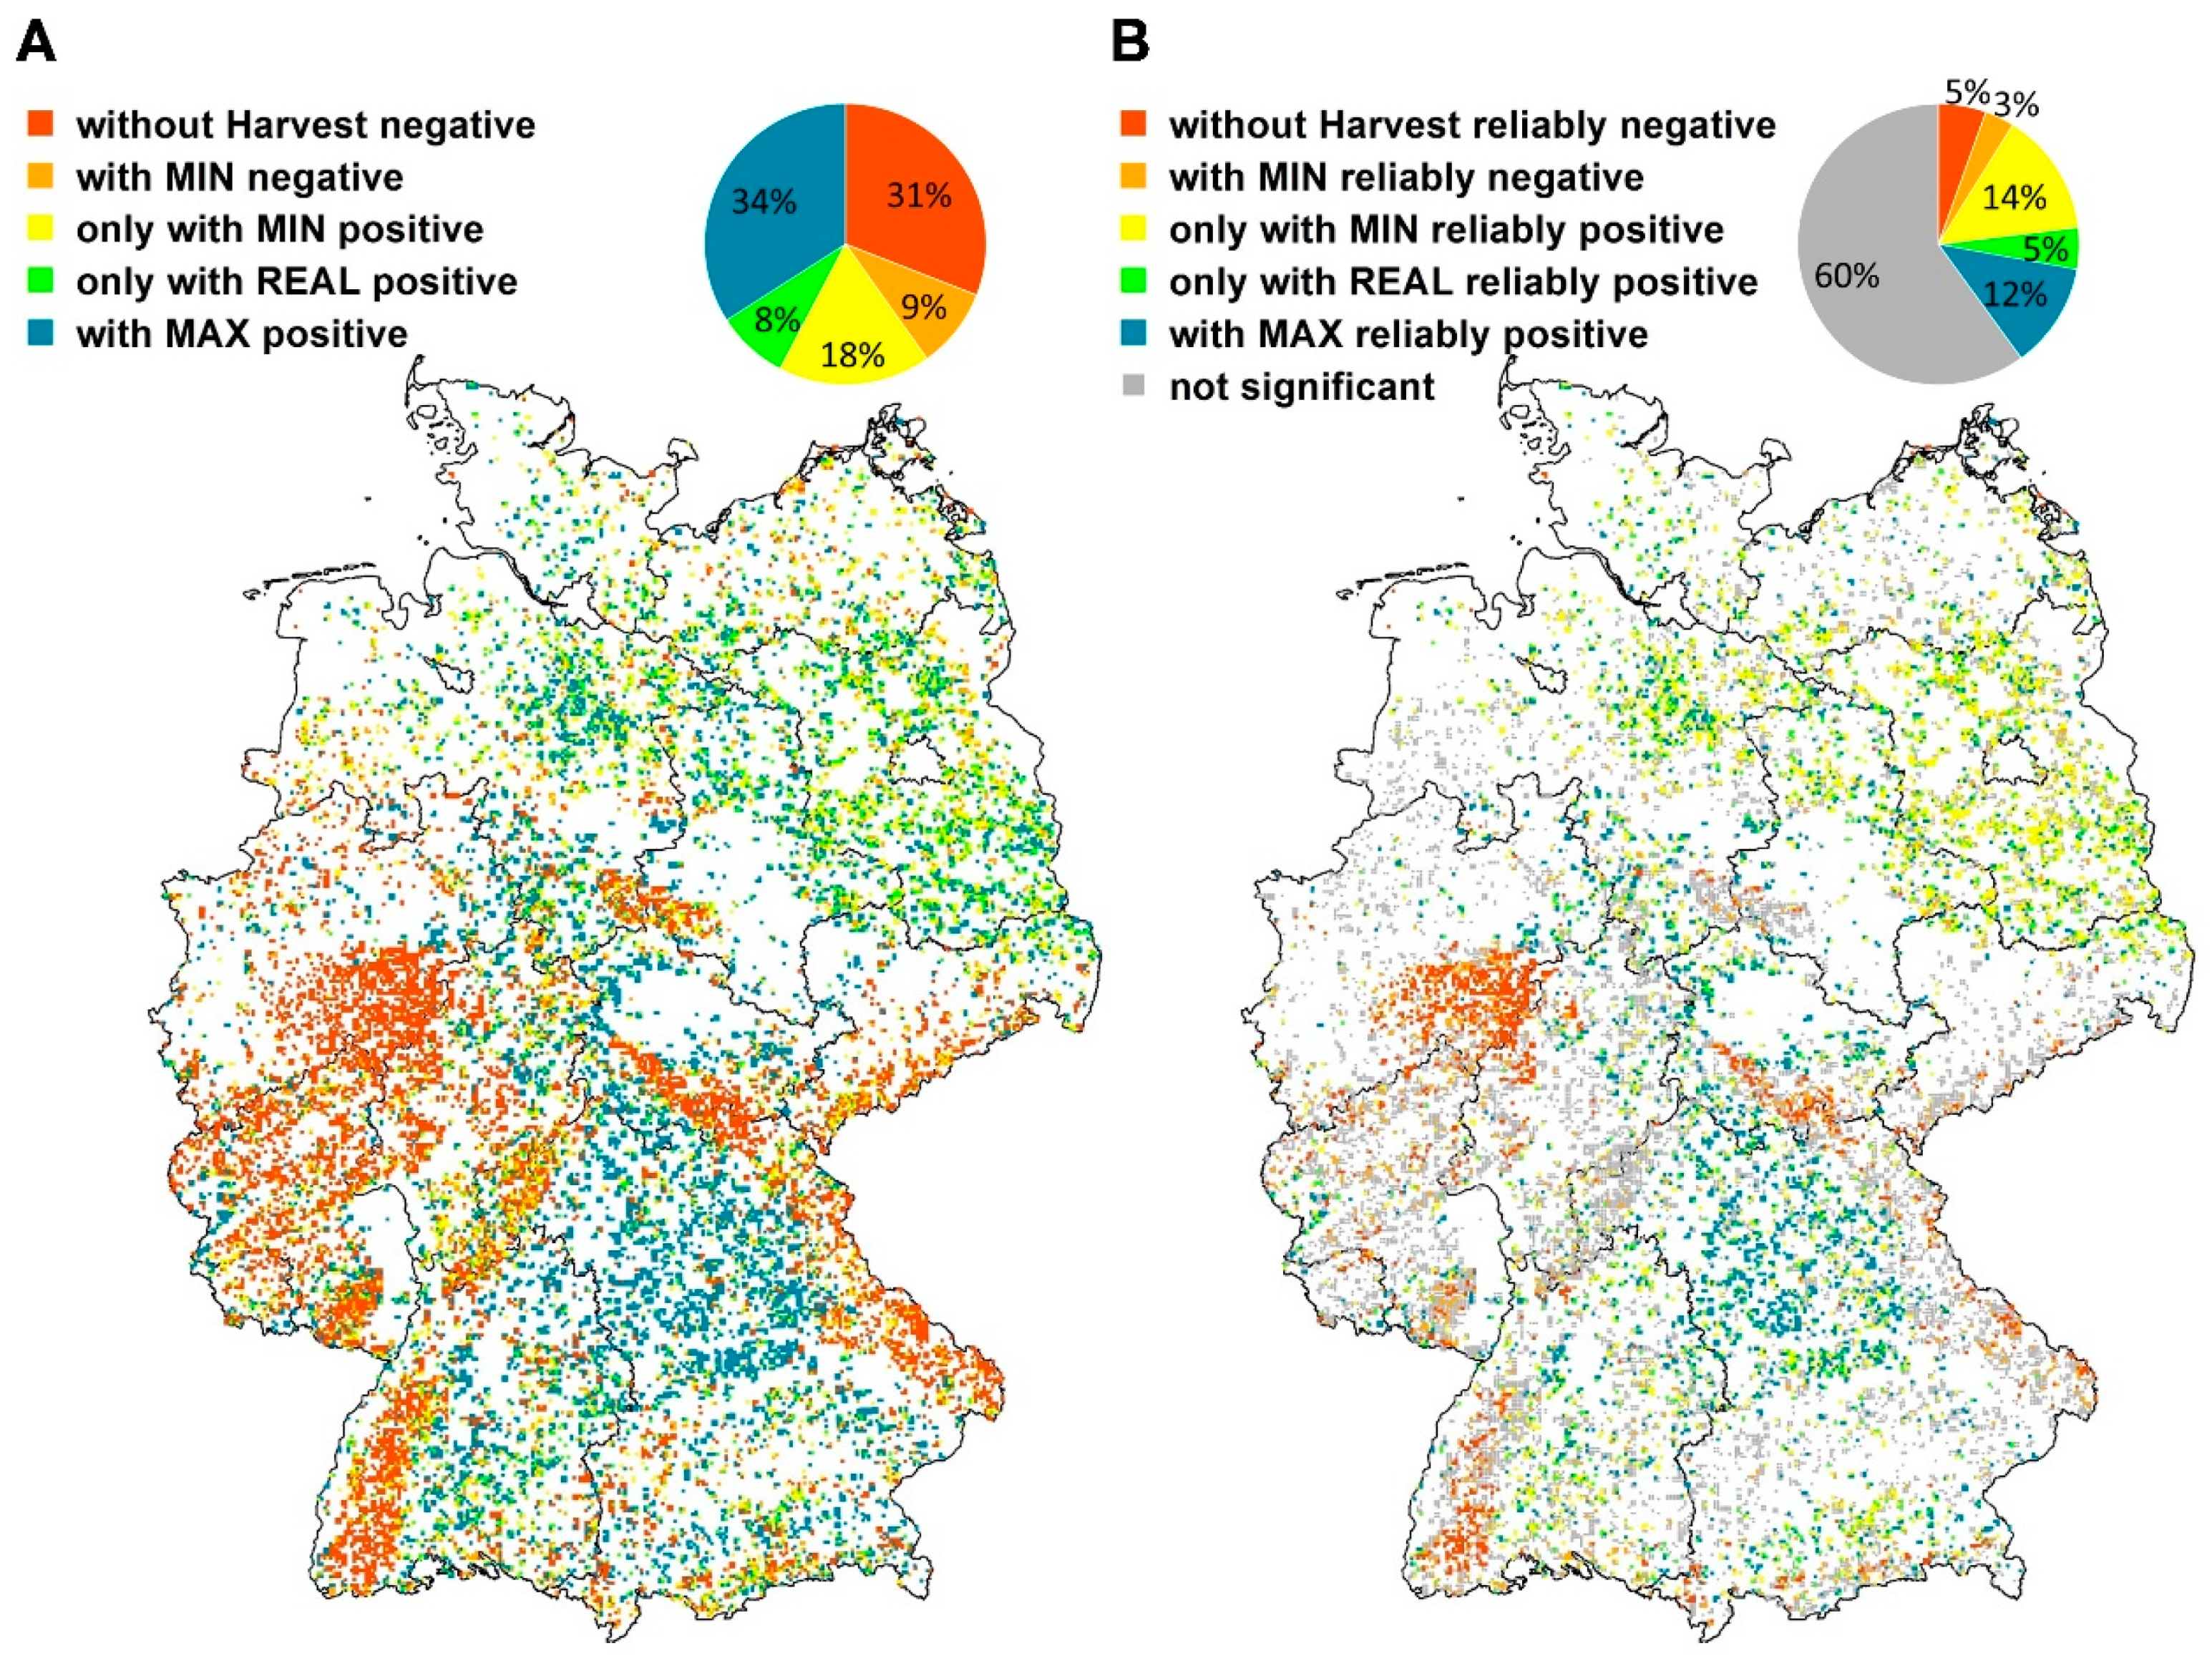
Nutrient export with the harvested biomass can be regulated by forest management, either by adapting the harvest intensity to the vulnerability of the respective forest sites or by technically replacing the exported nutrients by soil protecting liming. Reducing harvesting intensity increases the amount of harvest residuals, which ideally should remain well distributed on the stand area and release nutrients to the soil nutrient pool during mineralization. Through soil protecting liming fine ground dolomite powder or a dolomite-wood ash mixture is applied to the soil surface, and Ca, Mg and K are released within 3–6 years, as the applied materials dissolve slowly [142,143]. Dolomite-wood ash mixture was developed as a new, standardized product for soil protecting liming and has been used in practical forest liming campaigns in the German federal state Baden-Wuerttemberg since 2008 [144]. The wood ash used for this purpose is subjected to strict quality control to ensure that no harmful substances are distributed with it [145]. Thus, both options, adjusting harvest intensity and compensating nutrient deficits through soil protecting liming, allow for ecosystem-compliant replacement of nutrient deficits. In the following, the option of adjusting harvest intensity is derived from the German-wide element balances, incorporating the three elements Ca, Mg, K via Liebig’s Law of the Minimum at all approximately 23,000 NFI tracts included in this study (Figure 6).
Both maps in Figure 6 represent the same strategy approaches for active nutrient management through regional adjustment of harvest intensity by implementing only those harvesting scenarios that are supported by positive or balanced nutrient balances. If one of the three nutrient balances (Ca, Mg or K) becomes negative, the next more resource-preserving scenario is selected. However, at 31% of the NFI tracts (or at 5% if only the tracts with significantly negative nutrient balances are considered) nutrient balances are negative without any harvest export and therefore, cannot be closed even if harvesting was to completely abandoned. In addition, nutrient balances at 9% of NFI tracts are not large enough to support the lowest harvest intensity (MIN)—and 3% if only significant balances are considered. Satisfactory nutrient management by adjusting harvest intensity to the MIN scenario would be possible at 18% of NFI tracts or at 14% if only significant balances are considered. Conventional use (REAL) can be sustainably realized on 8% (significant on 5%) of the NFI tracts. Including the non-significant balances, the MAX scenario would be possible at 34% of the NFI tracts. If only the significant ones are considered, the MAX scenario is possible at 12% of the sites.
An alternative to reducing the harvest intensity would be to actively manage nutrients by recycling those amounts of nutrients that are required for closing the nutrient balances. The data basis for this approach is the same as for the harvest intensity adjustment. This approach has the advantage of also providing a realistic solution for sites where nutrient balances are negative without any harvesting or have such low positive balances that even the most resource-efficient harvesting scenario (MIN) does not ensure nutrient sustainability.
From our data, we can calculate the area where nutrient management by nutrient recycling is advisable if the present harvest intensity (REAL) is to be maintained. In Table 3, the first two rows show the area with a recycling requirement (based on expected significant nutrient balances only). The last two rows show the annual treatment areas depending on the amount of the yearly balance loss for the deficient nutrients at each tract of the NFI. The repetition time of liming campaigns was derived by cumulating the annual balance deficits until the mean nutrient content of a practical liming campaign with the dosage of 3 tons ha−1 dolomite rock powder or 4 tons ha−1 dolomite/wood ash mixture was reached, assuming a typical chemical composition of the applied materials. Possible counteracting measures for closing the nutrient balance depend on which nutrient is deficient. Liming with dolomite powder reduces Ca and/or Mg deficiency, whereas at sites with additional K deficiency, a K containing material such as wood ash should be applied in addition to the dolomite. At sites where only K is deficient, a formulation with a high K content should be considered. Summing the annual requirement of liming areas in our model (significantly negative balances for Ca + Mg and Ca + Mg + K), this is an annual requirement of 123,612 ha. This number agrees well with the approximately 100,000 ha yr−1 of limed forest area in Germany between 1980 and 2016 [146]. Our 23.6% higher estimate can be explained by the fact that our number refers to the required liming area, but not all forests with a liming demand have been actually limed in the past, and in some federal states no regular liming has been conducted since 1983.
Although both discussed management options, adjusting harvest intensity and soil protective liming, can mitigate nutrient loss, it is evident that a combination of both options is required to close nutrient balances at many sites. This particularly concerns those sites that show negative nutrient balances already for the MIN scenario (Figure 5).
Potential consequences of a forest overuse include growth losses [26,27,147] which, among others, would turn short-term gains from fuel wood use into long-term losses. In this context, previous experience with extreme overuse of forests through forest grazing or litter harvesting may be a warning. Furthermore, it should be noted that on sites with low nutrient stocks due to historical overuse, positive balances serve to restore the natural site potential. When using dolomitic lime, complications from nutrient imbalances must also be considered. In this context, special reference should be made to a possible disturbance of the K supply due to calcium-potassium antagonism [148]. Summaries of numerous studies on this topic can be found in Hüttl and Zoettl [149]. Recent evaluations also show that spruce needles have lower P and K levels on limed NFSI sites than on unlimed sites [150]. Corresponding results were also observed on other experimental plots for forest liming [91,151]. Accordingly, the risks of liming to forest ecosystems and potential conflicts with other objectives, like e.g., nature preservation issues should also be included in the decision-making process on nutrient recycling measures [92,152,153,154,155].
The evaluations presented here allow a regional estimate of the magnitude of the recirculation requirement and from this also a rough calculation of possible costs. The uncertainty analyses provide the necessary confidence to justify the effort and cost required for nutrient management measures in practical planning. They also provide a reliable framework for prioritizing measures.

4. Conclusions

Sustainable management of forest soils implies that the nutrient export by wood and biomass harvesting, in the long term, does not exceed the nutrient replenishment from weathering and deposition. Based on our findings we recommend distinguishing between sites where negative nutrient balances are mainly due to harvest exports and those that are depleted in nutrients primarily due high atmospheric deposition of sulphur and nitrogen.
Nutrient balances and their uncertainties vary widely depending on geology, soils, climate, deposition history and forest stand characteristics and hence, reliable calculations must be based on local or regional information on those drivers of the nutrient balance. If necessary, the reduction of the harvest intensity can contribute to achieving a sustainable nutrient supply. Alternatively, or additionally, nutrient base cations can be recycled, e.g., by forest liming. However, possible negative side effects must also be considered here. The analysed harvest scenarios show that WTH has a high impact on base cation budgets in forest soils, as WTH removes additional biomass categories (twigs, branches, bark, needles) which have a much higher base cation content than stem wood. This implies a major risk of site degradation, which must be considered in any management. Nevertheless, the option to increase harvest intensity at sites where nutrient balances are significantly positive (12% of NFI sites) allows at least a partial compensation for reductions in harvest intensity at sensitive sites.
The results of this study provide valuable information for practitioners and environmental policy makers to enable spatiotemporal adaptive ecosystem management on the reliable and quality-assured basis of monitoring data. Nutrient balances can be readily adapted to changing environmental conditions by applying the evaluation algorithms developed in this study to data sets from future regular forest monitoring ampaigns.

Author Contributions

Conceptualization, B.A. and K.v.W.; methodology, B.A., W.W., C.V., D.Z. and H.P.; validation, B.A., W.W., C.V. and D.Z.; formal analysis, B.A., W.W., C.V. and D.Z.; investigation, B.A., W.W., C.V., H.P., G.K., C.S. and D.Z.; writing—original draft preparation, B.A., K.v.W. and C.V.; writing—review and editing, B.A., W.W., C.V., H.P., G.K., C.S. and D.Z.; visualization, B.A., W.W., D.Z., C.V. and H.P.; supervision, K.v.W., G.K. and C.S.; project administration, K.v.W., G.K. and H.P.; funding acquisition, K.v.W. and G.K. All authors have read and agreed to the published version of the manuscript.

Funding

This study was funded by BMEL/FNR (FKZ: 22006512, 22020212 and 22020312). Part of the data were co-financed by the European Commission. Partial funding of data collection and evaluation was provided by the European Union under Council Regulation (EEC) 3528/86 on the Protection of Forests against Atmospheric Pollution, the Regulation (EC) 2152/2003 concerning monitoring of forests and environmental interactions in the community (Forest Focus) and by the project LIFE 07 ENV/D/000218, Further Development and Implementation of an EU-level Forest monitoring Systeme (FutMon).

Institutional Review Board Statement

Not applicable.

Informed Consent Statement

Not applicable.

Data Availability Statement

The datasets related to this article are available from the corresponding author and co-authors on reasonable request. The original datasets for the NFI and NFSI plot and regionalized deposition are available on request from the institutions holding the data. Deposition data by UBA, Dessau, Germany. All NFI and NFSI data by Thünen Institute of Forest Ecosystems, Eberswalde, Germany. Data from German Intensive Forest Monitoring sites (mainly ICP Forest sites) fall under the publication policy of ICP Forests (Annex II of Seidling et al. [156]) and can be accessed from the ICP Forests database (http://icp-forests.net/page/data-requests (accessed on 15 February 2022)). upon request from the Programme Co-ordinating Center (PCC) in Eberswalde, Germany. Deposition calculated by dry deposition factor by Northwest German Forest Research Institute (NW-FVA).

Acknowledgments

For the far-reaching provision of data and the close cooperation in all necessary steps of data harmonization, we would like to express our sincere thanks to the representatives of the following state institutions: Research Institute for Forest Ecology and Forestry Rhineland-Palatinate; Hessen-Forest with the Service Center for Forest Management and Nature Conservation (FENA); State Office for Agriculture, Environment and Rural Areas Schleswig-Holstein; Hessian State Office for Nature Conservation, Environment and Geology; State Office for Mining, Energy and Geology Lower Saxony; State Office for Geology and Mining Saxony-Anhalt; Lower Saxony State Forests; Saxony-Anhalt State Forestry Office; State Institute for Ecology, Land Readjustment and Forests North Rhine-Westphalia; State Competence Center Forestry Eberswalde and Forestry Administration of Baden-Wuerttemberg. Maps of the soils and geology of Germany were made available to us by the Federal Institute for Geosciences and Natural Resources (BGR) for use. Data from the monitoring networks of the NFSI and the ICPForest-monitoring (Level II) were provided by the Thünen Institute for Forest Ecosystems in Eberswalde. Germany-wide wet deposition data were provided by the Federal Environment Agency. Further data of great value for the project work were provided by scientists from various research institutes. We would like to thank Hans Pretzsch and Ralf Moshammer (both Technical University of Munich), Joachim Block and Julius Schuck (both Rhineland-Palatinate Research Institute for Forest Ecology and Forestry), and Reinhard Stock (The German Federal Environmental Foundation), who provided extensive data on nutrient concentrations in tree compartments, which were collected in the framework of the project “Decision support Decision Support System for Nutrient Removal in Timber Harvesting” (Ref. 25966-33/0). The constructive comments by the four anonymous reviewers, which helped to improve the manuscript significantly, are gratefully acknowledged.

Conflicts of Interest

The authors declare no conflict of interest.

Appendix A

Table A1. Harvesting scenarios used for element balance calculations.
ScenarioAbbreviationDescription
Nutrient
Saving
MINThe harvest is limited to saw logs and industrial round wood. The utilization limit varies between top diameters of 12 to 14 cm for softwood and 12 to 17 cm for hardwood species depending on diameter at breast height. Harvest losses remaining on site are assumed to be 10% [33,157]. Brushwood and branch debris are not utilized and remain in the stand interior (not concentrated on the skid trails) through appropriate motorized or mechanized delimbing. In addition, as suggested by Heppelmann et al. [125], debarking of logs takes place inside the stand. This leaves the most nutrient-rich parts (crown material and bark) entirely on site, where they remain available as a source of nutrients.
Current
harvest
intensity
REALThe main assortments are logs, industrial wood, and fuel wood. All solid volume including bark minus 10% harvest losses is harvested. The utilization limit is set to a top diameter of 7 cm. Harvesting is done by machine and the logging roads are reinforced by half of the arising brushwood volume for soil protection. It is assumed that 80% of the nutrients accumulated in the skid trails with biomass are not available to the system in the medium-term and are thus taken as losses.
Highest
intensity
MAXAll solid volume is used as log, industrial or fuel wood assuming no technical harvesting losses in the coarse wood fraction. Furthermore, under the same assumptions as in the ‘REAL’ scenario, half of the produced brushwood is placed on the logging roads. In addition, the other half of the crown material, minus harvesting losses of 20% for conifers and 40% for broadleaved trees, is used for energy production or chemical conversion. This scenario thus largely corresponds to a whole-tree harvesting (WTH).

Appendix B

Estimation of Site Specific Yearly Dry Deposition Factors (DDF)

To explain the variation in dry deposition, we investigated the relationship between several stand, site and climate parameters and the DDF by generalized additive mixed effect models (GAMM). These models are used for model development taking the “pseudo-replicated” deposition and stand data at every single monitoring site into account. Standard software to parameterize this type of model is available in the form of the R package “mgvc” [158], which additionally calls for the libraries “MASS” [159] and “nlme” [160]. The model structure is as follows:
DDF y , p = b 0 + f 1 ( x 1 , yp ) + f 2 ( x 2 , yp ) + + f n ( x n , yp ) + Z p b p + ε
where DDF is the dry deposition factor in year y of plot p, b0 is the intercept term, f1, f2, …, fn: are spline smoothing functions, x1,yp, x2,yp, …, xn,yp are 1 … n predictor variables of year y of plot p, Zp: is a linear model matrix including dummy variables for coding random effects for plots p with p = 1, …, 115. bp is a vector of random effects and ε is an independent and identically normally distributed error term.
Table A2. Estimated coefficients and statistical characteristics of the dry deposition factor (DDF) model. Est.: estimated parameter value, SE: standard error of the parameter estimates, edf: effective degrees of freedom, BDNa: bulk deposition of sodium; WLI: windward/leeward index; WS: wind speed, DN: distance to North Sea; H: stand height; signif. codes: <0.001 ***, <0.01 **.
Est.SEEdf
Parametric coefficients
Intercept0.23369 ***0.02431
Oak−0.15948 **0.05046
Spruce0.25400 ***0.03381
Pine0.14753 ***0.04235
Approximate significance of smooth terms
log(BDNa) 2.608 ***
WLI 1.000 **
WS 1.701 ***
DN 1.000 ***
H 1.000 ***
adj.0.648 n = 928
To use the model independently from R, the following calculations can be performed:
DDF y , p = b 0 + f 1 ( ln ( BD Na ) ) + f 2 ( WLI ) + f 3 ( WS ) + f 4 ( DN ) + f 5 ( H ) + b 1
where b0 = 0.23369, and b1 for beech, oak, spruce, and pine is: 0, −0.15948, 0.25400, 0.14753. The different linear and non-linear functions could be calculated as follows:
f 1 ( ln ( BD Na ) ) = 0.0592965032 · ( ln ( BD Na ) ) 2 0.56333208 · ln ( BD Na ) + 0.65236948
f 2 ( WLI ) = 0.3132540717 · WLI 0.3559040829
f 3 ( WS ) = 0.0096723754 · WS 2 + 0.174999468 · WS 0.5263822623
f 4 ( DN ) = 0.0015403976 · DN + 0.5616516592
f 5 ( H ) = 0.0084502178 · H 0.2362130627
where BDNa: bulk deposition of sodium [kg ha−1 yr−1]; WLI: windward/leeward index [–]; WS: annual mean wind speed in 10 m [m s−1]; DN: distance to North Sea [km]; H: stand height [m]. In case of negative values, the DDF should be set to zero.
Figure A1. Relationship between predicted and measured dry deposition factors (DDF) for forest stands from two different age chronosequence studies in Germany [161,162] used for model evaluation. : Norway spruce and Douglas fir, : European beech, : Scots pine, : Pedunculated/Sessile oak (a) Normal probability plot (Q-Q plot) for visual assessment of residuals (b).
Soilsystems 06 00041 g0a1
Figure A2. Regionalized atmospheric total deposition of the elements calcium (Ca), magnesium (Mg), potassium (K) and sodium (Na) at the tracts of the German National Forest Inventory (NFI).
Soilsystems 06 00041 g0a2

Appendix C

Figure A3. Nutrient balance (weathering + deposition—leaching—harvesting removal + soil stock/1000 [scenario REAL]) at NFI tracts over mean stand age at time NFI 2012, stratified by model regions (see Figure 2), for calcium (Ca) and magnesium (Mg) only on carbonate-free soils. Boxplots for age classes of 20 years; the width of the box is proportional to the number of tract corners in the age class; y-axis restricted to 90% of the data, but the data basis for the loess curve (red) is not. 1—pre-alpine moraines and limestone Alps; 2—hills on limestone bedrocks; 3—hills on crystalline bedrocks; 4—hills on sand, silt, clay bedrocks; 6—old moraines, north German lowland; 7—young moraines, north German lowland; 8—loess regions, fluvial valleys; 9—hills on clay- and silt schist bedrocks. Note: the number 5 was deliberately not assigned.
Soilsystems 06 00041 g0a3

Appendix D

Experimental Design of the Monte Carlo Uncertainty Simulations

The uncertainty analysis was limited to the carbonate-free sites with respect to the elements Ca and Mg, as the balances for these elements are very uncertain on sites with carbonate soils, but sufficient Ca and Mg supply can be assumed. First, correlation analyses were performed for different variables (see Figure A4 as example from an NFSI plot) used for the derivation of the nutrient balance (deposition, weathering, soil stocks etc.) in the statistical program R using the function rcorr() from the package “Hmisc” [163] to identify possible covariance structures of the parameters in their probability distributions so that they can be taken into account, if necessary. Spearman’s correlation coefficients (rSpear) were calculated for the correlation analysis because the balance variables, in particular for Ca and Mg were not normally distributed [164]. We only considered significant correlations (α ≤ 0.05). When non-significant correlations were present, correlation coefficients were set to zero in the further analyses. In addition, mean values and standard deviations for the respective parameters were required. During the Monte Carlo (MC) simulation, random parameter draws were based on the model’s expected values and, considering the detected covariance, were realized with the function rmvnorm() from the R package “splus2R” [100]. A compilation of these values (the mean values are site-specific and therefore cannot be presented in the Table A3) is provided in Table A3 for the NFSI grid points. Table A4 contains the parameters to characterize the uncertainties of the regionalization models (see Section 2.3) for the NFI tracts.
Table A3. Input data and uncertainty ranges of the balance variables as the basis for the Monte Carlo simulations of the soil balances components on the NFSI points. DEP: deposition; WEA: weathering rate; CSE: concentration in seepage water; SEF: seepage flux; STO: soil stock of plant available nutrients; mean μ: site mean; min: minimum value; SD: standard deviation; RMSE: root mean square error; R: data reference.
ParameterUnitMean μMinSD[%]RMSER
DEPCakg ha−1 yr−1modelled results0.001-2.68[165]
DEPMgkg ha−1 yr−1modelled results0.001-0.43[165]
DEPKkg ha−1 yr−1modelled results0.001-1.54[165]
WEACakg ha−1 yr−1modelled with site specific data0.00123.3-[166]
WEAMgkg ha−1 yr−1modelled with site specific data0.00123.3-[166]
WEAKkg ha−1 yr−1modelled with site specific data0.00123.3-[166]
CSECammolc l−1modelled with site specific data0.00153.9-[73]
CSEMgmmolc l−1modelled with site specific data0.00157.5-[73]
CSEKmmolc l−1modelled with site specific data0.00197.1-[73]
SEFmmmodelled with site specific data0.0018.3-[65]
STOCa0.001 kg ha−1measured0.00150.0-[167]
STOMg0.001 kg ha−1measured0.00150.0-[167]
STOK0.001 kg ha−1measured0.00150.0-[167]
Table A4. Coefficient of variation (based on RMSE of the validation) of the regionalized balance elements for the individual model regions and the global model as a basis for the Monte Carlo simulations of the soil balances on the NFI tracts. Model Region (see Figure 2A, main text): 1: pre-alpine moraines and limestone Alps; 2: hills on limestone bedrocks; 3: hills on crystalline bedrocks; 4: hills on sand, silt, clay bedrocks; 6: old moraines, north German lowland; 7: young moraines, north German lowland; 8: loess regions, fluvial valleys; 9: hills on clay and silt schist bedrocks. Note: the number 5 was deliberately not assigned. X: Global model, *: Global model used (cf. Section 2.3).
Model RegionLeachingWeathering RateSoil Stocks
cf. Figure 2ACaMgKCaMgKCaMgK
187.9 *125.7 *80.5 *321.8 *89.2 *55.8 *72.7 *80.1 *51.9 *
257.3106.976.8109.8153.850.857.7127.348.6
377.583.379.190.787.255.8 *139.9126.855.1
4103.8105.869.7321.8 *132.854.5110107.160.2
680.895.8107.6107.573.478.6117.9127.656.6
7102.996.8105.1321.8 *75.96571.6103.251.7
880.676.181.347.847.951.189.186.550.1
9119.2125.7 *95321.8 *26165112.265136.8
X87.9125.780.5321.889.255.872.780.151.9
Again, the relative root mean square error (RMSE) was used as an indicator for the (unobserved) standard deviation, as the models were fitted with log-transformed data. If only information on the maximum error range (e.g., ±25% for seepage flux) was available, the percent standard deviation σ was determined as follows (for the normal distribution, 99.7% of the values are in the ±3-σ range):
σ = (error)/3   [%]
Figure A4 shows an example of the distribution of randomly selected values for the NFSI plot with the ID 30016 and the balance variables deposition, weathering, nutrient concentration in seepage water, seepage flux, and soil stock of Ca.
Figure A4. Example for randomly varied input data of the calcium (Ca) balance considering the covariance in the Monte Carlo procedure for the NFSI plot with the ID 30016.
Soilsystems 06 00041 g0a4
As the function rmvnorm() does not offer the possibility to represent truncated parameter spans, but negative balance variables are implausible, 50,000 simulations were first performed for each NFI tract. From this data set, all simulations were used for which the balance variables reached values ≥0.001. Finally, a random sample (n = 10,000, [168,169]) was generated from this subset using the sample() function without replacement. Such a sample size allows the necessary reproducibility of the obtained results [63].
Except for deposition and harvesting removal, the calculated balance elements at the NFI sites exhibit—besides a methodological (model-related) error—an additional regionalization error. For deposition and harvest, the estimated model error at the NFI tracts was used. The example of weathering rates (WEA) is used to illustrate how the calculation of the i-th value within the Monte Carlo simulations ( WEA i MC ) is based on the regionalized, site-specific value of WEASTA, the regionalization error ( WEA i , REG MC WEA STA ) , and a methodological error ( WEA i , MET MC WEA STA ) . The terms WEA i , REG MC and WEA i , MET MC are the simulation terms drawn during the Monte Carlo simulation from the corresponding distribution of the regionalization and from the modelling derived weathering rates. Thus, the distribution of simulated weathering rates is generated as follows:
WEA i MC = WEA STA + ( WEA i , REG MC WEA STA ) + ( WEA i , MET MC WEA STA )
The error in harvest removals was accounted for in a slightly different manner. The calculation of element removals is based on forest growth simulations, biomass functions and compartment specific nutrient levels and, therefore, very time consuming and not feasible to implement for 10,000 Monte Carlo iterations. Instead, for each NFI tract, the corresponding harvest removal was calculated, considering the error propagation of the prediction errors. Only the errors of the biomass functions and the models for nutrient levels in biomass were taken into account. Other elements, such as the error of the model WEHAM in predicting future forest development and of BDAT (program to calculate e.g., diameters, volume, assortments and double bark thickness for different tree species based on tree characteristics and sorting information [77]), as well as uncertainties in the input data for predicting nutrient levels were ignored. The time required for repeated evaluation of these models (updating of diameter at breast height, tree height and growth, possibly changing the dropping out collective and variety composition, re-evaluation of proximity element functions with varying predictors) is not proportionate to the expected gain in accuracy. In addition, the error rate in the estimation of biomass and approximate elements is much lower than the uncertainties of the other nutrient balance elements.
Many of the required error specifications could be derived directly from model validation of the various sub models. Assuming that the errors in the statistical models are normally distributed, the RMSE (root mean square error) was simplified to be equal to the standard deviation. For models with heteroscedastic errors (biomass models and log models of regionalization), the coefficient of variation based on RMSE, i.e., relative RMSE calculated as RMSE/E(Y) (E: expected value), was used.
For some parameters, data from the literature were used for a rough estimation. For soil nutrient stocks a coefficient of variation (CV) of 50% was assumed (cf. Table A3).
After the simulations, the significance level for the occurrence of negative or positive element balances was determined from the probability densities of the 10,000 Monte Carlo realizations. The terms significant and weakly significant are defined with error probabilities of α ≤ 0.05 and 0.05 < α ≤ 0.1, respectively. Figure A5 shows this procedure as an example for three situations. In example B1 (red distribution curve), the distribution of the 10,000 simulations is mainly negative, but indeed encompasses also zero. More importantly, zero ranges between the 90% and 95% percentile (highlighted in red). Accordingly, the balance for this example is only weakly significantly negative (0.05 < α ≤ 0.10). Example B2 in Figure A5 shows slightly more positive than negative realizations, but this is not statistically significant: (the area between the 30% and 70% percentiles (highlighted in colour) includes zero). Example B3 in Figure A5 shows a situation of significantly positive (0.05 < α ≤ 0.1) balance simulations. Here, the value zero is excluded with over 95% confidence (the 5% quantile of the distribution is highlighted in blue). Results (Figure 5, main text) were plotted using the R package “maptools” [170].
Figure A5. Examples (B1 to B3, see text) for deriving significance levels of negative or positive soil nutrient balances.
Soilsystems 06 00041 g0a5

Appendix E

Validation of the Regionalized Nutrient Balances

The regression models developed at the test dataset of NFSI were applied with the predictors at the validation data set and compared with the measured NFSI data at each plot of the validation data individually. The assessment error of Ca and Mg balances were high (RMSE = 62.5 kg ha−1 yr−1 and RMSE = 23.2 kg ha−1 yr−1, respectively), whereas it was low for K (RMSE = 4.3 kg ha−1 yr−1). The relation between the balance values calculated from measured NFSI data and regionalized data at NFI sites follows closely the 1:1 line as it is presented in Figure A6 exemplarily for Ca and K.
Figure A6. Scatter diagram of regionalized calcium (Ca, (A)) and potassium (K, (B)) balances versus balances calculated from measured NFSI data (y axis). Black line = 1:1 reference.
Soilsystems 06 00041 g0a6
The spatial distribution of Mg balances calculated from measured NFSI data and regionalized Mg balances at NFI tracts is presented by the Figure A7. The comparison of the spatial distribution of Mg balances between those calculated with measured NFSI data and the regionalized balances in NFI sites demonstrates impressively that the regionalized data provide 26 times higher information density in space and much more consistent regional patterns of balance levels. It is also visible that regions with lacking NFSI data for balance calculation are supplemented by the regionalization process in a sensible way.
Figure A7. Spatial distribution of Mg balances calculated with measured NFSI data (A) and regionalized Mg balances at NFI sites (B). Black lines are boundaries of model regions (see Figure 2).
Soilsystems 06 00041 g0a7

References

  1. Lindberg, S.E.; Lovett, G.M.; Richter, D.D.; Johnson, D.W. Atmospheric deposition and canopy interactions of major ions in a forest. Science 1986, 231, 141–145. [Google Scholar] [CrossRef]
  2. Hedin, L.O.; Granat, L.; Likens, G.E.; Buishand, T.A.; Galloway, J.N.; Butler, T.J.; Rodhe, H. Steep declines in atmospheric base cations in regions of Europe and North America. Nature 1994, 367, 351–354. [Google Scholar] [CrossRef]
  3. Meesenburg, H.; Meiwes, K.-J.; Rademacher, P. Long term trends in atmospheric deposition and seepage output in northwest german forest ecosystems. Water Air Soil Pollut. 1995, 85, 611–616. [Google Scholar] [CrossRef]
  4. Engardt, M.; Simpson, D.; Schwikowski, M.; Granat, L. Deposition of sulphur and nitrogen in Europe 1900–2050. Model calculations and comparison to historical observations. Tellus Ser. B 2017, 69, 1328945. [Google Scholar] [CrossRef] [Green Version]
  5. Meesenburg, H.; Ahrends, B.; Fleck, S.; Wagner, M.; Fortmann, H.; Scheler, B.; Klinck, U.; Dammann, I.; Eichhorn, J.; Mindrup, M.; et al. Long-term changes of ecosystem services at Solling, Germany: Recovery from acidification, but increasing nitrogen saturation? Ecol. Indic. 2016, 65, 103–112. [Google Scholar] [CrossRef]
  6. Vestreng, V.; Myhre, G.; Fagerli, H.; Reis, S.; Tarrasón, L. Twenty-five years of continuous sulphur dioxide emission reduction in Europe. Atmos. Chem. Phys. 2007, 7, 3663–3681. [Google Scholar] [CrossRef] [Green Version]
  7. de Vries, W.; de Jong, A.; Kros, J.; Spijker, J. The use of soil nutrient balances in deriving forest biomass harvesting guidelines specific to region, tree species and soil type in the Netherlands. For. Ecol. Manag. 2021, 479, 118591. [Google Scholar] [CrossRef]
  8. Rytter, L.; Ingerslev, M.; Kilpeläinen, A.; Torssonen, P.; Lazdina, D.; Löf, M.; Madsen, P.; Muiste, P.; Stener, L.-G. Increased forest biomass production in the Nordic and Baltic countries—A review on current and future opportunities. Silva Fenn. 2016, 50, 5. [Google Scholar] [CrossRef] [Green Version]
  9. Busch, R.; Hirth, T.; Liese, A.; Nordhoff, S.; Puls, J.; Pulz, O.; Sell, D.; Syldatk, C.; Ulber, R. Nutzung nachwachsender Rohstoffe in der industriellen Stoffproduktion. Chem. Ing. Tech. 2006, 78, 219–228. [Google Scholar] [CrossRef]
  10. Flückiger, W.; Braun, S. Nährstoffe im Wald lassen-oder recyclieren! Wald. Und Holz 2009, 9, 30–33. [Google Scholar]
  11. Jacobsen, C.; Rademacher, P.; Meesenburg, H.; Meiwes, K.J. Gehalte chemischer Elemente in Baumkompartimenten—Literaturstudie und Datensammlung. In Berichte des Forschungszentrums Waldökosysteme; Reihe B 69; Selbstverlag des Forschungszentrums Waldökosysteme der Universität Göttingen: Göttingen, Germany, 2003; 81p. [Google Scholar]
  12. Rumpf, S.; Schönfelder, E.; Ahrends, B. Biometrische Schätzmodelle für Nährelementgehalte in Baumkompartimenten. Freibg. Forstl. Forsch. 2018, 101, 33–73. [Google Scholar]
  13. Aherne, J.; Posch, M.; Forsius, M.; Lehtonen, A.; Härkönen, K. Impacts of forest biomass removal on soil nutrient status under climate change: A catchment-based modelling study for Finland. Biogeochemistry 2012, 107, 471–488. [Google Scholar] [CrossRef]
  14. Vanguelova, E.; Pitman, R.; Luiro, J.; Helmisaari, H.-S. Long term effects of whole tree harvesting on soil carbon and nutrient sustainability in the UK. Biogeochemistry 2010, 101, 43–59. [Google Scholar] [CrossRef]
  15. Marčeta, D.; Petković, V.; Ljubojević, D.; Potočnik, I. Harvesting System Suitability as Decision Support in Selection Cutting Forest Management in Northwest Bosnia and Herzegovina. Croat. J. For. Eng. 2020, 41, 251–265. [Google Scholar] [CrossRef]
  16. Block, J.; Meiwes, K.J. Erhaltung der Produktivität der Waldböden bei der Holz- und Biomassenutzung. In Bodenschutz—Ergänzbares Handbuch der Maßnahmen und Empfehlungen für Schutz, Pflege und Sanierung von Böden, Landschaft und Grundwasser; Bachmann, G., König, W., Utermann, J., Eds.; Erich Schmidt Verlag GmbH & Co. KG: Berlin, Germany, 2013; Volume 4200, pp. 1–50. [Google Scholar]
  17. Titus, B.D.; Brown, K.; Helmisaari, H.-S.; Vanguelova, E.; Stupak, I.; Evans, A.; Clarke, N.; Guidi, C.; Bruckman, V.J.; Varnagiryte-Kabasinskiene, I.; et al. Sustainable forest biomass: A review of current residue harvesting guidelines. Energy Sustain. Soc. 2021, 11, 10. [Google Scholar] [CrossRef]
  18. Stupak, I.; Raulund-Rasmussen, K. Historical, ecological, and governance aspects of intensive forest biomass harvesting in Denmark. WIREs Energy Environ. 2016, 5, 588–610. [Google Scholar] [CrossRef]
  19. Fleck, S.; Eickenscheidt, N.; Ahrends, B.; Evers, J.; Grüneberg, E.; Ziche, D.; Höhle, J.; Schmitz, A.; Weis, W.; Schmidt-Walter, P.; et al. Nitrogen Status and Dynamics in German Forest Soils. In Ecological Studies (Analysis and Synthesis); Wellbrock, N., Bolte, A., Eds.; Springer International Publishing: Cham, Switzerland, 2019; Volume 237, pp. 123–166. [Google Scholar]
  20. Akselsson, C.; Westling, O.; Sverdrup, H.; Holmqvist, J.; Thelin, G.; Uggla, E.; Malm, E. Impact of Harvest Intensity on Long-Term Base Cation Budgets in Swedish Forest Soils. Water Air Soil Pollut. Focus 2007, 7, 201–210. [Google Scholar] [CrossRef]
  21. Olsson, B.A.; Bengtsson, J.; Lundkvist, H. Effects of different forest harvest intensities on the pools of exchangeable cations in coniferous forest soils. For. Ecol. Manag. 1996, 84, 135–147. [Google Scholar] [CrossRef]
  22. Joki-Heiskala, P.; Johansson, M.; Holmberg, M.; Mattsson, T.; Forsius, M.; Kortelainen, P.; Hallin, L. Long-term base cation balances of forest mineral soils in Finland. Water Air Soil Pollut. 2003, 150, 255–273. [Google Scholar] [CrossRef]
  23. Forsius, M.; Akujärvi, A.; Mattsson, T.; Holmberg, M.; Punttila, P.; Posch, M.; Liski, J.; Repo, A.; Virkkala, R.; Vihervaara, P. Modelling impacts of forest bioenergy use on ecosystem sustainability: Lammi LTER region, southern Finland. Ecol. Indic. 2016, 65, 66–75. [Google Scholar] [CrossRef]
  24. Likens, G.E.; Bormann, F.M.; Pierce, R.S.; Eaton, J.S.; Johnson, N.M. Biochemistry of a Forested Ecosystem; Springer: New York, NY, USA, 1977; p. 146. [Google Scholar]
  25. Levers, C.; Verkerk, P.J.; Müller, D.; Verburg, P.H.; Butsic, V.; Leitão, P.J.; Lindner, M.; Kuemmerle, T. Drivers of forest harvesting intensity patterns in Europe. For. Ecol. Manag. 2014, 315, 160–172. [Google Scholar] [CrossRef]
  26. Achat, D.L.; Deleuze, C.; Landmann, G.; Pousse, N.; Ranger, J.; Augusto, L. Quantifying consequences of removing harvesting residues on forest soils and tree growth—A meta-analysis. For. Ecol. Manag. 2015, 348, 124–141. [Google Scholar] [CrossRef]
  27. Thiffault, E.; Hannam, K.D.; Pare, D.; Titus, B.D.; Hazlett, P.W.; Maynard, D.G.; Brais, S. Effects of forest biomass harvesting on soil productivity in boreal and temperate forests—A review. Environ. Rev. 2011, 19, 278–309. [Google Scholar] [CrossRef]
  28. Zetterberg, T.; Köhler, S.J.; Löfgren, S. Sensitivity analyses of MAGIC modelled predictions of future impacts of whole-tree harvest on soil calcium supply and stream acid neutralizing capacity. Sci. Total Environ. 2014, 494–495, 187–201. [Google Scholar] [CrossRef] [PubMed]
  29. Egnell, G.; Valinger, E. Survival, growth, and growth allocation of planted Scots pine trees after different levels of biomass removal in clear felling. For. Ecol. Manag. 2003, 177, 65–74. [Google Scholar] [CrossRef]
  30. Evans, A.M.; Finkral, A.J. From renewable energy to fire risk reduction: A synthesis of biomass harvesting and utilization case studies in US forests. GCB Bioenergy 2009, 1, 211–219. [Google Scholar] [CrossRef]
  31. Mason, W.L.; Mckay, H.M.; Weatherall, A.; Connolly, T.; Harrison, A.J. The effects of whole-tree harvesting on three sites in upland Britain on the growth of Sitka spruce over ten years. For. Int. J. For. Res. 2011, 85, 111–123. [Google Scholar] [CrossRef]
  32. Kreutzweiser, D.P.K.P.; Hazlett, P.W.H.W.; Gunn, J.M.G.M. Logging impacts on the biogeochemistry of boreal forest soils and nutrient export to aquatic systems: A review. Environ. Rev. 2008, 16, 157–179. [Google Scholar] [CrossRef]
  33. Wilpert, V.K.; Bösch, B.; Bastian, P.; Zirlewagen, D.; Hepperle, F.; Holzmann, S.; Puhlmann, H.; Schäffer, J.; Kändler, G.; Sauter, U.H. Biomasse-Aufkommensprognose und Kreislaufkonzepte für den Einsatz von Holzaschen in der Bodenschutzkalkung in Oberschwaben. Ber. Freibg. Forstl. Forsch. 2011, 87, 155. [Google Scholar]
  34. Riek, W.; Russ, A.; Kühn, D. Waldbodenbericht Brandenburg. Zustand und Entwicklung der brandenburgischen Waldböden. Ergebnisse der landesweiten Bodenzustandserhebungen BZE-2 und BZE-2a. Eberswalder Forstl. Schr. 2015, 60, 172. [Google Scholar]
  35. Ahrends, B.; Scheler, B.; Wagner, M.; Fleck, S.; Fortmann, H.; Meesenburg, H. Trends der Nährstoffbilanzen forstlich genutzter Intensiv-BDF in Niedersachsen. Geoberichte 2021, 39, 40–54. [Google Scholar] [CrossRef]
  36. Knust, C.; Schua, K.; Feger, K.-H. Estimation of Nutrient Exports Resulting from Thinning and Intensive Biomass Extraction in Medium-Aged Spruce and Pine Stands in Saxony, Northeast Germany. Forests 2016, 7, 302. [Google Scholar] [CrossRef] [Green Version]
  37. Borken, W.; Matzner, E. Nitrate leaching in forest soils: An analysis of long-term monitoring sites in Germany. J. Plant Nutr. Soil Sci. 2004, 167, 277–283. [Google Scholar] [CrossRef]
  38. Brumme, R.; Ahrends, B.; Block, J.; Schulz, C.; Meesenburg, H.; Klinck, U.; Wagner, M.; Khanna, P. Cycling and retention of nitrogen in European beech (Fagus sylvatica L.) ecosystems under elevated fructification frequency. Biogeosciences 2021, 18, 3763–3779. [Google Scholar] [CrossRef]
  39. Paré, D.; Thiffault, E. Nutrient Budgets in Forests Under Increased Biomass Harvesting Scenarios. Curr. For. Rep. 2016, 2, 81–91. [Google Scholar] [CrossRef] [Green Version]
  40. Sutton, M.A.; Oenema, O.; Erisman, J.W.; Leip, A.; van Grinsven, H.; Winiwarter, W. Too much of a good thing. Nature 2011, 472, 159–161. [Google Scholar] [CrossRef] [Green Version]
  41. Bol, R.; Julich, D.; Brödlin, D.; Siemens, J.; Kaiser, K.; Dippold, M.A.; Spielvogel, S.; Zilla, T.; Mewes, D.; von Blanckenburg, F.; et al. Dissolved and colloidal phosphorus fluxes in forest ecosystems—An almost blind spot in ecosystem research. J. Plant Nutr. Soil Sci. 2016, 179, 425–438. [Google Scholar] [CrossRef] [Green Version]
  42. Missong, A.; Holzmann, S.; Bol, R.; Nischwitz, V.; Puhlmann, H.; Kaiser, K.; Siemens, J.; Klumpp, E. Leaching of natural colloids from forest topsoils and their relevance for phosphorus mobility. Sci. Total Environ. 2018, 634, 305–315. [Google Scholar] [CrossRef]
  43. Ulrich, B. Natural and anthropogenic components of soil acidification. J. Plant Nutr. Soil Sci. 1986, 149, 702–717. [Google Scholar] [CrossRef]
  44. Sverdrup, H.; Thelin, G.; Robles, M.; Stjernquist, I.; Sörensen, J. Assesing nutrient sustainability of forest production for different tree species considering Ca, Mg, K, N and P at Björnstorp Estate, Sweden. Biogeochemistry 2006, 81, 219–238. [Google Scholar] [CrossRef]
  45. Builtjes, P.; Hendriks, E.; Koenen, M.; Schaap, M.; Banzhaf, S.; Kerschbaumer, A.; Gauger, T.; Nagel, H.-D.; Scheuschner, T.; Schlutow, A. Erfassung, Prognose und Bewertung von Stoffeinträgen und ihren Wirkungen in Deutschland (Modelling of Air Pollutants and Ecosystem Impact—MAPESI); Federal Environmental Agency: Dessau-Rosslau, Germany, 2011; p. 97.
  46. Schaap, M.; Wichink Kruit, R.J.; Hendriks, C.; Kranenburg, R.; Segers, A.; Builtjes, P.; Banzhaf, S.; Scheuschner, T. Atmospheric Deposition to German Natural and Semi-Natural Ecosystems during 2009; Umweltbundesamt: Dessau-Roßlau, Germany, 2015; p. 82.
  47. Ulrich, B. Nutrient and Acid-Base Budget of Central European Forest Ecosystems. In Effects of Acid Rain on Forest Processes; Godbold, D., Hüttermann, A., Eds.; Wiley-Liss: New York, NY, USA, 1994; pp. 1–50. [Google Scholar]
  48. Devlaeminck, R.; Schrijver, D.A.; Hermy, M. Variation in throughfall deposition across a deciduous beech (Fagus sylvatica L.) forest edge in Flanders. Sci. Total Environ. 2005, 337, 241–252. [Google Scholar] [CrossRef] [PubMed]
  49. Staelens, J.; Houle, D.; De Schrijver, A.; Neirynck, J.; Verheyen, K. Calculating dry deposition and canopy exchange with the canopy budget model: Review of assumptions and application to two deciduous forests. Water Air Soil Pollut. 2008, 191, 149–169. [Google Scholar] [CrossRef]
  50. Zuur, A.F.; Ieno, E.N.; Walker, N.J.; Saveliev, A.A.; Smith, G.M. Mixed Effects Models and Extensions in Ecology with R; Springer: New York, NY, USA, 2009; p. 574. [Google Scholar] [CrossRef] [Green Version]
  51. Clarke, N.; Zlindra, D.; Ulrich, E.; Mosello, R.; Derome, J.; Derome, K.; König, N.; Lövblad, G.; Draaijers, G.; Hansen, K.; et al. Part XIV: Sampling and Analysis of Deposition. Available online: https://storage.ning.com/topology/rest/1.0/file/get/9995560266?profile=original (accessed on 17 February 2022).
  52. Gauger, T.; Anshelm, F.; Schuster, H.; Draaijers, G.P.J.; Bleeker, A.; Erisman, J.W.; Vermeulen, A.T.; Nagel, H.-D. Kartierung Ökosystembezogener Langzeittrends Atmosphärischer Stoffeinträge und Luftschadstoffkonzentrationen in Deutschland und deren Vergleich mit Critical Loads und Critical Levels; Institut für Navigation, Universität: Stuttgart, Germany, 2002; p. 207. [Google Scholar]
  53. RDevelopmentCoreTeam. R: A Language and Environment for Statistical Computing; R Foundation for Statistical Computing: Vienna, Austria, 2013; ISBN 3-900051-07-0. Available online: http://www.R-project.org (accessed on 7 June 2015).
  54. Conrad, O.; Bechtel, B.; Bock, M.; Dietrich, H.; Fichter, E.; Gerlitz, L.; Wehberg, J.; Wichmann, V.; Böhner, J. System for Automated Geoscientific Analyses (SAGA) v. 2.1.4. Geosci. Model Dev. 2015, 8, 1991–2007. [Google Scholar] [CrossRef] [Green Version]
  55. Sverdrup, H.; Warfvinge, P. Calculating field weathering rates using a mechanistic geochemical model PROFILE. Appl. Geochem. 1993, 8, 273–283. [Google Scholar] [CrossRef]
  56. Stendahl, J.; Akselsson, C.; Melkerud, P.-A.; Belyazid, S. Pedon-scale silicate weathering: Comparison of the PROFILE model and the depletion method at 16 forest sites in Sweden. Geoderma 2013, 211–212, 65–74. [Google Scholar] [CrossRef] [Green Version]
  57. Akselsson, C.; Belyazid, S.; Stendahl, J.; Finlay, R.; Olsson, B.A.; Erlandsson Lampa, M.; Wallander, H.; Gustafsson, J.P.; Bishop, K. Weathering rates in Swedish forest soils. Biogeosciences 2019, 16, 4429–4450. [Google Scholar] [CrossRef] [Green Version]
  58. Akselsson, C.; Kronnäs, V.; Stadlinger, N.; Zanchi, G.; Belyazid, S.; Karlsson, P.E.; Hellsten, S.; Karlsson, G.P. A Combined Measurement and Modelling Approach to Assess the Sustainability of Whole-Tree Harvesting—A Swedish Case Study. Sustainability 2021, 13, 2395. [Google Scholar] [CrossRef]
  59. Koseva, I.S.; Watmough, S.A.; Aherne, J. Estimating base cation weathering rates in Canadian forest soils using a simple texture-based model. Biogeochemistry 2010, 2010, 183–196. [Google Scholar] [CrossRef]
  60. Phelan, J.; Belyazid, S.; Kurz, D.; Guthrie, S.; Cajka, J.; Sverdrup, H.; Waite, R. Estimation of Soil Base Cation Weathering Rates with the PROFILE Model to Determine Critical Loads of Acidity for Forested Ecosystems in Pennsylvania, USA: Pilot Application of a Potential National Methodology. Water Air Soil Pollut. 2014, 225, 2109. [Google Scholar] [CrossRef]
  61. Whitfield, C.J.; Watmough, S.A.; Aherne, J.; Dillon, P.J. A comparison of weathering rates for acid-sensitive catchments in Nova Scotia, Canada and their impact on critical load calculations. Geoderma 2006, 136, 899–911. [Google Scholar] [CrossRef]
  62. Hodson, M.E.; Langan, S.J.; Wilson, M.J. A sensitivity analysis of the Profile model in relation to the calculation of soil weathering rates. Appl. Geochem. 1996, 11, 835–844. [Google Scholar] [CrossRef]
  63. Jönsson, C.; Warfvinge, P.; Sverdrup, H. Uncertainty in predicting weathering rate and environmental stress factors with the PROFILE model. Water Air Soil Pollut. 1995, 81, 1–23. [Google Scholar] [CrossRef]
  64. Hammel, K.; Kennel, M. Charakterisierung und Analyse der Wasserverfügbarkeit und des Wasserhaushalts von Waldstandorten in Bayern mit dem Simulationsmodell BROOK90; Heinrich Frank: München, Germany, 2001; Volume 185, p. 148. [Google Scholar]
  65. Ahrends, B.; Schmidt-Walter, P.; Fleck, S.; Köhler, M.; Weis, W. Wasserhaushaltssimulationen und Klimadaten. Freibg. Forstl. Forsch. 2018, 101, 74–94. [Google Scholar]
  66. Schmidt-Walter, P.; Ahrends, B.; Mette, T.; Puhlmann, H.; Meesenburg, H. NFIWADS: The water budget, soil moisture, and drought stress indicators database for German National Forest Inventory (NFI). Ann. Forest Sci. 2019, 76, 39. [Google Scholar] [CrossRef] [Green Version]
  67. Puhlmann, H.; Schmidt-Walter, P.; Hartmann, P.; Meesenburg, H.; von Wilpert, K. Soil Water Budget and Drought Stress. In Status and Dynamics of Forests in Germany: Results of the National Forest Monitoring; Wellbrock, N., Bolte, A., Eds.; Springer International Publishing: Cham, Switzerland, 2019; pp. 55–91. [Google Scholar]
  68. Posch, M.; Kurz, D. A2M—A program to compute all possible mineral modes from geochemical analyses. Comput. Geosci. 2007, 33, 563–572. [Google Scholar] [CrossRef]
  69. GAFA. Handbuch Forstliche Analytik (HFA). Grundwerk des Gutachterausschuss Forstliche Analytik (GAFA); Federal Ministry of Food, Agriculture and Consumer Protection, Northwest German Forest Research Institute: Bonn, Germany, 2005. [Google Scholar]
  70. GAFA. Handbuch Forstliche Analytik (HFA). Grundwerk und 1.—4. Ergänzung des Gutachterausschuss Forstliche Analytik (GAFA); Federal Ministry of Food, Agriculture and Consumer Protection, Northwest German Forest Research Institute: Bonn, Germany, 2009. [Google Scholar]
  71. GAFA. Handbuch Forstliche Analytik (HFA). Grundwerk und 1.—5. Ergänzung des Gutachterausschuss Forstliche Analytik (GAFA); Federal Ministry of Food, Agriculture and Consumer Protection, Northwest German Forest Research Institute: Bonn, Germany, 2014. [Google Scholar]
  72. Wellbrock, N.; Ahrends, B.; Bögelein, R.; Bolte, A.; Eickenscheidt, N.; Grüneberg, E.; König, N.; Schmitz, A.; Fleck, S.; Ziche, D. Concept and Methodology of the National Forest Soil Inventory. In Status and Dynamics of Forests in Germany; Wellbrock, N., Bolte, A., Eds.; Ecological Studies; Springer Nature Schwitzerland AG: Cham, Switzerland, 2019; Volume 237. [Google Scholar]
  73. Weis, W.; Schäff, T.; Köhler, D.; Kölling, C. Stoffausträge mit dem Sickerwasser für die BZE II. Freibg. Forstl. Forsch. 2018, 101, 181–205. [Google Scholar]
  74. Bösch, B.; Kändler, G. WEHAM II—Modelle und Algorithmen. Available online: https://www.bundeswaldinventur.de/fileadmin/SITE_MASTER/content/Downloads/Modelle_und_Algorithmen.pdf (accessed on 11 February 2022).
  75. Rock, J.; Bösch, B.; Kändler, G. WEHAM 2012—Waldentwicklungs- und Holzaufkommensmodellierung für die dritte Bundeswaldinventur. Deutscher Verband Forstlicher Versuchsanstalten (DVFFA). In Sektion Ertragskunde: Berichte zur Jahrestagung 2013; Kohnle, U., Klädtke, J., Eds.; Forstliche Versuchsanstalt Baden-Württemberg: Freiburg, Germany, 2013; pp. 127–133. [Google Scholar]
  76. Vonderach, C.; Kändler, G.; Dormann, C.F. Consistent set of additive biomass functions for eight tree species in Germany fit by nonlinear seemingly unrelated regression. Ann. For. Sci. 2018, 75, 49. [Google Scholar] [CrossRef] [Green Version]
  77. Kublin, E. Einheitliche Beschreibung der Schaftform—Methoden und Programme—BDATPro. Forstwiss. Cent. Ver. Mit Tharandter Forstl. Jahrb. 2003, 122, 183–200. [Google Scholar] [CrossRef]
  78. Block, J.; Schuck, J. Nährstoffentzüge durch die Holzernte und ihr Einfluss auf den Nährstoffhaushalt armer Standorte in Rheinland-Pfalz. Forstl. Forsch. München 2002, 186, 150–151. [Google Scholar]
  79. NW-FVA. Weichlaubholz—Ungenutztes Rohstoffpotenzial!? Abschlussbericht des Projekts "WEIPOL" im Rahmen des Förderungsprogramms “Nachwachsende Rohstoffe" des BMELV; Technische Informationsbibliothek u. Universitätsbibliothek: Göttingen, Germany, 2013; p. 220. [Google Scholar]
  80. Göttlein, A.; Dieler, D.; Baumgarten, M. Tree-internal Nutrient Distribution of Beech and Spruce at the Kranzberger Forst—Implications for Efficiency of Wood Production and for Nutrient Export with Different Harvest Intensities. Nova Acta Leopold. NF 2013, 114, 255–265. [Google Scholar]
  81. Huber, C.; Borchert, H.; Kremer, J.; Weis, W.; Metthies, D.; Göttlein, A. Biomasse-und Nährelementverschiebungen bzw.-verluste bei Harvesterdurchforstungen und deren Auswirkungen auf Bodeneigenschaften und Stoffhaushalt von Waldökosystemen. Abschlussbericht zum Projekt B65 des Kuratoriums für forstliche Forschung in Bayern; LWF: Freising, Germany, 2011; p. 95. [Google Scholar]
  82. Pretzsch, H.; Block, J.; Dieler, J.; Gauer, J.; Göttlein, A.; Moshammer, R.; Schuck, J.; Weis, W.; Wunn, U. Nährstoffentzüge durch die Holz- und Biomassenutzung in Wäldern. Teil 1: Schätzfunktionen für Biomasse und Nährelemente und ihre Anwendung in Szenariorechnungen. Allg. Forst- Und Jagdztg. 2014, 185, 261–285. [Google Scholar]
  83. Rademacher, P.; Schönfelder, E.; Meiwes, K.J. Elementgehalte in Baumkompartimenten von Fichte (Picea abies [L.] Karst), Kiefer (Pinus sylvestris [L.] Karst), Buche (Fagus sylvatica [L.] Karst), (Eiche Quercus robur und petraea [L.] Karst) und Douglasie (Pseudotsuga menziesii [L.] Karst). Forsch.: Möglichkeiten Und Grenzen Der Vollbaumnutzung (FKZ: 22015407) 2012, 125–154. Available online: https://www.fnr-server.de/ftp/pdf/berichte/22015407.pdf (accessed on 14 April 2022).
  84. Rumpf, S.; Husmann, K.; Döbbeler, H.; Spellmann, H.; Nagel, J.; Meiwes, K.J. Ergebnisbericht. Verbundvorhaben: Bioenergie-Regionen Stärken (BEST)-Neue Systemlösungen im Spannungsfeld Ökologischer, Ökonomischer und Sozialer Anforderungen-Teilprojekt: Schwachholzpotenzial Wald (IO-H 4)-Entscheidungswerkzeuge zur Sicherung Einer Nachhaltigen Rohstoffversorgung für die Stoffliche und Energetische Verwertung; BMBF (FKZ: 003L033F). 2014. Available online: https://www.fisaonline.de/projekte-finden/details/?tx_fisaresearch_projects%5Bp_id%5D=5961&tx_fisaresearch_projects%5Baction%5D=projectDetails&tx_fisaresearch_projects%5Bcontroller%5D=Projects&cHash=c53771cb89d9664b6f6634165a180a60 (accessed on 20 February 2022).
  85. Weis, W.; Gruber, A.; Huber, C.; Göttlein, A. Element concentrations and storage in the aboveground biomass of limed and unlimed Norway spruce trees at Höglwald. Eur. J. For. Res. 2009, 128, 437–445. [Google Scholar] [CrossRef]
  86. Weis, W.; Göttlein, A. Appendix. In Stoffliche Nachhaltigkeitskriterien für die Bayerische Forstwirtschaft. Abschlussbericht zum Projekt B67 des Kuratoriums für Forstliche Forschung in Bayern; TUM: München, Germany, 2012; p. 140. [Google Scholar]
  87. Weis, W.; Blumenthal, B.; Göttlein, A. Baumartenvergleich in intakten Altbeständen. Forstl. Forsch. Ber. Münch. 2014, 212, 13–38. [Google Scholar]
  88. Weis, W.; Göttlein, A. Bewirtschaftungsmöglichkeiten zur Sicherung einer nachhaltigen Waldwirtschaft vor dem Hintergrund der Nährstoffversorgung kalkalpiner Standorte. Forstl. Schr. Univ. Für Bodenkult. Wien 2016, 21, 97–127. [Google Scholar]
  89. Miller, D.M. Reducing Transformation Bias in Curve Fitting. Am. Stat. 1984, 38, 124–126. [Google Scholar] [CrossRef]
  90. Forests, ICP. Manual on Methods and Criteria for Harmonized Sampling, Assessment, Monitoring and Analysis of the Effects of Air Pollution on Forests. Available online: http://icp-forests.net/page/icp-forests-manual (accessed on 12 February 2021).
  91. Greve, M. Langfristige Auswirkungen der Waldkalkung auf den Stoffhaushalt. Mitt. Aus Der Forsch. Für Wald. Und Forstwirtsch. Rheinl.-Pfalz. 2015, 73, 333. [Google Scholar]
  92. Huber, C.; Baier, R.; Göttlein, A.; Weis, W. Changes in soil, seepage water and needle chemistry between 1984 and 2004 after liming an N-saturated Norway sprcue stand at the Höglwald, Germany. For. Ecol. Manage. 2006, 233, 11–20. [Google Scholar] [CrossRef]
  93. Zirlewagen, D. Regionalisierung der Bodenbilanz an BWI-Punkten. Freibg. Forstl. Forsch. 2018, 101, 227–241. [Google Scholar]
  94. Kolka, R.K.; Grigal, D.F.; Nater, E.A. Forest soil mineral weathering rates: Use of multiple approaches. Geoderma 1996, 73, 1–21. [Google Scholar] [CrossRef]
  95. Oenema, O.; Kros, H.; de Vries, W. Approaches and uncertainties in nutrient budgets: Implications for nutrient management and environmental policies. Eur. J. Agron. 2003, 20, 3–16. [Google Scholar] [CrossRef]
  96. Cartwright, S.J.; Bowgen, K.M.; Collop, C.; Hyder, K.; Nabe-Nielsen, J.; Stafford, R.; Stillman, R.A.; Thorpe, R.B.; Sibly, R.M. Communicating complex ecological models to non-scientist end users. Ecol. Model. 2016, 338, 51–59. [Google Scholar] [CrossRef] [Green Version]
  97. Arrouays, D.; McBratney, A.; Bouma, J.; Libohova, Z.; Richer-de-Forges, A.C.; Morgan, C.L.S.; Roudier, P.; Poggio, L.; Mulder, V.L. Impressions of digital soil maps: The good, the not so good, and making them ever better. Geoderma Reg. 2020, 20, e00255. [Google Scholar] [CrossRef]
  98. Yanai, R.D.; Battles, J.J.; Richardson, A.D.; Blodgett, C.A.; Wood, D.M.; Rastetter, E.B. Estimating Uncertainty in Ecosystem Budget Calculations. Ecosystems 2010, 13, 239–248. [Google Scholar] [CrossRef] [Green Version]
  99. Li, H.; Wu, J. Uncertainty analysis in ecological studies. In Scaling and Uncertrainty Analysis in Ecology: Methods and Applications; Wu, J., Jones, K.B., Li, H., Loucks, O.L., Eds.; Springer: Cham, Switzerland, 2006; pp. 45–66. [Google Scholar]
  100. Constantine, W.; Hesterberg, T.; Wittkowski, K.; Song, T.; Kaluzny, S. splus2R: Supplemental S-PLUS Functionality in R. R Package Version 1.2-0. 2013. Available online: http://CRAN.R-project.org/package=splus2R (accessed on 14 April 2022).
  101. Posch, M.; Vries de, W.; Sverdrup, H. Mass Balance models to derive critical loads of nitrogen and acidity for terrestrial and aquatic ecosystems. In Critical Loads and Dynamic Risk Assessments; de Vries, W., Hettelingh, J.-P., Posch, M., Eds.; Environmental Pollution; Springer: Dordrecht, The Netherlands, 2015; Volume 25, pp. 171–205. [Google Scholar]
  102. de Vries, W.; Breeuwsma, A. Relative importance of natural and anthropogenic proton sources in soils in the netherlands. Water Air Soil Pollut. 1986, 28, 173–184. [Google Scholar] [CrossRef]
  103. Breemen, N.V.; Visser, P.H.B.D.; Grinsven, J.J.M.V. Nutrient and proton budgets in four soil-vegetation systems underlain by Pleistocene alluvial deposits. J. Geol. Soc. 1986, 143, 659–666. [Google Scholar] [CrossRef]
  104. Mulder, J.; Breemen, N.V.; Rasmussen, L.; Driscoll, C.T. Aluminum chemistry of acidic sandy soils with various inputs of acidic deposition in The Netherlands and in Denmark. In Impact of Acid Atmospheric Deposition on Soils: Field Monitoring and Aluminum Chemistry; Mulder, J., Ed.; United States Environmental Protection Agency: Washington, DC, USA, 1990; pp. 77–102. [Google Scholar]
  105. van der Salm, C.; Köhlenberg, L.; de Vries, W. Assessment of weathering rates in Dutch loess and river-clay soils at pH 3.5, using laboratory experiments. Geoderma 1998, 85, 41–62. [Google Scholar] [CrossRef]
  106. van der Salm, C. Assessment of the regional variation in weathering rates of loess and clay soils in the netherlands. Water Air Soil Pollut. 2001, 131, 217–243. [Google Scholar] [CrossRef] [Green Version]
  107. Kauppi, P.; Kamari, J.; Posch, M.; Kauppi, L.; Matzner, E. Acidification of forest soils: Model development and application for analyzing impacts of acidic deposition in Europe. Ecol. Model. 1986, 33, 231–253. [Google Scholar] [CrossRef] [Green Version]
  108. Klaminder, J.; Lucas, R.W.; Futter, M.N.; Bishop, K.H.; Köhler, S.J.; Egnell, G.; Laudon, H. Silicate mineral weathering rate estimates: Are they precise enough to be useful when predicting the recovery of nutrient pools after harvesting? For. Ecol. Manag. 2011, 261, 1–9. [Google Scholar] [CrossRef]
  109. Futter, M.N.; Klaminder, J.; Lucas, R.W.; Laudon, H.; Köhler, S.J. Uncertainty in silicate mineral weathering rate estimates: Source partitioning and policy implications. Environ. Res. Lett. 2012, 7, 8. [Google Scholar] [CrossRef]
  110. Hodson, M.E.; Langan, S.J.; Wilson, M.J. A critical evaluation of the use of the profile model in calculating mineral weathering rates. Water Air Soil Pollut. 1997, 98, 79–104. [Google Scholar] [CrossRef]
  111. Langan, S.; Hodson, M.E.; Bain, D.; Hornung, M.; Reynolds, B.; Hall, J.; Johnston, L. The role of minerals weathering rate determinations in generating uncertainties in the calculation of critical loads of acidity and their exceedance. Water Air Soil Pollut. Focus 2001, 1, 299–312. [Google Scholar] [CrossRef]
  112. Vadeboncoeur, M.A.; Hamburg, S.P.; Yanai, R.D.; Blum, J.D. Rates of sustainable forest harvesting depend on rotation length and weathering of soil minerals. For. Ecol. Manag. 2014, 318, 194–205. [Google Scholar] [CrossRef] [Green Version]
  113. Wesselink, L.G.; Van Grinsven, J.J.M.; Grosskurth, G.F. Measuring and Modeling Mineral Weathering in an Acid Forest Soil, Solling, Germany. Soil Sci. Soc. Am. Spec. Publi. 1994, 39, 91–110. [Google Scholar] [CrossRef]
  114. Dultz, S. Veränderung des mineralogischen Stoffbestandes in Böden aus pleistozänen Sedimenten Nordwestdeutschland und deren Bedeutung für die Elementfreisetzung. Ber. Forsch.zent. Waldökosyst. 2001, 172, 1–201. [Google Scholar]
  115. Hodson, M.E.; Langan, S. Considerations of uncertainty in setting critical loads of acidity of soils: The role of weathering rate determination. Environ. Pollut. 1999, 106, 73–81. [Google Scholar] [CrossRef]
  116. Starr, M.; Lindroos, A.-J.; Tarvainen, T.; Tanskanen, H. Weathering rates in the Hietajäri Integrated monitoring catchment. Boreal Environ. Res. 1998, 3, 275–285. [Google Scholar]
  117. Starr, M.; Lindroos, A.-J.; Ukonmaanaho, L. Weathering release rates of base cations from soils within a boreal forested catchment: Variation and comparison to deposition, litterfall and leaching fluxes. Environ. Earth. Sci. 2014, 75, 5101–5111. [Google Scholar] [CrossRef]
  118. Dämmgen, U.; Matschullat, J.; Zimmermann, F.; Strogies, M.; Grünhage, L.; Scheler, B.; Conrad, J. Emission reduction effects on bulk and wet-only deposition in Germany—Evidence from long-term observations. Part 2: Precipitation, potential sea salt, soil and fly ash constituents. Gefahrst. Reinhalt. Der Luft Air Qual. Control 2013, 72, 25–36. [Google Scholar]
  119. McNulty, S.G.; Cohen, E.C.; Moore Myers, J.A.; Sullivan, T.J.; Li, H. Estimates of critical acid loads and exceedances for forest soils across the conterminous United States. Environ. Pollut. 2007, 149, 281–292. [Google Scholar] [CrossRef] [PubMed]
  120. Mussche, S.; Bussche, B.; De Schrijver, A.; Neirynck, J.; Nachtergale, L.; Lust, N. Nutrient uptake of a mixed oak/beech forest in Flanders (Belgium). Silva Gandav. 1998, 63, 120–133. [Google Scholar] [CrossRef] [Green Version]
  121. Zhao, Y.; Duan, L.; Larssen, T.; Hu, L.; Hao, J. Simultaneous Assessment of Deposition Effects of Base Cations, Sulfur, and Nitrogen Using an Extended Critical Load Function for Acidification. Environ. Sci. Technol. 2007, 41, 1815–1820. [Google Scholar] [CrossRef] [PubMed] [Green Version]
  122. Duchesne, L.; Houle, D. Impact of nutrient removal through harvesting on the sustainability of the boreal forest. Ecol. Appl. 2008, 18, 1642–1651. [Google Scholar] [CrossRef] [PubMed]
  123. Casetou-Gustafson, S.; Grip, H.; Hillier, S.; Linder, S.; Olsson, B.A.; Simonsson, M.; Stendahl, J. Current, steady-state and historical weathering rates of base cations at two forest sites in northern and southern Sweden: A comparison of three methods. Biogeosciences 2020, 17, 281–304. [Google Scholar] [CrossRef] [Green Version]
  124. Etzold, S.; Ferretti, M.; Reinds, G.J.; Solberg, S.; Gessler, A.; Waldner, P.; Schaub, M.; Simpson, D.; Benham, S.; Hansen, K.; et al. Nitrogen deposition is the most important environment driver of growth of pure, even-aged and managed European forests. For. Ecol. Manag. 2020, 458, 117762. [Google Scholar] [CrossRef]
  125. Heppelmann, J.B.; Labelle, E.R.; Wittkopf, S.; Seeling, U. In-stand debarking with the use of modified harvesting heads: A potential solution for key challenges in European forestry. Eur. J. For. Res. 2019, 138, 1067–1081. [Google Scholar] [CrossRef] [Green Version]
  126. Labelle, E.R.; Poltorak, B.J.; Jaeger, D. The role of brush mats in mitigating machine-induced soil disturbances: An assessment using absolute and relative soil bulk density and penetration resistance. Can. J. For. Res. 2019, 49, 164–178. [Google Scholar] [CrossRef]
  127. Richter, A.; Adler, G.H.; Fahrak, M.; Eckelmann, W. Erläuterungen zur Nutzungsdifferenzierten Bodenübersichtskarte der Bundesrepublik Deutschland im Maßstab 1:1.000000 (BÜK 1000 N, Version 2.3); BGR: Hannover, Germany, 2007; p. 53. [Google Scholar]
  128. Schaap, M.; Hendriks, C.; Kranenburg, R.; Kuenen, J.; Segers, A.; Schlutow, A.; Nagel, H.-D.; Ritter, A.; Banzhaf, S. PINETI-3: Modellierung atmosphärischer Stoffeinträge von 2000 bis 2015 zur Bewertung der ökosystem-spezifischen Gefährdung von Biodiversität durch Luftschadstoffe in Deutschland. Texte Umweltbundesamt 2018, 79, 149. [Google Scholar]
  129. Mellert, K.H.; Ewald, J. Nutrient limitation and site-related growth potential of Norway spruce (Picea abies [L.] Karst) in the Bavarian Alps. Eur. J. For. Res. 2014, 133, 433–451. [Google Scholar] [CrossRef]
  130. Beckers, J.; Smerdon, B.; Wilson, M. Review of hydrologic models for forest management and climate change applications in British Columbia and Alberta. Forrex Ser. 2009, 25, 1–179. [Google Scholar]
  131. Ivanovic, R.F.; Freer, J.E. Science versus politics: Truth and uncertainty in predictive modelling. Hydrol. Process. 2009, 23, 2549–2554. [Google Scholar] [CrossRef]
  132. Beven, K.; Freer, J. Equifinality, data assimilation, and uncertainty estimation in mechanistic modelling of complex environmental systems using the GLUE methodology. J. Hydrol. 2001, 249, 11–29. [Google Scholar] [CrossRef]
  133. Zak, S.K.; Beven, K.; Reynolds, B. Uncertainty in the estimation of critical loads: A practical methodology. Water Air Soil Pollut. 1997, 98, 297–316. [Google Scholar] [CrossRef]
  134. Kros, J.; Pebesma, E.J.; Reinds, G.J.; Finke, P.A. Uncertainty asseement in modeling soil acidification at the European scale: A case study. J. Environ. Qual. 1999, 28, 366–377. [Google Scholar] [CrossRef]
  135. Reinds, G.J.; De Vries, W. Uncertainties in critical loads and target loads of sulphur and nitrogen for European forests: Analysis and quantification. Sci. Total Environ. 2010, 408, 1960–1970. [Google Scholar] [CrossRef]
  136. Liski, J.; Palosuo, T.; Peltoniemi, M.; Sievänen, R. Carbon and decomposition model Yasso for forest soil. Ecol. Model. 2005, 189, 168–182. [Google Scholar] [CrossRef]
  137. Zetterberg, T.; Olsson, B.A.; Löfgren, S.; Von Brömssen, C.; Brandtberg, P.-O. The effect of harvest intensity on long-term calcium dynamics in soil and soil solution at three coniferous sites in Sweden. For. Ecol. Manag. 2013, 302, 280–294. [Google Scholar] [CrossRef]
  138. Löfgren, S.; Stendahl, J.; Karltun, E. Critical biomass harvesting indicator for whole-tree extraction does not reflect the sensitivity of Swedish forest soils. Ecol. Indic. 2021, 132, 108310. [Google Scholar] [CrossRef]
  139. Wallman, P.; Svensson, M.G.E.; Sverdrup, H.; Belyazid, S. ForSAFE—An integrated process-oriented forest model for long-term sustainability assessments. For. Ecol. Manag. 2005, 207, 19–36. [Google Scholar] [CrossRef]
  140. Fleck, S.; Ahrends, B.; Sutmöller, J.; Albert, M.; Evers, J.; Meesenburg, H. Is Biomass Accumulation in Forests an Option to Prevent Climate Change Induced Increases in Nitrate Concentrations in the North German Lowland? Forests 2017, 8, 219. [Google Scholar] [CrossRef] [Green Version]
  141. Meesenburg, H.; Riek, W.; Ahrends, B.; Eickenscheidt, N.; Grüneberg, E.; Evers, J.; Fortmann, H.; Köng, N.; Lauer, A.; Meiwes, K.J.; et al. Soil Acidification in German Forest Soils. In Status and Dynamics of Forests in Germany; Wellbrock, N., Bolte, A., Eds.; Springer Nature Switzerland AG: Cham, Switzerland, 2019; Volume 237, pp. 93–120. [Google Scholar]
  142. Jansone, L.; von Wilpert, K.; Hartmann, P. Natural Recovery and Liming Effects in Acidified Forest Soils in SW-Germany. Soil Syst. 2020, 4, 38. [Google Scholar] [CrossRef]
  143. Sarenbo, S.L.; Claesson, T. Limestone and dolomite powder as binders for wood ash agglomeration. Bull. Eng. Geol. Environ. 2004, 63, 191–207. [Google Scholar] [CrossRef]
  144. Von Wilpert, K.; Vonderach, C.; Zirlewagen, D. Enna-A project for sustainable harvesting wooden biomass. VGB PowerTech 2015, 7, 83–88. [Google Scholar]
  145. von Wilpert, K.; Hartmann, P.; Schäffer, J. Quality control in a wood ash re-cycling concept for forests. VGB Powertech 2016, 4, 64–72. [Google Scholar]
  146. Andreae, H.; Gemballa, R.; Jacob, F. Leitfaden zur Forstlichen Bodenschutzkalkung in Sachsen. Sachs. Forst Schr. 2020, 31, 1–102. [Google Scholar]
  147. Helmisaari, H.-S.; Hanssen, K.H.; Jacobson, S.; Kukkola, M.; Luirod, J.; Saarsalmi, A.; Tamminen, P. Logging residue removal after thinning in Nordic boreal forests: Long-term impact on tree growth. For. Ecol. Manag. 2011, 261, 1919–1927. [Google Scholar] [CrossRef]
  148. Baule, H.; Fricker, C. Die Düngung von Waldbäumen; BVL Verlagsgesellschaft: München, Germany, 1967; p. 259. [Google Scholar]
  149. Hüttl, R.F.; Zoettl, H.W. Liming as a mitigation too in Germany’s declining forests—Reviewing results from former and recent trials. For. Ecol. Manag. 1993, 61, 325–338. [Google Scholar] [CrossRef]
  150. Talkner, U.; Riek, W.; Dammann, I.; Kohler, M.; Göttlein, A.; Mellert, K.H.; Meiwes, K.J. Nutritional Status of Major Forest Tree Species in Germany. In Status and Dynamics of Forests in Germany: Results of the National Forest Monitoring; Wellbrock, N., Bolte, A., Eds.; Springer International Publishing: Cham, Switzerland, 2019; pp. 261–293. [Google Scholar]
  151. Huber, C.; Weis, W.; Göttlein, A. Tree nutrition of Norway spruce as modified by liming and experimental acidification at the Höglwald site, Germany, from 1982 to 2004. Ann. For. Sci. 2006, 63, 861–869. [Google Scholar] [CrossRef]
  152. Lundström, U.S.; Brain, D.C.; Taylor, A.F.S.; Van Hees, A.W.; Geibe, C.E.; Holmström, S.J.M.; Melkerud, P.-A.; Finlay, R.; Jones, D.L.; Nyberg, L.; et al. Effects of acidification and its mitigation with lime and wood ash on forest soil processes in Southern Schweden. A Joint Multidisciplinary Study. Water Air Soil Pollut. Focus 2003, 3, 167–188. [Google Scholar] [CrossRef]
  153. Reid, C.; Watmough, S.A. Evaluation the effects of liming and wood-ash treatment on forest ecosystems through systematic meta-analysis. Can. J. For. Res. 2014, 44, 867–885. [Google Scholar] [CrossRef]
  154. Kreutzer, K. Effect of forest liming on soil processes. Plant Soil 1995, 168–169, 447–470. [Google Scholar] [CrossRef]
  155. Hüttl, R.F. Liming and fertilization as mitigation tools in declining forest ecosystems. Water Air Soil Pollut. 1989, 44, 93–118. [Google Scholar] [CrossRef]
  156. Seidling, W.; Hansen, K.; Strich, S.; Lorenz, M. Part I: Objectives, Strategy and Implementation of ICP Forests. In Manual on Methods and Criteria for Harmonized Sampling, Assessment, Monitoring and Analysis of the Effects of Air Pollution on Forests, Manual Version 2016; UNECE ICP Forests, Programme Coordinating Centre, Ed.; Thünen Institute of Forest Ecosystems: Eberswalde, Germany, 2016; Available online: https://www.icp-forests.org/pdf/manual/2016/ICP_Manual_2017_02_part01.pdf (accessed on 26 February 2022).
  157. Pretzsch, H. Forest Dynamics, Growth and Yield: From Measurement to Model; Springer: Berlin, Germany, 2009; p. 664. [Google Scholar]
  158. Wood, S.N. Generalized Additive Models: An Introduction with R; Chapman & Hall: Boca Raton, FL, USA, 2006; p. 410. [Google Scholar]
  159. Venables, W.N.; Ripley, B.D. Modern Applied Statistics with S; Springer: New York, NY, USA, 2003; p. 495. [Google Scholar]
  160. Pinheiro, J.; Bates, D.; Debroy, S.; Sarkar, D.; Team, R.C. nlme: Linear and Nonlinear Mixed Effects Models. R Package Version 3.1-103. 2008. Available online: https://cran.r-project.org/web/packages/nlme/index.html (accessed on 26 August 2016).
  161. Mohr, K.; Meesenburg, H.; Horvath, B.; Meiwes, K.J.; Schaaf, S.; Dämmgen, U. Bestimmung von Ammoniak-Einträgen aus der Luft und deren Wirkungen auf Waldökosysteme (ANSWER-Projekt); Bundesforschungsanstalt für Landwirtschaft (FAL): Braunschweig, Germany, 2005; Volume 279, p. 113. [Google Scholar]
  162. Kues, J. Untersuchungen zum Stoffeintrag in den Göttinger Wald. Ber. Forsch.zent. Waldökosyst./Waldsterben 1984, 6, 206. [Google Scholar]
  163. Harrell, F.E., Jr. Hmisc: Harrell Miscellaneous. R Package Version 3.13-0. 2013. Available online: http://CRAN.R-project.org/package=Hmisc (accessed on 21 May 2015).
  164. Sachs, L. Angewandte Statistik. 9 Auflage; Springer: Berlin, Germany, 1999; p. 881. [Google Scholar]
  165. Ahrends, B.; Wagner, M.; Klinck, U. Herleitung flächiger Depositionsdaten. Ber. Freibg. Forstl. Forsch. 2018, 101, 150–180. [Google Scholar]
  166. Ahrends, B.; Klinck, U.; Klinck, C.; Weis, W. Herleitung flächiger Verwitterungsraten. Freibg. Forstl. Forsch. 2018, 101, 113–149. [Google Scholar]
  167. Ahrends, B.; Vonderach, C.; Weis, W.; Wilpert, V.K. Unsicherheitsanalysen zur Nährstoffbilanzierung auf Umweltmessnetzen. Freibg. Forstl. Forsch. 2018, 101, 242–267. [Google Scholar]
  168. De-Miguel, S.; Mehtätalo, L.; Durkaya, A. Developing generalized, calibratable, mixed-effects meta-models for large-scale biomass prediction. Can. J. For. Res. 2014, 44, 648–656. [Google Scholar] [CrossRef]
  169. Metropolis, N.; Ulam, S. The Monte Carlo Method. J. Am. Stat. Assoc. 1949, 44, 335–341. [Google Scholar] [CrossRef]
  170. Bivand, R.; Lewin-Koh, N. Maptools: Tools for Reading and Handling Spatial Objects. R Package Version 0.8-27. 2013. Available online: http://CRAN.R-project.org/package=maptools (accessed on 20 March 2017).
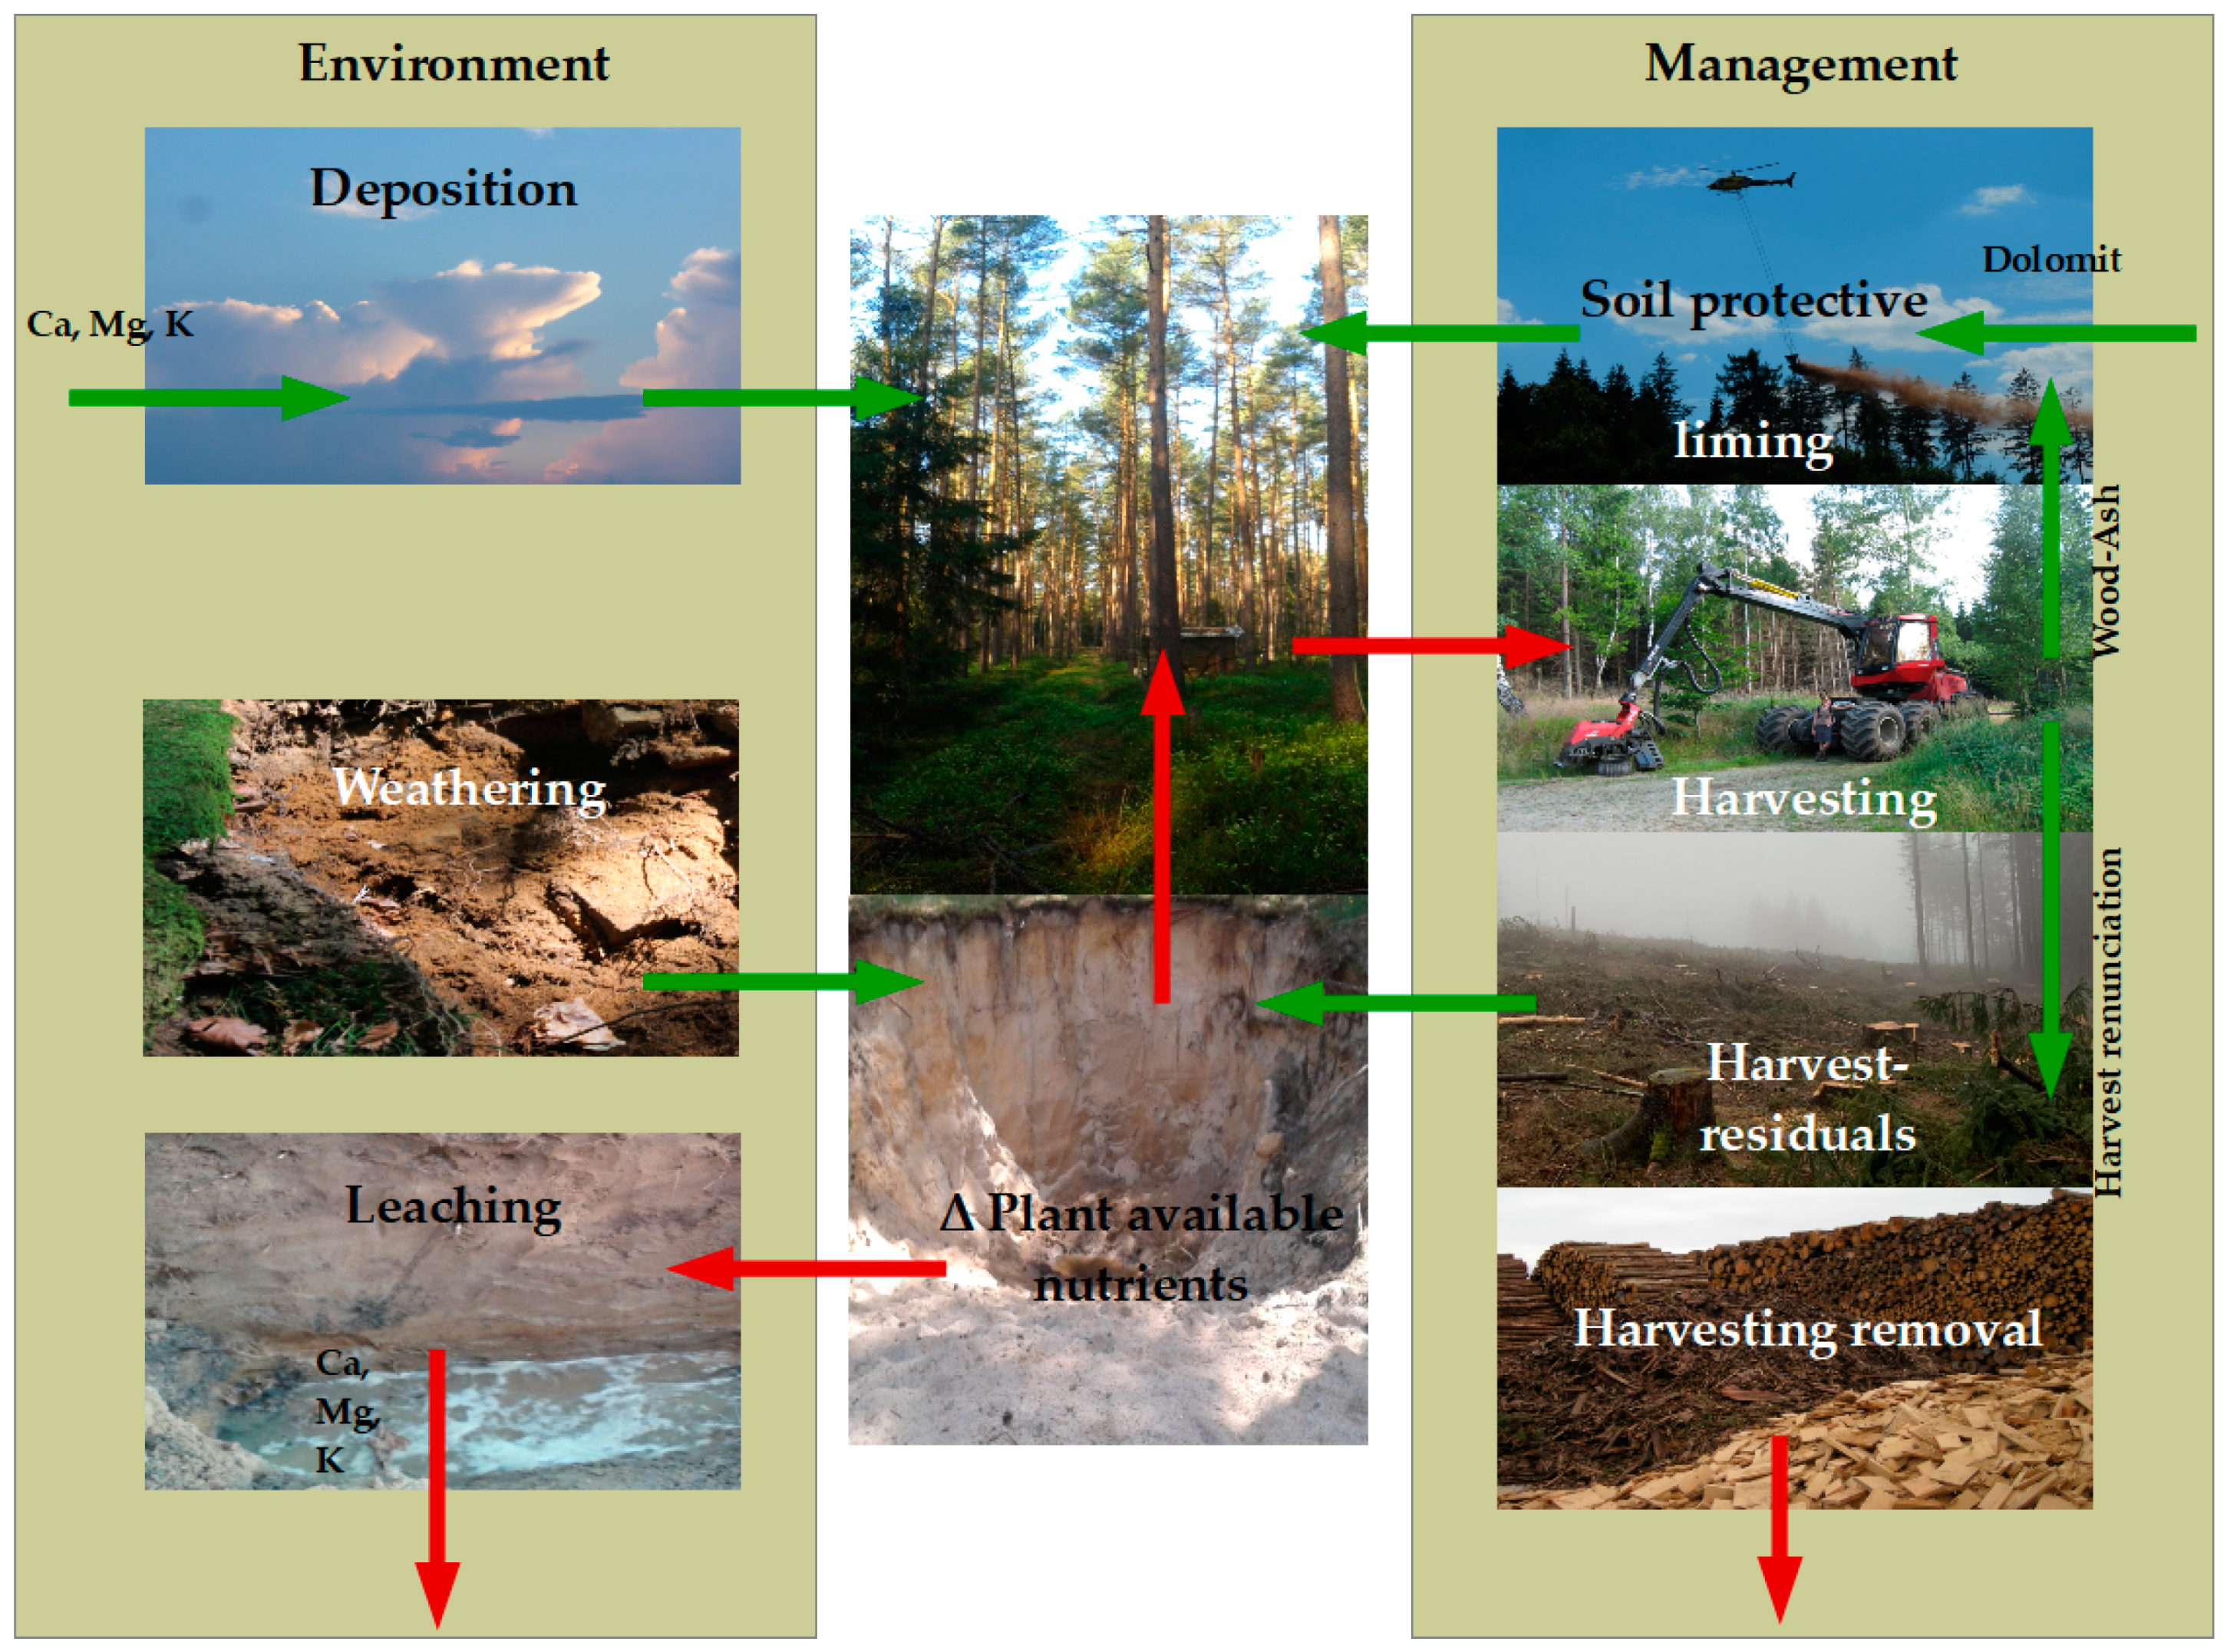
Figure 1. Schematic view of considered element fluxes for soil nutrient balances of Ca, Mg, and K in forest ecosystems and their relationships to each other. One 1000th of the plant-available nutrient stock in the soil is taken into account as an additional input (buffer).
Soilsystems 06 00041 g001
Figure 2. Stratification of Germany in soil landscapes (model regions—(A)) and location of intensive monitoring plots (□), National Forest Soil Inventories (NFSI) plots () and National Forest Inventory (NFI) tracts (▲) in Germany (B). Legend of left map: 1—pre-alpine moraines and limestone Alps; 2—hills on limestone bedrocks; 3—hills on crystalline bedrocks; 4—hills on sand, silt, clay bedrocks; 6—old moraines, north German lowland; 7—young moraines, north German lowland; 8—loess regions, fluvial valleys; 9—hills on clay- and silt schist bedrocks. Note: number 5 was deliberately not assigned.
Soilsystems 06 00041 g002
Figure 3. Median and range data for calcium (A), magnesium (B) and potassium (C) of soil stocks, deposition, weathering, leaching, harvest removal, nutrient balance without harvest (WOH), and nutrient balance with harvest (WH) for NFI tracts in Germany (for Ca and Mg excluding carbonate sites; harvest export for scenario REAL).
Soilsystems 06 00041 g003
Figure 4. Average export of Ca (A), K (B), Mg (C) and biomass (D) at NFI tracts with harvested assortments for the three harvesting intensities MIN, REAL and MAX, differentiated into the biomass compartments wood (red), bark (green) and brushwood with bark (blue). Colour intensity decreasing from stem wood over industrial wood to fuel wood. Harvested wood assortments including bark (minimum diameter ≥ 7 cm) marked by a vertical red line. S.: stem wood, I.: industrial wood, F.: fuel wood, S.T.: brush mat on skid trails.
Soilsystems 06 00041 g004
Figure 5. Effects of different intensities of biomass use on the nutrient balance of calcium (Ca), magnesium (Mg) and potassium (K) at the NFI tracts (scenario MIN: left column; scenario REAL: centre column; scenario MAX: right column). Balance deficits are shown in red, positive balances in blue. The colour intensity indicates the probability of error.
Soilsystems 06 00041 g005
Figure 6. Spatial distribution of the base cations (Ca, Mg and K) that can be exported with the harvest scenarios MIN (yellow), REAL (green) and MAX (turquoise) without leading to negative nutrient balance of one or more elements (A). On the right map (B) the same data analysis is shown, incorporating the uncertainty of the models (α < 0.1) to decide about possible harvest intensity. The sites that show negative (or significantly negative) balances without any harvest are marked in red and the sites where scenario MIN shows negative (or significantly negative) balances in orange.
Soilsystems 06 00041 g006
Table 1. Indicators of model performance for the soil-related balances (weathering + deposition—leaching with seepage) in the validation data set. OBS: number of observations; R²: coefficient of determination; RMSE: root mean squared error [kg ha−1 yr−1]; CVRMSE: standardized RMSE.
RegionOBSCa BalanceMg BalanceK Balance
RMSECVRMSERMSECVRMSERMSECVRMSE
1630.733118.580−8.0240.64035.193−5.9400.6653.9900.454
2440.679111.7002.8770.01538.8152.8700.5094.7260.434
3790.69010.000−2.4210.5276.809−2.6250.5234.1250.563
41260.54025.6314.6260.2268.9323.3690.3445.2130.465
6|7460.6507.7754.5270.5871.9920.7040.8001.5460.305
8310.58436.587−14.4050.3394.1681.4470.3824.6040.611
9610.62312.438−1.5530.3876.041−1.8410.4753.7360.485
Global4500.60562.514−2.0540.44723.164−0.2880.5214.3130.474
Table 2. Medians of the nutrient balances on the NFI tracts stratified by model regions (Ca and Mg only for carbonate-free soils) for the harvest scenario REAL. DEP: deposition; WEA: weathering; LEA: leaching; HAR: harvest removal; WOH: balance without harvesting; WH balance with harvesting.
Soilsystems 06 00041 i001
Table 3. Areas with balance deficits for element combinations Ca and/or Mg, Ca and/or Mg and K and only K for the total forest area of Germany assuming harvest intensity REAL. Presented are all sites with balance deficits and those where balance deficits are at α < 0.1 significant.
Consideration LevelUnitNutrient Element-Combination
CaMgCaMgKK
Area with balance deficitsha4,274,808 (39.4%)1,318,645 (12.2%)662,275 (6.1%)
Area with balance deficits at α < 0.1ha1,625,254 (15%)180,331 (1.7%)208,948 (1.9%)
Required annual treatment areaha yr−1113,740 (1.05%)113,539 (1.05%)46,346 (0.42%)
Required annual treatment area at α < 0.1ha yr−184,961 (0.78%)38,651 (0.36%)41,452 (0.38%)
Publisher’s Note: MDPI stays neutral with regard to jurisdictional claims in published maps and institutional affiliations.