Article

Can Low-Cost, Handheld Spectroscopy Tools Coupled with Remote Sensing Accurately Estimate Soil Organic Carbon in Semi-Arid Grazing Lands?

by
Douglas Jeffrey Goodwin
1,*,
Daniel A. Kane
2,
Kundan Dhakal
3,
Kristofer R. Covey
4,
Charles Bettigole
4,
Juliana Hanle
4,
J. Alfonso Ortega-S.
5,
Humberto L. Perotto-Baldivieso
5,
William E. Fox
6 and
Douglas R. Tolleson
7
1
Texas A&M Natural Resources Institute, College Station, TX 77843-2138, USA
2
School of Forestry and Environmental Studies, Yale University, New Haven, CT 06520, USA
3
Noble Research Institute, Ardmore, OK 73401, USA
4
Skidmore College, Saratoga Springs, NY 12866, USA
5
Caesar Kleberg Wildlife Research Institute, Texas A&M University-Kingsville, Kingsville, TX 78363, USA
6
Texas A&M AgriLife Extension, College Station, TX 77843, USA
7
Texas A&M AgriLife Research, Sonora, TX 76950, USA
*
Author to whom correspondence should be addressed.
Soil Syst. 2022, 6(2), 38; https://doi.org/10.3390/soilsystems6020038
Submission received: 15 March 2022 / Revised: 11 April 2022 / Accepted: 14 April 2022 / Published: 17 April 2022

Abstract

:
Soil organic carbon influences several landscape ecological processes, and soils are becoming recognized as a mechanism to mitigate the negative impacts of climate change. There is a need to define methods and technologies for addressing soils’ spatial variability as well as the time and cost of sampling soil organic carbon (SOC). Visible and near-infrared spectroscopy have been suggested as a sampling tool to reduce inventory cost. We sampled nineteen ranch properties totaling 17,347 ha across Oklahoma and Texas in 2019 to evaluate the effectiveness and accuracy of a handheld reflectometer (Our Sci, Ann Arbor, MI, USA) (370–940 nm) and existing remote sensing approaches to estimate SOC in semi-arid grazing lands. Our data suggest that the Our Sci Reflectometer estimated soil organic carbon with a precision of approximately (±0.3% SOC); however, it was least accurate at higher carbon concentrations. The Our Sci reflectometer, although consistently accurate at lower SOC concentrations, was still less accurate than a model built using only remote sensing and digital soil map data as predictors. Combining the two data sources was the most accurate means of determining SOC. Our results indicated that the Our Sci handheld Vis-NIR reflectometer tested may have only limited applications for reducing inventory costs at scale.

1. Introduction

Soil is the largest terrestrial carbon store on Earth with approximately 1500 Gt of carbon (C) in the top meter [1]. This reservoir has decreased over time due to anthropogenic and natural disturbances, contributing to 78 ± 12 PgC being released to the atmosphere [2]. As a result, sequestering soil carbon by reversing these losses could be an important climate change mitigation strategy [3]. Researchers estimate that over the next 50 years, the global potential of soil organic carbon sequestration and restoration of degraded soils is approximately 0.6–1.2 PgC year−1, suggesting a possible cumulative sink capacity of 30–60 PgC [4]. On decadal time scales, soil can serve as a carbon sink or source depending on climate and land-use history [5]. Consequently, applying soil-health-focused management in agricultural production systems that prioritize rebuilding soil carbon concentrations could provide multiple benefits to both the on-farm production system and society.
Over the last two decades, the desire to quantify soil carbon stocks and their management response have gained increased attention as a climate change mitigation strategy [4,6]. Soil organic carbon sequestration potential in agricultural production systems has been widely reported [7,8,9]. However, the logistical mechanisms of dealing with spatial soil variability pose challenges to accurate soil organic carbon quantification [10]. Along with variability concerns, laboratory analyses can be time- and cost-prohibitive [11]. The utilization of carbon flux models based on remotely sensed data has been an approach that researchers have used to attempt to limit these constraints [12].
Estimating soil carbon content with spectroscopy tools may mitigate cost concerns, as such methods are non-destructive and require less specialized equipment than typical laboratory analyses. Specifically, visible and near-infrared (vis-NIR) spectroscopy has been proposed for rapid in-field carbon estimation [13]. Successful prediction of various soil properties, including soil moisture, soil organic carbon, and total soil nitrogen content, has been accomplished using vis-NIR spectroscopy techniques [14,15,16,17,18,19].
Bench-top spectroscopy instrumentation has been used successfully to predict soil carbon levels [20,21]; however, previous reports demonstrate that field conditions limit the accuracy of these estimates [22]. In-field Vis-NIR spectroscopy has been reported as an effective method of assessing soil organic carbon content [23], but soil moisture and other abiotic and biotic factors can affect the predictive capability of vis-NIR spectroscopy. Thus, spectral reflectance data is suspect to accuracy concerns as soil moisture fluctuates [22]. The integration of geospatial data products and vis-NIR soil spectroscopy to model soil organic carbon content may provide a solution [24].
Comprehensive models for estimating soil organic carbon have been developed using vis-NIR data from global soil libraries [25]; however, these models may lack accuracy at smaller scales. Estimating soil organic carbon at a local scale requires site-specific data; factors such as soil type, plant cover, or precipitation need to be integrated into these models to address the underlying spatial variability [26,27]. Accurate estimation of soil organic carbon could provide valuable decision-support to agricultural producers at a reduced price point over conventional testing, but additional research is needed to refine the process, and to better understand its viability across soil texture classes and depths across a range of soil carbon concentrations. Here we: (a) evaluated the use of the Our Sci Reflectometer (https://our-sci.gitlab.io/manufacturing/reflectometer-tutorials/ (accessed on 10 March 2022)), an open-source, handheld vis-NIR reflectometer for estimating soil organic carbon concentrations in the Southern Great Plains; (b) compared these resulting soil organic carbon estimates with existing prediction models.

2. Materials and Methods

2.1. Study Sites

Data for this study were collected across nineteen participating ranches encompassing approximately 17,347 ha (Figure 1). Selected study ranches were distributed across the Southern Great Plains ecoregion of the United States and appropriately represented six Major Land Resource Areas (MLRAs) (Southern High Plains, Breaks (77E); Central Rolling Red Plains, Eastern Part (78C); Central Rolling Red Prairies (80A); West Cross Timbers (84B); Grand Prairie (85); Texas Blackland Prairie, Northern Part (86A)) and their primary production enterprises.
All participating ranches were beef cattle (Bos taurus taurus) operations and fully integrate management goals around grazing intensity, frequency, and duration within an operational grazing management plan. Forty-two percent of the study site ranches comprised native vegetation only, primarily mid and tall warm-season grasses. However, some areas support shortgrass prairie communities. Fifty-eight percent of the properties in the study had a complement of introduced pasture, primarily bermudagrass (Cynodon dactylon (L.) Pers.), and some cropland. Although most of the study site ranches had a diversity of land uses, most of the randomly selected sampling locations were on rangeland due to rangelands comprising most of the total acreage. Around 72.2% of the randomly selected sampling locations were on rangelands, compared to 15.3 and 12.5% for pasture and cropland, respectively. As mentioned earlier, beef cattle production is the dominant agricultural enterprise; however, dryland winter wheat (Triticum aestivum L.) and other small grains are grown for either cash or feed crops. Other crops, mainly corn (Zea mays L.), grain sorghum (Sorghum bicolor L. Moench), and other forage crops are produced depending on market drivers, on the more productive soils. According to the USDA-Natural Resources Conservation Service [28], the regional land management issues on rangeland are excessive grazing, dispersion of invasive woody plants, and noxious weeds. The primary land management issues on cropland are wind and water soil erosion and soil organic matter loss. Water quality and quantity concerns are also significant, primarily due to sediment and nutrient loading.
The dominant soil orders in the represented MLRAs are Mollisols, Alfisols, and Vertisols. The annual average precipitation in this area ranges from 635 to 965 mm. The yearly amount of precipitation can vary widely from year to year, with the predominance occurring as high-intensity, convective thunderstorms during spring and fall. The average annual temperature is 14 to 18 °C. The freeze-free period averages 235 days and ranges from 205 to 265 days, respectively [28].

2.2. Sampling Design

Soil sampling sites were selected through stratified random sampling with the web application Stratifi [29]. The web app uses an unsupervised classification algorithm, WEKA X-Means [30], to incorporate data on vegetation productivity (Landsat 8 derived indices; 30 m resolution), topography/slope/aspect (National Elevation Dataset; 10 m resolution), and soil properties (gSSURGO 30 m resolution) within a pre-defined study area to define a series of “strata” or areas with similar combinations of the above attributes. The WEKA X-Means algorithm automatically selects the appropriate number of strata based on the variability of input layers within the study area. Stratifi then chooses a series of random sampling sites based on the desired sampling density and the relative size of each stratum.
Initial sampling locations were generated at double the desired density, then on-site verification determined the accessibility of each sampling location. An edge buffer constraint was added to each stratum, and sampling locations were generated as not to exceed a 20 m buffer distance to the edge. The verification process selected points in numerical order until the desired sampling density was met. Sampling density was set at a minimum of five sites per strata and 1 site per 32.38 ha. If a sampling point was inaccessible, a secondary and tertiary sampling protocol was randomly selected within this buffer zone. If the subsequent backup protocols did not satisfy the sampling density, additional randomized sampling locations were generated in the Stratifi application, and the process repeated until the sampling density goal was met. Inaccessible regions with steep slopes, high brush density, or other safety concerns were excluded from strata.

2.3. Soil Sampling

Soil sampling was conducted in 2019. In total, 1738 soil samples were collected at multiple depths from 519 identified sampling locations. At each sampling location, soils were sampled with a Giddings™ soil probe (7.62 cm, Giddings Machine Company, Windsor, CO, USA) to a total depth of 90 cm and vertically stratified by depth (15, 30, 45, 60, 75, and 90 cm) or until bedrock restricted collection. Samples were transported to the Noble Research Institute’s soil laboratory for further processing and analysis. Soil samples were milled with an Agvise soil grinder (<2 mm screen) and dried in an oven at 42 °C for 48 h. Dried soil samples were scanned in the lab with the Our Sci reflectometer (https://our-sci.gitlab.io/manufacturing/reflectometer-tutorials/ (accessed on 10 March 2022)). The device is a handheld reflectometer designed to measure the reflectance of a material sample at a select set of wavelengths: 370, 395, 420, 530, 605, 650, 730, 850, 880, and 940 nm. To measure the reflectance, a soil sample is prepared in a small glass petri dish or cuvette and clamped into position in front of a series of LEDs at the wavelengths mentioned earlier. These LEDs then sequentially flash onto the soil sample, and a set of photoreceptors measure the reflectance of the sample at each isolated wavelength. Later, the soil samples were sent to a commercial laboratory where the industry standard, the dry combustion method, was used to analyze soil organic carbon [31].

2.4. Statistical Analysis

Since all samples were geo-tagged in the field, we were able to extract relevant data for each sample point from a various remote sensing datasets and digital soil maps. We focused on collecting data types that would add potential predictive power to our models for estimating soil C content, such as soil taxonomy, Normalized Differential Vegetation Index (NDVI), and clay content (Table 1).
For each point, we identified the most representative soil series as reported by the United States Department of Agriculture’s SSURGO [32] and then extracted soil characterization data related to that series. Characterization data included representative estimates of soil organic matter content; soil chemical properties related to the weathering status of soils (pH and cation exchange capacity); estimates of inorganic carbon content (gypsum and CaCO3); relative content of soil textural components (sand, silt, clay); data on soil color as scored on the Munsell color system.
NDVI was calculated as the normalized difference between band 8 (NIR, 835.1 nm) and band 4 (red, 664.5 nm) of the Sentinel 2 Multi-spectral Instrument dataset from the European Space Agency. To calculate NDVI at each sampling point, we retrieved Level 1-C Sentinel 2 reflectance data for a bounding box containing the entire sampling area using the ee package [33] in Python to access the Google Earth Engine data catalog. Data were retrieved for all available dates from 1 January 2019 to 31 December 2019. Images for each date were then cloud-masked using the QA60 band from Sentinel 2 for the corresponding date to identify and remove all pixels obscured by clouds. Finally, a ‘greenest pixel’ composite image of the study area was created by selecting the highest NDVI value across the date range for each pixel. Specific NDVI values for each sample point were then extracted from this composite image by overlaying point coordinates and finding the corresponding NDVI value.
Topographic data were similarly retrieved for each point by accessing the Google Earth Engine data catalog with the ee package in Python. Using the same bounding box, we retrieved elevation data from the USGS National Elevation Dataset for the entire study area. Slope and aspect were then derived from elevation data using the Google Earth Engine ee.terrain.products function. Specific values of elevation, slope, and aspect were then extracted for each sample point by overlaying the coordinates on each final image.
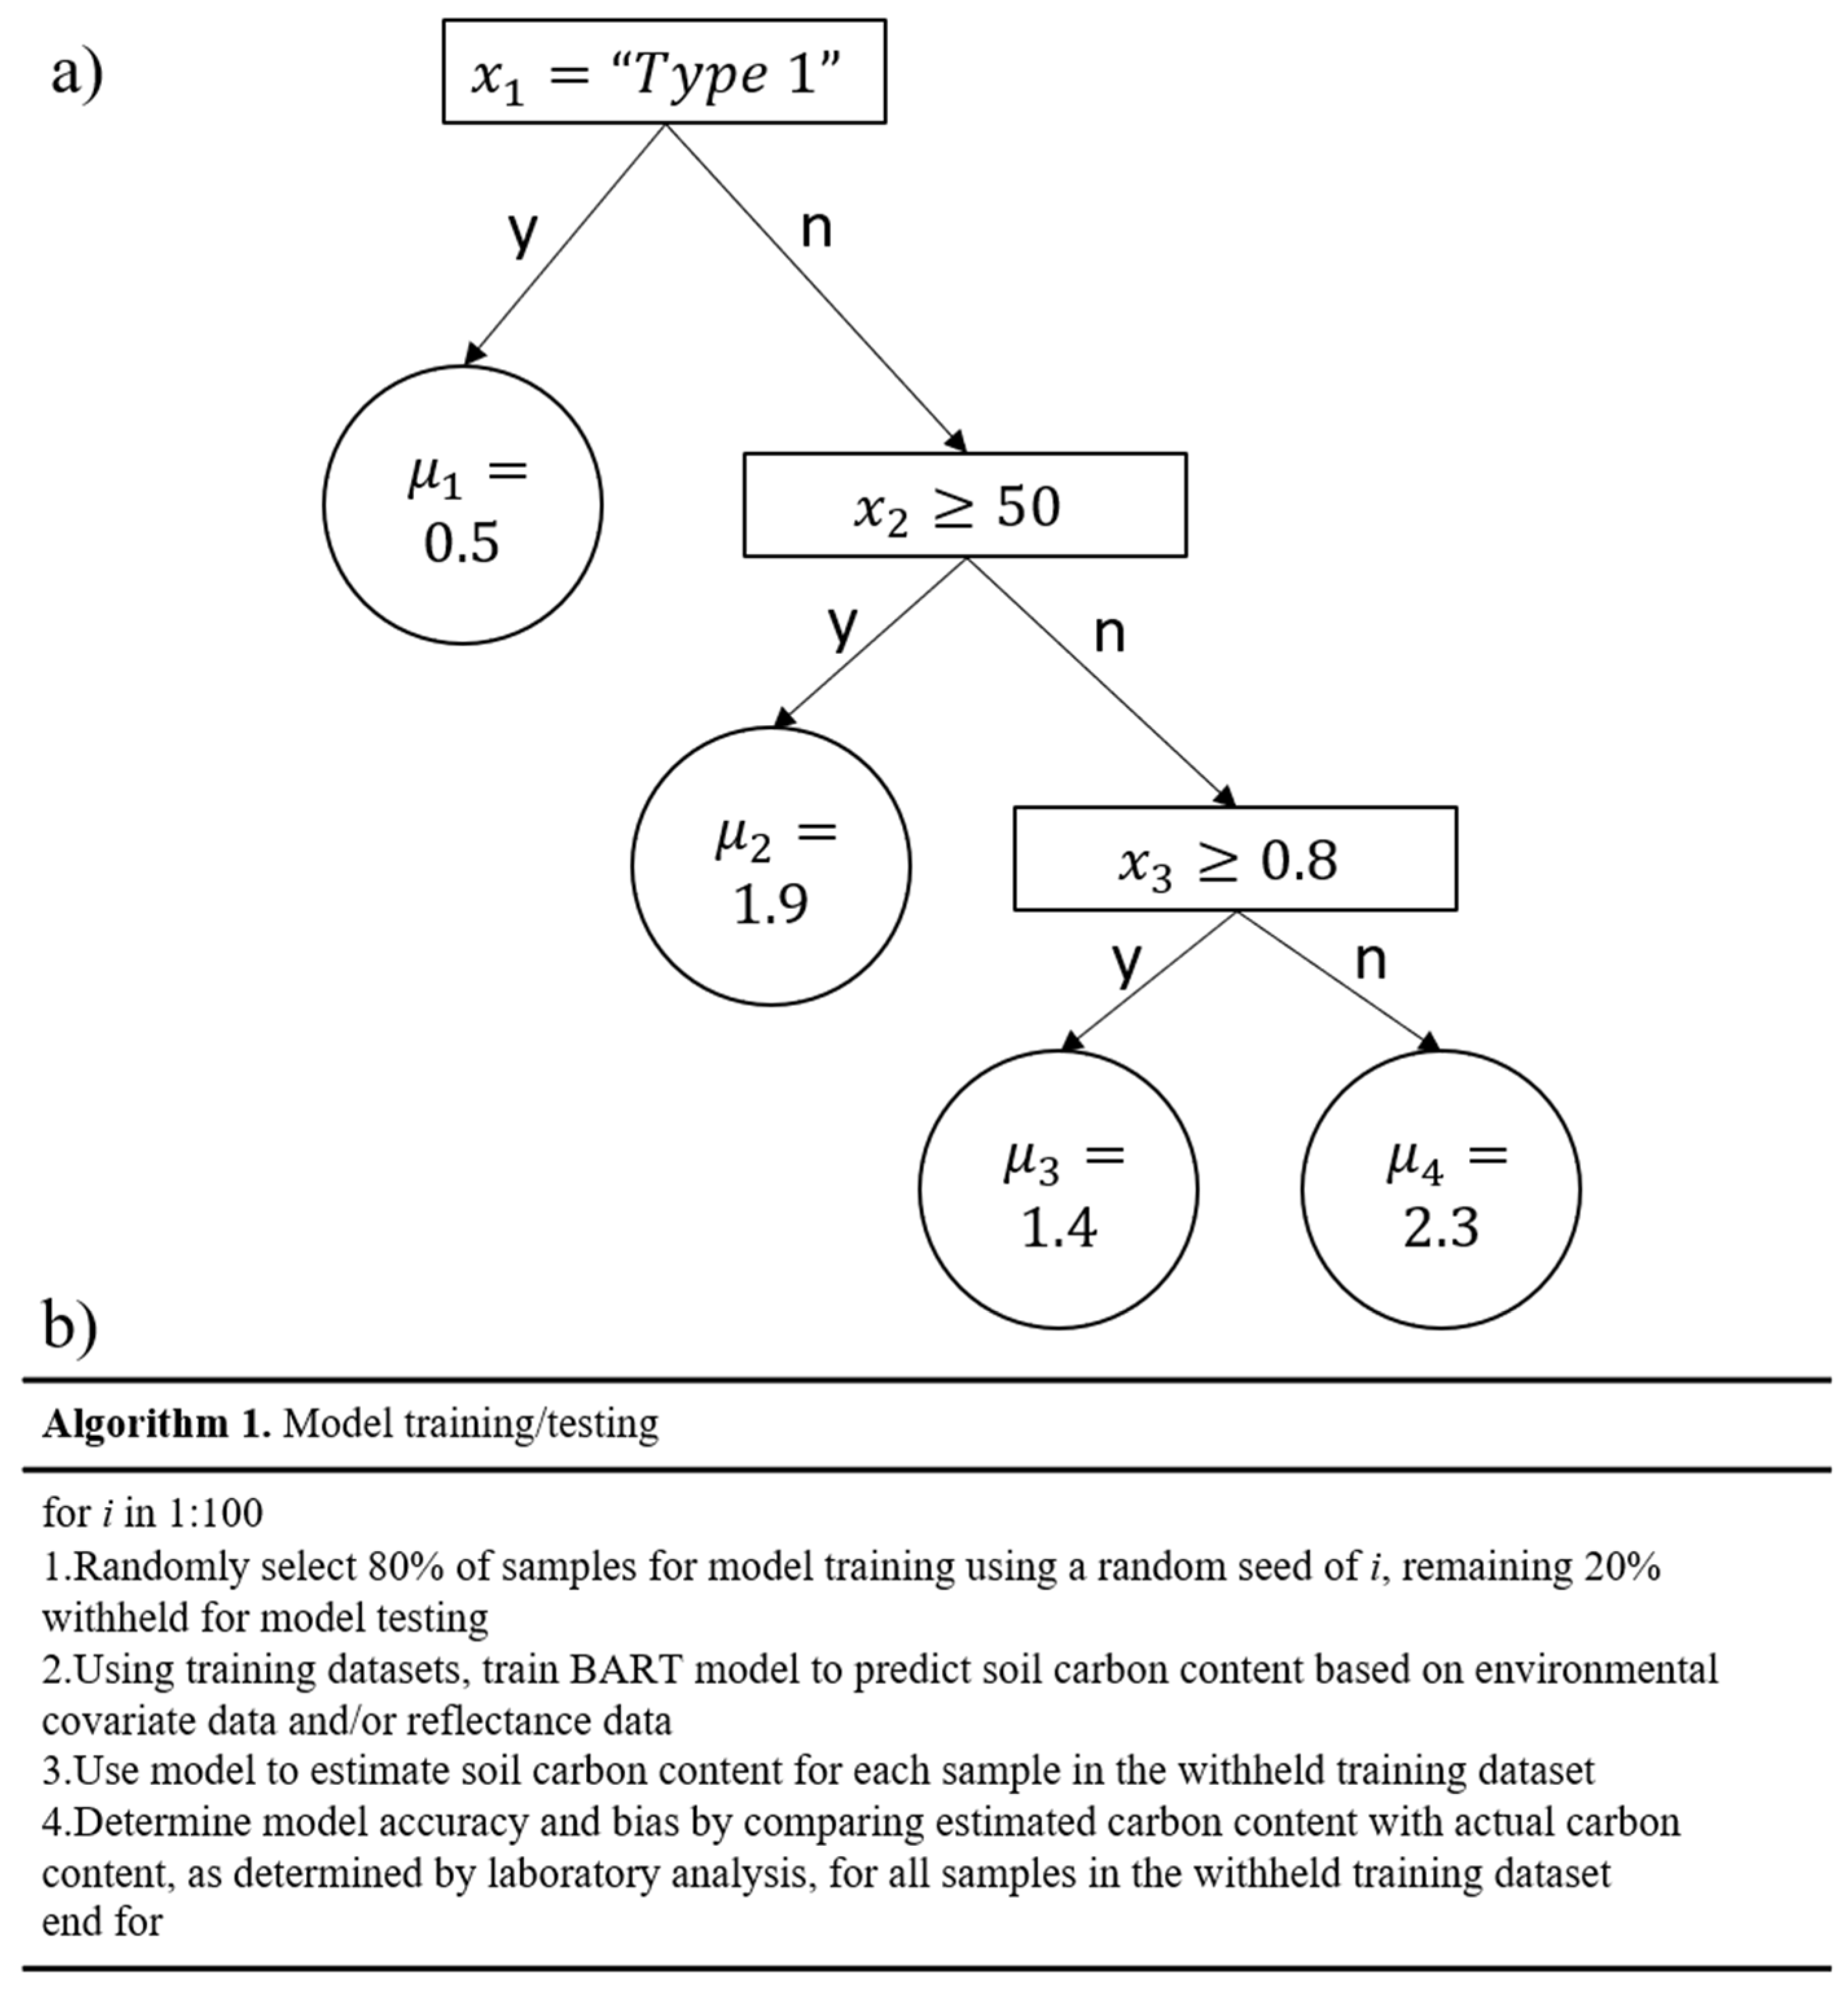
We then developed three models to estimate soil carbon content by the following: (1) using reflectance data collected using the Our Sci reflectometer, herein referred to as “reflectance” models; (2) using data extracted from remote sensing and digital soil maps (DSM), herein referred to as “remote” models; (3) reflectance data collected using the Our Sci reflectometer in combination with data extracted from remote sensing and digital soil maps, herein referred to as “full” models. Each of these modeling approaches were calibrated using soil carbon data content from dry combustion elemental analysis as a dependent variable. For each model, 80% of samples were randomly partitioned to create a training dataset for the model, while the remaining 20% were partitioned for testing model predictions. Predictive models were trained with 100 calibration/validation splits to bootstrap each modeling approach and to assess the distribution of possible model outcomes. Models were developed using a Bayesian Additive Regression Tree (BART) approach [34] using the “bartMachine” R package [35]. BART is a machine learning algorithm that employs a Bayesian “sum of trees” approach to generate a best fit predictive model (Figure 2). We chose to use it as opposed to alternative machine learning or traditional statistical methods, as it is capable of dealing with high-dimensional data but also includes a regularization feature that reduces overfitting. In addition, it allows for estimation of posteriors, which allows us to better assess uncertainty in our predictions, and it also generates statistics on variable importance (predictor inclusion frequency), allowing us to assess the relative importance of different predictor variables in each model type.
On each iteration, we used the generated model to estimate soil carbon content on all samples in the testing partition and compared these estimates to their observed reference method, soil carbon content, as measured in the lab to estimate Mean Absolute Error (MAE), Root Mean Square Error (RMSE), and coefficient of determination (R2). Mean Absolute Error (MAE) is the average measure of errors between paired observations. Root Mean Square Error (RMSE) is a measure of how far a prediction is from a measured reference value. Coefficient of determination (R2) is the proportion of the variation in the dependent variable that can be explained from the predictor variables. Estimating these error statistics across all 100 iterations allowed us to determine how the accuracy of each method changes as the training dataset changes.
In addition to partitioning the dataset into training and testing groups across all sites and soil types, we used the same approach on subsets of data divided by the USDA soil textural classification (i.e., sand, clay, etc.). This approach allowed us to better understand how fundamental differences in soil texture and mineralogy, which are likely to affect a soil sample’s reflectance characteristics, might also affect soil carbon estimation.

3. Results

The soil organic carbon content of samples ranged from 0.03 to 6.03% and followed a lognormal distribution with a mean of 0.96%. Means and distributions of soil carbon content values were similar across sites, and soil carbon was stratified by depth such that surface soil samples had higher carbon content, and carbon content rapidly declined with depth. Most samples were categorized as being medium-to-moderately fine-textured.
When training and testing splits were made across the entire dataset, models with reflectance data only had the lowest accuracy and the greatest bias, followed by models with remote and DSM data only, and then full models combining both data sources (Table 2). Student’s t-tests indicated that these differences in accuracy and bias were all significant (Table 3). Models relying solely on reflectance data explained just over half of the total variability in %SOC (R2 = 0.54), while models developed with remotely sensed data (R2 = 0.71) and the combination of both data sources (R2 = 0.75) explained a greater amount of variability in the dataset (Figure 3). The reduction in accuracy for models using reflectance data only was the greatest for samples with higher soil carbon content, which the model tended to underestimate. In contrast, remote and full models made more accurate predictions across the range of soil carbon content (Figure 4). Error across depth had a similar pattern for all model types, but distinct patterns across the depth gradient emerged (Figure 5).
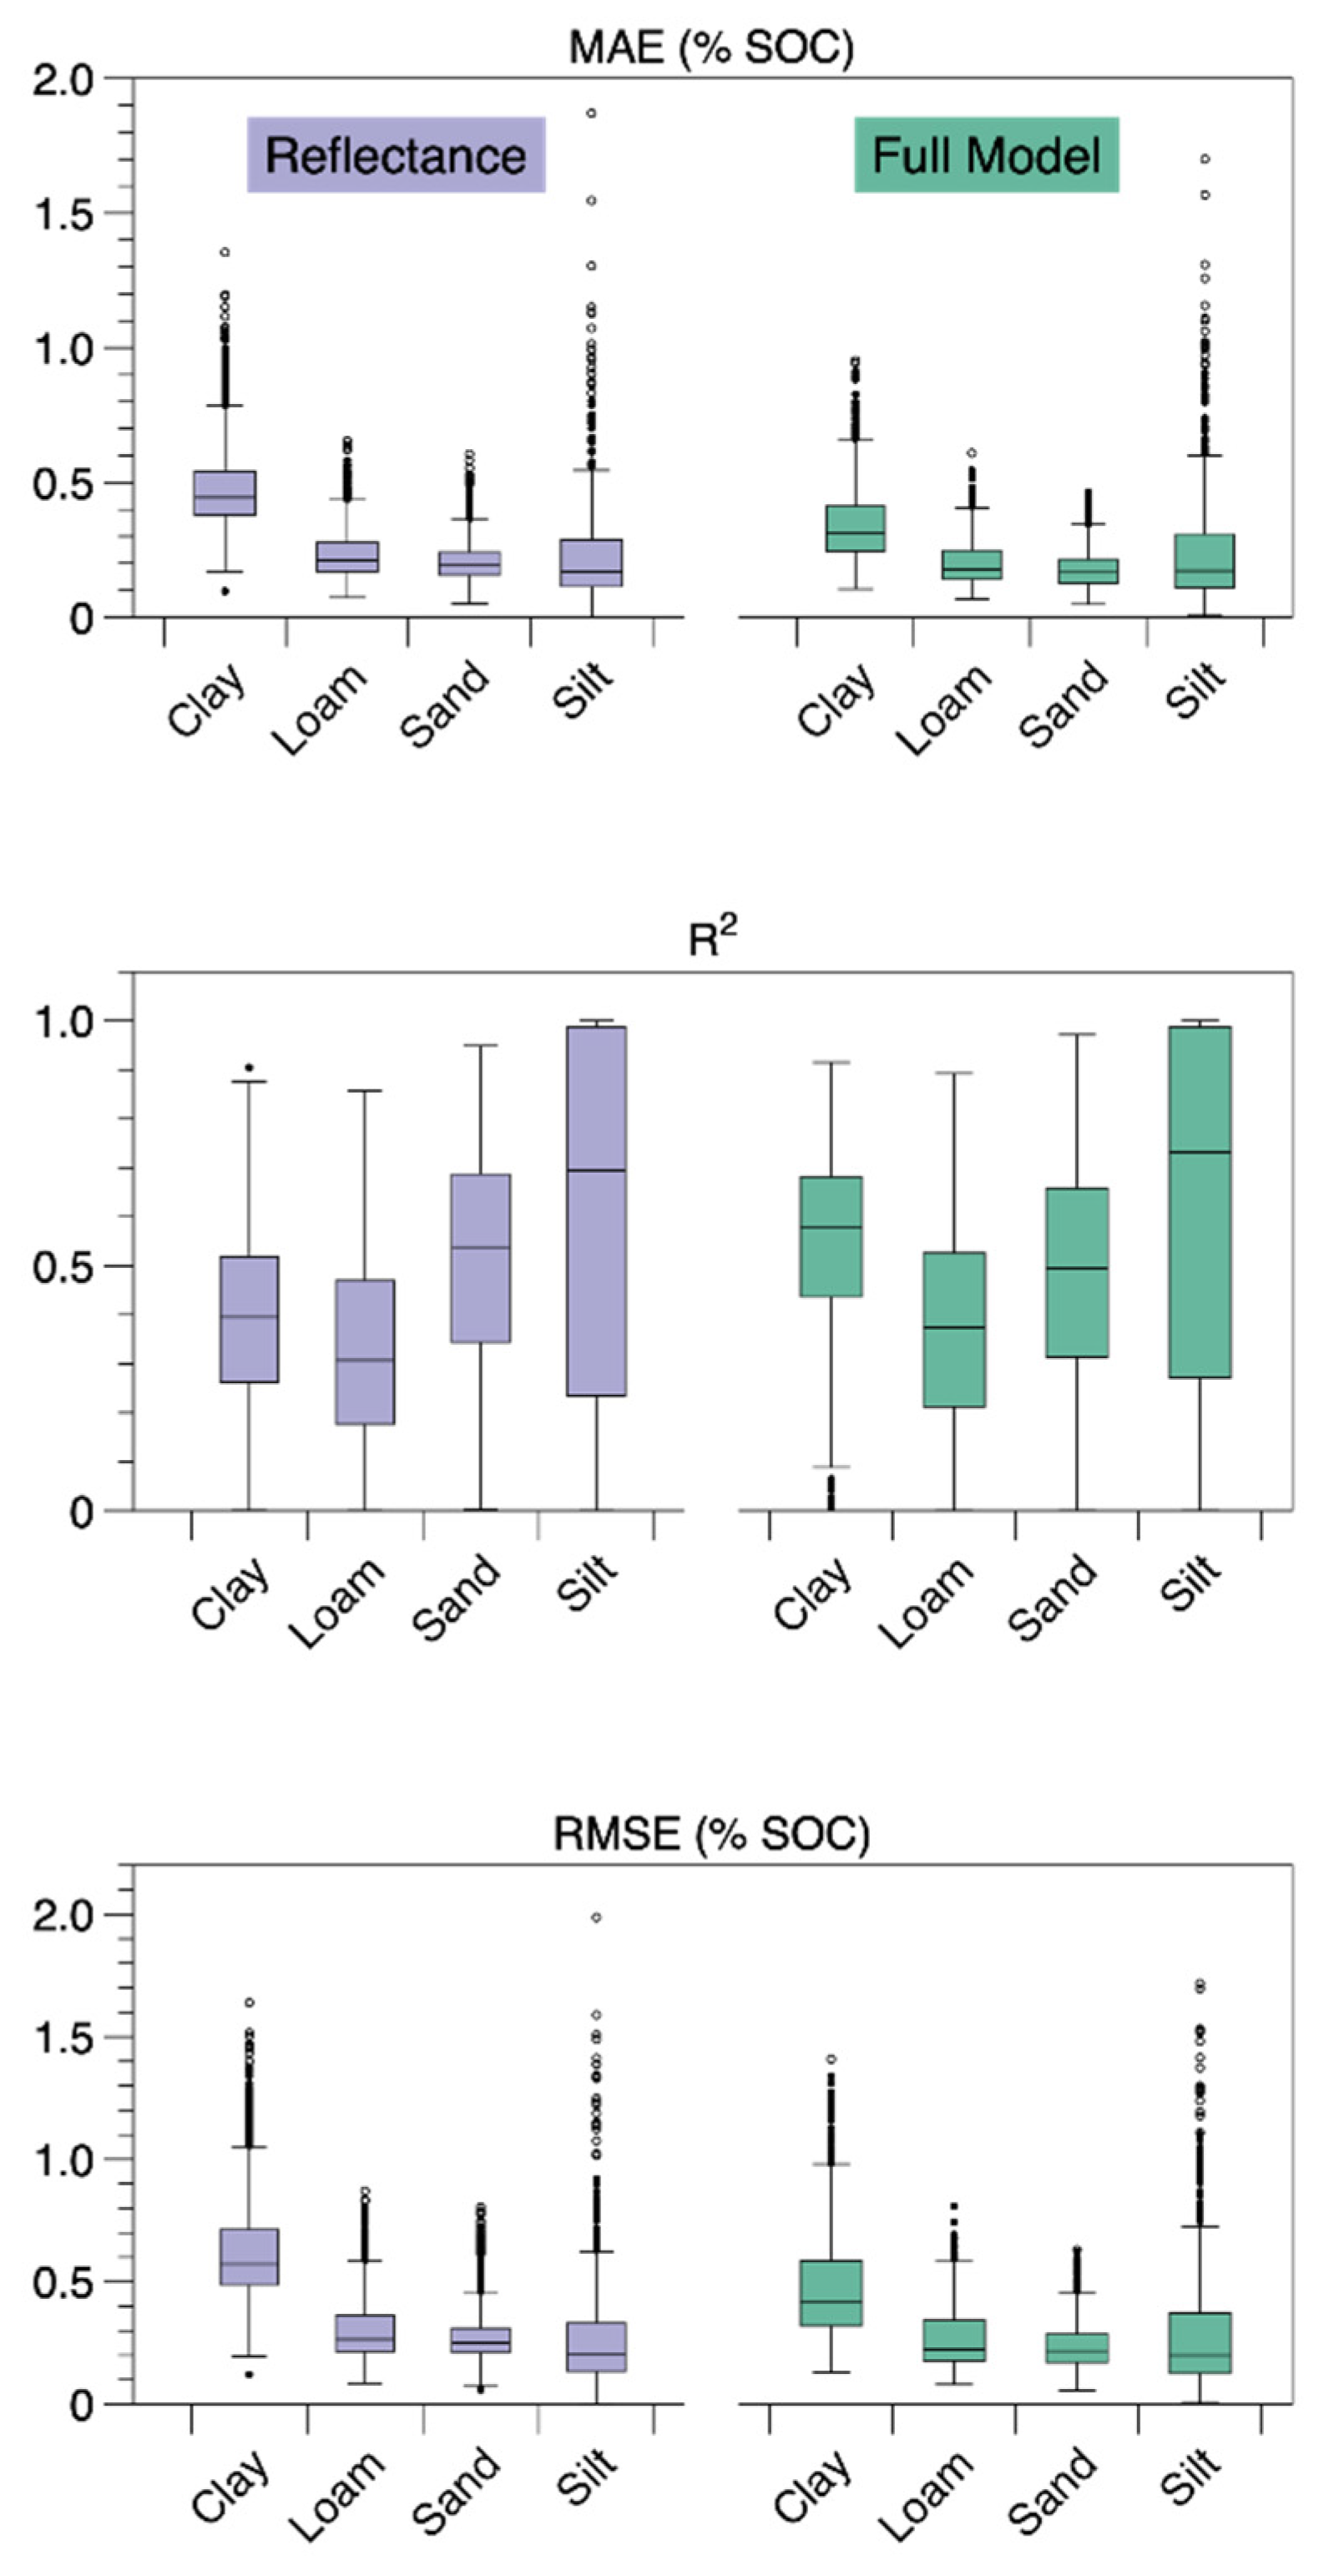
Estimates for 0–15 cm samples had the highest error, and below 15 cm, error rapidly declined (Figure 5). Given that soil carbon content was generally highest in the surface layer, this observation is consistent with the above results. Similarly, when separate models were developed for each texture class, models for medium to coarse texture soils (silt, loam, and sand) generally had lower soil carbon content than estimated soil carbon content, with MAE of about 0.2, and MAE was similar between full and reflectance-only models (Figure 6). In contrast, models on fine-textured soils (clay), which generally had higher soil carbon content, had lower accuracy, particularly in the reflectance data-only models (Figure 6).
Analysis of variable importance based on variable inclusion proportion indicated that when reflectance data alone were used, wavelengths in the mid-visible range had the most significant apparent effect on model accuracy (Figure 7). However, when remote sensing data and digital soil map data were introduced, those patterns changed, and “far-red” and near-infrared wavelengths had higher variable inclusion proportion scores relative to other wavelengths (Figure 7b). Furthermore, these analyses showed that several remotely sensed information and digital soil map layers added substantially to model accuracy and were often the most important variables.

4. Discussion

The use of visible and near infrared spectroscopy continues to be a focus area for research investigating methods to reduce laboratory costs, increase the precision of estimations, and reduce variability associated with estimating soil organic carbon concentrations. Cost-effective handheld reflectometers have been suggested as a tool to address these concerns. The Our Sci handheld reflectometer estimated soil organic carbon in this study to precision of approximately +/− 0.3% SOC; however, estimation accuracy was greatly reduced for those samples with carbon concentrations above 2.0%. Further, models relying solely on reflectance data explained just over half of the total variability in %SOC (R2 = 0.54). This reduced accuracy at higher soil carbon concentrations could suggest that vis-NIR spectroscopy within the wavelength range studied (370–980 nm) is potentially best suited for environments with relatively low concentrations of soil organic carbon. It is also possible that higher SOC levels may be more accurately measured with higher wavelengths, as bands from 1100 to 2400 nm have proved particularly important for SOC calibration in past studies [36,37]. Alternatively, reduced accuracy at higher concentrations may be an artifact of those samples being less represented in the training data, given there were fewer samples in that range.
The reflectance only model, although accurate at lower soil carbon concentrations, was consistently less accurate than the remote model built using exclusively existing geospatial data products as predictors (R2 = 0.71). The full model, combining the two data sources, provided significant, but only modest accuracy improvements (R2 = 0.75; p < 0.001). This small increase in model accuracy suggests that the Our Sci reflectometer has limited capacity to improve the accuracy of digital soil mapping methods in the studied region.
The relatively poor performance of vis-NIR spectroscopy reported by this study is consistent with wide variation in accuracy reported in other studies across different systems. Soils have been effectively characterized globally based on vis-NIR spectroscopy analysis, but only using far more robust laboratory grade spectroscopy [25]. While some studies have reported specific instances of high-performance carbon estimation via vis-NIR spectroscopy [38,39] researchers increasingly question the method’s ability to fully replace laboratory analysis [40]. Subsequently, the high performance of vis-NIR-derived models can be misleading, as it may be a result of overfitting or poor validation techniques [41].
We observed higher accuracy of vis-NIR spectroscopy at depth and in lower carbon sites, however, this pattern has not been observed consistently across other regions, climates, and management systems. While soil depth has a considerable impact on soil organic carbon stocks, data regarding the vertical distribution of the SOC stocks in relation to vegetation and land use are rare [42,43,44,45,46,47]. In contrast, in a temperate, forested ecosystem, Gholizadeh et al. [48] found that in a very high carbon density landscape (mean soil C = 23.54%), in situ spectroscopy performed less well with increasing soil depth. There, SOC prediction accuracy was higher in shallower organic layers with higher concentrations of organic matter. Other studies have found in situ application of vis-NIR to produce models with high performance fits in high-carbon environments, specifically in a high-elevation pastoral landscape (R2 = 0.77) [49] and in a tropical volcanic soil (R2 = 0.91) [50]. Allo et al. [50] suggested that better performance in high-carbon environments might be the result of greater variation leading to greater detectability. However, relatively higher performance on low-carbon samples in our study may be because they were more represented in model training datasets.
The availability of accurate covariate data could also play a significant role in model accuracy of digital soil mapping options. In a recent study conducted in Sub-Saharan Africa, Ewing et al. [51] found the Our Sci reflectometer provided sufficient accuracy in models developed that combined reflectance data with covariate data from the African Soil Information Service (AfSIS) database (R2 = 0.69). However, a model developed from AfSIS covariate data alone provided the poorest agreement with reference laboratory samples (R2 = 0.04). Our findings are consistent, in that a model developed with reflectance data combined with covariate data from remotely sensed sources provided the greatest accuracy and the least error. However, inconsistencies arise when evaluating the accuracy of the covariate data alone. In our study the full model (R2 = 0.75), although significant, was not substantially better than a model developed with only remotely sensed covariates (R2 = 0.71). The addition of NDVI greenness estimations to our remote models in semi-arid environments vs arid environments with less herbaceous biomass production may explain some of the variation. Thus, in semi-arid grazing land environments in the United States, where models developed completely from remotely sensed covariates perform similarly to models developed with the addition of the reflectance data, the modest increase in accuracy does not justify the time, labor, and cost of field sampling if change detection over time is not a concern.
Several recent studies suggest that models built on wider spectra can perform better than those based on solely vis-NIR. Researchers have tested MIR measurements as an alternative to vis-NIR, reporting substantial improvements in estimation accuracy. In a review of published literature, Soriano-Disla et al., [52] investigated the performance of visible, near-, and mid-infrared spectroscopy as an appropriate tool to estimate soil properties including soil carbon concentration. Their review provided evidence to suggest that mid-infrared spectroscopy offered more accurate predictions than Vis-NIR. Further, Riedel et al. [53] investigated the prediction of soil parameters of Vis-NIR and MIR spectroscopy across soil types as part of the Saxon Permanent Soil Monitoring Program in Germany. Ultimately their findings suggested that mid-infrared spectra provided more accurate prediction capabilities for the majority of soil parameters investigated, however, Vis-NIR-based calibration models performed well with coefficient of determination estimates greater than 0.67 for total organic carbon, further suggesting that approaches utilizing the full range of Vis-NIR wavelengths (up to 2500 nm) as opposed to the spectral range utilized in this study (370–940 nm) could increase model performance and accuracy.
Digital soil mapping methods that combine local, proximal sensing with data from remote sensing sources, such as those tested in this paper, have been proposed as a means to rapidly map soil properties at reduced cost [54]. Since digital soil mapping often relies on models using environmental covariates that are fixed (e.g., soil texture, topographic features), they have limited use in tracking changes in soil carbon over time. Combining such methods with local, proximal sensing data could provide improved accuracy for change detection at minimal additional cost. However, our results indicate that the OurSci reflectometer may not substantially improve accuracy of such methods in the studied region.
Furthermore, while a suggested use of low-cost, handheld spectroscopy devices for rapid in-field carbon assessments continue to increase in demand, there are additional potential challenges to consider that are related to the technology and the environmental context of interest. The accuracy of infield assessments is often challenged by uncertain and highly variable field conditions. Many biotic and abiotic factors can affect soil reflectance and, ultimately, the spectral signature. Factors that could potentially impact reflectance include quartz content, shadowing, soil particle size, plant residues, and even soil moisture. Sample moisture content can decrease spectroscopy-based model fits [55,56,57,58,59]. Recent work has focused on external parameter orthogonalization [60]. However, the impacts of sample moisture on sample spectra may be non-linear. Cao et al. [60] observed that moisture had a greater impact on the spectra of samples with lower SOC. These vary with substrate physical structure, biochemistry, and temperature. Gholizadeh et al. [48] suggested that a finer scale in situ spectroscopic models, where there is less soil textural and moisture content variation, may perform better than broader scale models [61,62]. The promise of low-cost, handheld spectroscopy tools is to be able to measure SOC concentrations in the field and to reduce laboratory analysis costs. However, in an effort to reduce the environmental variability and address these factors that may affect reflectance, samples in this study were processed and dried in the lab to more aptly measure the reflectometer’s direct ability to estimate SOC concentration. Given the extra steps taken to address variability, our results continue to question the ability of the Our Sci reflectometer, measuring a wavelength range of (370–980 nm) at discrete intervals to replace dry combustion laboratory analysis in semi-arid grazing lands.
Ultimately, this study has potentially described the upper limit of accuracy with the Our Sci reflectometer for measuring SOC in semi-arid grazing land soils within the wavelengths described. An attempt was made to reduce as much variability as reasonably possible with the experimental design, then to further reduce sample variability by scanning the samples in the lab after they had been ground and dried. Thus, field measured results would have likely been less accurate. Approaches that utilize the full spectrum of the near infrared and mid infrared spectral range may provide greater accuracies, albeit the instrument costs would greatly increase. Inevitably, the tradeoff of accuracy and cost remain.

5. Conclusions

As the desire to better understand soils, their dynamic properties, and as ecosystem service market opportunities emerge, there will be an ever-increasing need to define methods and technologies that reduce labor and data acquisition costs. These techniques and technologies will need to be scalable, repeatable, and address temporal changes in dynamic soil properties. Our data suggest that low-cost vis-NIR spectroscopy (370–940 nm) does not add substantially better accuracy to remote/DSM-developed models in the studied region, and so may have limited utility in the estimation of stocks and monitoring of change in carbon over time. However, further refinement is warranted, particularly the testing of similarly low-cost MIR tools. Additional research is needed to investigate advanced remote sensing and other sensor technologies to mitigate the time and cost constraints of standard laboratory testing and high throughput.

Author Contributions

Conceptualization, D.J.G., D.A.K., K.R.C. and C.B.; methodology, D.J.G., D.A.K., K.R.C. and C.B.; validation, D.J.G. and D.A.K.; formal analysis, D.J.G. and D.A.K.; investigation; data curation, D.J.G.; writing—original draft preparation, D.J.G., D.A.K., K.D. and J.H.; writing—review and editing, D.J.G., D.A.K., K.D., J.A.O.-S., H.L.P.-B., W.E.F., D.R.T., K.R.C., J.H. and C.B.; visualization, D.A.K., K.D. and C.B.; project administration, D.J.G.; funding acquisition, D.J.G. All authors have read and agreed to the published version of the manuscript.

Funding

Noble Research Institute, LLC., funded this research.

Institutional Review Board Statement

Not applicable.

Informed Consent Statement

Not applicable.

Data Availability Statement

Data sources utilized in remote model development linked below. USDA SSURGO: https://www.nrcs.usda.gov/wps/portal/nrcs/detail/soils/survey/office/ssr12/tr/?cid=nrcs142p2_010596#Datamart (accessed on 10 March 2022). Sentinel-2 MSI: MultiSpectral Instrument, Level-2A: https://developers.google.com/earth-engine/datasets/catalog/COPERNICUS_S2_SR#:~:text=Sentinel%2D2%20is%20a%20wide,data%20are%20downloaded%20from%20scihub (accessed on 10 March 2022). USGS National Elevation Dataset: https://www.usgs.gov/the-national-map-data-delivery (accessed on 10 March 2022).

Acknowledgments

I thank Evan Tanner and Ashley Unger for reviewing early drafts of this paper. This is CKWRI manuscript #22-105. I would like to thank Will Krogman, Lane Scogin, Jake Allen, Kevin Lynch, Derick Warren, Patrick Jones, Brian Williams, Amanda Early, Heather Simon, Tabby Campbell, and Shawn Norton for their assistance with the field data collection and Chad Ellis for concepts and planning.

Conflicts of Interest

The authors declare no conflict of interest.

References

  1. Rumpel, C.; Amiraslani, F.; Koutika, L.S.; Smith, P.; Whitehead, D.; Wollenberg, E. Put more carbon in soils to meet Paris climate pledges. Nature 2018, 564, 32–34. [Google Scholar] [CrossRef] [PubMed] [Green Version]
  2. Lal, R. Soil carbon sequestration to mitigate climate change. Geoderma 2004, 123, 1–22. [Google Scholar] [CrossRef]
  3. Chabbi, A.; Lehmann, J.; Ciais, P.; Loescher, H.W.; Cotrufo, M.F.; Don, A.; SanClements, M.; Schipper, L.; Six, J.; Smith, P.; et al. Aligning agriculture and climate policy. Nat. Clim. Chang. 2017, 7, 307–309. [Google Scholar] [CrossRef]
  4. Lal, R. Global potential of soil carbon sequestration to mitigate the greenhouse effect. Crit. Rev. Plant Sci. 2003, 22, 151–184. [Google Scholar] [CrossRef]
  5. Eglin, T.; Ciais, P.; Piao, S.; Barre, P.; Bellassen, V.; Cadule, P.; Chenu, C.; Gasser, T.; Koven, C.; Reichstein, M.; et al. Historical and future perspectives of global soil carbon response to climate and land-use changes. Tellus B Chem. Phys. Meteorol. 2010, 62, 700–718. [Google Scholar] [CrossRef] [Green Version]
  6. Paustian, K.; Lehmann, J.; Ogle, S.; Reay, D.; Robertson, G.P.; Smith, P. Climate-smart soils. Nature 2016, 532, 49–57. [Google Scholar] [CrossRef] [PubMed] [Green Version]
  7. Lal, R. Soil carbon sequestration impacts on global climate change and food security. Science 2004, 304, 1623–1627. [Google Scholar] [CrossRef] [PubMed] [Green Version]
  8. Williams, A.; Hunter, M.; Kammerer, M.; Kane, D.A.; Jordan, N.R.; Mortensen, D.A.; Smith, R.G.; Snapp, S.; Davis, A.S. Soil Water Holding Capacity Mitigates Downside Risk and Volatility in US Rainfed Maize: Time to Invest in Soil Organic Matter? PLoS ONE 2016, 11, e0160974. [Google Scholar] [CrossRef]
  9. Lal, R. Sequestering carbon and increasing productivity by conservation agriculture. J. Soil Water Conserv. 2015, 70, 55A–62A. [Google Scholar] [CrossRef] [Green Version]
  10. Pozdnyakova, L.; Giménez, D.; Oudemans, P.V. Spatial Analysis of Cranberry Yield at Three Scales. Agron. J. 2005, 97, 49–57. [Google Scholar] [CrossRef]
  11. Bellon-Maurel, V.; McBratney, A. Near-infrared (NIR) and mid-infrared (MIR) spectroscopic techniques for assessing the amount of carbon stock in soils—Critical review and research perspectives. Soil Biol. Biochem. 2011, 43, 1398–1410. [Google Scholar] [CrossRef]
  12. Gomez, C.; Rossel, R.V.; McBratney, A. Soil organic carbon prediction by hyperspectral remote sensing and field vis-NIR spectroscopy: An Australian case study. Geoderma 2008, 146, 403–411. [Google Scholar] [CrossRef]
  13. Wetzel, D.L. Near-infrared reflectance analysis. Anal. Chem. 1983, 55, 1165A–1176A. [Google Scholar] [CrossRef]
  14. Cozzolino, D.; Morón, A. The potential of near-infrared reflectance spectroscopy to analyse soil chemical and physical characteristics. J. Agric. Sci. 2003, 140, 65–71. [Google Scholar] [CrossRef]
  15. Cozzolino, D.; Morón, A. Potential of near-infrared reflectance spectroscopy and chemometrics to predict soil organic carbon fractions. Soil Tillage Res. 2006, 85, 78–85. [Google Scholar] [CrossRef]
  16. Dalal, R.C.; Henry, R.J. Simultaneous Determination of Moisture, Organic Carbon, and Total Nitrogen by Near Infrared Reflectance Spectrophotometry. Soil Sci. Soc. Am. J. 1986, 50, 120–123. [Google Scholar] [CrossRef]
  17. Morra, M.J.; Hall, M.H.; Freeborn, L.L. Carbon and Nitrogen Analysis of Soil Fractions Using Near-Infrared Reflectance Spectroscopy. Soil Sci. Soc. Am. J. 1991, 55, 288–291. [Google Scholar] [CrossRef]
  18. Reeves, J.; McCarty, G.; Mimmo, T. The potential of diffuse reflectance spectroscopy for the determination of carbon inventories in soils. Environ. Pollut. 2002, 116, S277–S284. [Google Scholar] [CrossRef]
  19. Volkan Bilgili, A.; van Es, H.M.; Akbas, F.; Durak, A.; Hively, W.D. Visible-near infrared reflectance spectroscopy for assessment of soil properties in a semi-arid area of Turkey. J. Arid Environ. 2010, 74, 229–238. [Google Scholar] [CrossRef]
  20. Gao, Y.; Cui, L.; Lei, B.; Zhai, Y.; Shi, T.; Wang, J.; Chen, Y.; He, H.; Wu, G. Estimating Soil Organic Carbon Content with Visible–Near-Infrared (Vis-NIR) Spectroscopy. Appl. Spectrosc. 2014, 68, 712–722. [Google Scholar] [CrossRef]
  21. Van Groenigen, J.W.; Mutters, C.; Horwath, W.; Van Kessel, C. NIR and DRIFT-MIR spectrometry of soils for predicting soil and crop parameters in a flooded field. Plant Soil 2003, 250, 155–165. [Google Scholar] [CrossRef]
  22. Reeves, J. Near- versus mid-infrared diffuse reflectance spectroscopy for soil analysis emphasizing carbon and laboratory versus on-site analysis: Where are we and what needs to be done? Geoderma 2010, 158, 3–14. [Google Scholar] [CrossRef]
  23. Kusumo, B.H.; Hedley, M.J.; Hedley, C.B.; Tuohy, M.P. Measuring carbon dynamics in field soils using soil spectral reflectance: Prediction of maize root density, soil organic carbon and nitrogen content. Plant Soil 2010, 338, 233–245. [Google Scholar] [CrossRef]
  24. Minasny, B.; Tranter, G.; McBratney, A.B.; Brough, D.M.; Murphy, B.W. Regional transferability of mid-infrared diffuse reflectance spectroscopic prediction for soil chemical properties. Geoderma 2009, 153, 155–162. [Google Scholar] [CrossRef]
  25. Brown, D.J.; Shepherd, K.D.; Walsh, M.G.; Dewayne Mays, M.; Reinsch, T.G. Global soil characterization with VNIR diffuse reflectance spectroscopy. Geoderma 2006, 132, 273–290. [Google Scholar] [CrossRef]
  26. Muñoz, J.D.; Kravchenko, A. Soil carbon mapping using on-the-go near infrared spectroscopy, topography and aerial photographs. Geoderma 2011, 166, 102–110. [Google Scholar] [CrossRef]
  27. Peng, Y.; Xiong, X.; Adhikari, K.; Knadel, M.; Grunwald, S.; Greve, M.H. Modeling Soil Organic Carbon at Regional Scale by Combining Multi-Spectral Images with Laboratory Spectra. PLoS ONE 2015, 10, e0142295. [Google Scholar] [CrossRef] [Green Version]
  28. Soil Survey Staff. Natural Resources Conservation Service, United States Department of Agriculture. Web Soil Survey. Available online: https://websoilsurvey.nrcs.usda.gov (accessed on 10 March 2022).
  29. Bettigole, C.; Szeto, S.; Covey, K.; Wood, S.; Kane, D.; Chandler, M.; Hersh, E. Stratifi 3.1. Available online: https://charliebettigole.users.earthengine.app/view/stratifi-beta-v21 (accessed on 10 March 2022).
  30. Pelleg, D.; Moore, A.W. X-means: Extending k-means with efficient estimation of the number of clusters. In Proceedings of the Seventeenth International Conference on Machine Learning, San Francisco, CA, USA, 29 June–2 July 2000; pp. 727–734. [Google Scholar]
  31. Nelson, D.W.; Sommers, L.E. Total Carbon, Organic Carbon, and Organic Matter. In Methods of Soil Analysis; Sparks, D.L., Ed.; Agronomy Monographs; SSSA Book Series; American Society of Agronomy: Madison, WI, USA, 1996; pp. 961–1010. [Google Scholar]
  32. Soil Survey Staff, Natural Resources Conservation Service, United States Department of Agriculture. Soil Survey Geographic (SSURGO) Database for [Survey Area, Oklahoma and Texas]. Available online: https://www.nrcs.usda.gov/wps/portal/nrcs/detail/soils/survey/?cid=nrcs142p2_053627 (accessed on 3 January 2022).
  33. Python API. ee Package. Available online: https://gee-python-api.readthedocs.io/en/latest/ee.html (accessed on 3 January 2022).
  34. Chipman, H.A.; George, E.I.; McCulloch, R.E. BART: Bayesian additive regression trees. Ann. Appl. Stat. 2010, 4, 266–298. [Google Scholar] [CrossRef]
  35. Kapelner, A.; Bleich, J. bartMachine: Machine Learning with Bayesian Additive Regression Trees. J. Stat. Softw. 2016, 70, 1–40. [Google Scholar] [CrossRef] [Green Version]
  36. Stenberg, B. Effects of soil sample pretreatments and standardised rewetting as interacted with sand classes on Vis-NIR predictions of clay and soil organic carbon. Geoderma 2010, 158, 15–22. [Google Scholar] [CrossRef] [Green Version]
  37. Stenberg, B.; Viscarra Rossel, R.A.; Mouazen, A.M.; Wetterlind, J. Visible and Near Infrared Spectroscopy in Soil Science. In Advances in Agronomy; Sparks, D.L., Ed.; Academic Press: Cambridge, MA, USA, 2010; pp. 163–215. [Google Scholar]
  38. Olatunde, K.A. Estimation of soil organic carbon using chemometrics: A comparison between mid-infrared and visible near infrared diffuse reflectance spectroscopy. West Afr. J. Appl. Ecol. 2021, 29, 1–11. [Google Scholar]
  39. Summers, D.; Lewis, M.; Ostendorf, B.; Chittleborough, D. Visible near-infrared reflectance spectroscopy as a predictive indicator of soil properties. Ecol. Indic. 2011, 11, 123–131. [Google Scholar] [CrossRef]
  40. McBride, M.B. Estimating soil chemical properties by diffuse reflectance spectroscopy: Promise versus reality. Eur. J. Soil Sci. 2021, 73, e13192. [Google Scholar] [CrossRef]
  41. Reyna, L.; Dube, F.; Barrera, J.A.; Zagal, E. Potential Model Overfitting in Predicting Soil Carbon Content by Visible and Near-Infrared Spectroscopy. Appl. Sci. 2017, 7, 708. [Google Scholar] [CrossRef] [Green Version]
  42. Jobbágy, E.G.; Jackson, R.B. The vertical distribution of soil organic carbon and its relation to climate and vegetation. Ecol. Appl. 2000, 10, 423–436. [Google Scholar] [CrossRef]
  43. Liski, J.; Westman, C.J. Density of organic carbon in soil at coniferous forest sites in southern Finland. Biogeochemistry 1995, 29, 183–197. [Google Scholar] [CrossRef]
  44. Rasse, D.P.; Rumpel, C.; Dignac, M.-F. Is soil carbon mostly root carbon? Mechanisms for a specific stabilisation. Plant Soil 2005, 269, 341–356. [Google Scholar] [CrossRef]
  45. Richter, D.D.; Markewitz, D. How Deep Is Soil? BioScience 1995, 45, 600–609. [Google Scholar] [CrossRef]
  46. Rumpel, C.; Kögel-Knabner, I. Deep soil organic matter—A key but poorly understood component of terrestrial C cycle. Plant Soil 2011, 338, 143–158. [Google Scholar] [CrossRef]
  47. Swift, R.S. Sequestration of carbon by soil. Soil Sci. 2001, 166, 858–871. [Google Scholar] [CrossRef]
  48. Gholizadeh, A.; Rossel, R.A.V.; Saberioon, M.; Borůvka, L.; Kratina, J.; Pavlů, L. National-scale spectroscopic assessment of soil organic carbon in forests of the Czech Republic. Geoderma 2020, 385, 114832. [Google Scholar] [CrossRef]
  49. Chen, Y.; Li, Y.; Wang, X.; Wang, J.; Gong, X.; Niu, Y.; Liu, J. Estimating soil organic carbon density in Northern China’s agro-pastoral ecotone using vis-NIR spectroscopy. J. Soils Sediments 2020, 20, 3698–3711. [Google Scholar] [CrossRef]
  50. Allo, M.; Todoroff, P.; Jameux, M.; Stern, M.; Paulin, L.; Albrecht, A. Prediction of tropical volcanic soil organic carbon stocks by visible-near- and mid-infrared spectroscopy. CATENA 2020, 189, 104452. [Google Scholar] [CrossRef]
  51. Ewing, P.M.; TerAvest, D.; Tu, X.; Snapp, S.S. Accessible, affordable, fine-scale estimates of soil carbon for sustainable management in sub-Saharan Africa. Soil Sci. Soc. Am. J. 2021, 85, 1814–1826. [Google Scholar] [CrossRef]
  52. Disla, J.S.; Janik, L.J.; Rossel, R.V.; Macdonald, L.; McLaughlin, M.J. The Performance of Visible, Near-, and Mid-Infrared Reflectance Spectroscopy for Prediction of Soil Physical, Chemical, and Biological Properties. Appl. Spectrosc. Rev. 2013, 49, 139–186. [Google Scholar] [CrossRef]
  53. Riedel, F.; Denk, M.; Müller, I.; Barth, N.; Gläßer, C. Prediction of soil parameters using the spectral range between 350 and 15,000 nm: A case study based on the Permanent Soil Monitoring Program in Saxony, Germany. Geoderma 2018, 315, 188–198. [Google Scholar] [CrossRef]
  54. Paul, S.; Coops, N.; Johnson, M.; Krzic, M.; Smukler, S. Evaluating sampling efforts of standard laboratory analysis and mid-infrared spectroscopy for cost effective digital soil mapping at field scale. Geoderma 2019, 356, 113925. [Google Scholar] [CrossRef]
  55. Chakraborty, S.; Li, B.; Weindorf, D.C.; Morgan, C.L. External parameter orthogonalisation of Eastern European VisNIR-DRS soil spectra. Geoderma 2018, 337, 65–75. [Google Scholar] [CrossRef]
  56. Cozzolino, D. Near infrared spectroscopy as a tool to monitor contaminants in soil, sediments and water—State of the art, advantages and pitfalls. Trends Environ. Anal. Chem. 2016, 9, 1–7. [Google Scholar] [CrossRef]
  57. Goff, K.; Schaetzl, R.J.; Chakraborty, S.; Weindorf, D.C.; Kasmerchak, C.; Bettis, E.A. Impact of sample preparation methods for characterizing the geochemistry of soils and sediments by portable X-ray fluorescence. Soil Sci. Soc. Am. J. 2019, 84, 131–143. [Google Scholar] [CrossRef]
  58. Mallet, A.; Charnier, C.; Latrille, É.; Bendoula, R.; Steyer, J.-P.; Roger, J.-M. Unveiling non-linear water effects in near infrared spectroscopy: A study on organic wastes during drying using chemometrics. Waste Manag. 2021, 122, 36–48. [Google Scholar] [CrossRef] [PubMed]
  59. Williams, P. Influence of Water on Prediction of Composition and Quality Factors: The Aquaphotomics of Low Moisture Agricultural Materials. J. Near Infrared Spectrosc. 2009, 17, 315–328. [Google Scholar] [CrossRef]
  60. Cao, Y.; Bao, N.; Liu, S.; Zhao, W.; Li, S. Reducing moisture effects on soil organic carbon content prediction in visible and near-infrared spectra with an external parameter othogonalization algorithm. Can. J. Soil Sci. 2020, 100, 253–262. [Google Scholar] [CrossRef]
  61. Guerrero, C.; Wetterlind, J.; Stenberg, B.; Mouazen, A.M.; Gabarrón-Galeote, M.A.; Ruiz-Sinoga, J.D.; Zornoza, R.; Rossel, R.V. Do we really need large spectral libraries for local scale SOC assessment with NIR spectroscopy? Soil Tillage Res. 2016, 155, 501–509. [Google Scholar] [CrossRef]
  62. Stevens, A.; Nocita, M.; Toth, G.; Montanarella, L.; van Wesemael, B. Prediction of Soil Organic Carbon at the European Scale by Visible and Near InfraRed Reflectance Spectroscopy. PLoS ONE 2013, 8, e66409. [Google Scholar] [CrossRef]
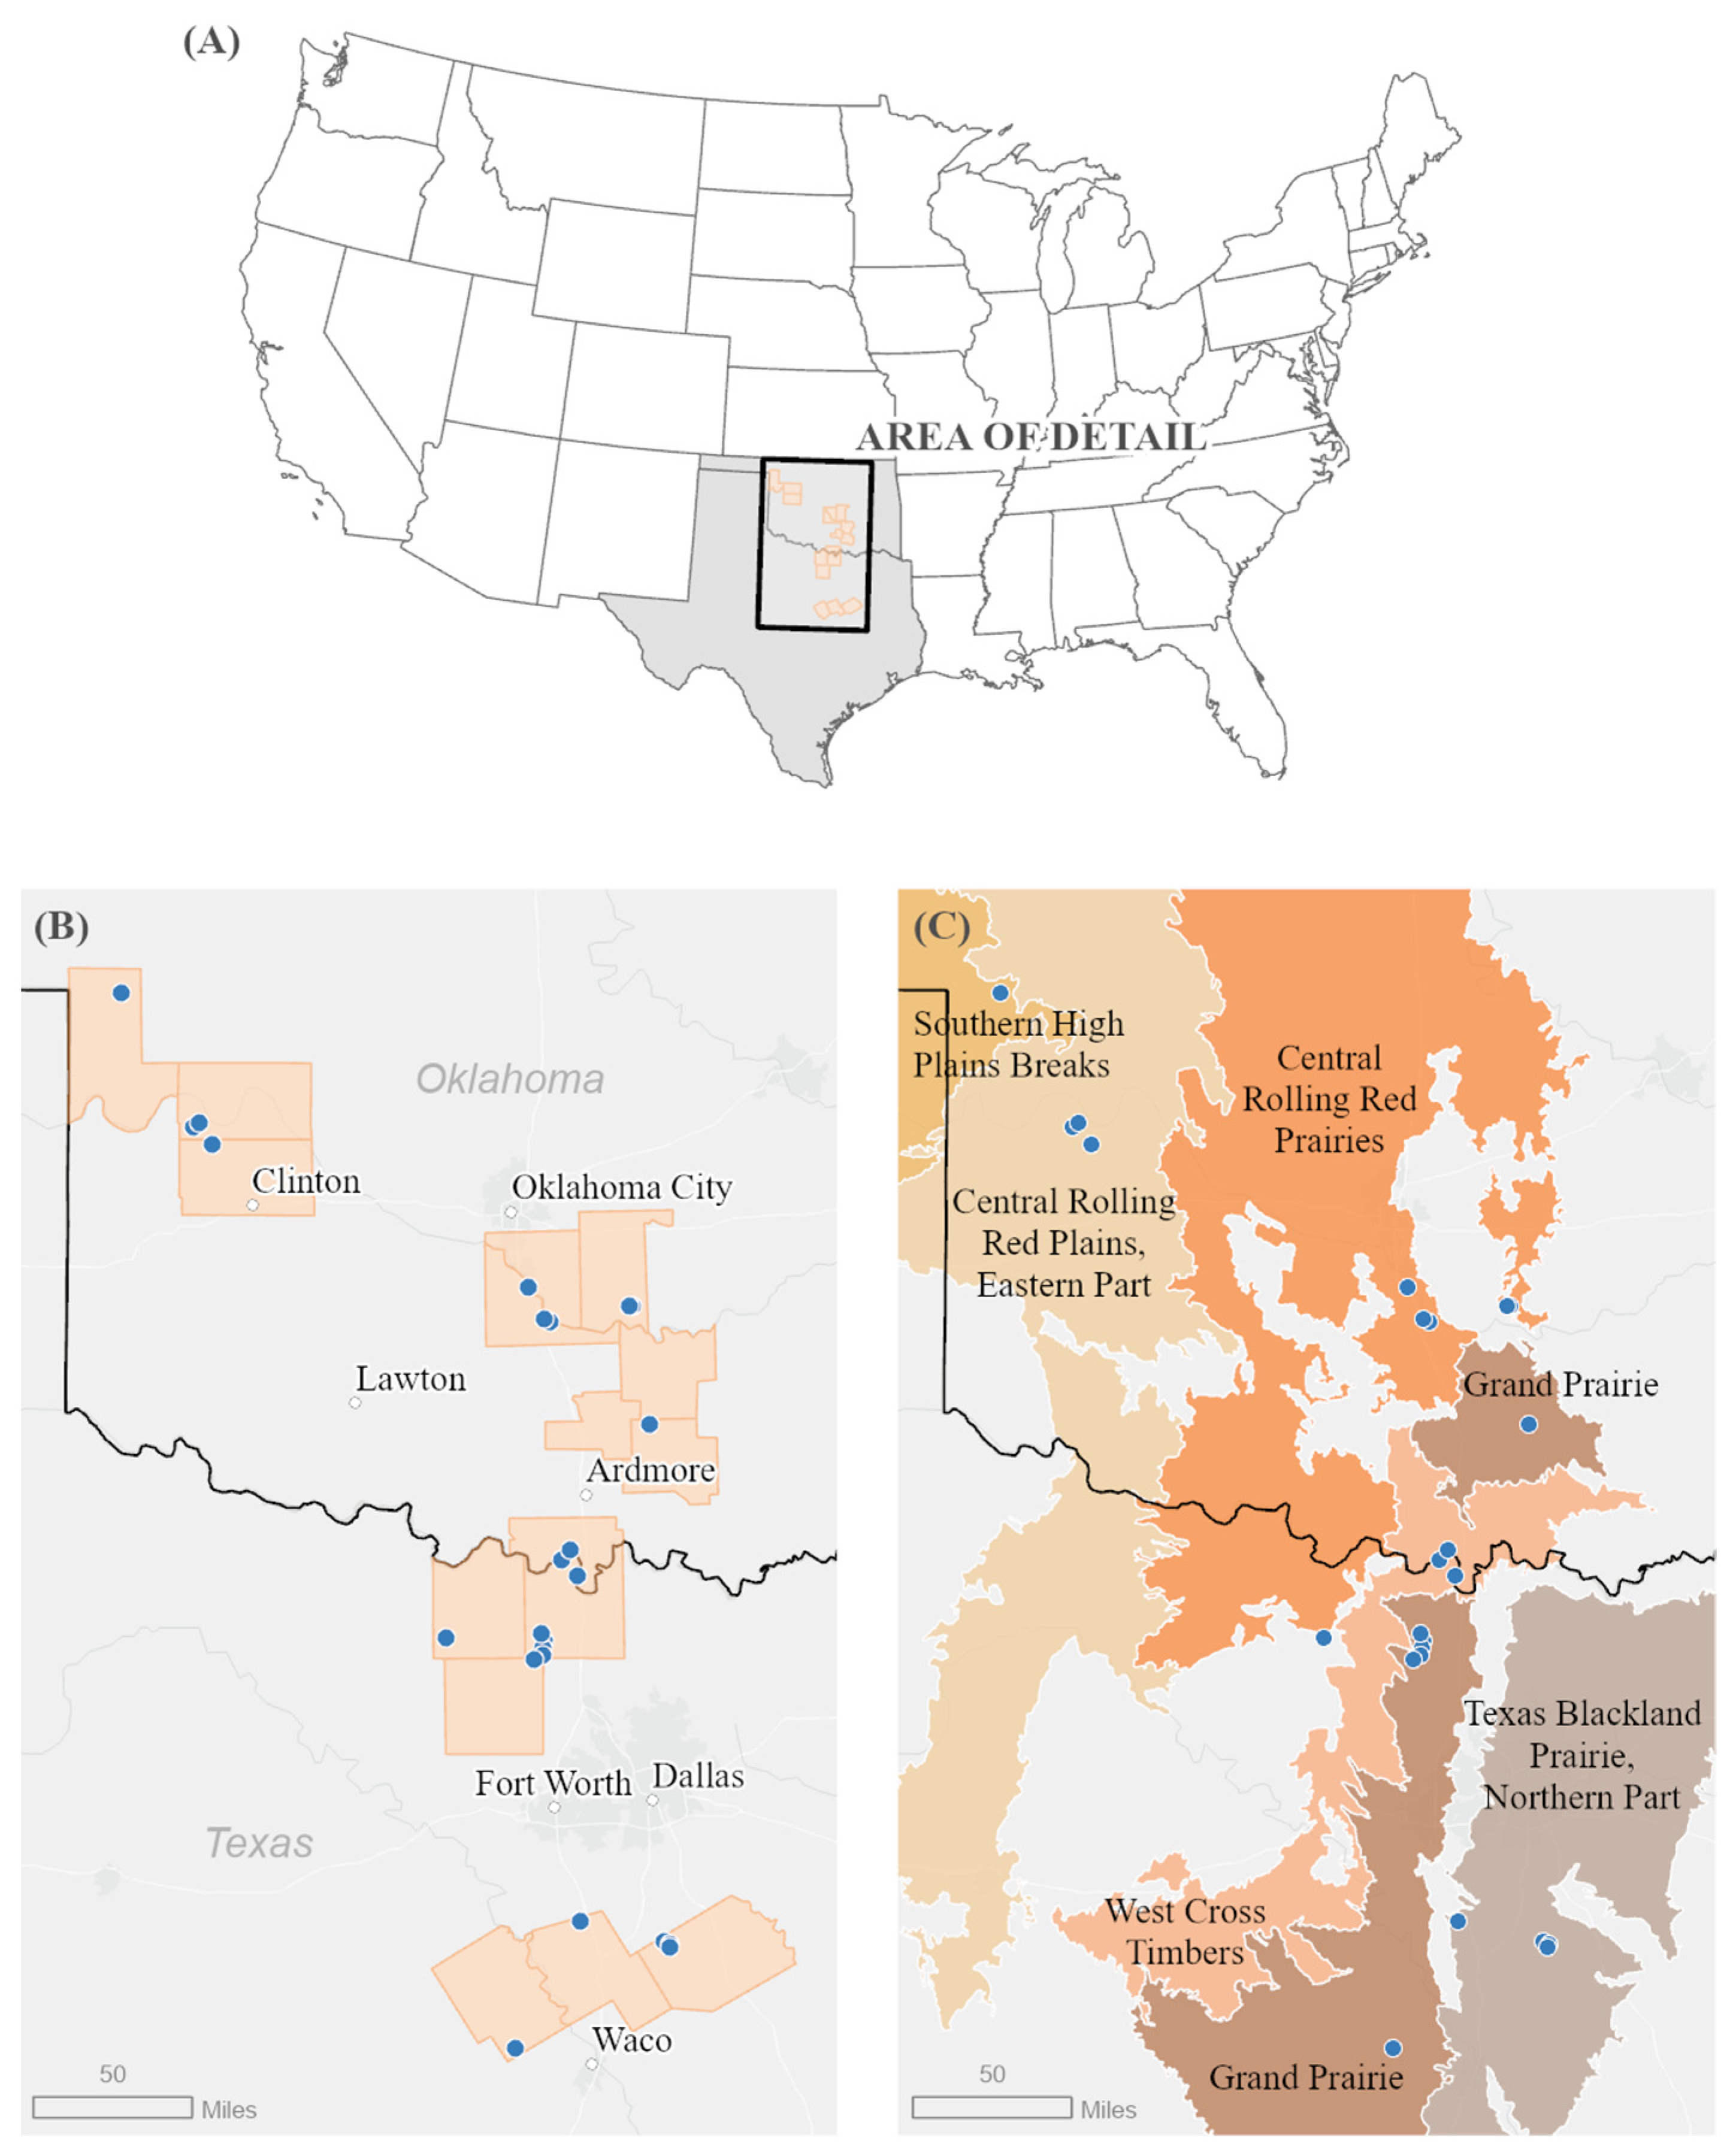
Figure 1. Location of the study sites in (A) United States area of detail, (B) Oklahoma and Texas counties and sampling locations (blue dots), (C) the USDA-NRCS Major Land Resource Areas and sampling locations (blue dots).
Soilsystems 06 00038 g001
Figure 2. Conceptual diagram (a) of a regression tree model such as the type generated by the BART approach employed in this study. Coefficients µi are estimated at each ith node based on binary split decision rules for a set of independent variables x = {xi,…, xn}. Independent variables can be either categorical or continuous. Additionally (b) Algorithm 1 outlines the model and training stepwise process.
Soilsystems 06 00038 g002
Figure 3. Predicted versus observed soil carbon content (%) and prediction error versus observed for soil carbon content (n = 1738). Points represent the mean prediction or prediction error across 100 training/testing splits, and error bars around points represent the standard deviation across 100 training/testing splits. Circles with color represent the samples for various depths as shown in the legend. Red line represents 1:1 fit. Dotted grey line represents the line of best fit from soils collected from nineteen participating ranches encompassing approximately 17,347 ha in the Southern Great Plains ecoregion of the United States.
Soilsystems 06 00038 g003
Figure 4. Model performance measured as Mean Absolute Error (MAE) (a), coefficient of determination (R2) (b), and Root Mean Square Error (RMSE) (c) across model types (n = 1738). Raincloud plots adjacent (right) to each boxplot depict the histogram of raw data points and the frequency of different binned observations. Model bars in each boxplot represent the median value of 100 train/test splits for the corresponding model by depth combination; outer edges of the boxes represent the 25 and 75% percentiles; whiskers represent 1.5× the interquartile range, and points represent outlying values greater than 1.5× the interquartile range from soils collected from nineteen participating ranches encompassing approximately 17,347 ha in the Southern Great Plains ecoregion of the United States.
Soilsystems 06 00038 g004
Figure 5. Model performance measured as Mean Absolute Error (MAE) (a), coefficient of determination (R2) (b), and Root Mean Square Error (RMSE) (c) of different model types across depth increments measured (n = 1738). Raincloud plots adjacent (right) to each boxplot depict the histogram of raw data points and the frequency of different binned observations. Model bars in each boxplot represent the median value of 100 train/test splits for the corresponding model by depth combination; outer edges of the boxes represent the 25 and 75% percentiles; whiskers represent 1.5× the interquartile range, and points represent outlying values greater than 1.5× the interquartile range. Data are from soils collected from nineteen participating ranches encompassing approximately 17,347 ha in the Southern Great Plains ecoregion of the United States.
Soilsystems 06 00038 g005
Figure 6. Model performance measured as Mean Absolute Error (MAE), coefficient of determination (R2), and Root Mean Square Error (c) across USDA soil textures (n = 1738). Model bars in each boxplot represent the median value of 100 train/test splits for the corresponding model; outer edges of the boxes represent the 25 and 75% percentiles; whiskers represent 1.5× the interquartile range, and points represent outlying values greater than 1.5× the interquartile range from soils collected from nineteen participating ranches encompassing approximately 17,347 ha in the Southern Great Plains ecoregion of the United States.
Soilsystems 06 00038 g006
Figure 7. Variable inclusion proportion (VIP) of variables used in the (a) full model, (b) spec-only model, and (c) remote/digital soil map variables model. Bars in each boxplot represent the median VIP of 100 train/test splits for the corresponding model by depth combination; outer edges of the boxes represent the 25 and 75% percentiles; whiskers represent 1.5× the interquartile range; and points represent outlying MAE values greater than 1.5× the interquartile range from soils (n = 1738) collected from nineteen participating ranches encompassing approximately 17,347 ha in the Southern Great Plains ecoregion of the United States.
Soilsystems 06 00038 g007
Table 1. Remote sensing and digital soil map layers used in model development. Soil chemical and physical properties derived from the United States Department of Agriculture’s Soil Survey Geographic Database (SSRUGO). Plant properties, including vegetation greenness, were derived from normalized differential vegetation index and soil topographic indices collected from the Unites States Geological Survey’s National Elevation Dataset from soils collected from nineteen participating ranches encompassing approximately 17,347 ha in the Southern Great Plains ecoregion of the United States.
DatasetCategoryProperty
USDA SSURGOSoil chemical propertiesOrganic matter (%)
Gypsum
CaCO3
pH
Cation exchange capacity
Soil textureSilt (%)
Clay (%)
Sand (%)
Soil colorMunsell value
Munsell chroma
Munsell sigma
Munsell red
Munsell green
Munsell blue
Sentinel-2Plant propertiesNormalized differential vegetation index (NDVI)
USGS National Elevation DatasetTopographySlope
Aspect
Table 2. Metrics of model accuracy and bias for Reflectance, Remote, and Full model types developed, including Mean Absolute Error (MAE), coefficient of determination (R2), and Root Mean Squared Error (RMSE). Numbers represent the mean and standard deviation in parentheses of each metric for 100 randomly selected test datasets from soils (n = 1738) collected from nineteen participating ranches encompassing approximately 17,347 ha in the Southern Great Plains ecoregion of the United States.
Model TypeMAER2RMSE
Reflectance0.305 (0.018)0.54 (0.045)0.602 (0.041)
Remote0.303 (0.016)0.71 (0.051)0.469 (0.044)
Full0.284 (0.015)0.75 (0.054)0.447 (0.045)
Table 3. Student’s t-tests comparing variation in the mean absolute error of 100 train/test splits for each model type. Numbers represent the t statistic and corresponding p-values in parenthesis from soils (n = 1738) collected from nineteen participating ranches encompassing approximately 17,347 ha in the Southern Great Plains ecoregion of the United States.
Model TypeReflectanceRemoteFull
Reflectance-38.033 (<0.001)47.204 (<0.001)
Remote--8.507 (<0.001)
Full---
Publisher’s Note: MDPI stays neutral with regard to jurisdictional claims in published maps and institutional affiliations.