Article

Substrate Influences Temperature Sensitivity of Dissolved Organic Carbon (DOC) and Nitrogen (DON) Mineralization in Arid Agricultural Soils

1
Department of Environmental Health, College of Public Health, Imam Abdulrahman Bin Faisal University, P.O. Box 1982, Dammam 31441, Saudi Arabia
2
School of Environment, Natural Resources and Geography, Bangor University, Bangor, Gwynedd LL57 2UW, UK
*
Author to whom correspondence should be addressed.
Soil Syst. 2018, 2(2), 28; https://doi.org/10.3390/soilsystems2020028
Submission received: 5 February 2018 / Revised: 24 April 2018 / Accepted: 27 April 2018 / Published: 1 May 2018
(This article belongs to the Special Issue Soil Organic Matter Dynamics)

Abstract

:
The bioavailability of nitrogen (N) in soil relies on the progressive breakdown of necromass protein to peptide and amino acid components and conversion to inorganic N forms. We understand the fluxes and pathways of the N cycle downstream from amino acids, but our understanding of the factors controlling peptide and amino acid mineralization, particularly in arid soils, is lacking. We investigated the influence of temperature on the rate of dissolved organic carbon (DOC) and nitrogen (DON) cycling in three agricultural soils from Saudi Arabia. Although the physical and chemical properties of the soils differed markedly, phospholipid fatty acid (PLFA) analysis revealed they had similar topsoil and subsoil microbial communities. Soils behaved similarly in terms of the rate of substrate use, microbial C-use efficiency, and response to temperature. Substrate mineralization rate increased with temperature with more C being allocated to microbial catabolic rather than anabolic processes. Our results show that climate change is likely to lead to changes in soil organic matter turnover and shift C allocation patterns within the soil microbial community. This is expected to reduce soil quality and exacerbate nutrient losses. Management strategies are required to promote the retention of organic matter in these soils.

1. Introduction

Changing climate, together with increased demand on limited groundwater supplies for agriculture in many arid regions, has led to several national authorities promoting the use of alternative sources of water for crop irrigation (e.g., Saudi Arabia, [1]; California, [2]). Concern for human health has limited its use in commercial food production but in regions experiencing significant water stress, wastewater can contribute approximately 20% of the total irrigation water used [3,4,5,6].
In oasis-based agroecosystems, nitrogen (N) represents the key nutrient regulating primary productivity; however, the cycling and competition for N resources in these ecosystems remains poorly understood [7,8]. Recently, it has been discovered that plants can directly compete with microorganisms for both organic (e.g., oligopeptides, amino acids) and inorganic (e.g., NH4+ and NO3) forms of N present in soil [9,10,11]. This challenges the traditional paradigm of nutrient cycling in oasis soils which suggests that plants will only acquire N in an inorganic form. It also highlights the need to better understand how solid soil organic N (SON) and dissolved organic N (DON) cycles within these soils.
DON can enter arid soils from many sources with the quantitative importance of each source highly dependent on management regime, its spatial input pattern (topsoil vs. subsoil, rhizosphere vs. bulk soil), and its temporal dynamics (e.g., time of day and seasonality) [12]. In oasis ecosystems, a small amount of DON may enter the soil surface from both wet and dry deposition [13], with inputs also occurring from canopy throughfall, especially if spray irrigators are used, from leaf litter [14] or directly in irrigation water or organic residues [7]. In addition, inputs can also occur below-ground from both root and microbial exudation and from root and microbial death [15,16].
The Middle East is already experiencing increasing temperatures due to climate change [17]. Observations in this region record the largest positive annual temperature anomaly outside of polar regions (+2.22 °C) and predictions point towards further increases of between 1.8–4.1 °C by 2050 [18] and increased water scarcity throughout the region [19]. This increase in temperature is likely to impact upon both the availability and quality of water used for irrigating agricultural fields and the intrinsic amount of water present in the soil, which in turn will impact soil microbial activity and the key processes that are mediated by these organisms (e.g., C and N cycling).
DON consists of many individual components ranging from high molecular weight compounds (HMW) such as chlorophyll, deoxyribonucleic acid (DNA), ribonucleic acid (RNA) and proteins through to low molecular weight compounds (LMW) such as, oligopeptides, amino sugars, amino acids, purines and urea [15,20,21,22]. The subsequent breakdown of HMW DON compounds by microbial exoenzymes is a key bottleneck in the supply of N to plants and microorganisms [9,10,11,23] and understanding agricultural practices that affect or change exoenzyme activity in oases is key to their better management [24].
To date, relatively little is known about DON and dissolved organic carbon (DOC) cycling in arid soils, particularly in the Middle East. Due to the current and proposed impact of climate change in arid agricultural systems, we need to better understand the factors regulating C and N dynamics in soil with the aim of developing more sustainable agriculture systems in terms of both nutrient and water-use efficiency [18,25]. Consequently, the aim of our research is to expand our fundamental understanding of the effects of temperature on DOC and DON cycling within oasis-based agroecosystems. To enable us to do this, we set objectives to (a) understand the differences in chemical and biological properties of 3 different agricultural soils and their associated irrigation water; (b) use 14C-labeled DOC and DON to determine the effect of temperature on rates of DOC and DON turnover; and (c) determine the effect of temperature on the microbial partitioning of added DOC and DON substrates. We therefore hypothesized that: (1) mineralization rates of DOC and DON will increase with increasing temperature; (2) the mineralization rate of DON will be higher than for DOC in arid soils due to a greater use of amino acid derived-C in respiratory processes.

2. Material and Methods

2.1. Soil and Water Sampling

Soil and water samples were collected from three agricultural farm sites with contrasting irrigation regimes within the Al-Hassa eastern oasis, Saudi Arabia. Site 1 (25°25.430′ N, 49°37.460′ E) irrigated its crops with groundwater (GW), Site 2 (25°35.839′ N, 49°34.144′ E) irrigated with tertiary treated wastewater (TTWW), and Site 3 (25°23.461′ N, 49°44.553′ E) irrigated with a mixture of groundwater, treated wastewater and farm drainage water (MW). A summary of the main chemical properties of the irrigation water used at each site is presented in Table 1. The dominant crop grown at the three sites was date palms (Phoenix dactylifera L.). Each date palm tree is planted at a distance of 4 m × 6 m and interplanted with vegetables, fruit, and Hassawi alfalfa (Medicago sativa L.) crops except at Site 2 where they are interplanted with Hassawi alfalfa only. At each site, four independent replicates of topsoil (0–30 cm) and subsoil (30–60 cm) were collected from three separate blocks of 6 m × 6 m using an auger. Each individual field-moist soil sample was placed in an O2-permeable plastic bag. Additionally, replicate samples of irrigation water (n = 3) were collected in clean polypropylene bottles from the pump outlet at each experimental site. All soil and water samples were cooled (4 °C) then immediately shipped to the UK for analysis.
For all three experimental sites the mean annual rainfall is 70 mm, the annual surface irrigation is 2300 mm, and the daily mean air temperatures ranges from 28.0 °C to 47.5 °C (average of 34.1 °C). The highest recorded air temperature is 50 °C. The relative humidity of the air is generally high for arid systems, often reaching 90% in summer [6,26]. The average daily soil temperature in the Al-Hassa eastern oasis typically ranges from 16.4 to 37.9 °C at 20 cm depth and 17.1 to 37.6 °C at 30 cm with an average of 30 °C (Figure 1).

2.2. General Soil and Water Characterization

pH and electrical conductivity (EC) were determined by standard electrodes either directly for irrigation water or in 1:2.5 w/v soil:distilled water extracts for soil. Soil moisture content was determined gravimetrically by oven-drying (105 °C, 16 h) while organic matter content was determined by loss-on-ignition (550 °C, 16 h). Soil CaCO3 was measured by the titration method [27] while soil texture was measured by sedimentation using the Bouyoucos method [27]. Total elemental concentrations were determined by digesting the air-dry soil with 70% HNO3 (1:4 w/v) for 1 h at 100 °C and filtering through a Whatman filter paper No. 541 according to method 3051A [28]. Na was measured using a Model 410 flame photometer (Sherwood Scientific, Cambridge, UK) [27,29] while Mg was measured using a SpectrAA 220FS atomic absorption spectrometer (Varian Inc., Palo Alto, CA, USA). The remaining elements were measured using a S2-Picofox TXRF (Bruker Inc., Billerica, MA, USA). Soil total C, total N and C:N ratio were determined using a CHN2000 analyser (Leco Corp., St Joseph, MI, USA). Fresh soils were extracted with 0.5 M K2SO4 (1:5 w/v) for determining plant-available P, total extractable phenolics, NO3, NH4+, protein and free amino acids. Available P, phenol, NO3, NH4+, and protein were measured colorimetrically using a Powerwave XS spectrophotometer (Biotek Instruments Inc., Winooski, VT, USA). Available P was measured using the ammonium molybdate-H2SO4-ascorbic acid method of [30]. Phenolics were measured using the Folin–Ciocalteu reagent in the presence of sodium carbonate [31], NO3 by reaction with VCl3 and N-(1-naphthyl)ethylenediamine dihydrochloride [32]. NH4+ was determined using the sodium salicylate-sodium nitroprusside-hypochlorite method of [33]. The Bradford method was used to estimate protein content [34]. Total free amino acids were determined by fluorescence according to [35] while DON and DOC were determined using a Multi-N/C 2100 S TOC/TN analyzer (Analytik-Jena AG, Jena, Germany). Microbial biomass C and N were determined by the 7 day chloroform fumigation-0.5 M K2SO4 extraction procedure of [11] (KEN = 0.5; KEC = 0.35). Basal soil respiration (SR) was measured using an automated CIRAS-SC soil respirometer at 20 °C (PP Systems Ltd., Hitchin, UK).

2.3. Soil Phospholipid Fatty Acid (PLFA) Microbial Community Structure

Microbial community structure was measured by phospholipid fatty acid (PLFA) analysis following the method of [36]. Briefly, replicate samples of soil from each site were sieved to pass 5 mm, stored, and shipped on dry ice (−78.5 °C) to a commercial laboratory (Microbial ID, Newark, DE, USA), for analysis. Samples (2 g) were then freeze-dried and Bligh–Dyer extractant (4.0 mL) containing an internal standard added. Tubes were sonicated in an ultrasonic cleaning bath for 10 min at room temperature before rotating end-over-end for 2 h. After centrifuging (10 min), the liquid phase was transferred to clean 13 mm × 100 mm screw-cap test tubes and 1.0 mL each of chloroform and water added. The upper phase was removed by aspiration and discarded while the lower phase, containing the extracted lipids, was evaporated at 30 °C. Lipid classes were separated by solid phase extraction (SPE) using a 96-well SPE plate containing 50 mg of silica per well (Phenomenex, Torrance, CA, USA). Phospholipids were eluted with 0.5 mL of 5:5:1 methanol:chloroform:H2O [37] into glass vials, the solution evaporated (70 °C, 30 min). Trans esterification reagent (0.2 mL) was added to each vial, the vials sealed and incubated (37 °C, 15 min). Acetic acid (0.075 M) and chloroform (0.4 mL each) were then added. The chloroform was evaporated just to dryness and the samples dissolved in hexane. An Agilent 6890 gas chromatograph (GC) (Agilent Technologies, Wilmington, DE, USA) equipped with auto sampler, split-split less inlet, and flame ionization detector was used. Fatty acid methyl esters (FAMEs) were separated on an Agilent Ultra 2 column, 25 m long × 0.2 mm internal diameter × 0.33 µm film thickness. FAMEs were identified using the MIDI PLFAD1 calibration mix (Microbial ID, Inc., Newark, DE, USA) and classified according to [38]. The biomarker group for putative arbuscular mycorrhizal fungi (AM Fungi) was 16:1ω5c, for Gram-negative bacteria they were 18:1ω7c, 17:0cy and 19:0cy, while for Gram-positive bacteria they were 15:0i, 15:0a, 16:0i, 17:0i and 17:0a. The biomarker used for eukaryotes was 20:4ω6c, for total fungi it was 18:2ω6c, and for actinomycetes they were 16:0 10-Me, 17:0 10-Me and 18:0 10-Me) [39].

2.4. Rate of 14C-Labelled Substrate Mineralization in Soil

Replicate samples of soil from each site (10 g) were placed in individual 50 mL sterile polypropylene tubes and 0.5 mL of a 14C-uniformly labelled substrate (10 µM; 3.7 kBq mL−1) was added to the soil surface. The 14C-labelled substrate added to individual tubes included: (i) glucose, (ii) an equimolar mixture of 15 different L-amino acids (alanine, arginine, aspartic acid, leucine, tyrosine, valine, phenylalanine, glutamic acid, threonine, proline, lysine, histidine, glycine, isoleucine, serine), or (iii) the oligopeptide L-trialanine (a component of peptidoglycan). After addition of the 14C-labelled substrate, a 1 M NaOH trap (1 mL) was placed inside each tube to catch respired 14CO2 and the tubes sealed and incubated at either 10, 20, 30 or 40 °C. Production of 14CO2 over time was measured by periodically replacing the NaOH trap after 0.5, 1, 3, 6, 24, 48, 168, 336, 504, and 672 h. 14CO2 was determined by liquid scintillation counting using a Wallac 1409 liquid scintillation counter (PerkinElmer Inc., Waltham, MA, USA) and OptiPhase Hi-safe 3 scintillation cocktail (PerkinElmer Inc.). After the removal of the final NaOH trap at 28 d, the soils were shaken for 20 min at 200 rev min−1 with 25 mL of 0.5 M K2SO4 to extract any 14C remaining in solution or bound to the soil’s solid phase [23,40]. The extracts were measured by liquid scintillation counting as described earlier. Near identical experiments were also performed but with sterilized soil (autoclaved at 121 °C, 1 h and cooled for 10 min prior to use) to confirm that the release of 14CO2 was biologically mediated and not produced from abiotic processes. The rate of 14C-substrate mineralization in the soil was described by a double first-order exponential decay model:
f = [a1 × exp(−k1 t)] + [a2 × exp(−k2 t)]
where f is the percentage of 14C-substrate remaining in the soil at time t (hours). Parameters a1 and a2 represent the size (% of total 14C added) of the fast and slow 14C turnover pools respectively [22,41]. k1 is the rate constant describing the turnover rate of C pool a1 which is ascribed to the immediate use of substrate-derived 14C in catabolic processes (i.e., respiration). k2 is the rate constant describing the turnover of C pool a2 and is attributed to the second slower phase of 14CO2 production associated with turnover of substrate-derived 14C immobilised in the microbial biomass [41]. The half-life (t½) of pool a1 is defined as:
t½ = ln(2)/k1
Total microbial uptake (14Cuptake) can be defined as:
14Cuptake = 14CTot14CK2SO4
where 14CTot is the total amount of 14C label added to the soil and 14CK2SO4 is the amount of 14C label recovered in the K2SO4 extract [23]. The amount of labelled 14C remaining in the microbial biomass (14Cmic) after 28 days was calculated as follows:
14Cmic = 14CTot14CO214CK2SO4
where 14CO2 is the total amount of label recovered in the NaOH traps [23]. Lastly, microbial C use efficiency (Miceff) for each substrate can be defined as, [41,42].
Miceff = a2/(a1 + a2)

2.5. Effects of Temperature on 14C Mineralization Rate

The effect of temperature (T) on 14C mineralization rate (MR) was described by applying a square root transformation model to the data according to [43,44] using the equation
MR½ = α (TTmin)
where MR is the mineralization rate (defined as the initial linear rate of 14CO2 production at each temperature), α is a slope parameter linked to the absolute rates, and Tmin is the temperature at which mineralization ceases. The linear phase of 14CO2 evolution was defined as 0–48 h at 10 °C, 0–24 h at 20 °C, 0–6 h at 30 °C, and 0–3 h at 40 °C.

2.6. Statistical Analysis

After testing for normality, statistical analyses (analysis of variance (ANOVA) with Tukey’s pairwise comparison) were performed using SPSS 20 (SPSS Inc., Chicago, IL, USA) or Minitab 16 (Minitab Inc., State College, PA, USA) with significance differences set at p ≤0.05 unless otherwise stated. The double first-order exponential decay equation was fitted to experimental results using Sigmaplot 12.3 (SPSS Inc., Chicago, IL, USA). Linear regression models describing 14C mineralization rate and temperature were made using Sigmaplot 12.3.

3. Results

3.1. General Physical and Chemical Irrigation Water and Soil Properties

The chemical properties of irrigation water used at each site are presented in Table 1 and additional material in Table S1. All chemical characteristics were within acceptable national values of water quality for irrigation according to [45,46] with the exception of the EC value of groundwater and mixed water, which were higher than the standard of 3 mS cm−1. There were significant differences between all chemical characteristics of irrigation waters except Cr, Fe, phenolics, total N, total C, NH4+, and DOC/DON ratio content. Groundwater showed the highest pH and Zn contents, but the lowest available P, NO3, DON, DOC, and amino acid contents of the three irrigation water sources. Treated wastewater showed the highest available P, DON, and amino acid contents; however, it shows the lowest EC, Na, S, Cl, K, Ca, Mg, and Zn contents of the three irrigation water sources. The mixed water showed the highest EC, Na, S, Cl, K, Ca, Mg, NO3, and DOC contents but showed the lowest pH value of the three irrigation water sources.
Physical and chemical characteristics of the soils used in this study are presented in Table 2 and Table 3. Soils were classified as sand or sandy loam [47]; the average pH and EC values for all soils were 8.55 ± 0.02 and 0.72 ± 0.08 mS cm−1, respectively. No differences in soil pH and EC were observed between sites or sampling depths. The soils tested in this study can be classified as having low to medium organic matter (OM) contents, according to [48]; the average OM and CaCO3 contents for all soils were 1.7% ± 0.22% and 23.6% ± 3.02%, respectively. Significant differences in OM and CaCO3 were observed between sites (p ≤ 0.05), but no significant differences were observed between sampling depths, except in OM contents of site 1. In topsoils, the highest total C (TC) content was observed in site 3, in the subsoils; the highest content was shown in site 2 (23.6 ± 2.8 g C kg−1 soil, and 34.5 ± 3.6 g C kg−1 soil in topsoils and subsoils, respectively); the lowest TC content was observed in site 1 in both topsoils and subsoils (13.3 ± 1.3 g C kg−1 soil, and 10.5 ± 1.4 g C kg−1 soil in topsoils and subsoils, respectively) with significant differences between sites (p ≤ 0.05), but no significant differences between sampling depths (p > 0.05). The average total N (TN) contents and C:N ratio for all soils were 0.94 ± 0.07 g N kg−1 soil and 22.0 ± 4.8, respectively. No differences were observed between sites or sampling depths, but there were significant differences between sites in the subsoil C:N ratios. All soils posessed a very low NO3 content, according to [49]. The highest NO3 concentration was shown in site 2 (7.7 ± 0.6 mg NO3-N kg−1 soil, and 3.2 ± 0.6 mg NO3-N kg−1 soil in topsoils and subsoils, respectively) and the lowest NO3 concentration in site 1 (4.6 ± 0.6 mg NO3-N kg−1 soil, and 0.7 ± 0.1 mg NO3-N kg−1 soil in topsoils and subsoils, respectively), with significant differences between sites (p ≤ 0.05), but no significant differences between sampling depth, except in site 1. Site 1 showed the highest NH4+ concentration in top and subsoils (1.05 ± 0.13 mg NH4+-N kg−1 soil and 1.3 ± 0.2 mg NH4+-N kg−1 soil, respectively), while the lowest NH4+ concentration in the topsoils was observed in site 2; in the subsoils, the lowest content was observed in site 3 (0.05 ± 0.02 mg NH4+-N kg−1 soil, and 0.33 ± 0.18 mg NH4+-N kg−1 soil, respectively) with significant differences between sites (p ≤ 0.05), but no significant differences between sampling depths (p > 0.05). Total free amino acid (TFAA) concentrations show similar patterns to NH4+ but no significant differences exist between sites or sampling depths (p > 0.05), except between the depths in site 1 (0.19 ± 0.01 mg TFAA-N kg−1 soil, and 0.13 ± 0.01 mg TFAA-N kg−1 soil in topsoils and subsoils, respectively). As expected, TFAA concentrations were lower than DON concentrations in all sites and followed the pattern: site 2 > site 3 ≥ site 1, with significant differences between them (p ≤ 0.05). The average protein, DON, DOC, microbial N and microbial C content for all soil sites were 4.17 ± 0.35 mg N kg−1 soil, 6.73 ± 0.62 mg N kg−1 soil, 41.0 ± 5.5 mg C kg−1 soil, 10.7 ± 2.8 mg N kg−1 soil, and 105.2 ± 15.2 mg C kg−1 soil, respectively. No differences were observed between sites or sampling depths, except between sites in the subsoils and DOC concentrations, and followed the pattern of site 3 > site 2 ≥ site 1 between sites in the topsoils and microbial N, and followed the pattern of site 2 > site 3 > site 1 between sampling depths and microbial N or C in site 2 (p ≤ 0.05). TFAA concentrations represent 2.44% of DON concentrations in topsoils and 2.03% in subsoils, following a pattern of site 1 > site 2 > site 3. DOC/DON ratio showed that there were significant differences between sites in the subsoils, following a pattern of site 3 ≥ site 1 > site 2 (5.70 ± 0.65, 5.33 ± 0.29, and 3.25 ± 0.21 respectively) (p ≤ 0.05), but there were no significant differences between sites in the topsoils or sampling depths (p > 0.05), except between the sampling depths in site 2 (p ≤ 0.05).

3.2. Soil PLFA Microbial Community Structure

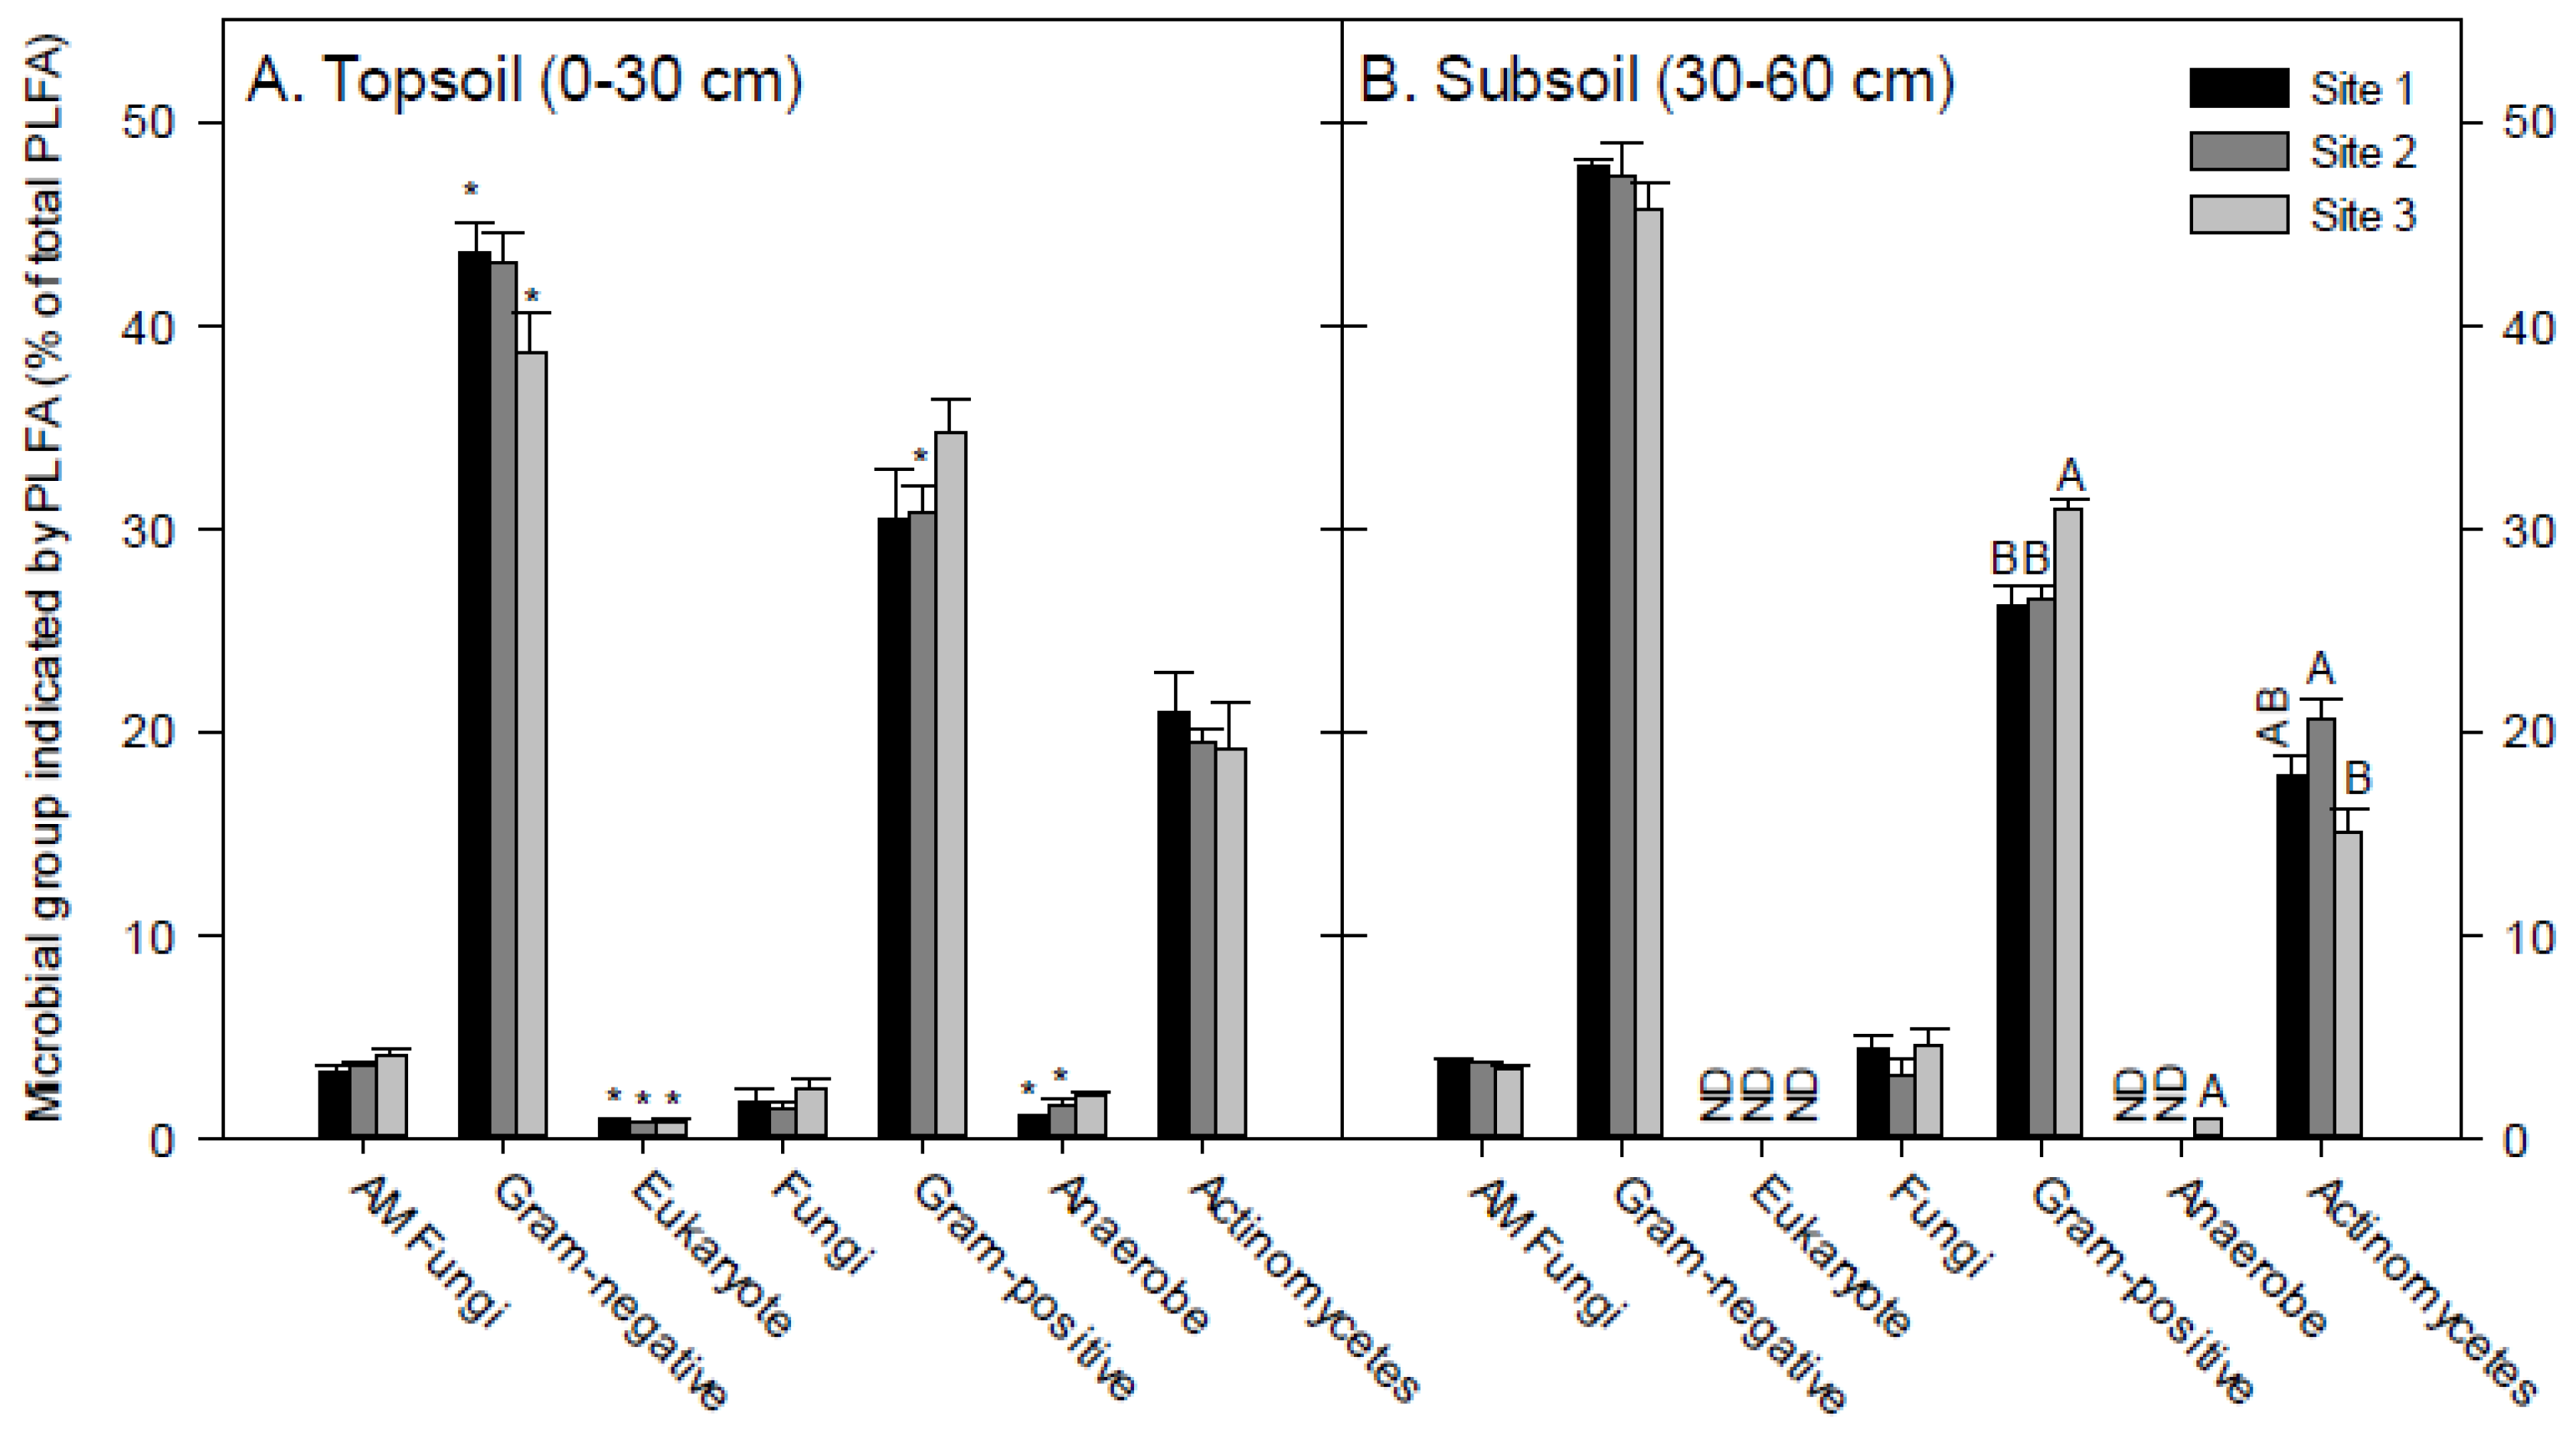
Soil PLFA microbial community structure is presented in Figure 2. The average microbial biomass based on total PLFA was 45.9 ± 11.1 and 25.6 ± 4.1 nmol g−1 in topsoils and subsoils, respectively. In most soils, the presence of the PLFAs followed the series: Gram-negative bacteria > Gram-positive bacteria > actinomycetes > arbuscular mycorrhiza (AM) fungi ≥ fungi ≥ eukaryotes. Overall, few major differences were observed in the PLFA composition between sites or sampling depths.

3.3. Dissolved Organic Nitrogen (DON) Compounds’ Mineralization and Half-Life

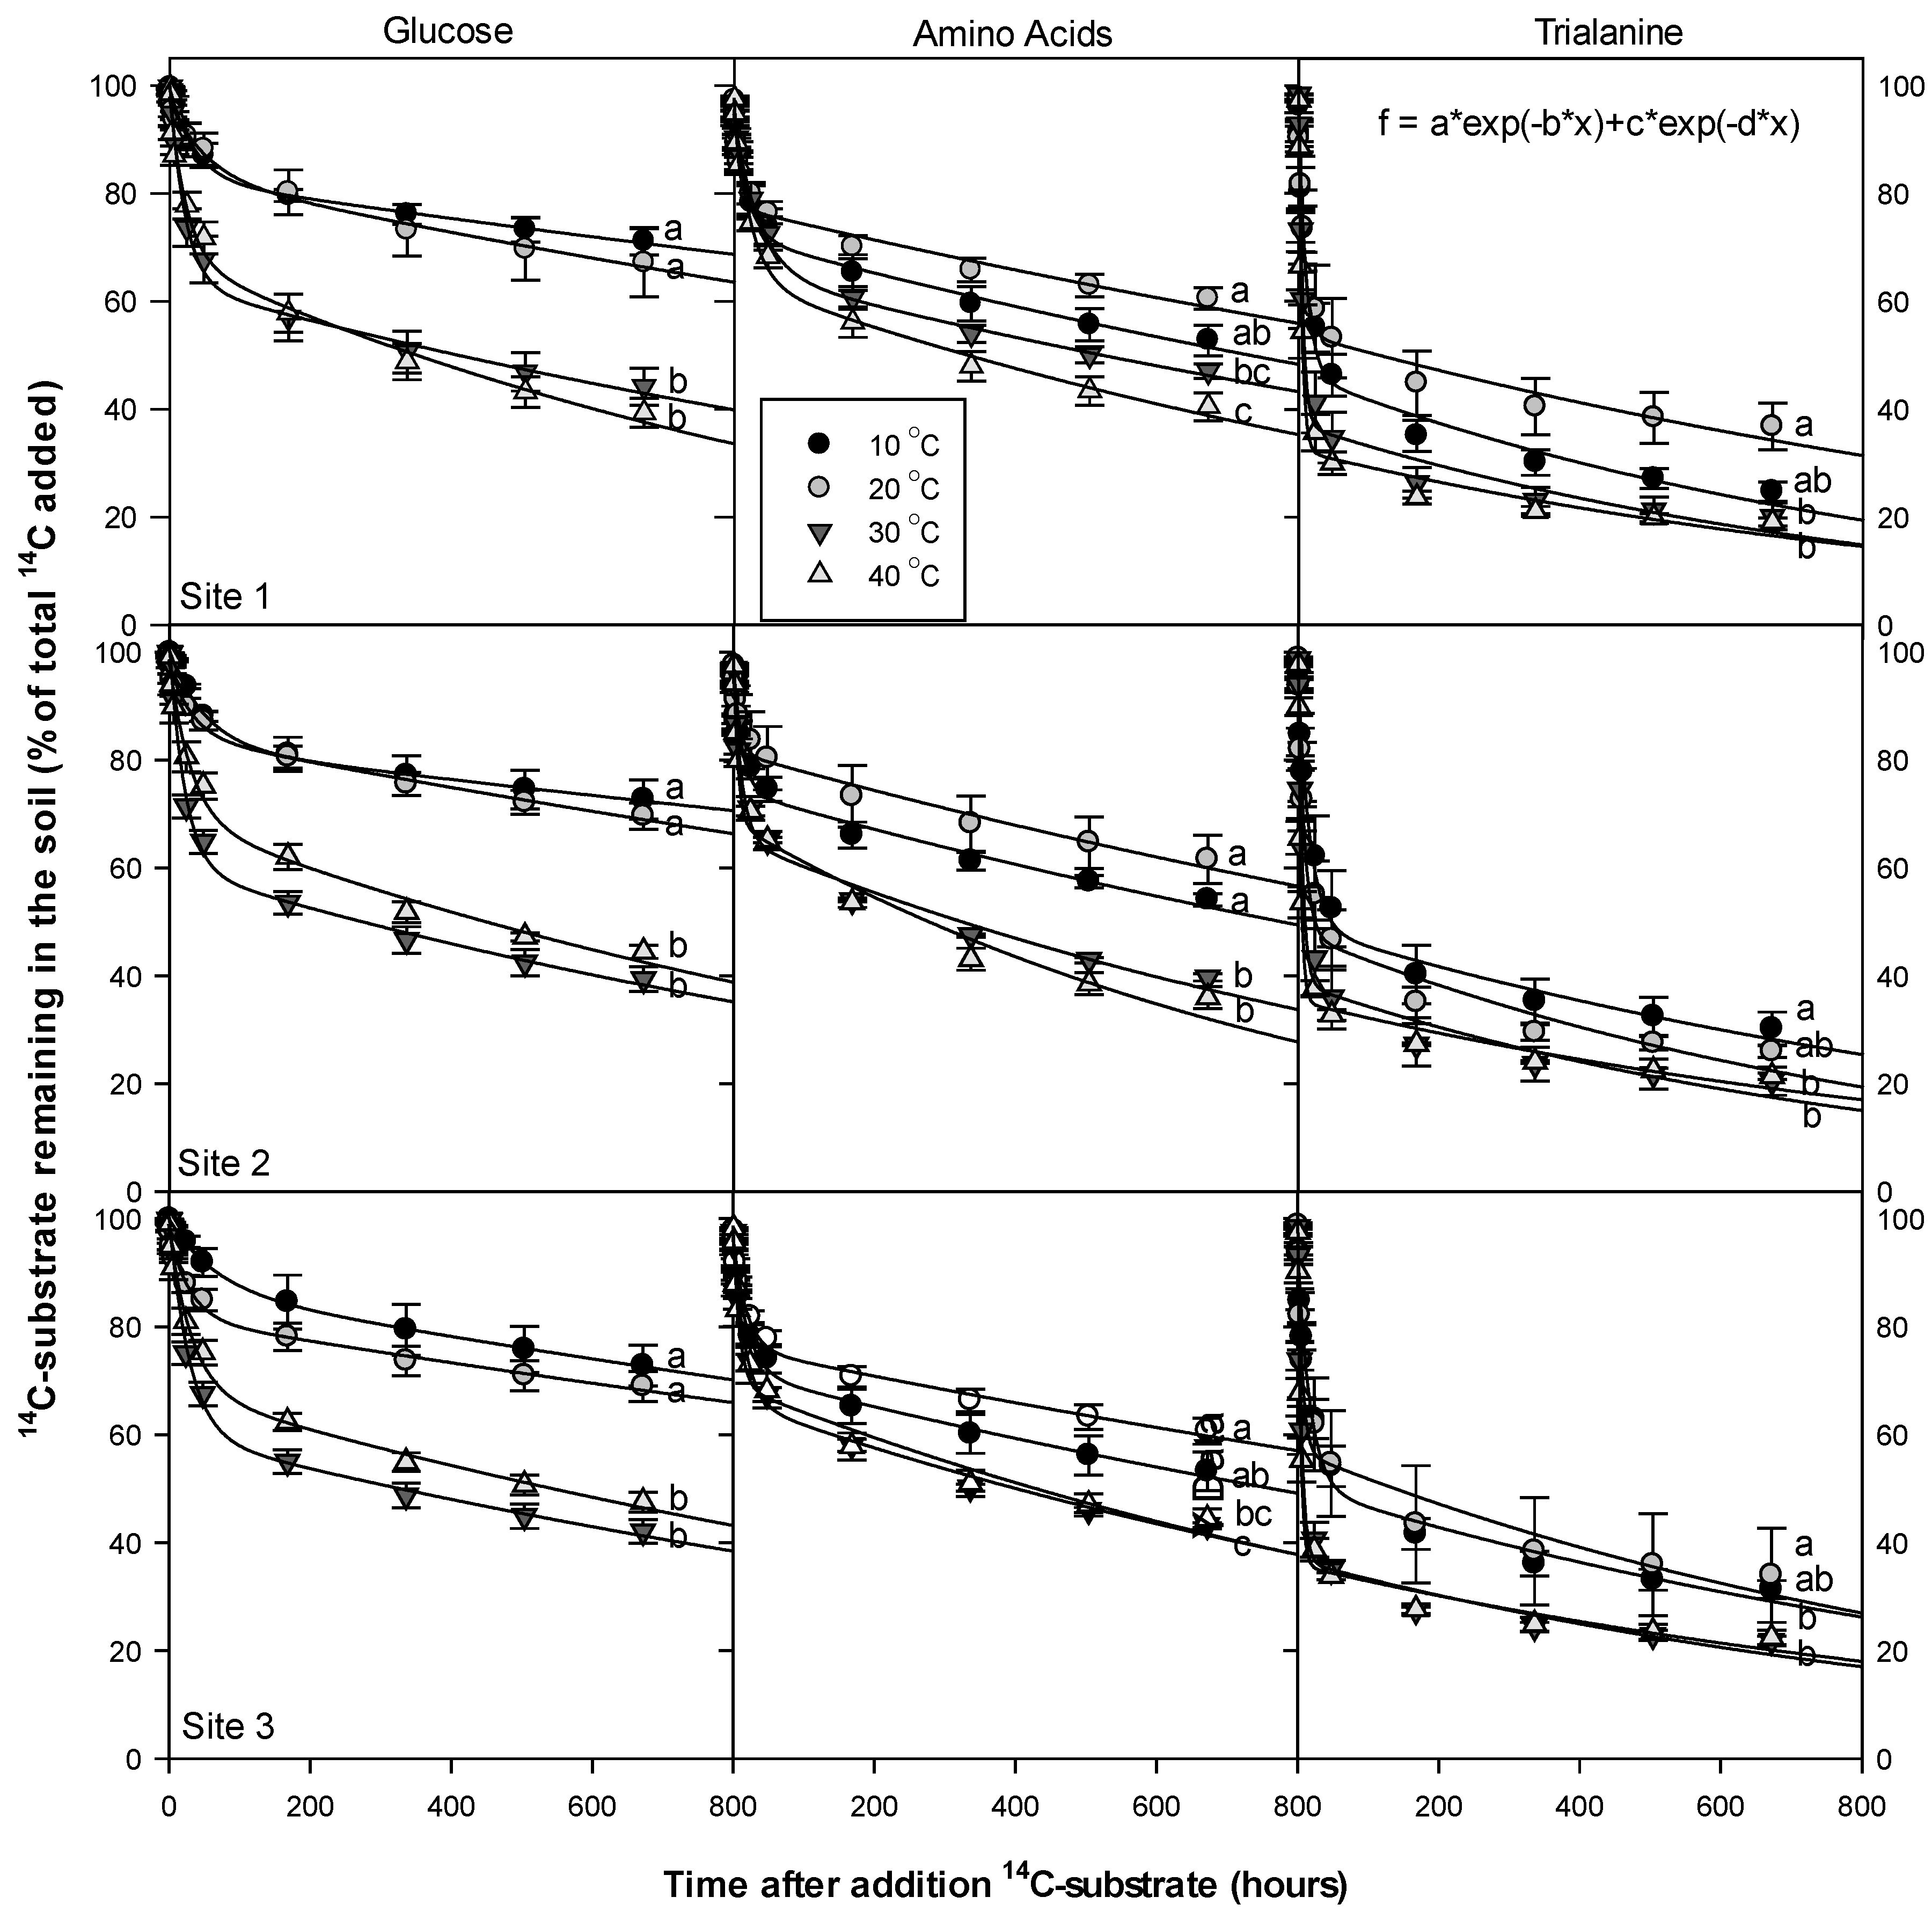
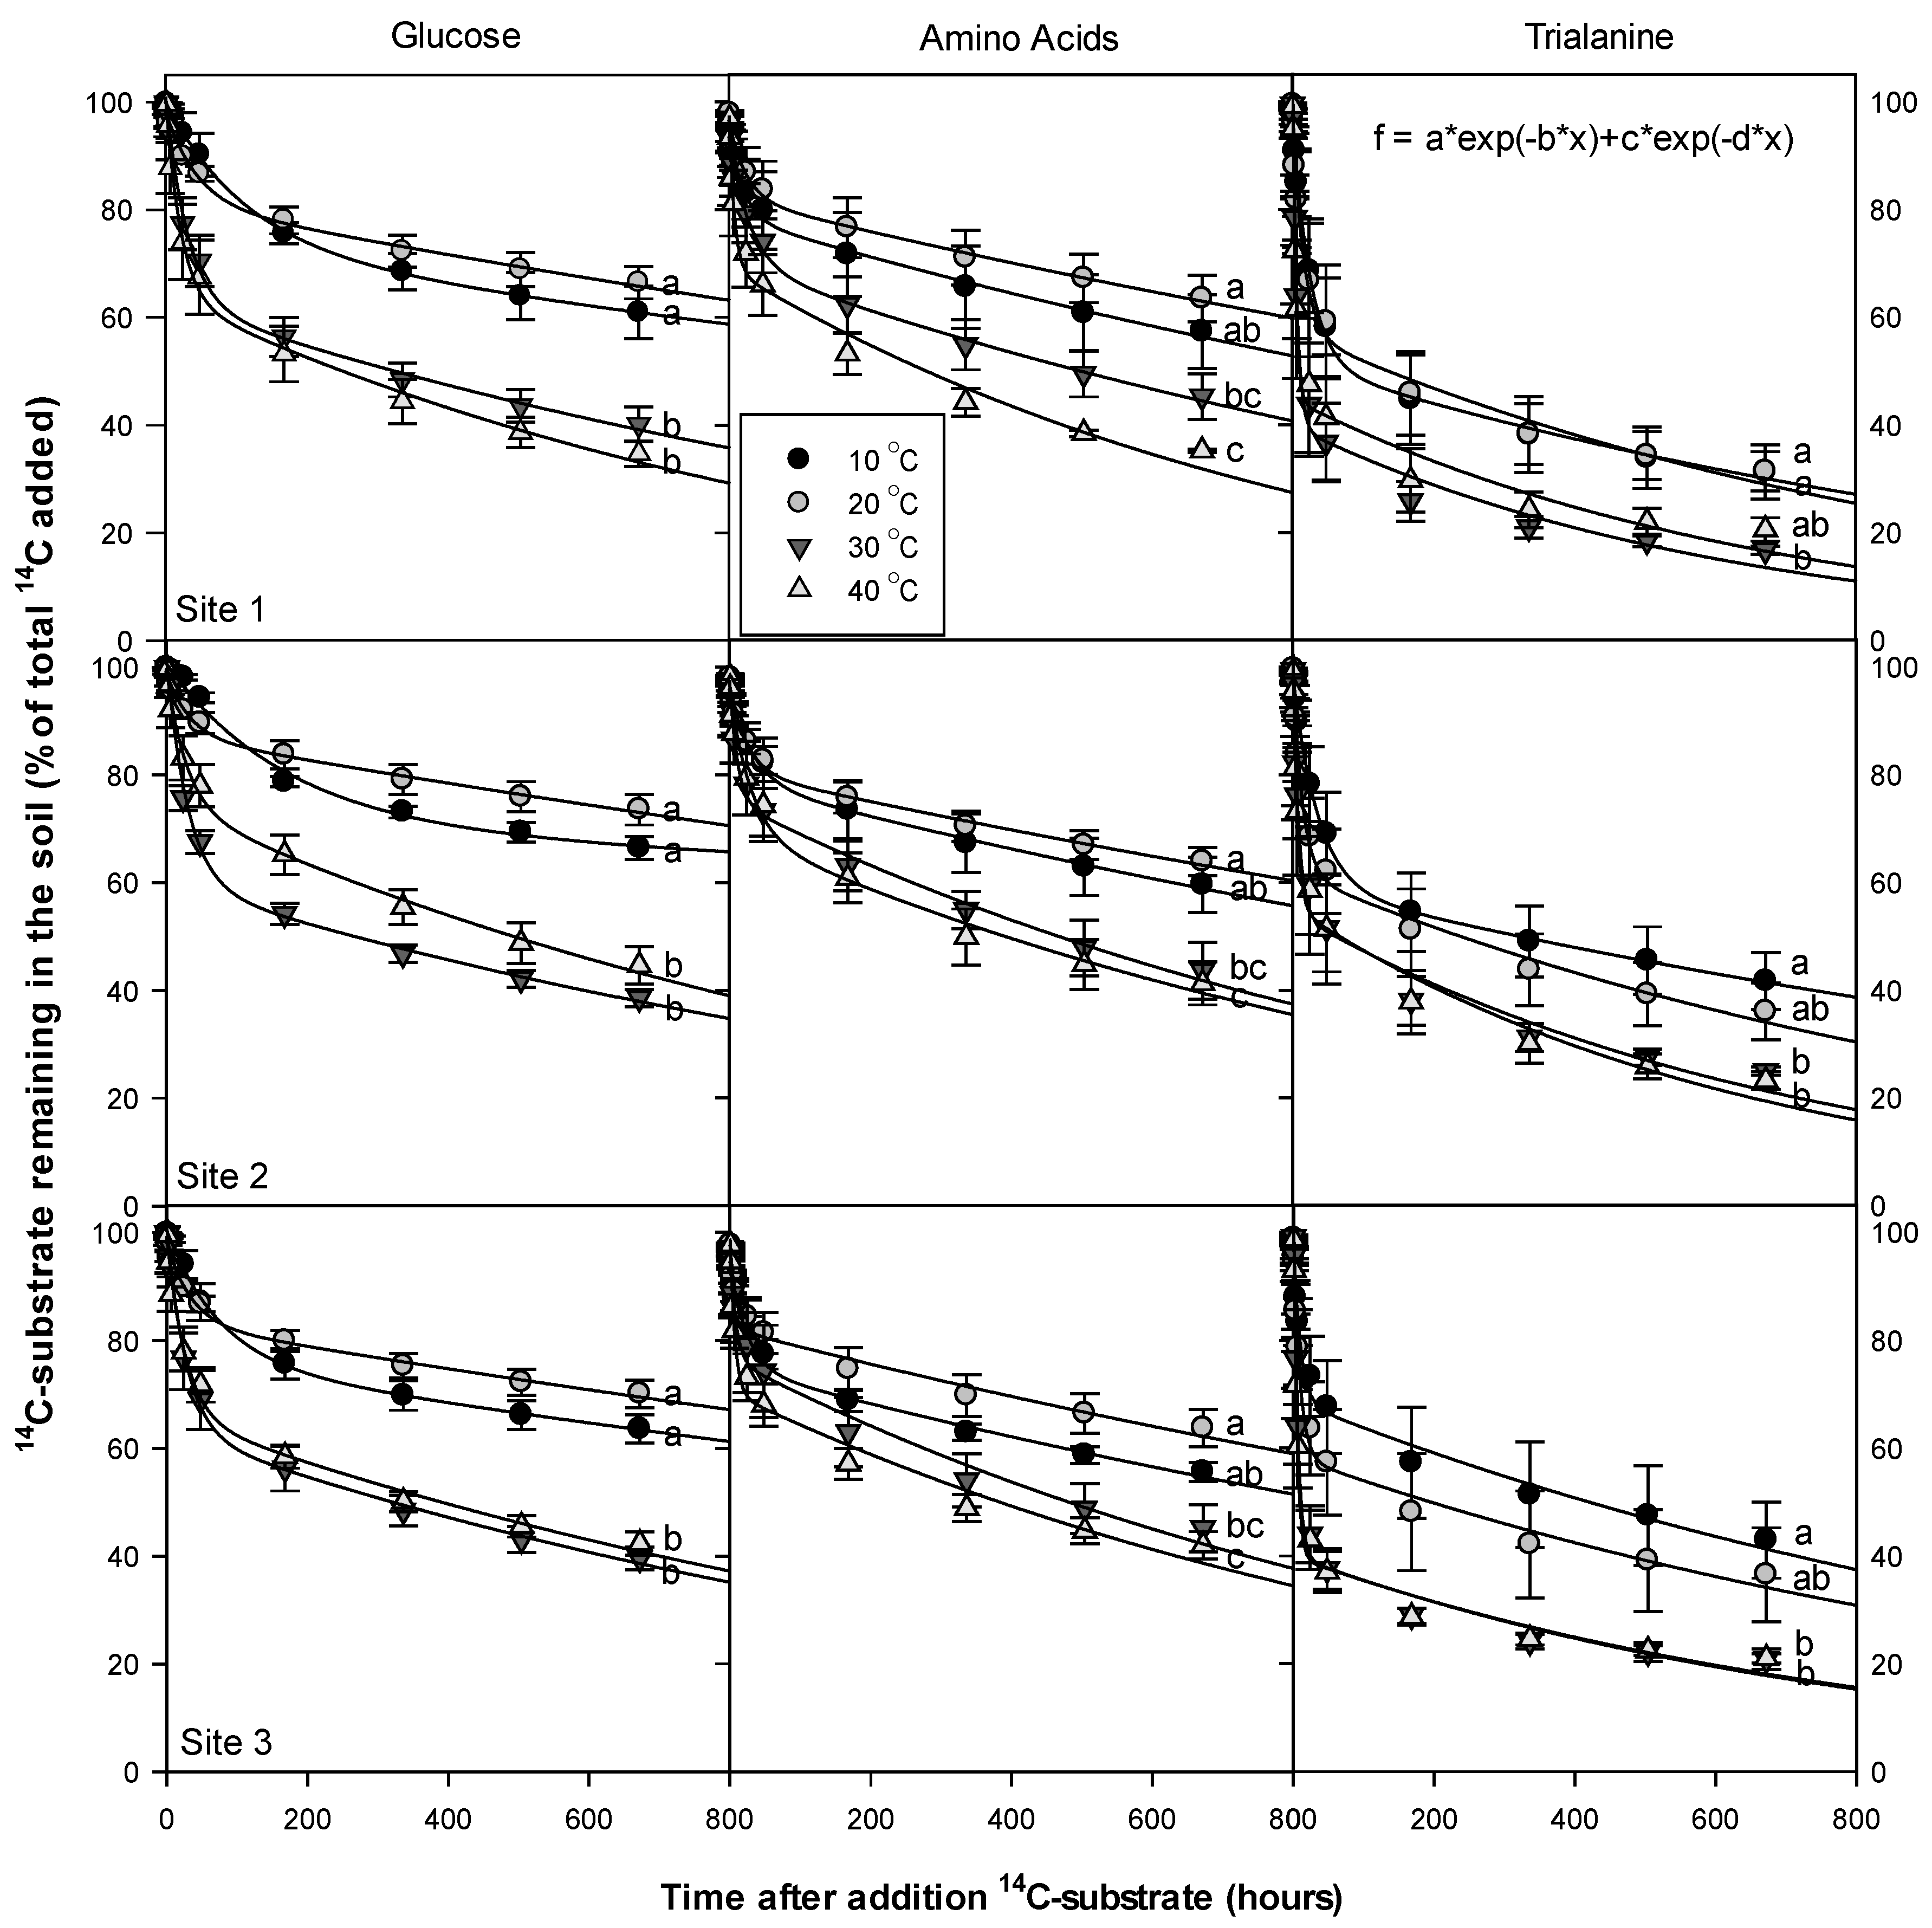
Overall, no significant differences were observed between the goodness of fit of the double exponential decay model to the experimental data (R2 = 0.999 ± 0.001) when comparing different substrates or sites at different temperatures. The effect of temperature on different 14C-substrate mineralization in the topsoils and subsoils are shown in Figure 3 and Figure 4 respectively, while the kinetic parameters from the double first-order exponential decay equation in different sites are presented in Table 4 and Table 5. There were no significant effects observed between sites or sampling depths with the production of 14CO2 (p > 0.05). The production of 14CO2 increases with increasing temperature in almost all cases (p ≤ 0.05), as shown in Figure 3 and Figure 4. The cumulative amount of 14CO2 evolved after the addition of glucose to the topsoils and subsoils increased significantly with increasing temperature from 20 °C to 30 °C for all soils, with the pattern showing little difference between sites. Although temperature increases overall mineralization, increasing temperatures from 30 °C to 40 °C for all soils and substrates had little overall effect on the final amount of 14C-substrate mineralized (Figure 3 and Figure 4).
The shortest half-life (t½) of the fast mineralization pool (a1) of glucose in both topsoils and subsoils was observed in site 1 (11.7 ± 3.7 h and 18.4 ± 8.5 h, respectively). Amino acid t½ was shortest in topsoils of site 2 and subsoils of site 3 (4.4 ± 0.5 h; 9.1 ± 5.1 h, respectively). The shortest t½ of trialanine was observed in topsoil of site 2 and subsoil of site 3 (2.9 ± 0.3 h; 4.2 ± 1.3 h, respectively). There were no significant differences in t½ between sites, except after the addition of amino acids at 40 °C, which led to significant differences between sites in topsoil and followed the pattern of site 1 > site 3 > site 2. In most cases, topsoils exhibited shorter t½ values than subsoils, with t½ values decreasing with increasing temperature with some significant differences apparent (Table 6). The pool size a1 describes the relative amount of 14C substrates taken up and used immediately in respiratory processes by the microbial community. In all cases, no significant effects were observed between sites or sampling depths in the size of pool a1 (p > 0.05), but temperature generally increased the amount of 14C allocated to pool a1. Increasing temperatures from 20 °C to 30 °C for all soils and substrates has some overall effect on the size of pool a1 and a2 (p ≤ 0.05; Table 4 and Table 5). Increasing temperatures from 30 °C to 40 °C for all sites after the addition of 14C amino acids or 14C trialanine has some overall effect on the size of pool a1 and a2 (p ≤ 0.05). The only exception was an observed decrease in C allocation to pool a1 after the addition of 14C amino acids to the topsoil of site 2 and the subsoil of site 3 when temperature increased from 30 °C to 40 °C; allocation to pool a2 consequently increased. 14C partitioned into pool a1 after the addition of 14C glucose decreased in both topsoil and subsoils, with increasing temperature from 30 °C to 40 °C in all soil types. Only a small amount of unmetabolized 14C label was recovered from the soil by 0.5 M K2SO4 at the end of 28 day incubation periods (<1% of the total 14C applied in almost all cases).

3.4. Microbial Substrate-C Use Efficiency

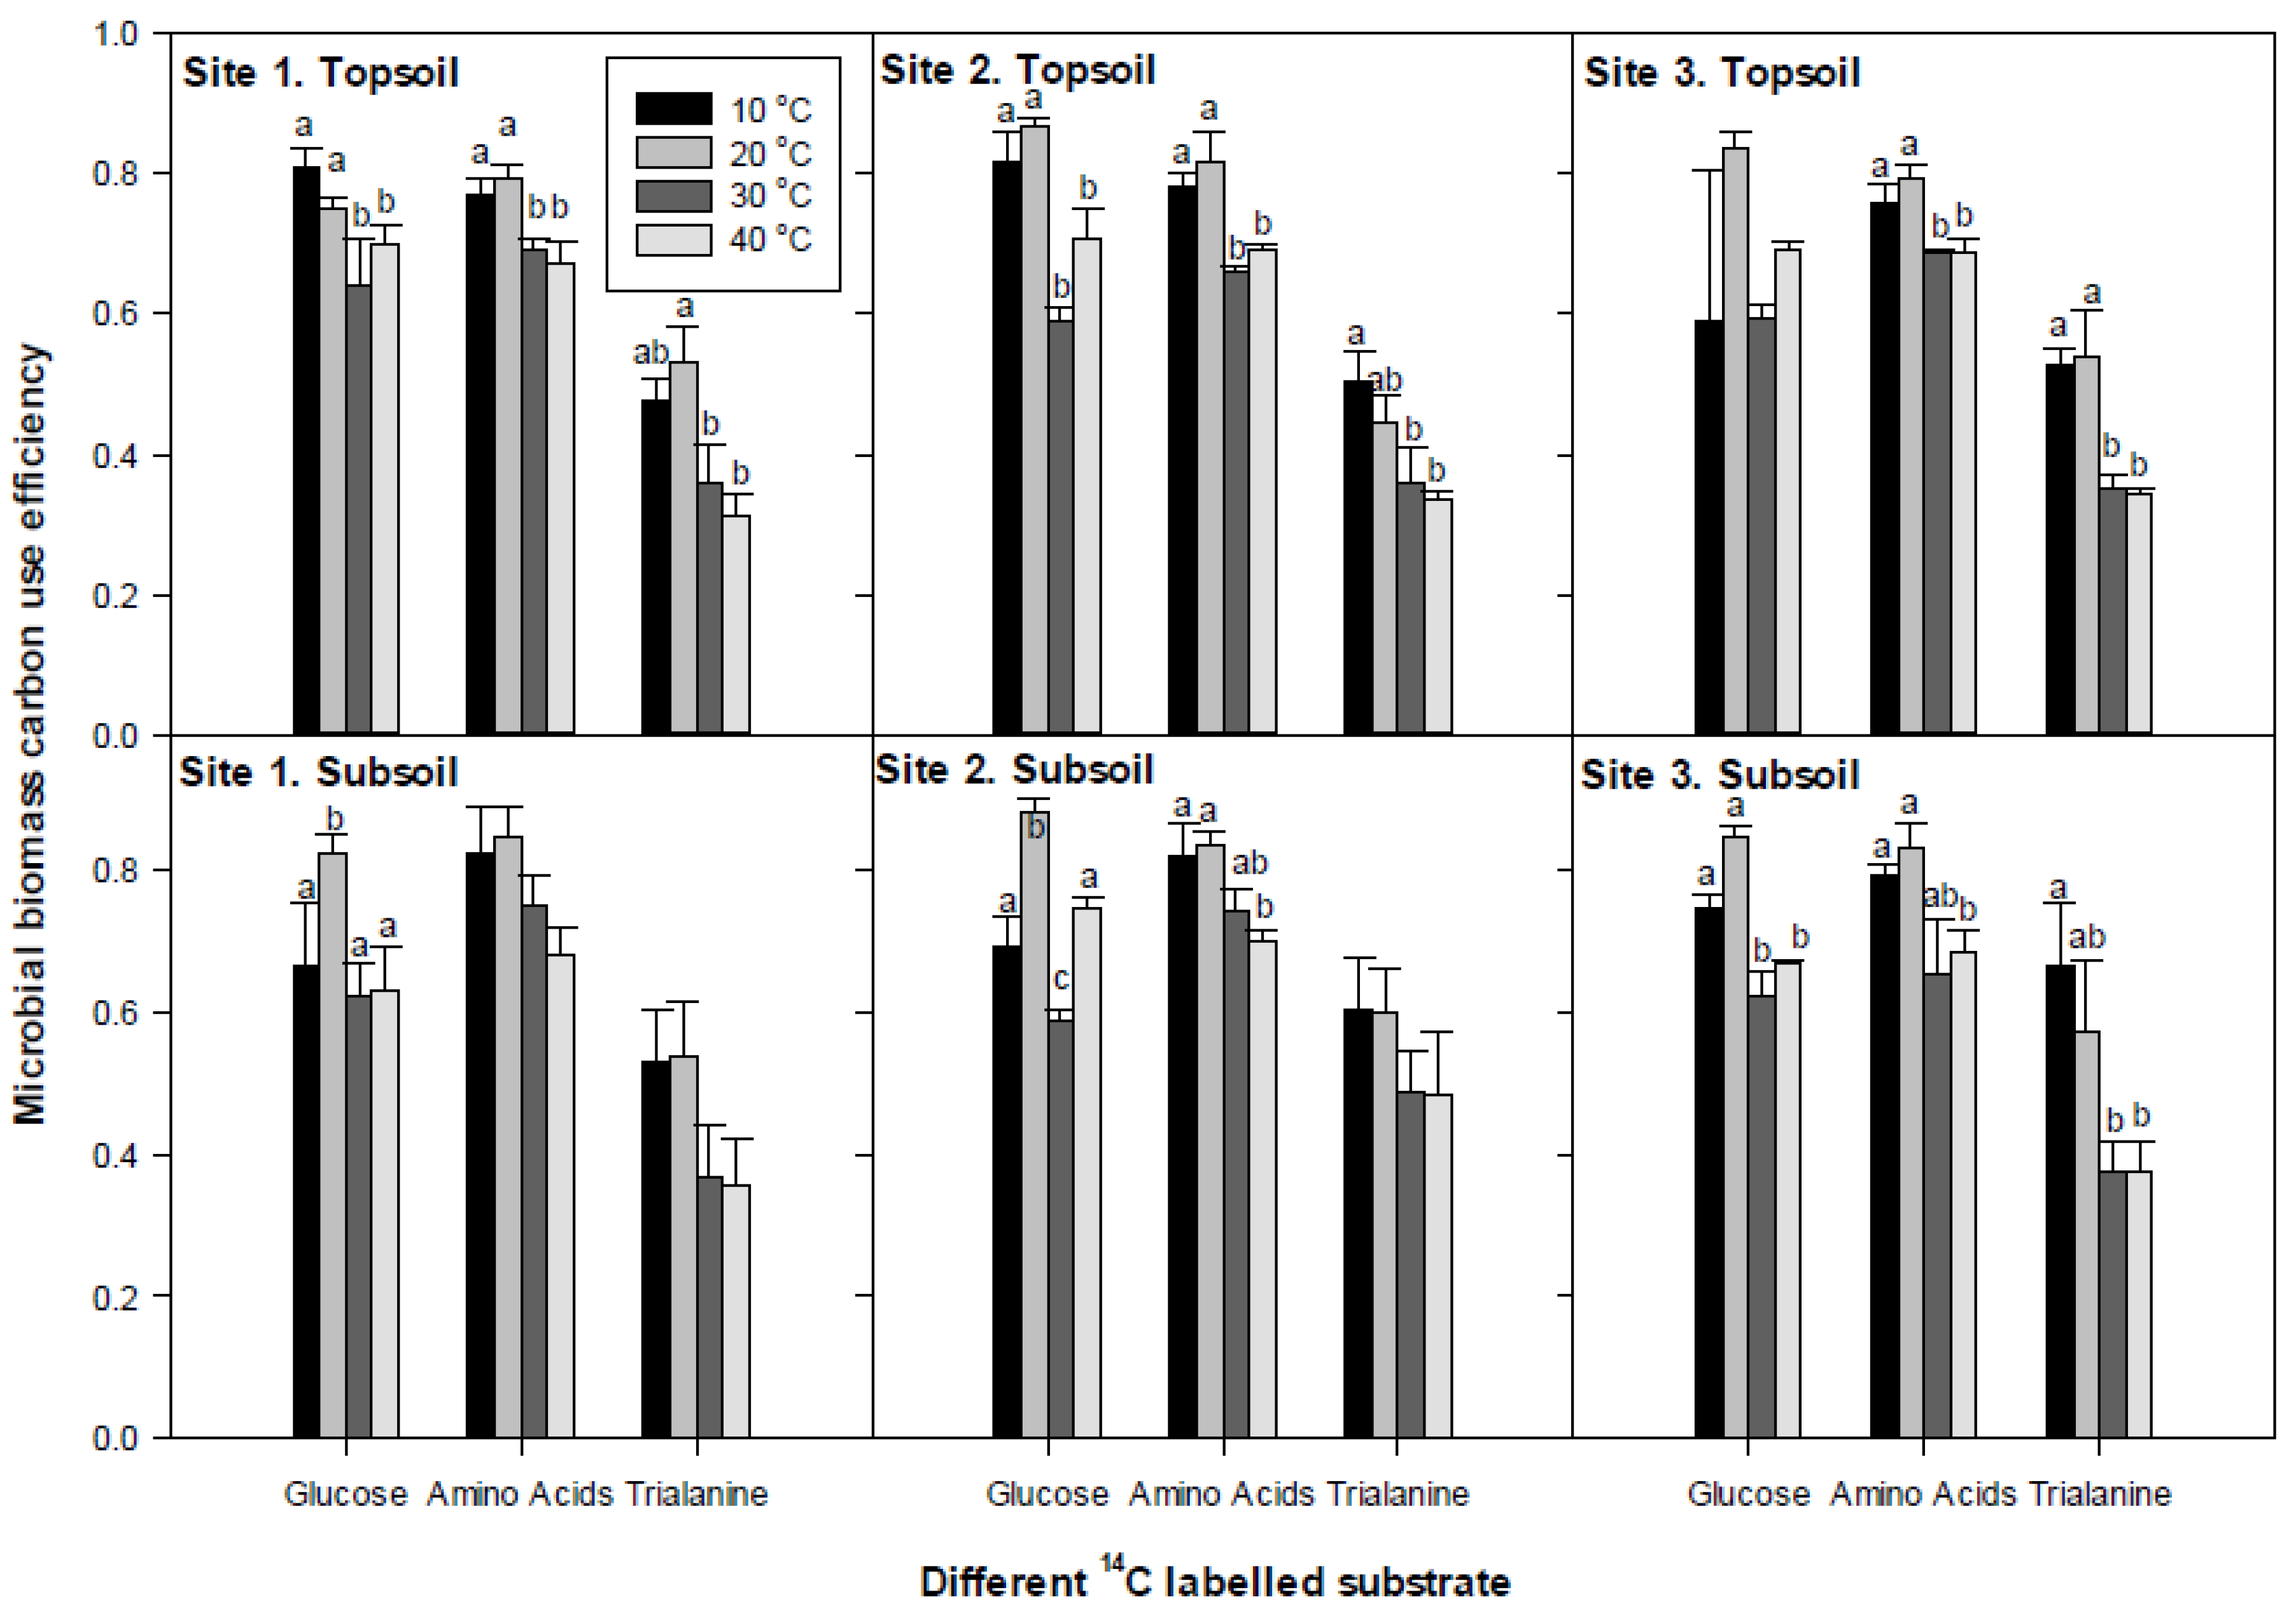
Microbial C use efficiency (Miceff) gives an indication of the relative amount 14C immobilized by the microbial community after the addition of DOC or DON substrates (the immobilization-to-mineralization ratio). A comparison of Miceff between the three sites shows some significant differences (p ≤ 0.05) (Figure 5) and temperature tended to decrease Miceff, particularly between 20 °C and 30 °C in all soil types (p ≤ 0.05).

3.5. Temperature Dependency of 14C Respiration Rate

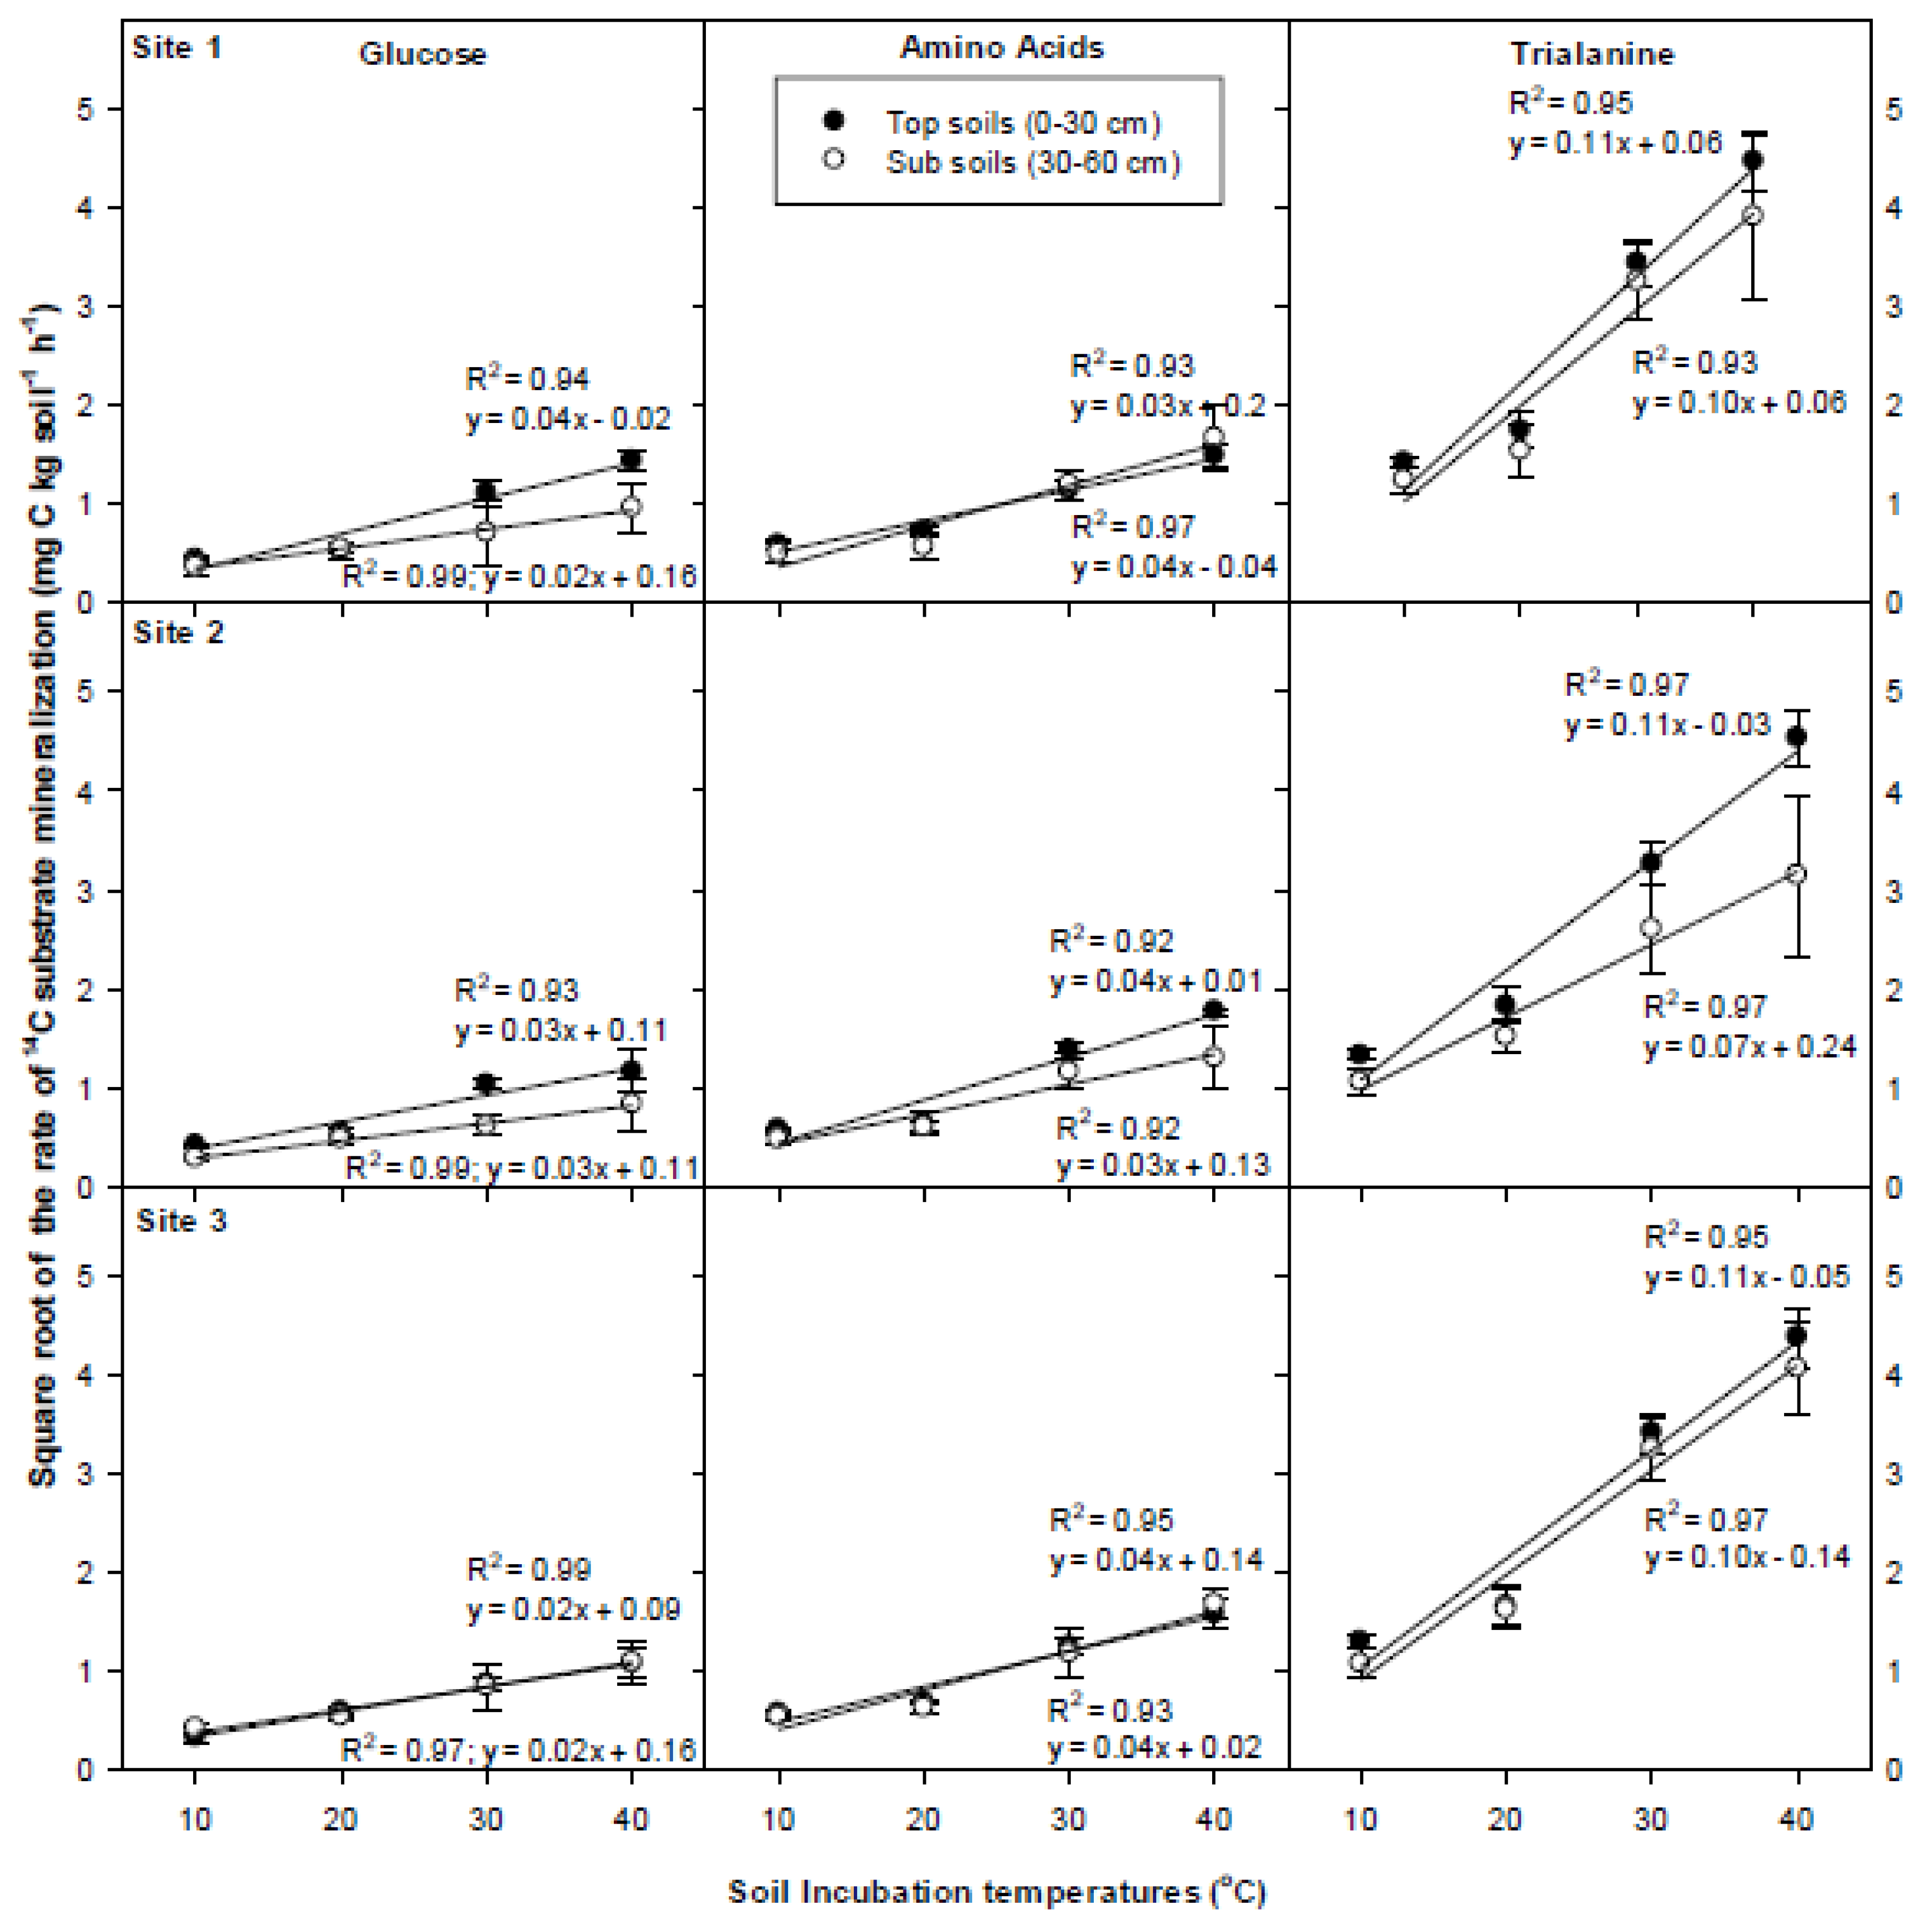
A square root transformation of 14C respiration rate and temperature [43,44] was used to estimate the effect of temperature on the immediate rate of 14CO2 production from the labelled substrates added to soil sites (Figure 6). In all cases, the square root value increased with increasing temperature (p ≤ 0.05). The square root transformation produced a linear fit when plotted against respiration rate with R2 values ranging from 0.92 to 0.99 for all soils. In almost all cases, no effect was observed between soil sites or depths on the square root of 14C respiration rate (p > 0.05).

4. Discussion

4.1. DON Compounds Mineralization and Half-Life

To our knowledge, the comparison of DON and DOC mineralization responses to temperature in agricultural oasis soils has not previously been reported. To achieve sustainable agriculture in an oasis system and to maintain N fertility, we need to understand the controlling factors that regulate C and N related processes in soil. This study focuses only on the short-term effects of temperature changes on DOC and DON mineralization in three agricultural sites from the Al-Hassa eastern oasis, KSA. We know that the depletion of 14C glucose, 14C amino acids and 14C trialanine in soil can only happen as a result of either abiotic mineralization or microbial uptake [50,51]. Here, we assume that the production of 14CO2 after the addition of radiolabelled substrate was from microbial uptake, since no evolution of 14CO2 was observed from the results of sterile treatments (Figure S1). The range of temperature in this study (10–40 °C) was designed to reflect the actual temperature in soil at the site and those that might arise in the future. Therefore, we limited our maximum temperature to 40 °C. However, it should be noted that soil surfaces in these arid regions can exceed 65 °C when in direct sunlight [52,53,54]. These extreme surface temperatures can influence soil processes, soil nutrient and organic matter cycling.
As expected, our results show an increase in substrate partitioning to the fast mineralization pool (a1) with increasing temperature. This could be due to the microorganisms increasingly using 14C for energy production and cell-maintenance activities (e.g., generation of heat shock proteins, membrane lipid renewal) rather than for growth and storage [41]. This result is consistent with [55], who also showed that the size of C pool a1 was sensitive to temperature. The results presented in Figure 3 and Figure 4, Table 4 and Table 5 generally demonstrate that the rate of 14CO2 evolution from DON > DOC compounds with shorter t½ for DON substrates, given that the rate of DON turnover is higher than the DOC rate. This could be due to the higher N and C content of DON substrates than DOC substrate for rapidly cycling pool rather than different soil microbial community structure defined by phospholipid fatty acid (PLFA) profiling. Reference [9] reported that the microbial uptake rate of trialanine > dialanine > alanine and could be due to higher N and C contents in trialanine compared to free amino acids. It is also likely that amino acids have higher 14CO2 respiration values than glucose as amino acids are processed by different metabolic pathways inside the cell. After uptake into the cell, amino acids are frequently transaminated or deaminated leading to the production of organic acid skeletons (keto acids), which can be used directly in respiratory pathways [55,56]. This is further supported by continental-scale measures of microbial C-use efficiency in soil microbial communities supplied with sugars and amino acids [57]. In contrast, glucose-derived C is typically preferentially used for producing new cell biomass. This suggestion is also consistent with [55] who showed that amino acids had lower mean residence time through the soil microbial biomass compared to glucose (20 ± 1 days and 40 ± 6 days respectively). This result supports our hypothesis that the mineralization rate of DON is higher than for DOC in arid soils.
Neither site nor depth had a major effect on the amount of 14CO2 evolution or the amount of C partitioned into C pool a1. The similarity between agricultural soil sites or depths could be due to their similar soil PLFA microbial communities and to the commonality in metabolic pathways for processing LMW DON or DOC [58]. This could also be due in part to a diverse microbial community having similar affinity transporters for substrate uptake from soil [41]. The lack of influence of soil depth on substrate use in this study differed from [59], who showed that soil depth greatly influenced substrate utilization due to higher microbial activity, biomass, organic matter, C content, and soil pH in topsoil compared to subsoils. We ascribe the lack of effect in this study to there being no significant horizonation within the soil profile and few differences between soil PLFA microbial community, soil pH and initial C content in the different soil layers.

4.2. Microbial Biomass C-Use Efficiency (Miceff)

The results indicate that Miceff was very similar between the three sites. Overall, increasing temperature tended to decrease Miceff after the addition of DON and DOC substrates (Figure 5). We hypothesize that temperature directly affects the relative balance of C flow through different metabolic pathways within the community, rather than it being caused by preferential capture by different microbial groups (e.g., bacteria vs. fungi). This result is consistent with others in this field e.g., [23], who show that the Miceff of glucosamine tends to decrease with increasing temperature due to changing temperature affecting different metabolic pathways of individual C compounds. Differences between Miceff of peptides and amino acids is potentially interesting. We ascribe the observed response to the differences in the internal partitioning of peptide and amino acid-derived C by the soil microbial biomass. In our experiments we used tri-alanine as a model peptide and a mixture of amino acids (which included alanine). Based on [56] we now know that the Miceff can be different for individual amino acids. This can be ascribed to: (i) their position within different biosynthetic pathways within the cell and the relative importance of these pathways (i.e., substrate demand); (ii) whether the amino acids are deaminated or transaminated prior to further use; (iii) whether the products of catabolism lead to the production of keto acids that can be used directly in respiration; and (iv) the relative demand for individual amino acids in protein synthesis. The factors described above help explain our observed differences in relative C partitioning between pools a1 and a2 for the amino acids and peptides.
Decreasing Miceff is often linked to increasing temperatures e.g., [60,61]. It also appears to be a common response found across a range of substrates (mixture of amino acids, amino sugars, sugars, and organic acids) because it is suggested that increased temperature may affect different energy-demanding processes such as increasing C respiration and microbial turnover rate [61]. These results support our hypothesis that the mineralization rate of DON and DOC increases with increasing temperature and that increasing temperature not only speeds up organic matter cycling but also the way the C is subsequently used by the microbial biomass. Typically, mathematical models describing soil organic matter turnover use a Q10 factor of 2 to describe how mineralization increases with temperature but they rarely factor in concurrent changes in Miceff. Based on our results this would indicate that C will be lost at greater rates than predicted from these simple C models.
It should also be noted that Miceff can be defined in different ways depending on the nature of the study [61]. For example, studies have looked at C partitioning and Miceff in soil microbial communities supplied with C substrates over short time scales (hours→days), while others have explored Miceff from food web and ecosystem perspectives (months→years timescale). This makes the standardisation of Miceff problematic as it is highly dependent on the spatial and temporal scale over which the measurements are made [41,61]. In this study, we are focusing on community-scale efficiency of microbial biomass synthesis [61,62].

4.3. Temperature Dependency of 14C Respiration Rate

Temperature is a regulator of microbial activity in soil and is, therefore, a key control on the speed of soil organic matter turnover. Preserving organic matter in arid soils is central to maintaining soil quality as it is responsible for many beneficial aspects of soil functioning (e.g., increasing aeration, water infiltration, nutrient cycling/retention, providing a habitat for microorganisms, etc.). Factors that lead to the accelerated loss of organic matter need to be better understood so that they can be managed either by eliminating or reducing them or putting in place mitigation strategies to minimise them (e.g., replenishing organic matter reserves). In addition, the loss of organic matter will lead to increased emissions of CO2 and is likely to lead to enhanced N mineralization which, depending upon the hydrological regime, may lead to excess nitrate leaching. While this may lead to pollution of groundwater and drinking water and indirect N2O emissions, it also represents an economic loss to farmers.
As expected, our results showed an increase in soil respiration rate with increasing temperature (Figure 6). We suggest that this could be due to microbial communities favouring high temperature for uptake, turnover and metabolism of the added substrate. Reference [63] reported an increase in microbial respiration with increasing temperatures from 5 °C to 25 °C due to the microbial communities favouring catabolic processes of substrate at higher temperature. This could be due to microorganisms using 14C in respiration for maintenance costs at high temperature rather than for growth and storage [54]. This result supports our hypothesis that the mineralization rate of DON and DOC increases with increasing temperature.

5. Conclusions

As expected, soil temperature increased mineralization rate in the three arid soils examined here. For each low molecular-weight substrate, a double exponential decay model conformed well to the experimental mineralization data. This allowed the microbial partitioning of C into catabolic and anabolic processes to be determined for each substrate and soil. Using this approach, we showed significant increases in the amount of substrate-C allocated to microbial catabolic processes with increasing soil temperature. This results in an overall reduction in C-use efficiency within the soil microbial community. In addition, this study showed an increase in soil respiration rate with increasing temperature. We ascribe this to microorganisms using 14C in respiration for maintenance costs at high temperature rather than for growth and storage. This result supports our hypothesis that the mineralization rate of DON and DOC increases with increasing temperature. The results from our study also showed the rate of 14CO2 evolution from DON > DOC compounds with shorter t½ for DON substrates, thus proving our second hypothesis that the mineralization rate of DON is higher than for DOC in arid soils. Additional studies are needed to investigate the effect of using alternative sources of irrigation water on soil function, particularly the response of various moisture regimes on soil chemical characteristics and rates of C and N cycling.

Supplementary Materials

The following are available online at https://www.mdpi.com/2571-8789/2/2/28/s1.

Author Contributions

All authors were involved in the initial conceptualization (A.A.A., D.J., P.R.), training for the methodology, software and validation was provided by P.R. and D.J., the work was completed by A.A.A.; formal analysis was completed by A.A.A. with guidance form P.R. and D.J.; investigation of the results was conducted by all authors, data is curated by A.A.A.; the original draft was written and prepared by A.A.A. with input from P.R. and D.J.; writing, review and editing was conducted by all authors; visualizations by A.A.A.; supervision by P.R. and D.J., project administration by P.R. and funding was acquired by A.A.A. from the Royal Embassy of Saudi Arabia—Cultural Bureau in London and Imam Abdulrahman Bin Faisal University.

Acknowledgments

This research was supported by the Royal Embassy of Saudi Arabia—Cultural Bureau in London and Imam Abdulrahman Bin Faisal University. We also thank HIDA for allowing their field experiments to be sampled and for their help in sample collection. We would like to thank Agriculture and Veterinary Research Station and Training, King Faisal University, Al-Hassa, KSA, for providing the temperature data.

Conflicts of Interest

The authors declare no conflicts of interest.

References

  1. Al-Rawahi, M.N.; Brinkmann, K.; Schlecht, E.; Buerkert, A. Effects of changing water availability on land use in irrigated mountain oases of Al Jabal Al Akhdar, northern Oman. DIE ERDE J. Geogr. Soc. Berl. 2014, 145, 197–211. [Google Scholar] [CrossRef]
  2. Asano, T.; Levine, A.D. Wastewater reclamation, recycling and reuse: Past, present, and future. Water Sci. Technol. 1996, 33, 1–14. [Google Scholar]
  3. Pedrero, F.; Kalavrouziotis, I.; Alarcón, J.J.; Koukoulakis, P.; Asano, T. Use of treated municipal wastewater in irrigated agriculture—Review of some practices in Spain and Greece. Agric. Water Manag. 2010, 97, 1233–1241. [Google Scholar] [CrossRef]
  4. Hussain, G.; Al-Saati, A.J. Wastewater quality and its reuse in agriculture in Saudi Arabia. Desalination 1999, 123, 241–251. [Google Scholar] [CrossRef]
  5. Al-Kuwaiti, K.A. Efforts Drainage and Irrigation Authority and its Plans to Provide Irrigation Water from Different Sources (in Arabic); Ministry of Agriculture, Al-Hassa Irrigation and Drainage Authority: Al-Ahsa, Saudi Arabia, 2010.
  6. Aldakheel, Y.Y. Assessing NDVI Spatial Pattern as Related to Irrigation and Soil Salinity Management in Al-Hassa Oasis, Saudi Arabia. J. Indian Soc. Remote Sens. 2011, 39, 171–180. [Google Scholar] [CrossRef]
  7. Buerkert, A.; Nagieb, M.; Siebert, S.; Khan, I.; Al-Maskri, A. Nutrient cycling and field-based partial nutrient balances in two mountain oases of Oman. Field Crops Res. 2005, 94, 149–164. [Google Scholar] [CrossRef]
  8. Yang, R.; Su, Y.; Yang, Q. Crop Yields and Soil Nutrients in Response to Long-Term Fertilization in a Desert Oasis. Agron. J. 2015, 107, 83–92. [Google Scholar] [CrossRef]
  9. Farrell, M.; Hill, P.W.; Farrar, J.; DeLuca, T.H.; Roberts, P.; Kielland, K.; Dahlgren, R.; Murphy, D.V.; Hobbs, P.J.; Bardgett, R.D.; et al. Oligopeptides Represent a Preferred Source of Organic N Uptake: A Global Phenomenon? Ecosystems 2013, 16, 133–145. [Google Scholar] [CrossRef]
  10. Hill, P.W.; Farrar, J.; Roberts, P.; Farrell, M.; Grant, H.; Newsham, K.K.; Hopkins, D.W.; Bardgett, R.D.; Jones, D.L. Vascular plant success in a warming Antarctic may be due to efficient nitrogen acquisition. Nat. Clim. Chang. 2011, 1, 50–53. [Google Scholar] [CrossRef]
  11. Hill, P.W.; Marsden, K.A.; Jones, D.L. How significant to plant N nutrition is the direct consumption of soil microbes by roots? New Phytol. 2013, 199, 948–955. [Google Scholar] [CrossRef] [PubMed] [Green Version]
  12. Jones, D.L.; Farrar, J.F.; Macdonald, A.J.; Kemmitt, S.J.; Murphy, D.V. Dissolved Organic Nitrogen and Mechanisms of Its Uptake by Plants in Agricultural Systems. In Quantifying and Understanding Plant Nitrogen Uptake for Systems Modeling; Liwang, M., Ahuja, L.R., Bruulsema, T., Eds.; CRC Press Taylor and Francis Group: Boca Raton, FL, USA, 2008; pp. 95–126. [Google Scholar]
  13. Javid, M.; Bahramifar, N.; Younesi, H.; Taghavi, S.M.; Givehchi, R. Dry deposition, seasonal variation and source interpretation of ionic species at Abali, Firouzkouh and Varamin, Tehran Province, Iran. Atmos. Res. 2015, 157, 74–90. [Google Scholar] [CrossRef]
  14. Li, C.; Li, Y.; Tang, L. The effects of long-term fertilization on the accumulation of organic carbon in the deep soil profile of an oasis farmland. Plant Soil 2013, 369, 645–656. [Google Scholar] [CrossRef]
  15. Jones, D.L.; Nguyen, C.; Finlay, R.D. Carbon flow in the rhizosphere: Carbon trading at the soil-root interface. Plant Soil 2009, 321, 5–33. [Google Scholar] [CrossRef]
  16. Ferguson, S.D.; Nowak, R.S. Transitory effects of elevated atmospheric CO2 on fine root dynamics in an arid ecosystem do not increase long-term soil carbon input from fine root litter. New Phytol. 2011, 190, 953–967. [Google Scholar] [CrossRef] [PubMed]
  17. Sivakumar, M.V.K.; Ruane, A.C.; Camacho, J. Climate Change in the West Asia and North Africa Region. In Climate Change and Food Security in West Asia and North Africa; Springer: Dordrecht, The Netherlands, 2013; pp. 3–26. [Google Scholar]
  18. Chowdhury, S.; Al-Zahrani, M. Implications of Climate Change on Water Resources in Saudi Arabia. Arab. J. Sci. Eng. 2013, 38, 1959–1971. [Google Scholar] [CrossRef]
  19. Hijioka, Y.; Lin, E.; Pereira, J.J.; Corlett, R.T.; Cui, X.; Insarov, G.E.; Lasco, R.D.; Lindgren, E.; Surjan, A. Asia. In Climate Change 2014: Impacts, Adaptation, and Vulnerability. Part B: Regional Aspects. Contribution of Working Group II to the Fifth Assessment Report of the Intergovernmental Panel on Climate Change; Field, C.B., V.R. Barros, D.J., Dokken, K.J., Mach, M.D., Mastrandrea, T.E., Bilir, M., Chatterjee, K.L., Ebi, Y.O., Estrada, R.C., Genova, B., et al., Eds.; Cambridge University Press: Cambridge, UK; New York, NY, USA, 2014. [Google Scholar]
  20. Christou, M.; Avramides, E.J.; Jones, D.L. Dissolved organic nitrogen dynamics in a Mediterranean vineyard soil. Soil Biol. Biochem. 2006, 38, 2265–2277. [Google Scholar] [CrossRef]
  21. Ge, T.D.; Huang, D.F.; Roberts, P.; Jones, D.L.; Song, S.W. Dynamics of Nitrogen Speciation in Horticultural Soils in Suburbs of Shanghai, China. Pedosphere 2010, 20, 261–272. [Google Scholar] [CrossRef]
  22. Boddy, E.; Hill, P.W.; Farrar, J.; Jones, D.L. Fast turnover of low molecular weight components of the dissolved organic carbon pool of temperate grassland field soils. Soil Biol. Biochem. 2007, 39, 827–835. [Google Scholar] [CrossRef]
  23. Roberts, P.; Jones, D.L. Microbial and plant uptake of free amino sugars in grassland soils. Soil Biol. Biochem. 2012, 49, 139–149. [Google Scholar] [CrossRef]
  24. Li, J.; Li, Z.; Wang, F.; Zou, B.; Chen, Y.; Zhao, J.; Mo, Q.; Li, Y.; Li, X.; Xia, H. Effects of nitrogen and phosphorus addition on soil microbial community in a secondary tropical forest of China. Biol. Fertil. Soils 2014, 51, 207–215. [Google Scholar] [CrossRef]
  25. Alkolibi, F. Possible effects of global warming on agriculture and water resources in Saudi Arabia: Impacts and responses. Clim. Chang. 2002, 54, 225–245. [Google Scholar] [CrossRef]
  26. Al-Fredan, M.A. Nitrogen Fixing Legumes in the Plant Communities. Am. J. Environ. Sci. 2011, 7, 166–172. [Google Scholar] [CrossRef]
  27. Bashour, I.; Sayegh, A. Methods of Analysis for Soils of Arid and Semi-Arid Regions; Food and Agriculture Organization of the United Nations: Rome, Italy, 2007; ISBN 978-95-5-105661-5. [Google Scholar]
  28. U.S. Environmental Protection Agency (EPA). Method 3051A: Microwave assisted acid digestion of sediments, sludges, soils, and oils. In Test Methods for Evaluating Solid Waste, Physical/Chemical Methods; EPA Publication SW-846 (3rd Edition–Final Update IV); 2007 ISBN Physical/Chemical Methods, SW-846; U.S. Environmental Protection Agency (EPA): Washington, DC, USA, 2007. [Google Scholar]
  29. Burden, A.; Garbutt, R.A.; Evans, C.D.; Jones, D.L.; Cooper, D.M. Carbon sequestration and biogeochemical cycling in a saltmarsh subject to coastal managed realignment. Estuar. Coast. Shelf Sci. 2013, 120, 12–20. [Google Scholar] [CrossRef] [Green Version]
  30. Murphy, J.; Riley, J.P. A Modified single solution method for the determination of phosphate in natural waters. Anal. Chim. Acta 1962, 27, 31–36. [Google Scholar] [CrossRef]
  31. Swain, T.; Hillis, W.E. The phenolic constituents of Prunus domestica. I.—The quantitative analysis of phenolic constituents. J. Sci. Food Agric. 1959, 10, 63–68. [Google Scholar] [CrossRef]
  32. Miranda, K.M.; Espey, M.G.; Wink, D.A. A Rapid, Simple Spectrophotometric Method for Simultaneous Detection of Nitrate and Nitrite. Nitric Oxide Biol. Chem. 2001, 5, 62–71. [Google Scholar] [CrossRef] [PubMed]
  33. Mulvaney, R.L. Nitrogen—Inorganic Forms. In Methods of Soil Analysis: Part 3: Chemical Methods; Sparks, D.L., Ed.; Soil Science Society of America, Inc., American Society of Agronomy, Inc.: Madison, WI, USA, 1996; pp. 1123–1184. [Google Scholar]
  34. Roberts, P.; Jones, D.L. Critical evaluation of methods for determining total protein in soil solution. Soil Biol. Biochem. 2008, 40, 1485–1495. [Google Scholar] [CrossRef]
  35. Jones, D.L.; Owen, A.G.; Farrar, J.F. Simple method to enable the high resolution determination of total free amino acids in soil solutions and soil extracts. Soil Biol. Biochem. 2002, 34, 1893–1902. [Google Scholar] [CrossRef]
  36. Buyer, J.S.; Sasser, M. High throughput phospholipid fatty acid analysis of soils. Appl. Soil Ecol. 2012, 61, 127–130. [Google Scholar] [CrossRef]
  37. Findlay, R.H. Determination of microbial community structure using phospholipid fatty acid profiles. In Molecular Microbial Ecology Manual; Kowalchuk, G.A., Bruijn, F.J.D., Head, I.M., Akkermans, A.D.L., Elsas, J.D.V., Eds.; Kluwer Academic Publishers: Dordrecht, The Netherlands, 2004; pp. 983–1004. [Google Scholar]
  38. Frostegård, Å.; Bååth, E.; Tunlio, A. Shifts in the structure of soil microbial communities in limed forests as revealed by phospholipid fatty acid analysis. Soil Biol. Biochem. 1993, 25, 723–730. [Google Scholar] [CrossRef]
  39. Fernandes, M.F.; Saxena, J.; Dick, R.P. Comparison of Whole-Cell Fatty Acid (MIDI) or Phospholipid Fatty Acid (PLFA) Extractants as Biomarkers to Profile Soil Microbial Communities. Microb. Ecol. 2013, 66, 145–157. [Google Scholar] [CrossRef] [PubMed]
  40. Farrell, M.; Hill, W.; Farrar, J.; Wanniarachchi, D.; Bardgett, D.; Jones, D.L. Rapid peptide metabolism: A major component of soil nitrogen cycling? Glob. Biogeochem. Cycles 2011, 25, 11. [Google Scholar] [CrossRef]
  41. Glanville, H.C.; Hill, P.W.; Schnepf, A.; Oburger, E.; Jones, D.L. Combined use of empirical data and mathematical modelling to better estimate the microbial turnover of isotopically labelled carbon substrates in soil. Soil Biol. Biochem. 2016, 94, 154–168. [Google Scholar] [CrossRef]
  42. Jones, D.L.; Olivera-Ardid, S.; Klumpp, E.; Knief, C.; Hill, P.W.; Lehndorff, E.; Bol, M. Moisture activation and carbon use efficiency of soil microbial communities along an aridity gradient in the Atacama Desert. Soil Biol. Biochem. 2018, 117, 68–71. [Google Scholar] [CrossRef]
  43. Birgander, J.; Reischke, S.; Jones, D.L.; Rousk, J. Temperature adaptation of bacterial growth and 14C-glucose mineralisation in a laboratory study. Soil Biol. Biochem. 2013, 65, 294–303. [Google Scholar] [CrossRef]
  44. Rousk, J.; Frey, S.D.; Bååth, E. Temperature adaptation of bacterial communities in experimentally warmed forest soils. Glob. Chang. Biol. 2012, 18, 3252–3258. [Google Scholar] [CrossRef] [PubMed]
  45. Al-Jasser, A.O. Saudi wastewater reuse standards for agricultural irrigation: Riyadh treatment plants effluent compliance. J. King Saud Univ. Eng. Sci. 2011, 23, 1–8. [Google Scholar] [CrossRef]
  46. Ayers, R.S.; Westcot, D.W. Water Quality for Agriculture; Food and Agriculture Organization of the United Nations: Rome, Italy, 1985; Volume 29, ISBN 92-5-102263-1. [Google Scholar]
  47. Certini, G.; Scalenghe, R. Soils: Basic Concepts and Future Challenges; Cambridge University Press: Cambridge, UK, 2006. [Google Scholar]
  48. Boulding, J.R. Description and Sampling of Contaminated Soils: A Field Guide, 2nd ed.; CRC Press: Boca Raton, FL, USA, 1994. [Google Scholar]
  49. Food and Agriculture Organization of the United Nations (FAO). Near East Fertilizer—Use Manual; Food and Agriculture Organization of the United Nations: Rome, Italy, 2006. [Google Scholar]
  50. Hill, P.W.; Farrar, J.F.; Jones, D.L. Decoupling of microbial glucose uptake and mineralization in soil. Soil Biol. Biochem. 2008, 40, 616–624. [Google Scholar] [CrossRef]
  51. Jan, M.T.; Roberts, P.; Tonheim, S.K.; Jones, D.L. Protein breakdown represents a major bottleneck in nitrogen cycling in grassland soils. Soil Biol. Biochem. 2009, 41, 2272–2282. [Google Scholar] [CrossRef]
  52. Nobel, P.S. Extreme temperatures and thermal tolerances for seedlings of desert succulents. Oecologia 1984, 62, 310–317. [Google Scholar] [CrossRef] [PubMed]
  53. Garratt, J.R. Extreme Maximum Land Surface Temperatures. J. Appl. Meteorol. 1992, 31, 1096–1105. [Google Scholar] [CrossRef]
  54. Williams, J.B.; Tieleman, B.I.; Shobrak, M. Lizard Burrows Provide Thermal Refugia for Larks in the Arabian Desert. Condor 1999, 101, 714–717. [Google Scholar] [CrossRef]
  55. Boddy, E.; Roberts, P.; Hill, P.W.; Farrar, J.; Jones, D.L. Turnover of low molecular weight dissolved organic C (DOC) and microbial C exhibit different temperature sensitivities in Arctic tundra soils. Soil Biol. Biochem. 2008, 40, 1557–1566. [Google Scholar] [CrossRef]
  56. Jones, D.L.; Kemmitt, S.J.; Wright, D.; Cuttle, S.P.; Bol, R.; Edwards, A.C. Rapid intrinsic rates of amino acid biodegradation in soils are unaffected by agricultural management strategy. Soil Biol. Biochem. 2005, 37, 1267–1275. [Google Scholar] [CrossRef]
  57. Jones, D.L.; Hill, P.W.; Smith, A.R.; Farrell, M.; Ge, T.; Banning, N.C.; Murphy, D.V. Role of substrate supply on microbial carbon use efficiency and its role in interpreting soil microbial community-level physiological profiles (CLPP). Soil Biol. Biochem. 2018, in press. [Google Scholar]
  58. Hill, P.W.; Farrell, M.; Roberts, P.; Farrar, J.; Grant, H.; Newsham, K.K.; Hopkins, D.W.; Bardgett, R.D.; Jones, D.L. Soil-and enantiomer-specific metabolism of amino acids and their peptides by Antarctic soil microorganisms. Soil Biol. Biochem. 2011, 43, 2410–2416. [Google Scholar] [CrossRef]
  59. Rukshana, F.; Butterly, C.R.; Xu, J.M.; Baldock, J.A.; Tang, C. Soil organic carbon contributes to alkalinity priming induced by added organic substrates. Soil Biol. Biochem. 2013, 65, 217–226. [Google Scholar] [CrossRef]
  60. Manzoni, S.; Taylor, P.; Richter, A.; Porporato, A.; Ågren, G.I. Environmental and stoichiometric controls on microbial carbon-use efficiency in soils. New Phytol. 2012, 196, 79–91. [Google Scholar] [CrossRef] [PubMed]
  61. Schindlbacher, A.; Schnecker, J.; Takriti, M.; Borken, W.; Wanek, W. Microbial physiology and soil CO2 efflux after 9 years of soil warming in a temperate forest—No indications for thermal adaptations. Glob. Chang. Biol. 2015, 21, 4265–4277. [Google Scholar] [CrossRef] [PubMed]
  62. Geyer, K.M.; Snowman, E.K.; Grandy, A.S.; Frey, S.D. Microbial carbon use efficiency: Accounting for population, community, and ecosystem-scale controls over the fate of metabolized organic matter. Biogeochemistry 2016, 127, 173–188. [Google Scholar] [CrossRef]
  63. Agehara, S.; Warncke, D.D. Soil Moisture and Temperature Effects on Nitrogen Release from Organic Nitrogen Sources. Soil Sci. Soc. Am. J. 2005, 69, 1844. [Google Scholar] [CrossRef]
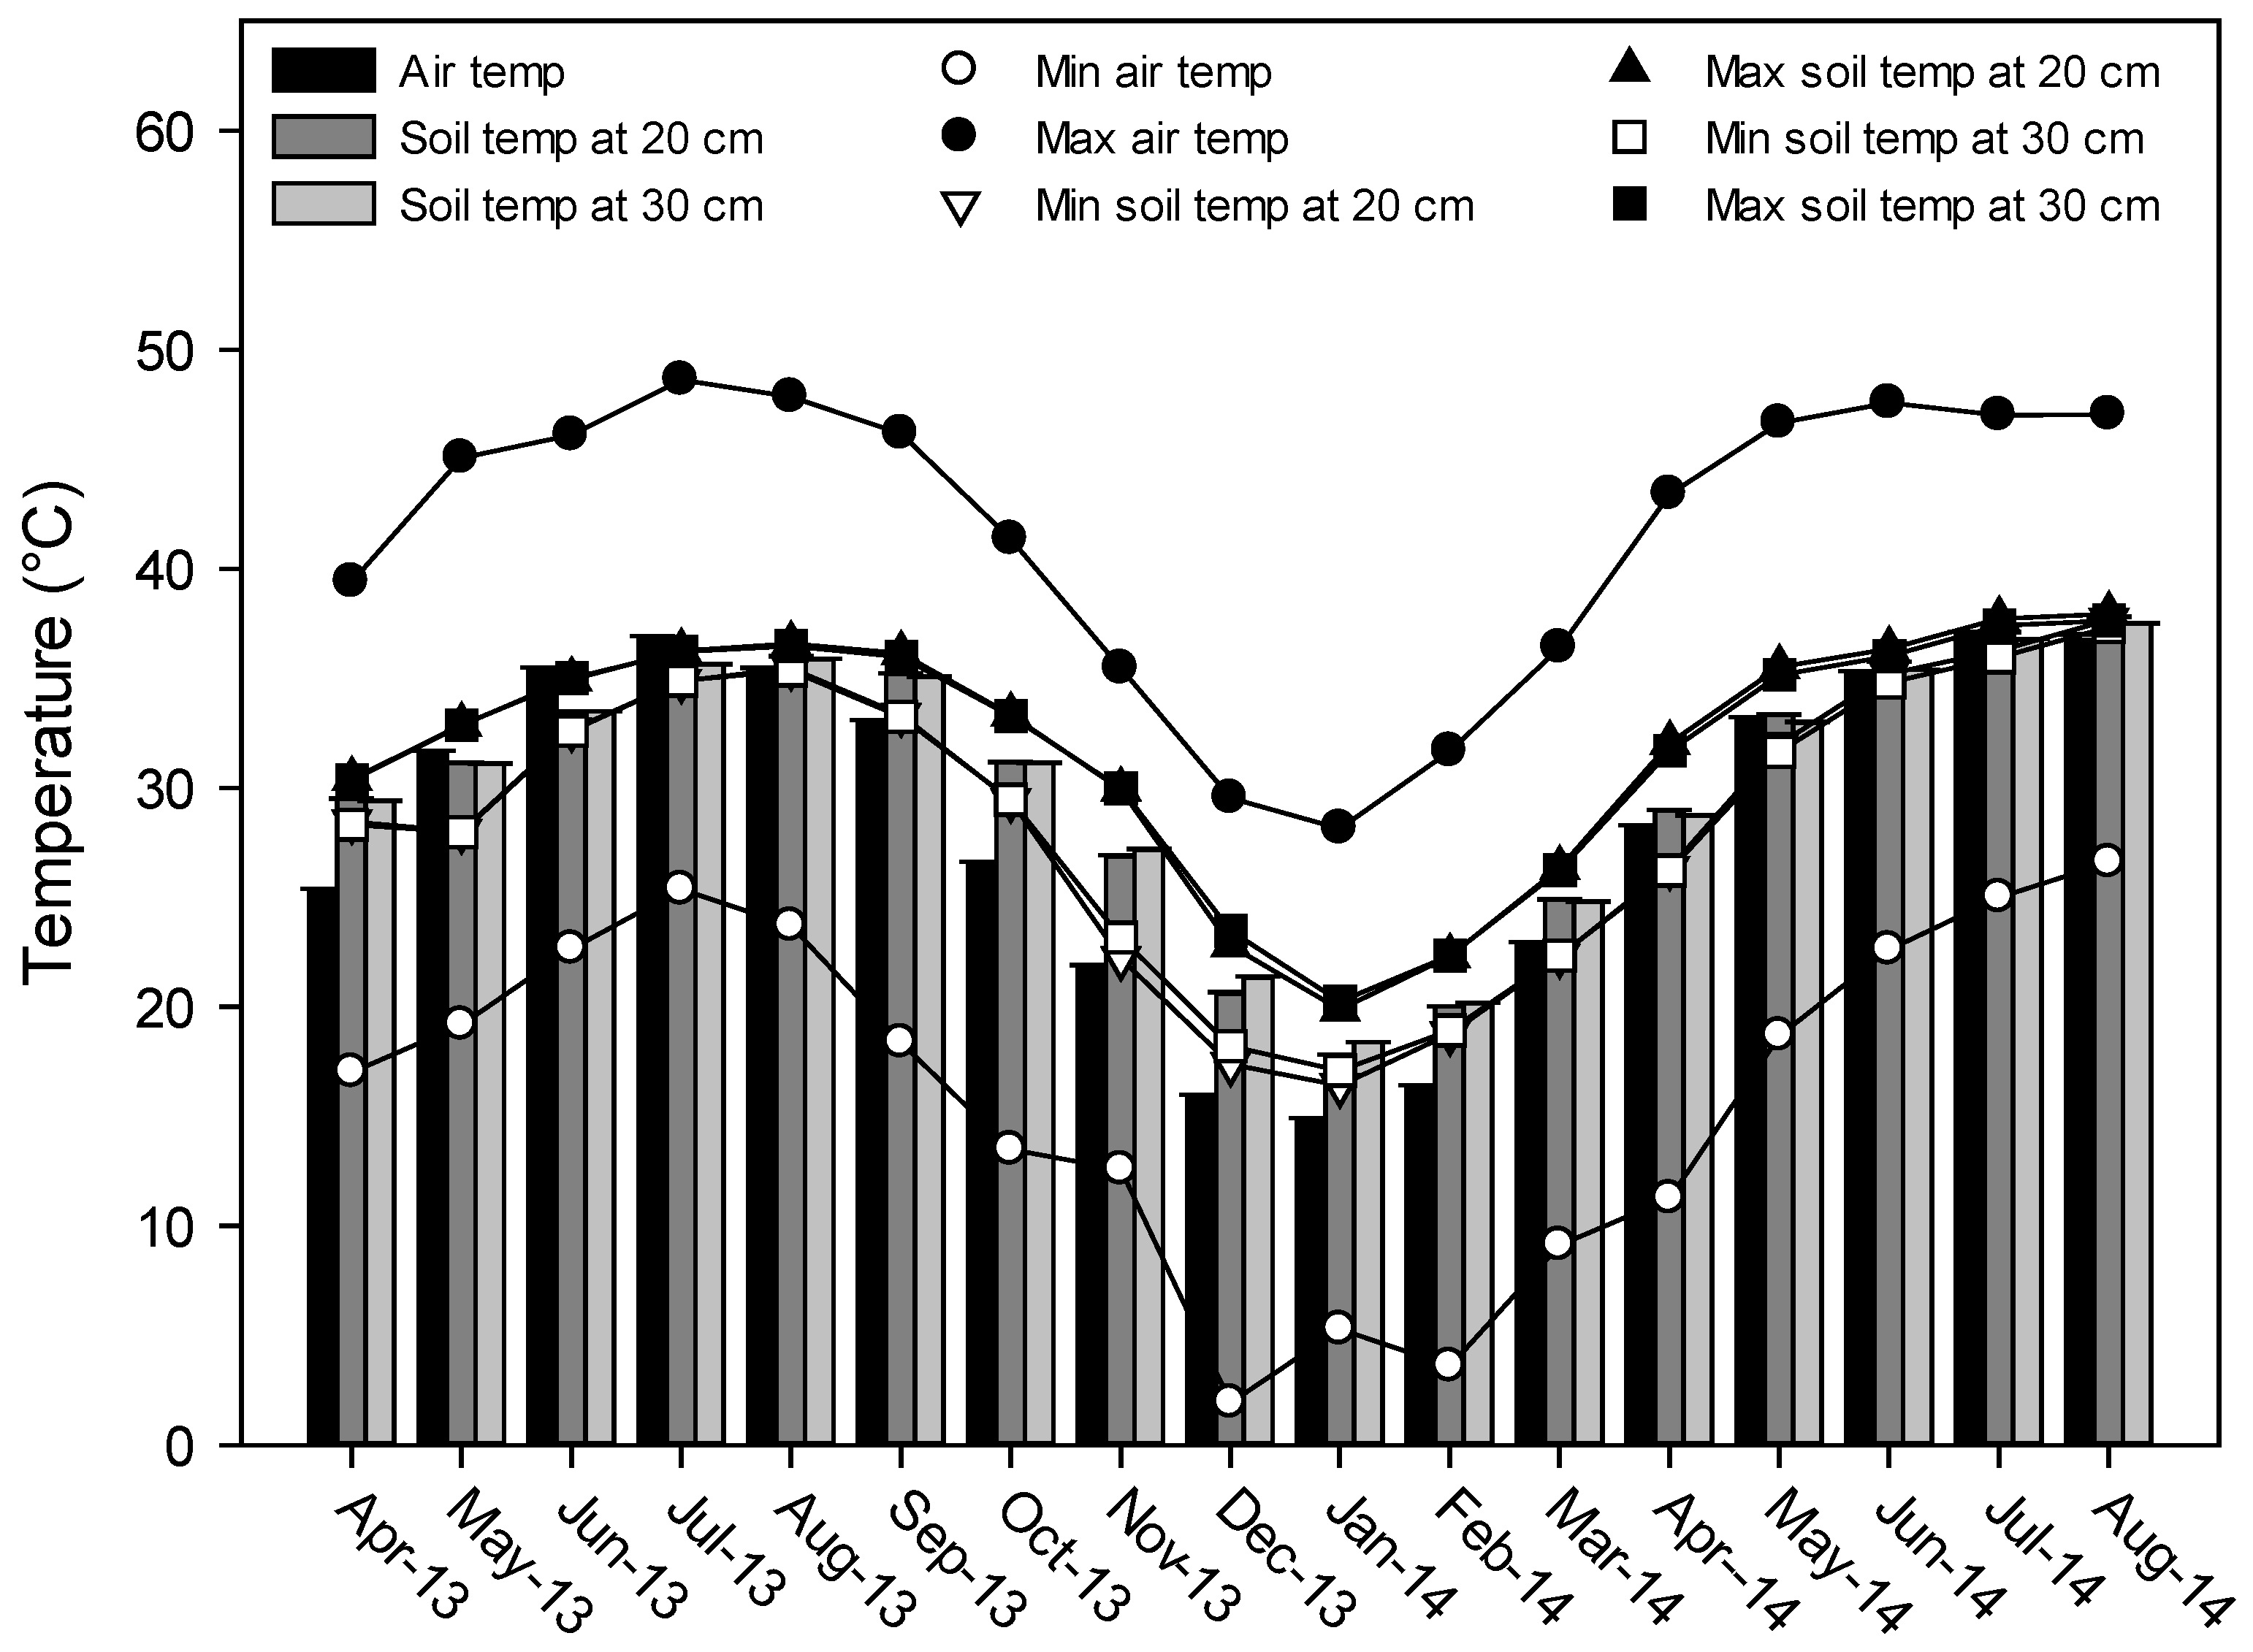
Figure 1. Air temperature and soil temperature at 20 cm and at 30 cm depth in the Al-Hassa oasis from April 2013 to August 2014 (data from Agricultural and Veterinary Training and Research Station, King Faisal University, Al-Hassa, KSA).
Soilsystems 02 00028 g001
Figure 2. Soil PLFA microbial community structure in topsoils (Panel A) and subsoils (Panel B) from three agricultural oasis sites. Values represent means ± SEM (n = 3). ND indicates not detected. Different letters identify significant differences between sites (p ≤ 0.05), * indicate significant differences between depths, and no letters shows there are no significant differences.
Soilsystems 02 00028 g002
Figure 3. Temperature-dependent mineralization of three different 14C-labelled substrates in topsoils (0–30 cm) collected from three agricultural oasis sites. Points represent means ± SEM (n = 3). Different letters indicate significant differences between temperatures (p ≤ 0.05). The legend is the same for all panels. The substrates are arranged vertically and the sites horizontally within the panels.
Soilsystems 02 00028 g003
Figure 4. Temperature-dependent mineralization of three different 14C-labelled substrates in subsoils (30–60 cm) collected from three agricultural oasis sites. Points represent means ± SEM (n = 3). Different letters indicate significant differences between temperatures (p ≤ 0.05). The legend is the same for all panels. The substrates are arranged vertically and the sites horizontally within the panels.
Soilsystems 02 00028 g004
Figure 5. Impact of temperature on microbial carbon-use efficiency for three different C substrates in three arid agricultural oasis sites. Values represent means ± SEM (n = 3). Different letters identify significant differences between temperatures at the p ≤ 0.05 level. The legend is the same for all panels.
Soilsystems 02 00028 g005
Figure 6. Relationship between soil temperature and the square root of substrate mineralization rate in three different agricultural oasis sites. Points represent means ± SEM (n = 3) while lines represent linear regressions with regression coefficients displayed alongside the lines. The legend is the same for all panels. The substrates (glucose, amino acid and trialanine) are arranged vertically and the sites horizontally within the panels.
Soilsystems 02 00028 g006
Table 1. Chemical characteristics of the irrigation water types. Values represent means ± Standard Error of the Mean (SEM) (n = 3). Different superscript letters indicate significant differences between irrigation water types (p ≤ 0.05) and no letters shows there are no significant differences. Electrical Conductivity is indicated as EC.
Water/Irrigation TypeGround WaterTreated WastewaterMixed
Parameters
pH7.27 ± 0.03 a7.22 ± 0.05 a6.83 ± 0.04 b
EC (mS/cm)4.92 ± 0.16 b2.21 ± 0.03 c7.04 ± 0.09 a
P (mg/L)0.04 ± 0.00 c4.99 ± 0.46 a2.50 ± 0.11 b
Soluble phenolics (mg/L)1.74 ± 0.581.33 ± 0.453.10 ± 0.54
NO3 (mg N/L)7.02 ± 0.05 b7.11 ± 0.22 b9.68 ± 0.41 a
NH4+ (mg N/L)0.02 ± 0.010.02 ± 0.000.08 ± 0.04
Dissolved organic N (DON) (mg N/L)0.41 ± 0.01 b0.61 ± 0.09 a0.43 ± 0.18 b
Dissolved organic C (DOC) (mg C/L)1.03 ± 0.30 c4.69 ± 0.36 b6.44 ± 0.18 a
DOC/DON ratio2.49 ± 0.708.13 ± 0.8723.84 ± 11.65
Amino acids (mg N/L)0.01 ± 0.00 b0.05 ± 0.02 a0.03 ± 0.00 a,b
Table 2. Physical, biological and chemical characteristics of the soils used in the experiments. Values represent mean ± SEM (n = 3). Significant differences between depths are indicated by * = p ≤ 0.05 and different lower case letters identify significant differences between sites (p ≤ 0.05) in topsoil. No letters shows there are no significant differences.
Soil/Irrigation TypeSite 1Site 2Site 3
Parameter(0–30 cm)(0–30 cm)(0–30 cm)
pH8.51 ± 0.038.66 ± 0.028.56 ± 0.07
Electrical conductivity (mS/cm)0.91 ± 0.070.40 ± 0.020.67 ± 0.15
Moisture content (%)12.8 ± 0.3 b* 12.7 ± 0.7 b18.2 ± 0.6 a
Organic matter (%)* 1.26 ± 0.05 b1.56 ± 0.06 a,b2.65 ± 0.23 a
CaCO3 (%)23.5 ± 0.8 b27.9 ± 2.1 a15.0 ± 2.4 c
Soil textureSandSandSandy loam
Na (g/kg)0.56 ± 0.150.32 ± 0.060.49 ± 0.11
Al (g/kg)* 1.47 ± 0.04 a0.60 ± 0.08 b1.32 ± 0.31 a,b
S (g/kg)0.20 ± 0.020.04 ± 0.020.09 ± 0.04
Cl (g/kg)* 0.25 ± 0.020.21 ± 0.020.25 ± 0.07
K (g/kg)* 0.70 ± 0.01 a,b0.58 ± 0.04 b0.93 ± 0.13 a
Ca (g/kg)* 33.0 ± 0.737.7 ± 2.337.6 ± 4.3
Mg (g/kg)3.05 ± 0.10 b3.46 ± 0.34 b9.25 ± 1.17 a
Mn (g/kg)* 0.06 ± 0.000.05 ± 0.010.08 ± 0.01
Fe (g/kg)* 1.93 ± 0.03 b1.40 ± 0.11c2.64 ± 0.27 a
Zn (g/kg)0.02 ± 0.000.02 ± 0.010.02 ± 0.00
Total C (g C/kg)13.2 ± 1.3 b21.6 ± 1.9 a23.6 ± 2.8 a
Total N (g N/kg)1.00 ± 0.060.83 ± 0.041.19 ± 0.08
Total C:N ratio13.6 ± 1.327.9 ± 5.520.5 ± 3.0
NO3 (mg N/kg)* 4.60 ± 0.55 b7.67 ± 0.55 a4.84 ± 0.45 b
NH4+ (mg N/kg)1.05 ± 0.13 a0.05 ± 0.02 b0.11 ± 0.18 b
Amino acids (mg N/kg)* 0.19 ± 0.010.15 ± 0.020.17 ± 0.03
Protein (mg N/kg)5.28 ± 0.372.53 ± 0.324.83 ± 0.59
DON (mg N/kg)5.91 ± 0.786.91 ± 1.129.64 ± 2.75
DOC (mg C/kg)35.0 ± 6.639.6 ±8.666.5 ± 23.4
Microbial N (mg N/kg)8.88 ± 0.65 b* 20.2 ± 1.4 a18.5 ± 4.8 a
Microbial C (mg C/kg)109 ±16* 172 ± 7127 ± 31
DOC/DON ratio5.90 ± 0.84* 5.81 ± 0.2112.05 ± 5.97
Phenolics (mg/kg)* 5.73 ± 0.126.64 ± 2.02* 4.69 ± 1.30
Available P (mg P/kg)* 10.0 ± 1.841.5 ± 3.3* 35.7 ± 2.0
Soil respiration (µg CO2/g/h)* 0.12 ± 0.010.14 ± 0.010.16 ± 0.01
Table 3. Physical, biological and chemical characteristics of the subsoil used in the experiments. Values represent mean ± SEM (n = 3). Different lowercase letters identify significant differences between sites (p ≤ 0.05) in subsoil. No letters shows there are no significant differences.
Soil/Irrigation TypeSite 1Site 2Site 3
Parameter(30–60 cm)(30–60 cm)(30–60 cm)
pH8.51 ± 0.068.51 ± 0.018.55 ± 0.07
Electrical conductivity (mS/cm)0.95 ± 0.140.59 ± 0.030.81 ± 0.15
Moisture content (%)13.4 ± 0.4 c27.1 ± 1.1 a20.3 ± 0.5 b
Organic matter (%)0.89 ± 0.04 c1.80 ± 0.05 b2.05 ± 0.23 a
CaCO3 (%)25.6 ± 1.7 a,b35.5 ± 3.3 a14.1 ± 2.4 b
Soil textureSandSandy loamSandy loam
Na (g/kg)0.42 ± 0.170.51 ± 0.060.53 ± 0.06
Al (g/kg)0.68 ± 0.090.41 ± 0.040.71 ± 0.20
S (g/kg)0.04 ± 0.040.03 ± 0.010.08 ± 0.02
Cl (g/kg)0.14 ± 0.01 b0.18 ± 0.00 a,b0.21 ± 0.01 a
K (g/kg)0.49 ± 0.03 b0.50 ± 0.02 b0.98 ± 0.08 a
Ca (g/kg)21.6 ± 1.0 b38.5 ± 2.5 a37.1 ± 2.4 a
Mg (g/kg)2.58 ± 0.15 c4.32 ± 0.17 b8.47 ± 1.44 a
Mn (g/kg)0.04 ± 0.00 b0.05 ± 0.00 b0.07 ± 0.01 a
Fe (g/kg)1.25 ± 0.07 b1.36 ± 0.09 b2.69 ± 0.23 a
Zn (g/kg)0.01 ± 0.000.01 ± 0.000.01 ± 0.00
Total C (g C/kg)10.5 ± 1.4 b34.5 ± 3.6 b22.8 ± 2.8 a
Total N (g N/kg)0.81 ± 0.120.74 ± 0.031.07 ± 0.08
Total C:N ratio13.9 ± 1.0 b48.2 ± 5.5 b22.1 ± 3.0 b
NO3 (mg N/kg)0.69 ± 0.09 b3.22 ± 0.62 b1.04 ± 0.45 b
NH4+ (mg N/kg)1.29 ± 0.22 a0.38 ± 0.11 b0.33 ± 0.18 b
Amino acids (mg N/kg)0.13 ± 0.010.10 ± 0.010.12 ± 0.02
Protein (mg N/kg)4.07 ± 0.344.02 ± 0.694.28 ± 0.25
DON (mg N/kg)4.67 ± 0.446.92 ± 1.696.30 ± 0.80
DOC (mg C/kg)25.1 ±3.7 b30.7 ±7.6 a,b48.6 ± 2.3 a
Microbial N (mg N/kg)1.09 ± 0.235.5 ± 0.710.5 ± 5.7
Microbial C (mg C/kg)59 ± 1192 ± 574 ± 40
DOC/DON ratio5.33 ± 0.29 a3.25 ± 0.21 b5.70 ± 0.65 a
Phenolics (mg/kg)4.03 ± 0.066.55 ± 2.570.96 ± 0.25
Available P (mg P/kg)3.0 ± 0.819.2 ± 2.54.9 ± 2.0
Soil respiration (µg CO2/g/h)0.09 ± 0.00 b0.12 ± 0.02 a,b0.15 ± 0.01 a
Table 4. Influence of soil temperature on the modelled kinetic parameters describing the rapid phase of turnover of 14C-labelled glucose, amino acids, and trialanine in the topsoils of three different agriculture sites. Values represent mean ± SEM (n = 3). Different letters indicate significant differences between temperatures (p ≤ 0.05), while no letters indicate there are no significant differences.
SitesTemperature (°C)Top Soils (0–30 cm)
Glucose (%)Amino Acids (%)Trialanine (%)
Pool a1
Site 11019.1 ± 2.7 b21.9 ± 2.2 b,c50.2 ± 3.2 b,c
2017.9 ± 3.6 b20.1 ± 1.8 c45.6 ± 4.9 c
3036.6 ± 7.2 a29.0 ± 1.2 a,b66.3 ± 6.8 a,b
4029.2 ± 2.7 a,b31.2 ± 2.6 a70.7 ± 4.5 a
Site 21018.2 ± 4.0 b,c21.0 ± 1.9 b48.3 ± 4.3 b
2013.0 ± 1.3 c17.8 ± 4.0 b54.6 ± 4.9 a,b
3041.4 ± 2.0 a32.6 ± 0.4 a66.0 ± 6.9 a
4028.8 ± 3.8 b30.5 ± 0.9 a70.0 ± 1.5 a
Site 31040.8 ± 2.122.9 ± 2.4 b45.0 ± 2.1 b
2016.0 ± 2.120.0 ± 1.8 b46.1 ± 7.3 b
3041.1 ± 2.130.2 ± 0.6 a66.9 ± 2.6 a
4030.4 ± 1.030.9 ± 2.2 a68.5 ± 1.5 a
Pool a2
Site 11081.13 ± 2.66 b72.57 ± 2.39 b,c45.47 ± 3.05 b,c
2079.15 ± 4.41 b77.24 ± 1.88 c51.91 ± 5.05 c
3064.69 ± 6.73 a65.61 ± 1.90 a,b37.09 ± 5.09 a,b
4068.47 ± 2.86 a,b64.12 ± 3.46 a32.23 ± 2.43 a
Site 21082.03 ± 4.20 b,c74.40 ± 1.84 b49.27 ± 3.82 b
2084.63 ± 1.59 c79.36 ± 3.91 b43.74 ± 2.76 a,b
3060.08 ± 1.85 a63.80 ± 1.30 a36.52 ± 4.15 a
4070.72 ± 4.95 b68.33 ± 0.67 a35.20 ± 1.09 a
Site 31058.99 ± 21.4871.71 ± 2.98 b50.71 ± 2.28 b
2081.60 ± 2.3576.72 ± 1.93 b53.69 ± 5.69 b
3060.05 ± 2.0266.47 ± 0.37 a36.36 ± 1.80 a
4068.54 ± 1.0667.52 ± 1.34 a35.73 ± 0.87 a
Table 5. Influence of soil temperature on the modelled kinetic parameters describing the rapid phase of turnover of 14C-labelled glucose, amino acids, and trialanine in the subsoils of three different agriculture sites. Values represent mean ± SEM (n = 3). Different letters indicate significant differences between temperatures (p ≤ 0.05), while no letters indicate there are no significant differences.
SitesTemperature (°C)Sub Soils (30–60 cm)
Glucose (%)Amino Acids (%)Trialanine (%)
Pool a1
Site 11033.7 ± 9.016.5 ± 5.846.3 ± 7.1
2017.0 ± 2.614.5 ± 4.046.1 ± 8.0
3038.4 ± 5.223.5 ± 4.466.6 ± 9.3
4037.2 ± 6.231.0 ± 3.568.6 ± 9.9
Site 21031.0 ± 4.5 b17.0 ± 4.2 b38.9 ± 7.0
2011.7 ± 2.0 c15.9 ± 2.0 b40.1 ± 6.3
3042.0 ± 1.7 a25.2 ± 3.4 a,b51.7 ± 7.4
4025.3 ± 1.7 b29.5 ± 1.6 a52.6 ± 10.6
Site 31025.2 ± 1.7 b19.4 ± 1.232.5 ± 8.3 b
2014.8 ± 1.4 c16.4 ± 3.442.1 ± 9.9 a,b
3038.2 ± 3.9 a33.2 ± 7.565.0 ± 5.4 a
4033.2 ± 0.8 a,b30.3 ± 3.365.4 ± 5.9 a
Pool a2
Site 11066.96 ± 8.6178.90 ± 6.7652.32 ± 7.70
2081.13 ± 2.9082.13 ± 4.8753.82 ± 6.93
3063.31 ± 4.5170.71 ± 3.7038.01 ± 6.60
4064.01 ± 5.9766.39 ± 3.7737.03 ± 5.19
Site 21069.61 ± 4.48 b78.77 ± 5.01 b59.70 ± 7.56
2087.28 ± 2.39 c80.76 ± 2.57 b60.34 ± 6.51
3060.06 ± 1.72 a72.15 ± 2.85 a,b48.57 ± 5.25
4075.22 ± 1.25 b68.66 ± 1.79 a48.54 ± 7.78
Site 31075.20 ± 1.72 b75.52 ± 1.4565.34 ± 10.05 b
2083.25 ± 1.79 c80.98 ± 4.1556.89 ± 10.09 a,b
3062.94 ± 3.68 a63.20 ± 6.8739.23 ± 3.67 a
4066.97 ± 0.46 a,b66.19 ± 2.0639.02 ± 3.74 a
Table 6. Influence of soil temperature on half-life values of substrates in topsoil and subsoil of three different agriculture sites. Values represent mean ± SEM (n = 3). Different letters indicate significant differences between temperatures (p ≤ 0.05), while no letters indicate there are no significant differences.
Glucose (h)Amino Acids (h)Trialanine (h)
Half-life (t½) of Pool a1
Topsoil Site 11033.3 ± 22.5 a,b12.9 ± 3.9 a,b9.0 ± 2.8
2071.9 ± 27.6 a5.6 ± 0.7 b8.6 ± 4.3
3011.7 ± 3.7 a,b25.0 ± 6.7 a4.0 ± 0.4
4015.9 ± 1.3 b16.3 ± 1.8 a,b3.4 ± 0.5
Topsoil Site 21035.6 ± 9.2 a9.3 ± 3.813.2 ± 5.7
2022.4 ± 2.8 a,b27.3 ± 21.710.3 ± 3.4
3015.3 ± 1.3 b11.0 ± 5.26.0 ± 2.4
4018.5 ± 7.0 a,b4.3 ± 0.42.8 ± 0.3
Topsoil Site 310611 ± 56014.1 ± 2.712.2 ± 2.9
2020.8 ± 1.011.2 ± 2.810.3 ± 6.4
3019.7 ± 1.711.3 ± 2.14.2 ± 0.8
4022.6 ± 6.09.9 ± 5.03.2 ± 0.6
Subsoil Site 11096.4 ± 41.8 a18.5 ± 6.318.24 ± 4.6
2030.6 ± 6.9 a,b27.5 ± 14.518.64 ± 8.1
3022.5 ± 9.9 b26.1 ± 11.05.95 ± 2.1
4018.3 ± 8.1 b11.4 ± 6.912.24 ± 9.6
Subsoil Site 210120 ± 20 a25.4 ± 4.526.95 ± 6.0
2022.8 ± 2.4 b17.3 ± 2.112.20 ± 5.8
3020.9 ± 1.7 b16.6 ± 6.811.88 ± 4.3
4020.6 ± 7.4 b29.1 ± 16.012.21 ± 4.9
Subsoil Site 31060.3 ± 15.2 a17.0 ± 6.911.73 ± 6.8
2024.1 ± 3.4 b9.1 ± 5.08.39 ± 2.7
3022.2 ± 7.1 b53.7 ± 38.05.0 ± 1.4
4018.4 ± 6.3 b12.8 ± 5.64.1 ± 1.3